The Effects of Hypocapnia on Brain Tissue Pulsations

 , , and
Abstract
1. Introduction
2. Materials and Methods
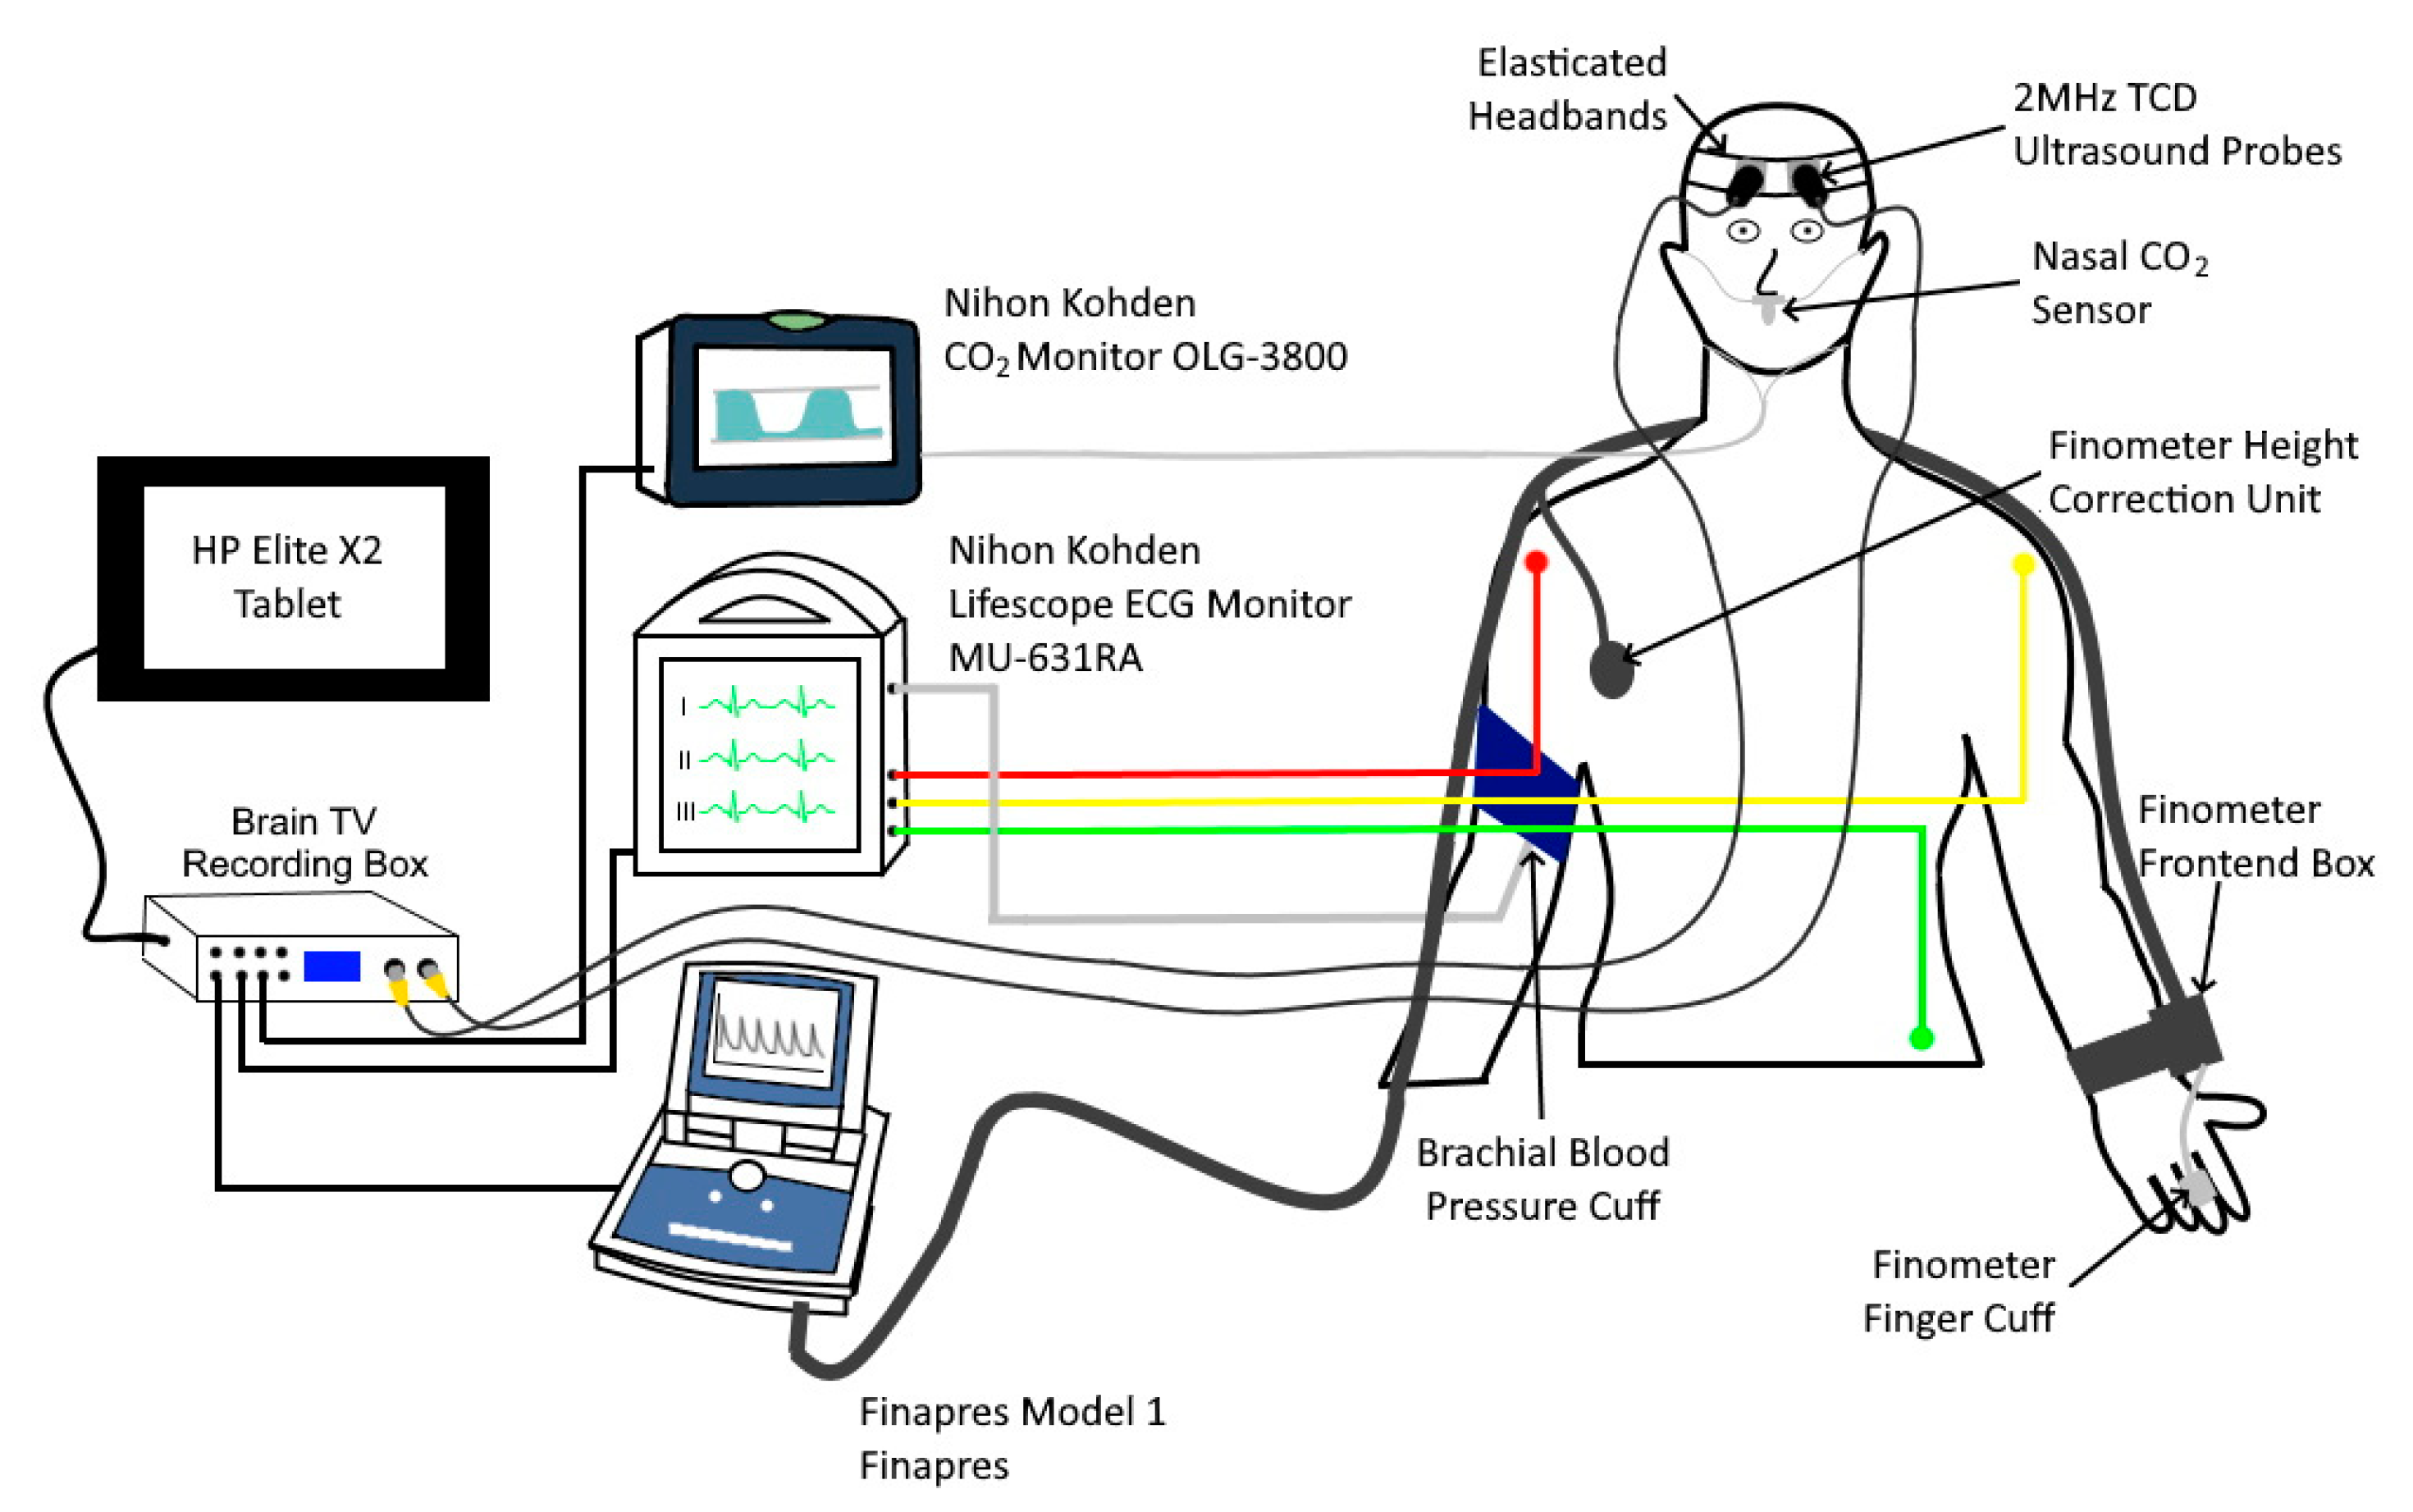
2.1. Subjects and Measurements
2.2. Experimental Protocol
2.3. Data Analysis
2.4. Statistical Analysis
3. Results
4. Discussion
4.1. Key Findings
4.2. Context with Respect to Existing Literature
4.3. Clinical Application
4.4. Limitations
5. Conclusions
Author Contributions
Funding
Acknowledgments
Conflicts of Interest
References
- Minhas, J.S.; Robinson, T.G.; Panerai, R. PaCO2 measurement in cerebral haemodynamics: Face mask or nasal cannulae? Physiol. Meas. 2017, 38, N101–N106. [Google Scholar] [CrossRef] [PubMed]
- Minhas, J.S.; Panerai, R.B.; Robinson, T.G. Modelling the cerebral haemodynamic response in the physiological range of PaCO2. Physiol. Meas. 2018, 39, 065001. [Google Scholar] [CrossRef] [PubMed]
- Minhas, J.S.; Panerai, R.B.; Swienton, D.; Robinson, T.G. Feasibility of improving cerebral autoregulation in acute intracerebral hemorrhage (BREATHE-ICH) study: Results from an experimental interventional study. Int. J. Stroke 2019, 15, 627–637. [Google Scholar] [CrossRef] [PubMed]
- Donnelly, J.; Budohoski, K.P.; Smielewski, P.; Czosnyka, M. Regulation of the cerebral circulation: Bedside assessment and clinical implications. Crit. Care 2016, 20, 129. [Google Scholar] [CrossRef] [PubMed]
- Ince, J.; Alharbi, M.; Minhas, J.S.; Chung, E.M. Ultrasound measurement of brain tissue movement in humans: A systematic review. Ultrasound 2019, 28, 70–81. [Google Scholar] [CrossRef] [PubMed]
- DeSmidt, T.; Hachemi, M.E.; Remenieras, J.-P.; LeComte, P.; Ferreira-Maldent, N.; Patat, F.; Camus, V. Ultrasound Brain Tissue Pulsatility is decreased in middle aged and elderly type 2 diabetic patients with depression. Psychiatry Res. Neuroimaging 2011, 193, 63–64. [Google Scholar] [CrossRef] [PubMed]
- Ternifi, R.; Cazals, X.; DeSmidt, T.; Andersson, F.; Camus, V.; Cottier, J.-P.; Patat, F.; Remenieras, J.-P. Ultrasound measurements of brain tissue pulsatility correlate with the volume of MRI white-matter hyperintensity. Br. J. Pharmacol. 2014, 34, 942–944. [Google Scholar] [CrossRef] [PubMed]
- Biogeau, J.; DeSmidt, T.; Dujardin, P.-A.; Ternifi, R.; Eudo, C.; Vierron, E.; Remenieras, J.-P.; Patat, F.; Camus, V.; Constans, T. Ultrasound Tissue Pulsatility Imaging Suggests Impairment in Global Brain Pulsatility and Small Vessels in Elderly Patients with Orthostatic Hypotension. J. Stroke Cerebrovasc. Dis. 2017, 26, 246–251. [Google Scholar] [CrossRef] [PubMed]
- DeSmidt, T.; Brizard, B.; Dujardin, P.-A.; Ternifi, R.; Réméniéras, J.-P.; Patat, F.; Andersson, F.; Cottier, J.-P.; Vierron, E.; Gissot, V.; et al. Brain Tissue Pulsatility is Increased in Midlife Depression: A Comparative Study Using Ultrasound Tissue Pulsatility Imaging. Neuropsychopharmacol 2017, 42, 2575–2582. [Google Scholar] [CrossRef] [PubMed]
- Kucewicz, J.C.; Dunmire, B.; Giardino, N.D.; Leotta, D.F.; Paun, M.; Dager, S.R.; Beach, K.W. Tissue Pulsatility Imaging of Cerebral Vasoreactivity During Hyperventilation. Ultrasound Med. Biol. 2008, 34, 1200–1208. [Google Scholar] [CrossRef]
- Kucewicz, J.C.; Dunmire, B.; Leotta, D.F.; Panagiotides, H.; Paun, M.; Beach, K.W. Functional Tissue Pulsatility Imaging of the Brain During Visual Stimulation. Ultrasound Med. Biol. 2007, 33, 681–690. [Google Scholar] [CrossRef]
- Minhas, J.S.; Rook, W.; Panerai, R.B.; Hoiland, R.L.; Ainslie, P.N.; Thompson, J.P.; Mistri, A.K.; Robinson, T.G. Pathophysiological and clinical considerations in the perioperative care of patients with a previous ischaemic stroke: A multidisciplinary narrative review. Br. J. Anaesth. 2020, 124, 183–196. [Google Scholar] [CrossRef] [PubMed]
- Hoeks, A.P.; Brands, P.J.; Arts, T.G.; Reneman, R.S. Subsample volume processing of Doppler ultrasound signals. Ultrasound Med. Biol. 1994, 20, 953–965. [Google Scholar] [CrossRef]
- Mirro, R.; Lowery-Smith, L.; Armstead, W.M.; Shibata, M.; Zuckerman, S.L.; Leffler, C.W. Cerebral vasoconstriction in response to hypocapnia is maintained after ischemia/reperfusion injury in newborn pigs. Stroke 1992, 23, 1613–1616. [Google Scholar] [CrossRef]
- Turner, P.; Banahan, C.; Alharbi, M.; Ince, J.; Venturini, S.; Berger, S.; Bnini, I.; Campbell, J.; Beach, K.W.; Horsfield, M.; et al. Brain tissue pulsations in healthy volunteers. Ultrasound Med. Biol. (Article in press).
- Burnum, J.F.; Hickam, J.B.; McIntosh, H.D. The Effect of Hypocapnia on Arterial Blood Pressure. Circulation 1954, 9, 89–95. [Google Scholar] [CrossRef]
- Novak, V.; Spies, J.M.; Novak, P.; McPhee, B.R.; Rummans, T.A.; Low, P.A. Hypocapnia and cerebral hypoperfusion in orthostatic intolerance. Stroke 1998, 29, 1876–1881. [Google Scholar] [CrossRef]
- Avezaat, C.J.; Van Eijndhoven, J.H.; Wyper, D.J. Effects of hypercapnia and arterial hypotension and hypertension on cerebrospinal fluid pulse pressure and intracranial volume-pressure relationships. J. Neurol. Neurosurg. Psychiatry 1980, 43, 222–234. [Google Scholar] [CrossRef] [PubMed]
- Salinet, A.S.; Minhas, J.S.; Panerai, R.B.; Bor-Seng-Shu, E.; Robinson, T.G. Do acute stroke patients develop hypocapnia? A systematic review and meta-analysis. J. Neurol. Sci. 2019, 402, 30–39. [Google Scholar] [CrossRef] [PubMed]
- Minhas, J.S.; Haunton, V.J.; Robinson, T.G.; Panerai, R.B. Determining differences between critical closing pressure and resistance-area product: Responses of the healthy young and old to hypocapnia. Pflügers Archiv Eur. J. Physiol. 2019, 471, 1117–1126. [Google Scholar] [CrossRef] [PubMed]


| Baseline | Hyperventilation | Recovery | |
|---|---|---|---|
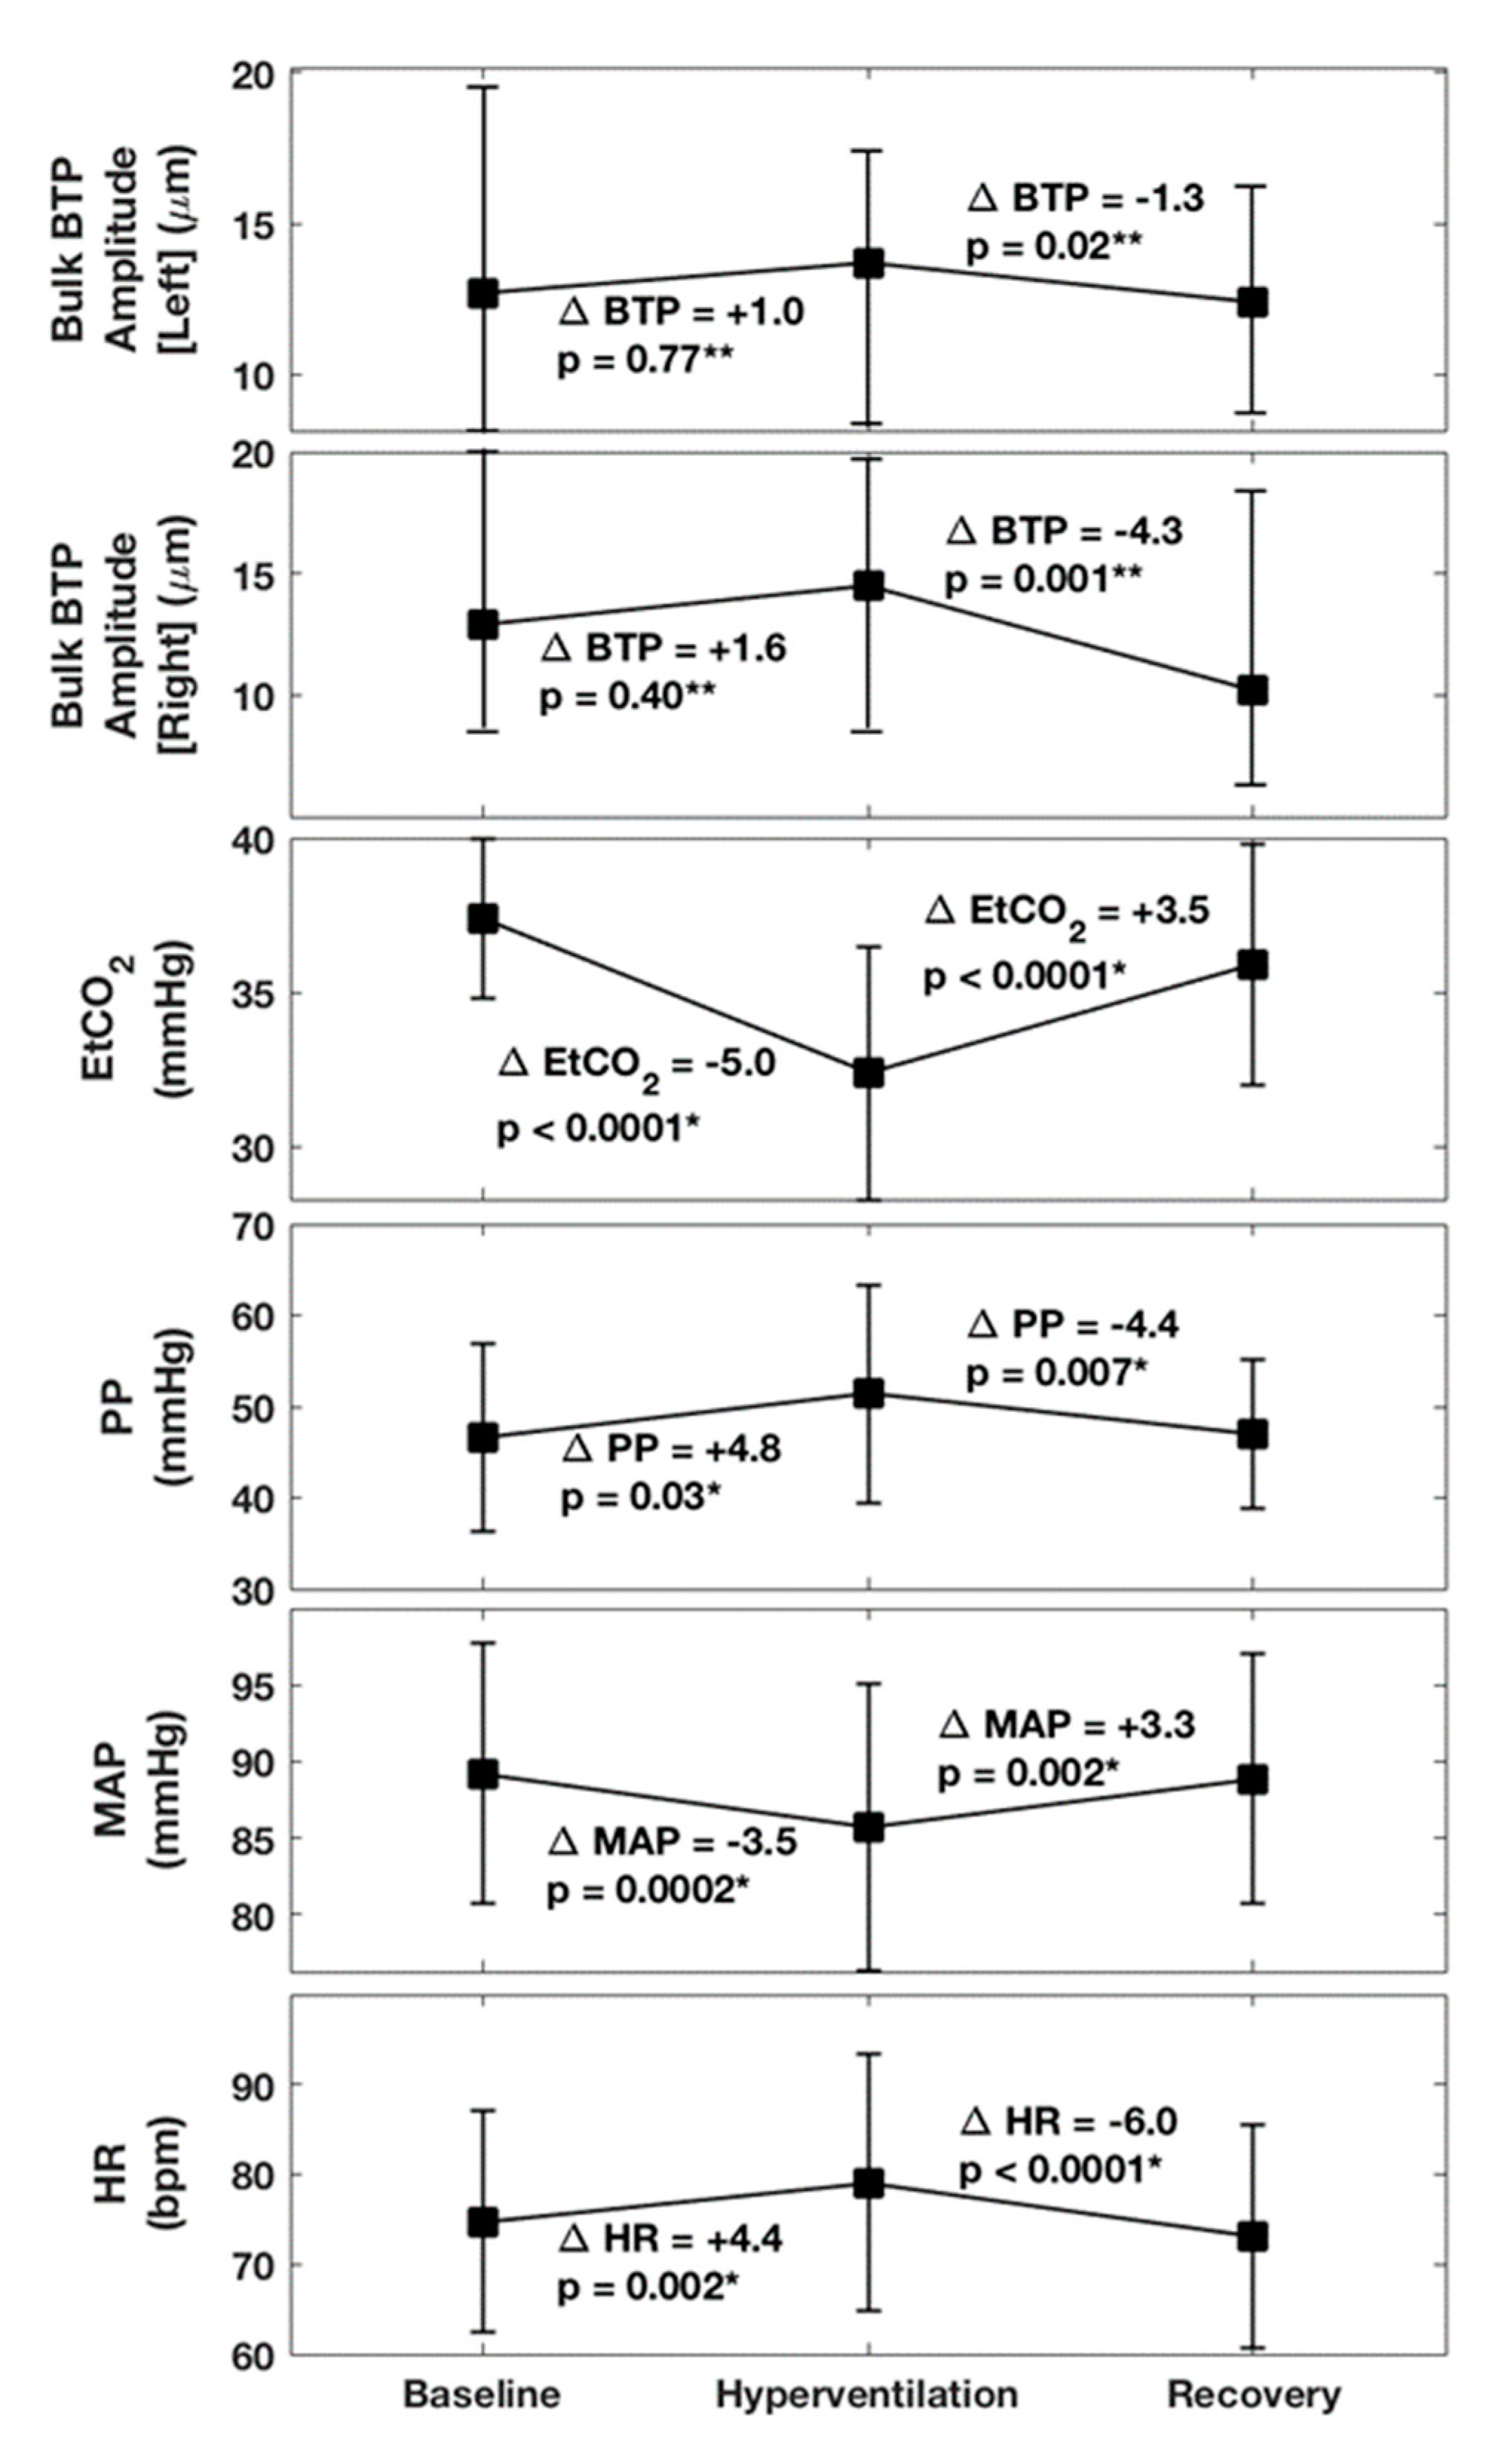
| EtCO2 mean (SD), mmHg | 37.4 (2.6) | 32.4 (4.1) | 35.9 (3.9) |
| Left Bulk BTP Amplitude median (IQR), µm | 12.7 (8.0, 19.4) | 13.7 (8.4, 17.3) | 12.4 (8.7, 15.9) |
| Right Bulk BTP Amplitude median (IQR), µm | 12.9 (8.6, 20.0) | 14.5 (8.5, 19.5) | 10.2 (6.6, 18.2) |
| PP mean (SD), mmHg | 46.6 (10.2) | 51.4 (11.9) | 47.0 (8.1) |
| MAP mean (SD), mmHg | 89.2 (8.5) | 85.7 (9.4) | 88.9 (8.2) |
| HR mean (SD), bpm | 74.7 (12.3) | 79.1 (14.3) | 73.1 (12.4) |
© 2020 by the authors. Licensee MDPI, Basel, Switzerland. This article is an open access article distributed under the terms and conditions of the Creative Commons Attribution (CC BY) license (http://creativecommons.org/licenses/by/4.0/).
Share and Cite
Alharbi, M.; Turner, P.; Ince, J.; Oura, M.; Ebirim, K.U.; Almudayni, A.; Lecchini-Visintini, A.; Minhas, J.S.; Chung, E.M.L. The Effects of Hypocapnia on Brain Tissue Pulsations. Brain Sci. 2020, 10, 614. https://doi.org/10.3390/brainsci10090614
Alharbi M, Turner P, Ince J, Oura M, Ebirim KU, Almudayni A, Lecchini-Visintini A, Minhas JS, Chung EML. The Effects of Hypocapnia on Brain Tissue Pulsations. Brain Sciences. 2020; 10(9):614. https://doi.org/10.3390/brainsci10090614
Chicago/Turabian StyleAlharbi, Meshal, Poppy Turner, Jonathan Ince, Mitsuhiro Oura, Kelechi U. Ebirim, Alanoud Almudayni, Andrea Lecchini-Visintini, Jatinder S. Minhas, and Emma M.L. Chung. 2020. "The Effects of Hypocapnia on Brain Tissue Pulsations" Brain Sciences 10, no. 9: 614. https://doi.org/10.3390/brainsci10090614
APA StyleAlharbi, M., Turner, P., Ince, J., Oura, M., Ebirim, K. U., Almudayni, A., Lecchini-Visintini, A., Minhas, J. S., & Chung, E. M. L. (2020). The Effects of Hypocapnia on Brain Tissue Pulsations. Brain Sciences, 10(9), 614. https://doi.org/10.3390/brainsci10090614