1. Introduction
Acute amnesic disorders are a common cause of admission to the emergency room and, among these, Transient Global Amnesia (TGA) accounts for the vast majority of cases [
1].
However, a relevant group of patients with acute amnesia suffers instead from epilepsy with recurrent episodes and preserved consciousness [
2]. This condition has been better defined and characterized as a syndrome named Transient Epileptic Amnesia (TEA) [
3,
4,
5,
6].
TEA is an insidious mimic of TGA. Missing the diagnosis means that seizures are likely to recur, leading to multiple emergency room visits and a linked social and economic burden [
7].
In our previous paper, we retrospectively studied a population of 83 patients classified as TGA in the emergency room. After a complete diagnostic work-up, comprising standard EEG, 24 h EEG monitoring (24 h EEG) and 1.5 Tesla MRI, a consistent group (15/83) of these patients resulted to suffer from TEA [
8], according to the most recent diagnostic criteria [
4]. In a majority of TEA cases there was a delay of up to several months in the diagnosis, as no epileptiform activity was recognizable in the initial EEG. We concluded that TEA is challenging to diagnose, both from a clinical and neurophysiological perspective, and that standard EEG is often not conclusive.
Power Spectral Analysis (PSA) could aid in raising the neurophysiological suspect of an epileptic syndrome by showing alterations that can be missed with visual assessment [
9]. These alterations usually involve quantitative oscillatory activity [
9], which has a paramount role in many neurologic diseases [
10].
In many epileptic conditions, previous papers have reported spectral alterations in the Affected Hemisphere (AH) of subjects suffering from temporal lobe epilepsy [
11,
12]. Meanwhile, TGA patients usually present a normal EEG. According to a recent study, only a small sub-group (about 26%) might show some non-specific acute abnormalities such as bilateral slowing [
13]. Other studies on EEG spectral analysis in TGA patients found a diffuse symmetric decrease of beta and theta activity during the acute phase [
14]. Meanwhile, there are no quantitative EEG (qEEG) studies describing spectral activity in patients with Transient Epileptic Amnesia.
The aim of the present study was to evidence the qEEG features of the interictal EEG of TEA and TGA patients, looking for spectral findings that differentiate the two conditions.
To achieve this goal, we used PSA empowered by exact low-resolution brain electromagnetic tomography (eLORETA) of standard clinical EEGs [
15] to study spectral features of the EEG of patients with TEA compared to those with TGA. The use of source reconstruction techniques allowed us to project spectral activity on a brain template, allowing us to reach a deeper functional interpretation.
2. Materials and Methods
2.1. Study Population
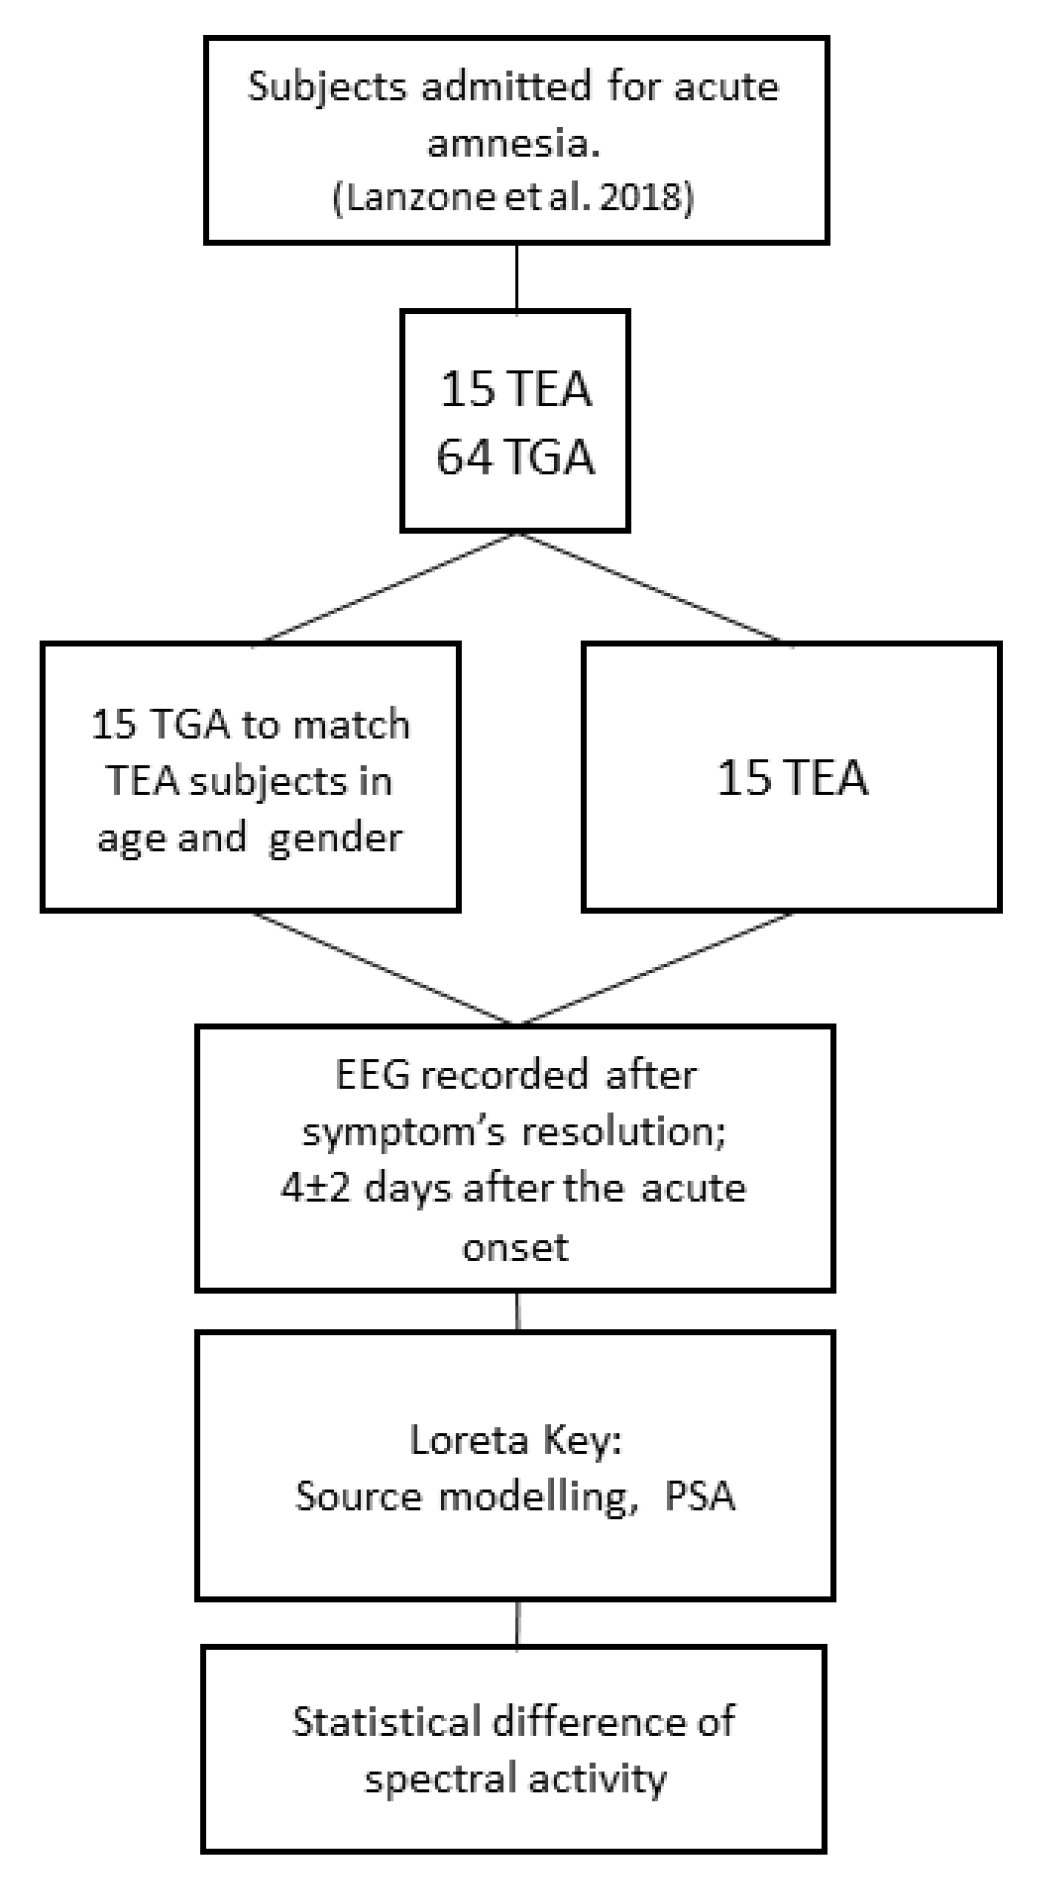
We retrospectively identified 15 patients with TEA (mean age 67.2 ± 5.2 years; females/males: 11/4; 10 left and 5 right temporal epileptic focus) and 15 control patients affected by TGA, matched for age and gender, (mean age 65.8 ± 7.2 years, females/males: 11/4).
Figure 1 depicts the flow chart of the study. Clinical features of patients with TEA were described in Lanzone et al. 2018, patients with TGA were randomly chosen among 68 patients from the previous study to be matched for age and sex and to meet the EEG criteria.
In both groups, EEG was recorded after the complete resolution of symptoms (on average 4 ± 2 days after the acute onset); all subjects were asymptomatic and fully recovered the anterograde and retrograde amnesia at the time of the EEG recording. Demographic data and instrumental findings from the two groups are reported in
Table 1. More information on the TEA group is reported in
Supplementary Table S1.
Inclusion criteria for the study were: (i) definite diagnosis of Transient Epileptic Amnesia/TGA (as defined respectively by Zeman et al. 1998 or Hodges and Warlow 1990); and (ii) EEG recorded during interictal period after the off-set of clinical symptoms (patient oriented in time and space and not symptomatic for amnesia, confusion or other neurological deficits).
Exclusion criteria were: (i) no focal lateralizing features at EEG or 24 h EEG (for the TEA group), impossibility to recognize the AH; (ii) other previous neurological diseases known to alter EEG rhythms (stroke, dementia, etc.) for both TEA and TGA groups; (iii) the absence of at least 180 sec of clean continuous eyes-closed EEG recording (for both groups); (iv) therapy with antiepileptic drugs (AEDs) or with drugs known to alter EEG (i.e., antidepressants, benzodiazepines); (v) all TEA patients had to be Drug Naïve at the moment of the EEG.
Elimination criteria: (i) constant artefactual EEG activity that could not be removed by preprocessing; (ii) more than one bad EEG channel (artefactual or high impedance).
Diagnosis of TEA was made according to the work from Zeman et al. 1998 [
3], when the following criteria were fulfilled: (1) recurrent witnessed episodes of transient amnesia; (2) cognitive functions other than memory judged to be intact during typical episodes by a reliable witness; and (3) evidence for a diagnosis of epilepsy on the basis of one or more defined characteristics (3a: epileptiform abnormalities on electroencephalography; 3b: concurrent onset of other clinical features of epilepsy such as lip-smacking or olfactory hallucinations; 3c: clear cut response to anticonvulsant therapy).
In detail, all patients with TEA fulfilled criteria 1 and 2 and at least two of the supportive criteria as specified at point 3 of the Zeman’s criteria: 10 out of 15 patients had all 3 criteria (3a, 3b, 3c), 2 out of 15 had only criteria 3a and 3b (their outcome was not known as they were lost at follow-up) and 3 out of 15 patients had only 3a and 3c (no clear epileptic semiology was evident at history collection).
All patients underwent standard EEG, 24 h EEG and 1.5 Tesla MRI; MRI findings were noted and classified by a radiologist: patients were reported as having an altered MRI (such as gliosis or venous malformations; minor gliosis compatible with the age of the subjects was not considered as an alteration), DWI hippocampal alterations, typical finding in TGA [
16], or no abnormal findings.
2.2. EEG Recordings
All patients underwent 19 channels EEG recording with standard 10–20 montage [
17]; recordings were performed during quiet wake with eyes closed. Signal was recorded with a 32 channel Micromed device (SystemPlus software; Micromed, Mogliano Veneto, Italy). Impedance was kept below 5 KΩ. Reference electrode placed on the right mastoid bone, sampling rate was 256 Hz; A/D conversion was made at 16 bit; pre-amplifiers amplitude range was ±3200 µV [
18]. The following hardware filters were used: high frequency filters (HFF) = 0.2 Hz. Signal was reviewed for referral by a neurologist experienced in epilepsy and EEG (M.T.). In patients with TEA lateralization was defined according to focal interictal epileptiform activity, amnestic history and clinical features. Qualitative visual evaluation of the EEG recordings showed no relevant evidence of sleepiness both in the TEA and the TGA group.
2.3. EEG Pipeline Analysis
EEG raw signal, 19 channels with mastoid reference, were imported in Matlab 2018 (Mathworks, Inc., USA). EEG signal was processed through EEGlab’s GUI for Matlab (Swartz Center for Computational Neuroscience, USA) [
19] using the following pipeline.
(1) We selected 180 s continuous epochs of closed-eyed EEG for each subject and visually rejected macroscopic artefacts obtaining tracks of average 158 ± 13 s. Notch (50Hz), low-pass (70 Hz) and high-pass (0.5 Hz) EEG lab FIR (Finite Impulse Response) filters were applied to the EEG signal. (2) Interictal epileptiform abnormalities previously marked for removal by an experienced epileptologist (M.T.) were removed from quantitative EEG analysis; thus, a total of 13 suspected/epileptic discharges were rejected. (3) We performed an Independent Component Analysis (ICA) on the EEG using RUNICA script from Matlab (EEGLAB) [
19] in order to remove blink and eye movement components (4). In the TEA group we transposed EEG matrix information of the 5 patients with right temporal epileptic focus so that all affected hemispheres (AH) resulted to be on the left. Hence in TEA group, the AH is on the left and the UH is on the right. (6) Data were exported for eLORETA Key 2019 [
15,
20,
21,
22] using a Matlab native script.
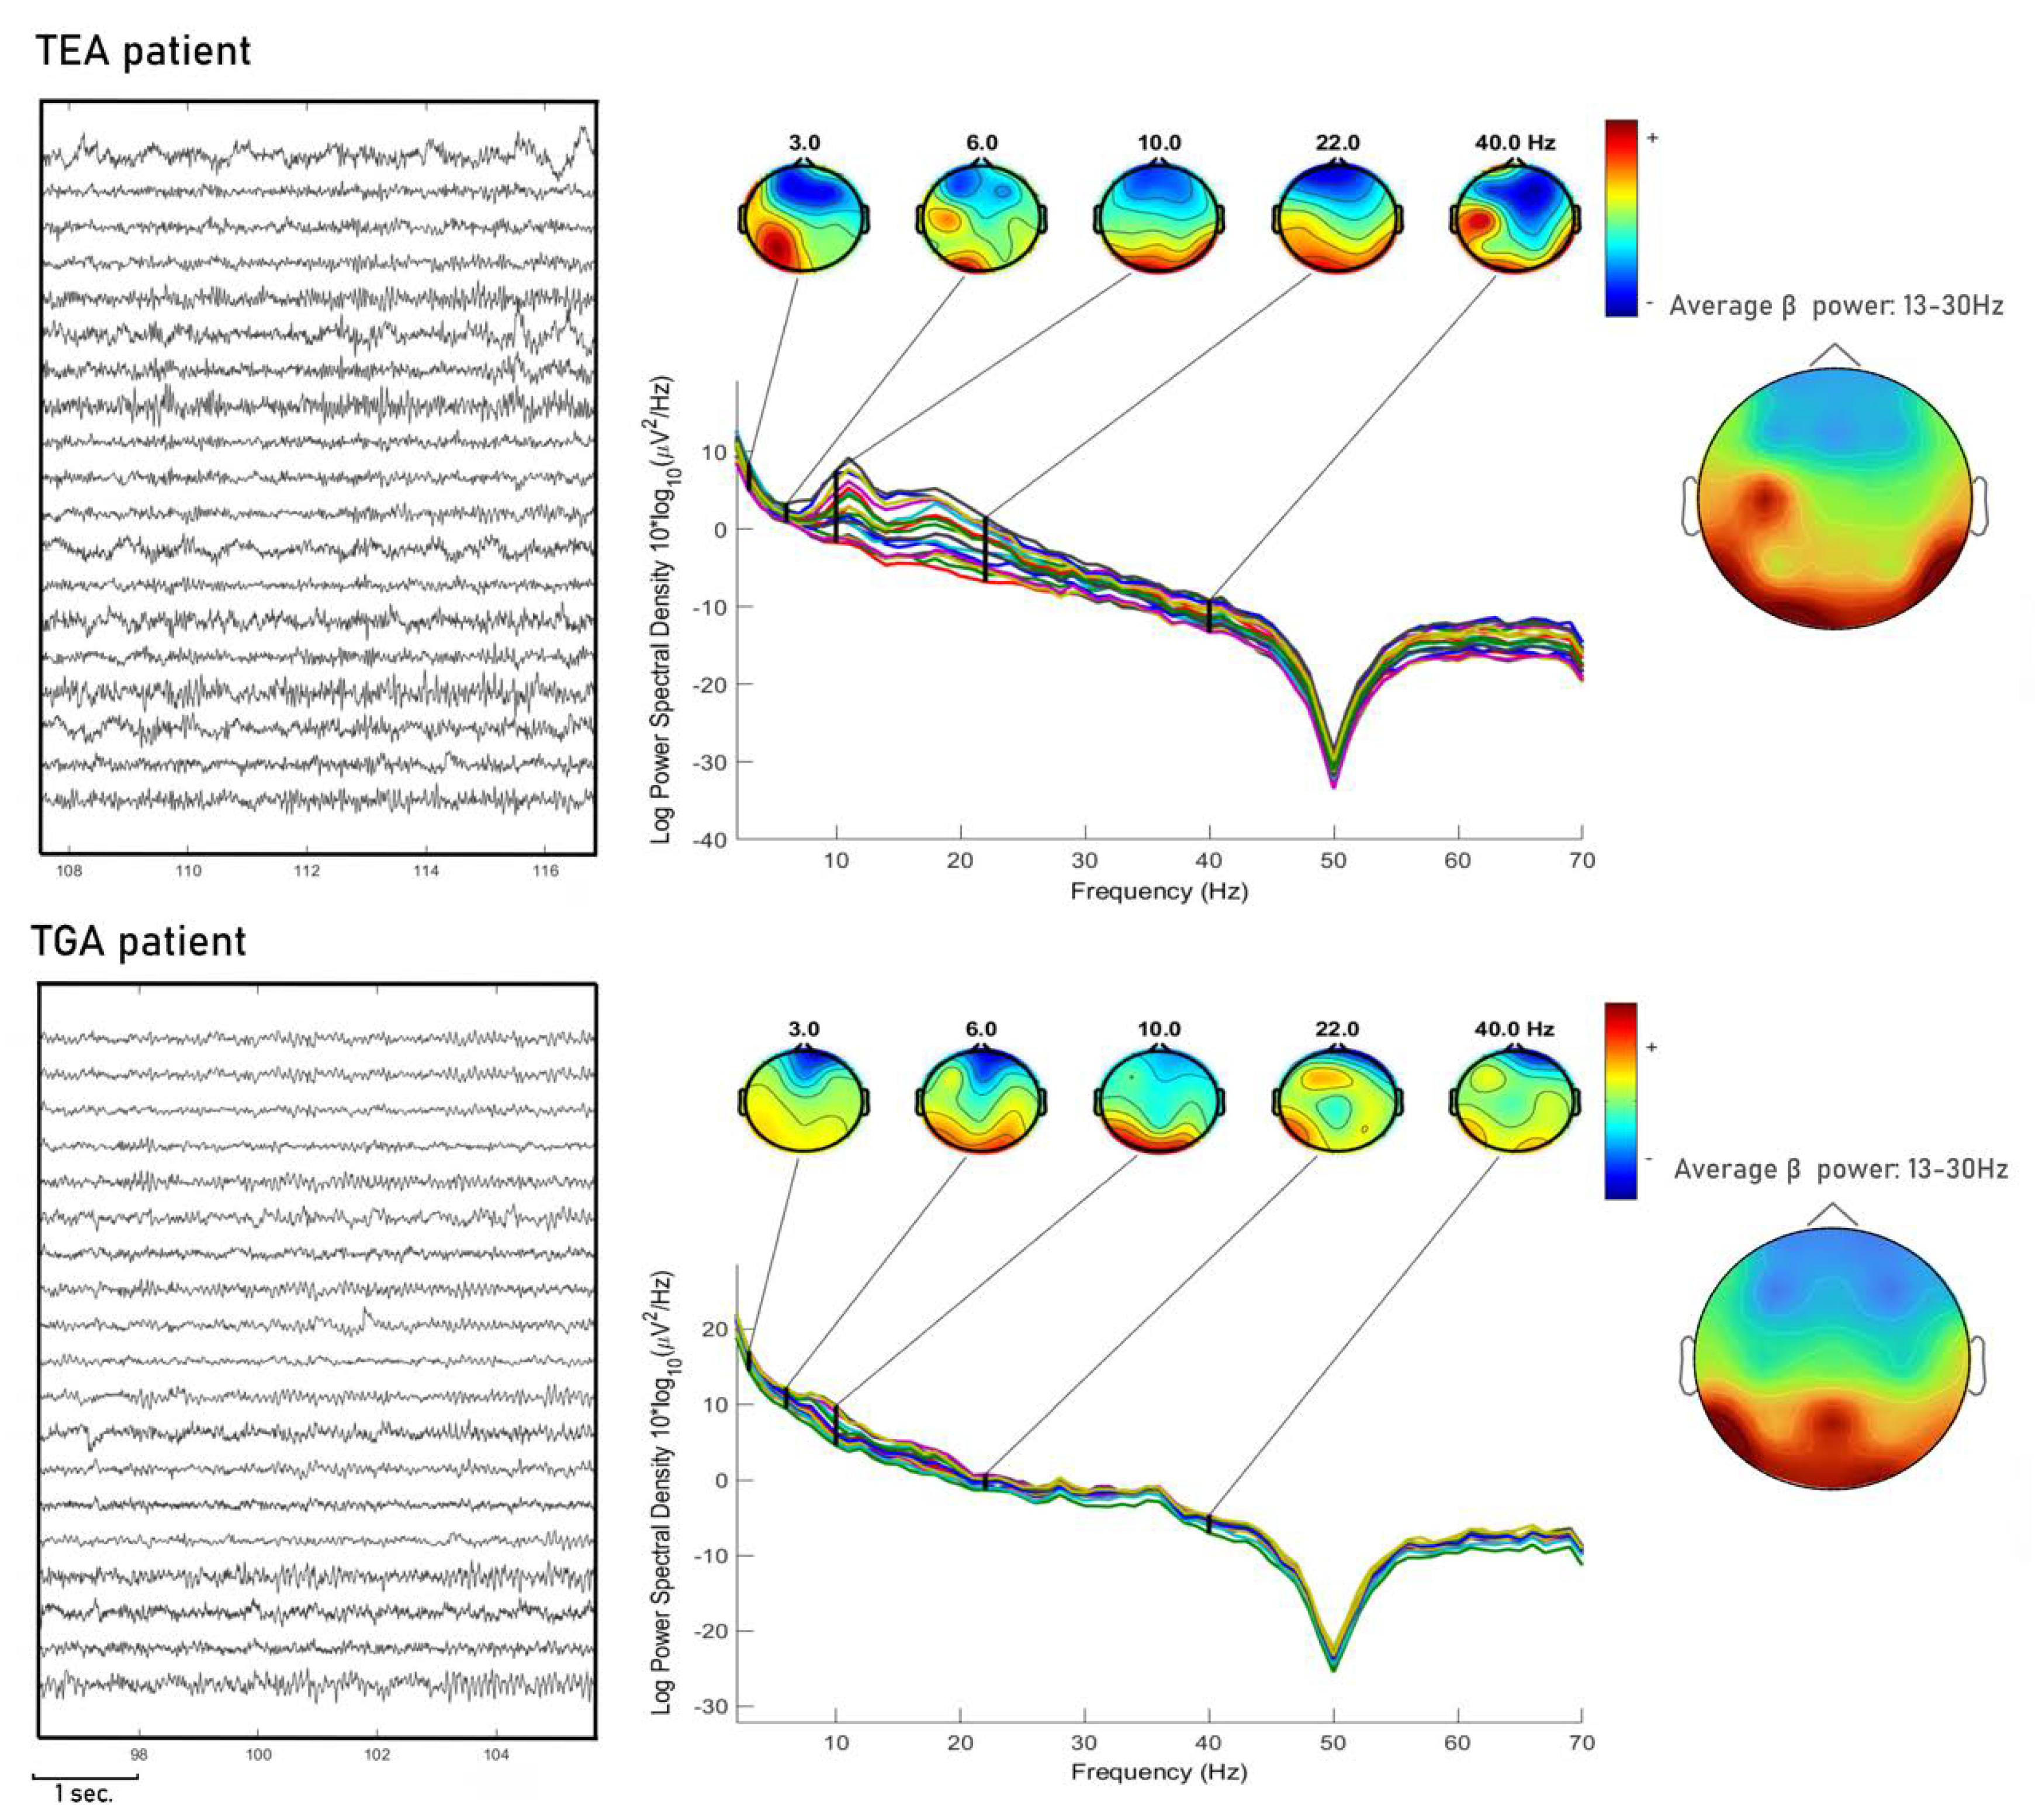
In
Figure 2 we show an example of EEG PSA.
In eLORETA, power spectral analysis was performed using Fast Fourier Transform algorithm, with a 2 s interval on the EEG signal. Spectral power was calculated for the following power bands in all scalp locations: delta (0.5–4 Hz), theta (4.5–7.5), alpha (8–12.5 Hz), beta (13–30 Hz) and gamma (30.5–60 HZ).
Topographic sources of EEG activities were determined using the LORETA algorithm. The computational task is to select the smoothest 3-dimensional current distribution [
23,
24], providing a true 3-dimensional tomography, in which the localization of brain signals is conserved with a low amount of dispersion [
15].
The current eLORETA implementation uses a three-shell spherical head model registered to a standardized stereotactic space available as a digitized MRI from the Brain Imaging Centre Montreal Neurological Institute (MNI). EEG electrode coordinates are achieved using cross-registrations between spherical and realistic head geometry. In the current implementation, a spatial resolution of 7 mm is used, producing a total of 6239 voxels. eLORETA software manages to reconstruct low resolution electric tomography using EEG data finding a constrained solution to the EEG inverse problem [
20,
25].
The main advantage of using a technique of source imaging such as LORETA is that it allows to reconstruct the activity from the 19 channels on an ideal brain surface, thus giving the chance to observe spectral activity from a more physiologic and functional point of view. Rather than estimating the power of the activity of each single electrode, we can project the activity on the brain surface and localize it to the respective Brodmann Areas (BAs).
We chose to use eLORETA since it is a thoroughly validated method for source localization (Pascual-Marqui et al. 2011), and has implemented non-parametric statistic to compare PSA, with in-built correction for multiple comparisons [
26]. We used a 3-shell reconstruction model since it is more robust to segmentation and forward modelling errors as compared to Boundary Element Method in cases, as ours, where MRI volumetric images for each patient are not available [
27]. We recognize that using source localization with 19 channels is not as accurate as when it is used with high definition EEG, nevertheless it was shown that even 19 channel montages allow good projection or scalp activity on a brain model and this method has already been validated [
28,
29,
30,
31].
2.4. Data Availability
RAW unprocessed data supporting the findings of this study are available from the corresponding author, upon reasonable request.
2.5. Statistics Analysis
Comparisons between clinical features of the two groups were made with Chi-squared test.
Comparisons in PSA (TEA versus TGA) were performed on log transformed data using the nonparametric statistical mapping methodology supplied by the eLORETA software [
26]. This methodology is based on Fisher’s permutation test. LORETA’s inbuilt nonparametric randomization procedure was performed to take into account multiple comparisons. Significance thresholds were set by the software implemented in eLORETA.
T-level thresholds corresponding to statistically significant
p values (
p < 0.05) were calculated [
32].
Correction of multiple comparisons was performed using the statistical nonparametric mapping (SnPM) methodology [
26] included in the eLORETA program package (for more details see [
33,
34]). Briefly, this procedure computes 5000 data randomizations to determine the critical probability threshold of T-values [
26] corresponding to a statistically corrected (i.e., after the multiple comparisons among all voxels in each frequencies)
p values. Alpha was set to
p = 0.05 [
35]. We sorted voxel values according to the threshold computed by eLORETA (T = ±4.12) and corresponding to
p = 0.05.
Furthermore, the eLORETA software provides effect size thresholds for t-statistics corresponding to Cohenʹs d values (Cohen, 1988): small = 0.2, medium = 0.5, large = 0.8. The effect sizes for the T-threshold were T = 1.058, T= 2.646, and T= 4.233, corresponding, respectively, to small, medium, and large effect sizes.
RAW voxel values from significant MNI coordinates were extrapolated manually and saved for further analysis, these data were confronted using U Mann–Whitney test.
Since five TEA subjects presented a right temporal lobe epileptic focus, for the purpose of eLORETA analysis, we transposed their EEG matrix, thus assuming equivalence of comparisons in PSA between TEA AH (5 right and 10 left hemispheres) and TGA (all left hemisphere). We also tested spectral differences in MNI coordinates that resulted in being significant after randomizing (
www.random.org) hemispheres of the TGA condition and testing them against AH and UH from TEA, this was done to avoid the confounder of testing all affected TEA hemispheres with only left TGA hemispheres.
3. Results
3.1. Clinical Features
Clinical features of both populations are described in
Table 1. TEA and TGA showed, as expected, significant differences in: presence of interictal epileptiform abnormalities on the standard EEG (TEA 8/15, TGA 1/15; Chi-squared test,
p = 0.005); interictal epileptiform abnormalities on wake 24 h EEG (TEA 10/15, TGA 1/15; Chi-squared test,
p = 0.001); and interictal epileptiform abnormalities on sleep 24 h EEG (TEA 15/15, TGA 0/15; Chi-squared test,
p = 0.001).
Other clinical features did not evidence significant differences: history of migraine (TEA 1/15, TGA 0/15; Chi-squared test > 0.05); obstructive sleep apnea syndrome (TEA 2/15, TGA 0/15; Chi-squared test > 0.05); patent foramen ovale (TEA 0/15, TGA 1/15; Chi-squared test > 0.05). No seizures were recorded during the experiments.
MRI findings showed no difference in frequency of MRI DWI hippocampal alterations (TEA 0/15, TGA 0/15; Chi-squared test, p= 0.309), and in MRI abnormal findings in the TEA group (TEA 5/15, TGA 1/15; Chi-squared test, p =0.068).
3.2. Power Spectral Differences
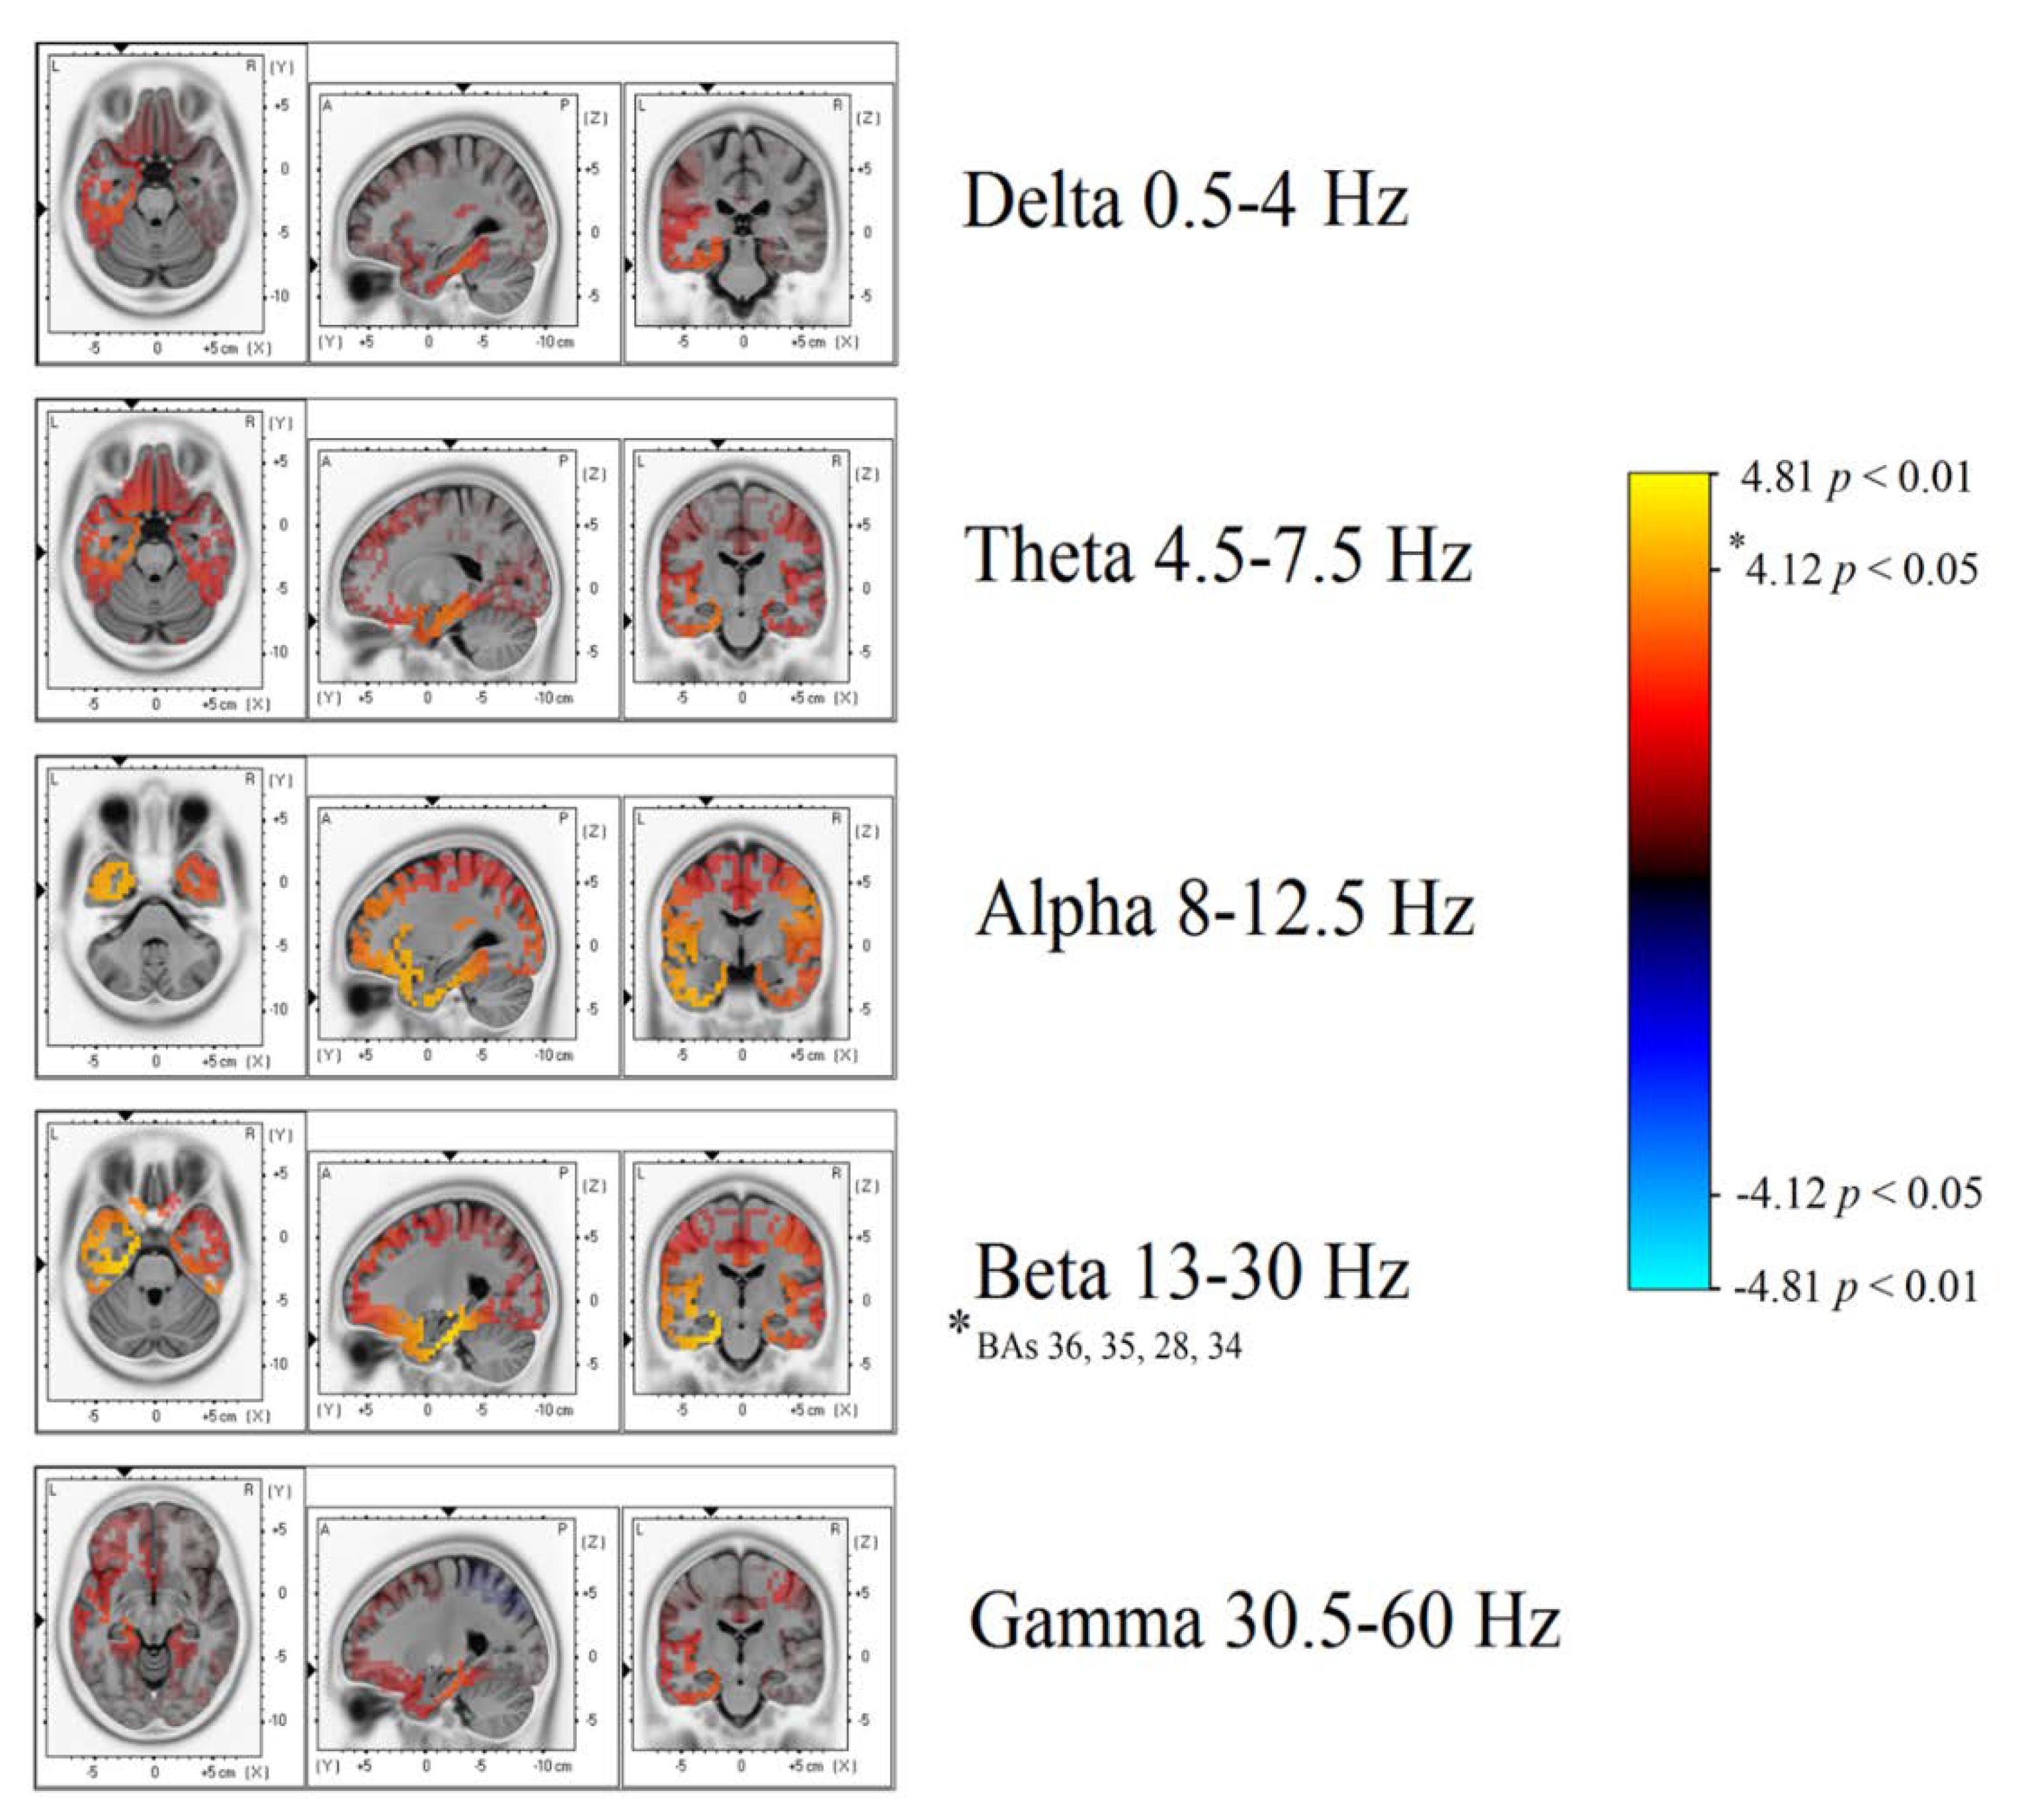
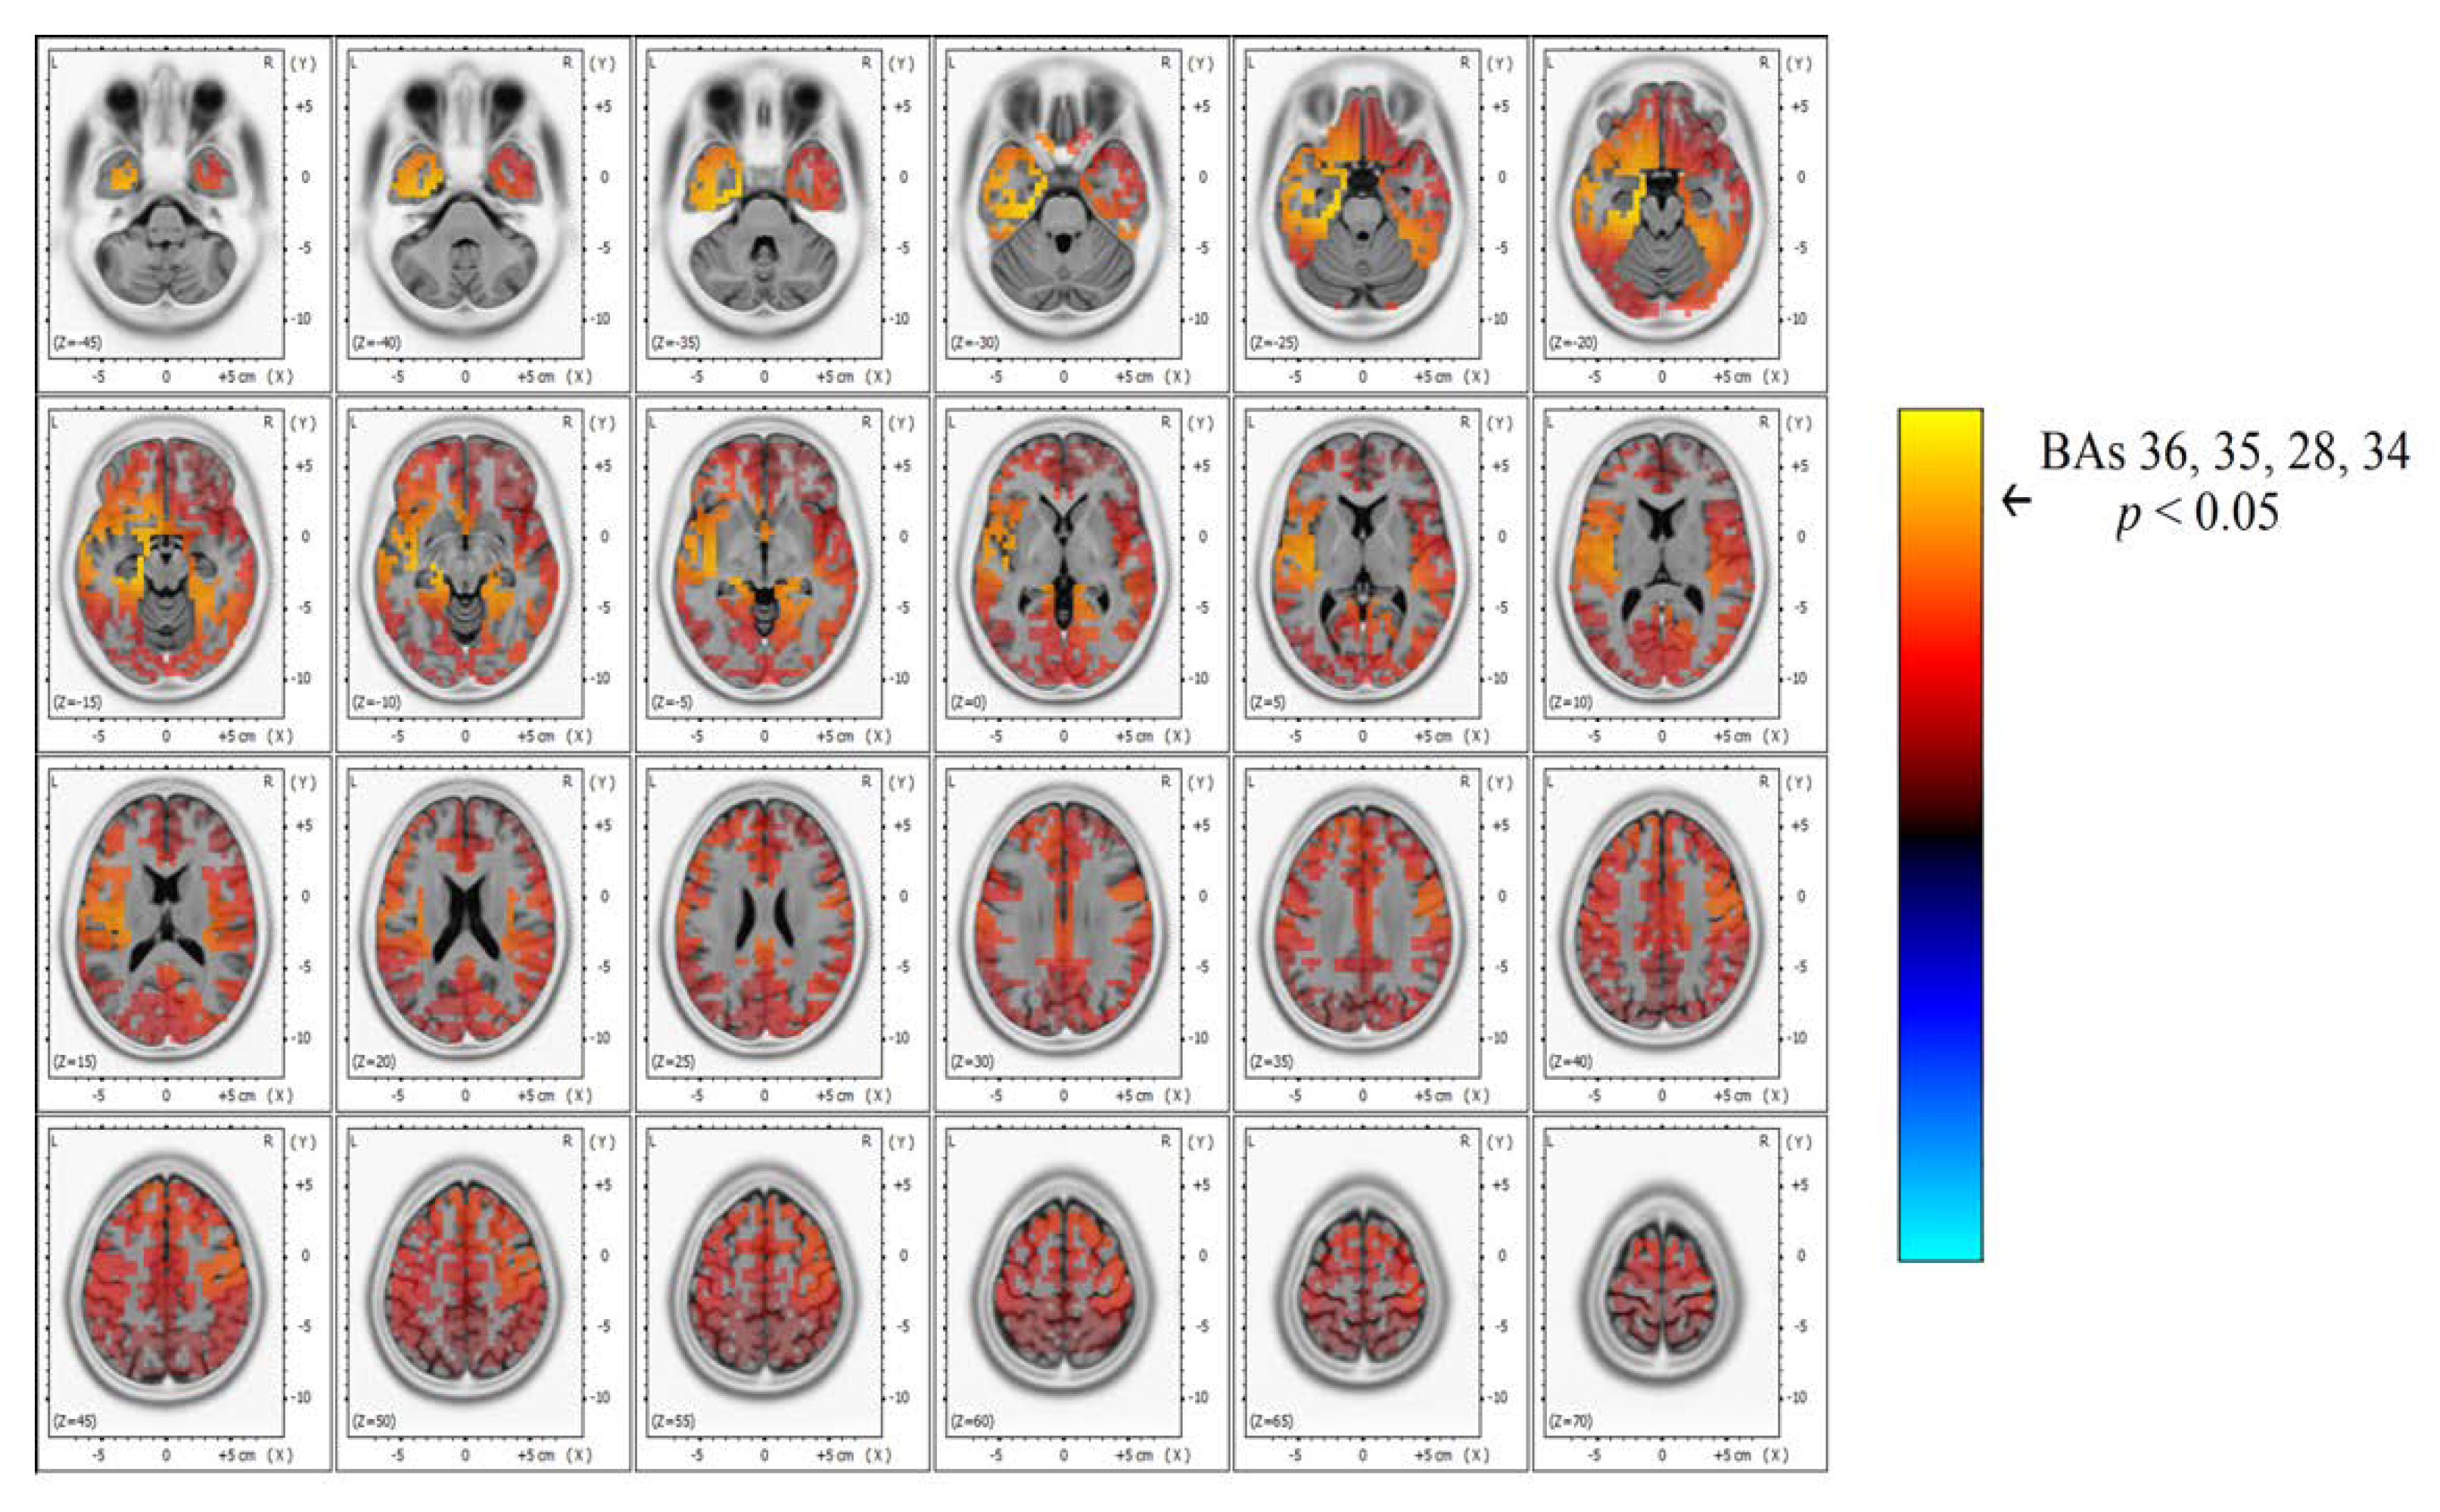
Significant differences in beta band power were found, showing increased power in the AH of patients with TEA when compared to the TGA group (
Figure 3 and
Figure 4). Using the inverse problem solution empowered by eLORETA allowed us to localize this power difference to the para-hippocampal gyrus (Brodmann’s Area, BAs 36-35-28-34,
p < 0.05) and the uncus (BA 28,
p < 0.05) (
Table 2). Significant differences in beta power comparing TEA and TGA, showing increased Beta power in the AH of TEA patients, were found in the following regions of interest: AH, Parahippocampal gyrus (l); BA 36, T = 4.20;
p = 0.042; AH, Parahippocampal gyrus (l); BA 35, T = 4.20;
p = 0.042; AH, Parahippocampal gyrus (l); BA 28, T = 4.18;
p = 0.044;AH, Uncus (l); BA 28, T = 4.14;
p = 0.047; AH, Parahippocampal gyrus (l); BA 34, T = 4.12
p = 0.049.
No significant difference in beta power was found in the unaffected hemisphere (UH).
No significant differences were observed in the other frequency bands: Theta, Alpha, and Delta.
A statistical trend towards increased power was observed in the alpha frequency band in the left AH, uncus (BAs 20-28,
p = 0.08). AH, uncus (l); BA 20, T = 3.83;
p = 0.080; AH, Uncus (l); BA 28, T = 3.83,
p = 0.080. Detailed eLORETA statistics are reported in
Table 2.
U Mann–Whitney test confirmed significant differences (p < 0.05) in all MNI coordinates when confronting AH with randomized TGA hemispheres (random 5 right hemispheres and 10 left) showing an increase in beta power in the AH of TEA patients: BA 28 (U= 4.4, p = 0.035), BA 35 (U = 5.06, p = 0.03), BA 36 (U = 5.4, p = 0.028), BA 34 (U = 4.18, p = 0.044).
4. Discussion
Our study shows, for the first time, interictal spectral differences when comparing the EEG of TEA and TGA subjects. PSA statistical difference map evidenced an asymmetric increase in Beta band power over the AH of patients with TEA. Through a LORETA inverse problem solution, we were able to localize spectral changes (
Figure 3 and
Figure 4) to the temporal lobe of the AH, more precisely to the uncus and parahippocampal gyrus (
Table 2 for specific BAs).
We found strong evidence of altered oscillatory activity in areas located in the mesial temporal lobe of the AH and involved in functions such as episodic memory and recall [
36]. Although the accuracy of source reconstruction with 19 electrode caps is lower compared to more dense EEG caps [
37], we believe that the neurophysiological alterations we found could relate to memory impairment in epilepsy [
38,
39] and in particular in TEA [
3,
4,
5].
We can infer that these differences are generated by background activity and not by ictal/interictal activity, since epileptic discharges were manually removed from the EEGs of TEA patients. The EEGs of TGA patients were assumed to be comparable to that of healthy subjects since symptoms were fully regressed at the time of recording [
40], and no particular findings were reported in the EEG’s referral.
Our results, thus, suggest that this alteration in beta oscillatory activity could depend on brain dysrhythmic activity related to the chronic epileptic condition of TEA subjects.
The present study is the first to demonstrate spectral differences when comparing interictal EEG from patients with TEA and TGA, two conditions that are usually hard to tell apart [
8].
4.1. Neurophysiological Role of Beta Power Increase in Transient Epileptic Amnesia
Literature on EEG spectral features in epilepsy usually report an increase in the delta and theta band over the AH [
12]. In our study we did not find significant alterations in low-frequency bands. We hypothesize that low-frequency spectral alterations are caused by the slow wave component of interictal epileptic activity, that, in our case, was manually removed [
41,
42]. Meanwhile there are no reports in the literature that link an increase in alpha/beta activity to epileptic interictal activity.
Hence, we propose that alteration in the beta band over the AH of TEA subjects may be related to background, non-paroxysmal, temporal lobe disfunction. These findings are likely a sign of temporal dysrhythmic activity, caused by network disruption in the context of a withstanding epileptic condition. To support this hypothesis, many recent studies show changes of large scale and local network connectivity in focal epilepsy [
43,
44,
45].
Further studies are needed to conclude whether this beta power alteration over the AH is directly pathological or rather a compensatory increase to keep up with memory tasks in a pathologic network. This second hypothesis could be supported by the fact that beta and alpha oscillations are known to have a role in working memory encoding tasks and in memory consolidation [
46,
47,
48,
49].
4.2. Neurophysiological Disfunction and Accelerated Long-Time Forgetfulness
Patients with TEA are often described to suffer from a peculiar form of chronic memory impairment: Accelerated Long-time Forgetfulness (ALF) [
50]. ALF was described in these patients as a peculiar deficit in memory fixation [
35,
51,
52], and its nature is not clear, but this phenomenon is probably related to the involvement of the temporo-mesial network that has a key role in memory fixation [
53,
54].
Recent functional-MRI (fMRI) findings point toward a temporal impairment in ALF. As confirmed by fMRI during memory recalling tasks, TEA patients show different activation patterns in the affected para-hippocampal cortex when compared to controls [
55]. The authors hypothesized that ALF could be caused by a deficit of memory encoding networks induced by the epileptic focus. We strongly agree with this hypothesis, as our data are consistent with this theory and could be regarded as an evidence of neurophysiological alteration in the background activity of the affected temporal lobe in cases of TEA.
Unfortunately, due to the retrospective nature of the study, we could not test our patients for ALF, and thus beta alteration in the temporal lobe of TEA patients is yet to be directly linked with ALF.
4.3. Potential Clinical Implications and Research Directions
A point of strength of our study is that patients with TEA were off medication at the time of the EEG recording. In fact, AEDs are known to alter connectivity and PSA [
56,
57] and are considered a strong confounding factor for qEEG studies, often hard to avoid.
Our study is an additional proof of how qEEG might add value to the visual referral of EEG. We found quantitative differences between patients with TEA and TGA, these differences could be used in the future, eventually combined with other findings that characterize epilepsy such as heart rate variability [
58] or blood work [
59], to aid clinicians in differential diagnosis.
Further studies, including specific neuropsychological tests for ALF and a larger sample size, could clarify the role of neurophysiologic alterations in ALF and show the diagnostic yield of diagnostic algorithms that include qEEG features [
60].
5. Limitations
Our study suffers from some limitations that need to be addressed. We used 19 channels of EEG due to the clinical nature of the study. LORETA source modelling has been used with good results with different brain imaging techniques and also with 19 channel EEGs [
28,
30], but it is due to say that the precision in localization is reduced if compared with modern high-definition EEGs.
It is noteworthy that in order to have the highest sensitivity in diagnosing epilepsy, patients should undergo prolonged video EEG monitoring, but this practice is expensive, time-consuming and often reserved for the most severe cases and presurgical evaluations.
We compared TEA with TGA, enrolling patients when asymptomatic, we assumed that after symptoms resolution, patients with TGA have normal EEG. This is supported by the fact that the literature describes EEG alterations in TGA exclusively in the acute symptomatic phase, and there are no reports on EEG after symptoms resolution. Nevertheless, further studies also including healthy subjects would add power to this finding.
Patients could not be tested for accelerated long-time forgetfulness or other neuropsychological tests since these tests are not part of routine practice and since the study design is retrospective.
Finally, due to the rarity of TEA, the numerosity of our sample is limited and not all patients enrolled shared the same focus side.
Following our study, larger studies could leverage differences in spectral activity to design differential diagnostic algorithms (TEA versus TGA) based on qEEG.
6. Conclusions
Our paper presents original evidence of increased interictal beta spectrum power in the AH of TEA patients when compared to TGA patients. These differences were localized to the AH uncus and para-hippocampal gyrus. Beta band alterations specific to the AH might be related to temporal network malfunctioning and could explain symptoms such as the ALF phenomenon observed in patients with TEA.
Supplementary Materials
The following are available online at
https://www.mdpi.com/2076-3425/10/9/613/s1: Supplementary Table S1: The table depicts clinical information on the amnesic episodes of patients with Transient Epileptic Amnesia, along with the therapy of choice started after the diagnosis.
Author Contributions
Conceptualization, J.L. and C.I.; methodology, J.L.; software, C.I.; validation, G.A., M.T. and L.R.; formal analysis, J.L.; investigation, J.L.; resources, M.T.; data curation, J.L.; writing—original draft preparation, J.L.; writing—review and editing, V.D.L and B.F.; visualization, B.F.; supervision, V.D.L.; project administration, G.A. All authors have read and agreed to the published version of the manuscript.
Funding
This research received no external funding.
Conflicts of Interest
The authors declare no conflict of interest.
References
- Spiegel, D.R.; Smith, J.; Wade, R.R.; Cherukuru, N.; Ursani, A.; Dobruskina, Y.; Crist, T.; Busch, R.F.; Dhanani, R.M.; Dreyer, N. Transient global amnesia: Current perspectives. Neuropsychiatr. Dis. Treat. 2017, 13, 2691–2703. [Google Scholar] [CrossRef] [PubMed]
- Palmini, A.L.; Gloor, P.; Jones-Gotman, M. Pure amnestic seizures in temporal lobe epilepsy: Definition, clinical symptomatology and functional anatomical considerations. Brain 1992, 115, 749–769. [Google Scholar] [CrossRef] [PubMed]
- Zeman, A.; Boniface, S.; Hodges, J. Transient epileptic amnesia: A description of the clinical and neuropsychological features in 10 cases and a review of the literature. J. Neurol. Neurosurg. Psychiatry 1998, 64, 435–443. [Google Scholar] [CrossRef] [PubMed]
- Butler, C.R.; Graham, K.S.; Hodges, J.R.; Kapur, N.; Wardlaw, J.M.; Zeman, A.Z.J. The syndrome of transient epileptic amnesia. Ann. Neurol. 2007, 61, 587–598. [Google Scholar] [CrossRef] [PubMed]
- Butler, C.R.; Zeman, A. The Causes and Consequences of Transient Epileptic Amnesia. Behav. Neurol. 2011, 24, 299–305. [Google Scholar] [CrossRef]
- Asadi-Pooya, A.A. Transient epileptic amnesia: A concise review. Epilepsy Behav. 2014, 31, 243–245. [Google Scholar] [CrossRef]
- Tombini, M.; Assenza, G.; Quintiliani, L.; Ricci, L.; Lanzone, J.; De Mojà, R.; Ulivi, M.; Di Lazzaro, V. Epilepsy-associated stigma from the perspective of people with epilepsy and the community in Italy. Epilepsy Behav. 2019, 98, 66–72. [Google Scholar] [CrossRef]
- Lanzone, J.; Ricci, L.; Assenza, G.; Ulivi, M.; Di Lazzaro, V.; Tombini, M. Transient epileptic and global amnesia: Real-life differential diagnosis. Epilepsy Behav. 2018, 88, 205–211. [Google Scholar] [CrossRef]
- Thatcher, R.W. Validity and Reliability of Quantitative electroencephalography. J. Neurother. 2010, 14, 122–152. [Google Scholar] [CrossRef]
- Assenza, G.; Capone, F.; di Biase, L.; Ferreri, F.; Florio, L.; Guerra, A.; Marano, M.; Paolucci, M.; Ranieri, F.; Salomone, G.; et al. Corrigendum: Oscillatory Activities in Neurological Disorders of Elderly: Biomarkers to Target for Neuromodulation. Front. Aging Neurosci. 2017, 9, 252. [Google Scholar] [CrossRef]
- Quraan, M.A.; McCormick, C.; Cohn, M.; Valiante, T.A.; McAndrews, M.P. Altered Resting State Brain Dynamics in Temporal Lobe Epilepsy Can Be Observed in Spectral Power, Functional Connectivity and Graph Theory Metrics. PLoS ONE 2013, 8, e68609. [Google Scholar] [CrossRef] [PubMed]
- Pellegrino, G.; Tombini, M.; Curcio, G.; Campana, C.; Di Pino, G.; Assenza, G.; Tomasevic, L.; Di Lazzaro, V. Slow Activity in Focal Epilepsy During Sleep and Wakefulness. Clin. EEG Neurosci. 2017, 48, 200–208. [Google Scholar] [CrossRef] [PubMed]
- Quinette, P.; Guillery-Girard, B.; Dayan, J.; Sayette, V.D.; Marquis, S.; Viader, F.; Desgranges, B.; Eustache, F. What does transient global amnesia really mean? Review of the literature and thorough study of 142 cases. Brain 2006, 129, 1640–1658. [Google Scholar] [CrossRef] [PubMed]
- Imperatori, C.; Farina, B.; Todini, F.; Di Blasi, C.; Mazzucchi, E.; Brunetti, V.; Della Marca, G. Abnormal EEG Power Spectra in Acute Transient Global Amnesia: A Quantitative EEG Study. Clin. EEG Neurosci. 2019, 50, 188–195. [Google Scholar] [CrossRef] [PubMed]
- Pascual-Marqui, R.D.; Lehmann, D.; Koukkou, M.; Kochi, K.; Anderer, P.; Saletu, B.; Tanaka, H.; Hirata, K.; John, E.R.; Prichep, L.; et al. Assessing interactions in the brain with exact low-resolution electromagnetic tomography. Philosophical Transactions of the Royal Society A: Mathematical. Phys. Eng. Sci. 2011, 369, 3768–3784. [Google Scholar] [CrossRef] [PubMed]
- Szabo, K.; Hoyer, C.; Caplan, L.R.; Grassl, R.; Griebe, M.; Ebert, A.; Platten, M.; Gass, A. Diffusion-weighted MRI in transient global amnesia and its diagnostic implications. Neurology 2020. [Google Scholar] [CrossRef]
- Nuwer, M.R.; Comi, G.; Emerson, R.; Fuglsang-Frederiksen, A.; Guérit, J.M.; Hinrichs, H.; Ikeda, A.; Luccas, F.J.; Rappelsburger, P. IFCN standards for digital recording of clinical EEG. International Federation of Clinical Neurophysiology. Electroencephalogr. Clin. Neurophysiol. 1998, 106, 259–261. [Google Scholar] [CrossRef]
- Imperatori, C.; Brunetti, R.; Farina, B.; Speranza, A.M.; Losurdo, A.; Testani, E.; Contardi, A.; Della Marca, G. Modification of EEG power spectra and EEG connectivity in autobiographical memory: A sLORETA study. Cogn. Process. 2014, 15, 351–361. [Google Scholar] [CrossRef]
- Delorme, A.; Makeig, S. EEGLAB: An open source toolbox for analysis of single-trial EEG dynamics including independent component analysis. J. Neurosci. Methods 2004, 134, 9–21. [Google Scholar] [CrossRef]
- Pascual-Marqui, R.D.; Michel, C.M.; Lehmann, D. Low resolution electromagnetic tomography: A new method for localizing electrical activity in the brain. Int. J. Psychophysiol. 1994, 18, 49–65. [Google Scholar] [CrossRef]
- Pascual-Marqui, R.D.; Biscay, R.J.; Bosch-Bayard, J.; Lehmann, D.; Kochi, K.; Kinoshita, T.; Yamada, N.; Sadato, N. Assessing direct paths of intracortical causal information flow of oscillatory activity with the isolated effective coherence (iCoh). Front. Hum. Neurosci. 2014, 8, 448. [Google Scholar] [CrossRef] [PubMed]
- Pascual-Marqui, R.D. Standardized low-resolution brain electromagnetic tomography (sLORETA): Technical details. Methods Find. Exp. Clin. Pharmacol. 2002, 24 (Suppl. D), 5–12. [Google Scholar] [PubMed]
- Grave de Peralta-Menendez, R.; Gonzalez-Andino, S.L. A critical analysis of linear inverse solutions to the neuroelectromagnetic inverse problem. IEEE Trans. Biomed. Eng. 1998, 45, 440–448. [Google Scholar] [CrossRef] [PubMed]
- Grave de Peralta Menendez, R.; Gonzalez Andino, S.L.; Morand, S.; Michel, C.M.; Landis, T. Imaging the electrical activity of the brain: ELECTRA. Hum. Brain. Mapp. 2000, 9, 1–12. [Google Scholar] [CrossRef]
- Grech, R.; Cassar, T.; Muscat, J.; Camilleri, K.P.; Fabri, S.G.; Zervakis, M.; Xanthopoulos, P.; Sakkalis, V.; Vanrumste, B. Review on solving the inverse problem in EEG source analysis. J. Neuroeng. Rehabil. 2008, 5, 25. [Google Scholar] [CrossRef]
- Nichols, T.E.; Holmes, A.P. Nonparametric permutation tests for functional neuroimaging: A primer with examples. Hum. Brain Mapp. 2002, 15, 1–25. [Google Scholar] [CrossRef]
- Stenroos, M.; Hunold, A.; Haueisen, J. Comparison of three-shell and simplified volume conductor models in magnetoencephalography. Neuroimage 2014, 94, 337–348. [Google Scholar] [CrossRef]
- Horacek, J.; Brunovsky, M.; Novak, T.; Skrdlantova, L.; Klirova, M.; Bubenikova-Valesova, V.; Krajca, V.; Tislerova, B.; Kopecek, M.; Spaniel, F.; et al. Effect of low-frequency rTMS on electromagnetic tomography (LORETA) and regional brain metabolism (PET) in schizophrenia patients with auditory hallucinations. Neuropsychobiology 2007, 55, 132–142. [Google Scholar] [CrossRef]
- Cannon, R.; Kerson, C.; Hampshire, A. sLORETA and fMRI Detection of Medial Prefrontal Default Network Anomalies in Adult ADHD. J. Neurother. 2011, 15, 358–373. [Google Scholar] [CrossRef]
- De Ridder, D.; Vanneste, S.; Kovacs, S.; Sunaert, S.; Dom, G. Transient alcohol craving suppression by rTMS of dorsal anterior cingulate: An fMRI and LORETA EEG study. Neurosci. Lett. 2011, 496, 5–10. [Google Scholar] [CrossRef]
- Dümpelmann, M.; Ball, T.; Schulze-Bonhage, A. sLORETA allows reliable distributed source reconstruction based on subdural strip and grid recordings. Human Brain Mapp. 2012, 33, 1172–1188. [Google Scholar] [CrossRef] [PubMed]
- Friston, K.J.; Frith, C.D.; Liddle, P.F.; Frackowiak, R.S. Comparing functional (PET) images: The assessment of significant change. J. Cereb. Blood Flow Metab. 1991, 11, 690–699. [Google Scholar] [CrossRef] [PubMed]
- Kitaura, Y.; Nishida, K.; Yoshimura, M.; Mii, H.; Katsura, K.; Ueda, S.; Ikeda, S.; Pascual-Marqui, R.D.; Ishii, R.; Kinoshita, T. Functional localization and effective connectivity of cortical theta and alpha oscillatory activity during an attention task. Clin. Neurophysiol. Pract. 2017, 2, 193–200. [Google Scholar] [CrossRef] [PubMed]
- Hata, M.; Hayashi, N.; Ishii, R.; Canuet, L.; Pascual-Marqui, R.D.; Aoki, Y.; Ikeda, S.; Sakamoto, T.; Iwata, M.; Kimura, K.; et al. Short-term meditation modulates EEG activity in subjects with post-traumatic residual disabilities. Clin. Neurophysiol. Pract. 2019, 4, 30–36. [Google Scholar] [CrossRef]
- Elliott, G.; Isaac, C.L.; Muhlert, N. Measuring forgetting: A critical review of accelerated long-term forgetting studies. Cortex 2014, 54, 16–32. [Google Scholar] [CrossRef]
- Zeidman, P.; Maguire, E.A. Anterior hippocampus: The anatomy of perception, imagination and episodic memory. Nat. Rev. Neurosci. 2016, 17, 173–182. [Google Scholar] [CrossRef]
- Song, J.; Davey, C.; Poulsen, C.; Luu, P.; Turovets, S.; Anderson, E.; Li, K.; Tucker, D. EEG source localization: Sensor density and head surface coverage. J. Neurosci. Methods 2015, 256, 9–21. [Google Scholar] [CrossRef]
- de Tudesco, I.S.S.; Vaz, L.J.; Mantoan, M.A.S.; Belzunces, E.; Noffs, M.H.; Caboclo, L.O.S.F.; Yacubian, E.M.T.; Sakamoto, A.C.; Bueno, O.F.A. Assessment of working memory in patients with mesial temporal lobe epilepsy associated with unilateral hippocampal sclerosis. Epilepsy Behav. 2010, 18, 223–228. [Google Scholar] [CrossRef]
- Meador, K. Memory Loss after Left Anterior Temporal Lobectomy in Patients with Mesial Temporal Lobe Sclerosis. Epilepsy Curr. 2006, 6, 44–45. [Google Scholar] [CrossRef]
- Park, Y.H.; Kim, J.-Y.; Yi, S.; Lim, J.-S.; Jang, J.-W.; Im, C.-H.; Kim, S. Transient Global Amnesia Deteriorates the Network Efficiency of the Theta Band. PLoS ONE 2016, 11, e0164884. [Google Scholar] [CrossRef]
- Panet-Raymond, D.; Gotman, J. Asymmetry in delta activity in patients with focal epilepsy. Electroencephalogr. Clin. Neurophysiol. 1990, 75, 474–481. [Google Scholar] [CrossRef]
- Clemens, B.; Bessenyei, M.; Fekete, I.; Puskás, S.; Kondákor, I.; Tóth, M.; Hollódy, K. Theta EEG source localization using LORETA in partial epilepsy patients with and without medication. Clin. Neurophysiol. Off. J. Int. Fed. Clin. Neurophysiol. 2010, 121, 848–858. [Google Scholar] [CrossRef] [PubMed]
- Tracy, J.I.; Doucet, G.E. Resting-state functional connectivity in epilepsy: Growing relevance for clinical decision making. Curr. Opin. Neurol. 2015, 28, 158–165. [Google Scholar] [CrossRef] [PubMed]
- Bettus, G.; Wendling, F.; Guye, M.; Valton, L.; Régis, J.; Chauvel, P.; Bartolomei, F. Enhanced EEG functional connectivity in mesial temporal lobe epilepsy. Epilepsy Res. 2008, 81, 58–68. [Google Scholar] [CrossRef] [PubMed]
- Englot, D.J.; Hinkley, L.B.; Kort, N.S.; Imber, B.S.; Mizuiri, D.; Honma, S.M.; Findlay, A.M.; Garrett, C.; Cheung, P.L.; Mantle, M.; et al. Global and regional functional connectivity maps of neural oscillations in focal epilepsy. Brain 2015, 138, 2249–2262. [Google Scholar] [CrossRef] [PubMed]
- Jensen, O.; Gelfand, J.; Kounios, J.; Lisman, J.E. Oscillations in the Alpha Band (9–12 Hz) Increase with Memory Load during Retention in a Short-term Memory Task. Cereb Cortex 2002, 12, 877–882. [Google Scholar] [CrossRef] [PubMed]
- Staufenbiel, S.M.; Brouwer, A.M.; Keizer, A.W.; Van, N.W. Effect of beta and gamma neurofeedback on memory and intelligence in the elderly. Biol. Psychol. 2014, 95, 74–85. [Google Scholar] [CrossRef] [PubMed]
- Lundqvist, M.; Rose, J.; Herman, P.; Brincat, S.L.; Buschman, T.J.; Miller, E.K. Gamma and Beta Bursts Underlie Working Memory. Neuron 2016, 90, 152–164. [Google Scholar] [CrossRef]
- Lundqvist, M.; Herman, P.; Warden, M.R.; Brincat, S.L.; Miller, E.K. Gamma and beta bursts during working memory readout suggest roles in its volitional control. Nat. Commun. 2018, 9, 1–12. [Google Scholar] [CrossRef]
- Del Felice, A.; Broggio, E.; Valbusa, V.; Gambina, G.; Arcaro, C.; Manganotti, P. TEAmistaken for mild cognitive impairment? A high-density EEG study. Epilepsy Behav. 2014, 36, 41–46. [Google Scholar] [CrossRef]
- Dewar, M.; Hoefeijzers, S.; Zeman, A.; Butler, C.; Della Sala, S. Impaired picture recognition in transient epileptic amnesia. Epilepsy Behav. 2015, 42, 107–116. [Google Scholar] [CrossRef] [PubMed]
- Hoefeijzers, S.; Dewar, M.; Della Sala, S.; Butler, C.; Zeman, A. Accelerated Long-Term Forgetting Can Become Apparent Within 3–8 Hours of Wakefulness in Patients with Transient Epileptic Amnesia. Neuropsychology 2015, 29, 117–125. [Google Scholar] [CrossRef] [PubMed]
- Jeneson, A.; Squire, L.R. Working memory, long-term memory, and medial temporal lobe function. Learn Mem. 2012, 19, 15–25. [Google Scholar] [CrossRef]
- Muhlert, N.; Milton, F.; Butler, C.R.; Kapur, N.; Zeman, A.Z. Accelerated forgetting of real-life events in Transient Epileptic Amnesia. Neuropsychologia 2010, 48, 3235–3244. [Google Scholar] [CrossRef] [PubMed]
- Atherton, K.E.; Filippini, N.; Zeman, A.Z.J.; Nobre, A.C.; Butler, C.R. Encoding-related brain activity and accelerated forgetting in transient epileptic amnesia. Cortex 2019, 110, 127–140. [Google Scholar] [CrossRef] [PubMed]
- Höller, Y.; Helmstaedter, C.; Lehnertz, K. Quantitative Pharmaco-Electroencephalography in Antiepileptic Drug Research. CNS Drugs 2018, 32, 839–848. [Google Scholar] [CrossRef]
- Pellegrino, G.; Mecarelli, O.; Pulitano, P.; Tombini, M.; Ricci, L.; Lanzone, J.; Brienza, M.; Davassi, C.; Di Lazzaro, V.; Assenza, G. Eslicarbazepine Acetate Modulates EEG Activity and Connectivity in Focal Epilepsy. Front. Neurol. 2018, 9. [Google Scholar] [CrossRef]
- Assenza, G.; Mecarelli, O.; Tombini, M.; Pulitano, P.; Pellegrino, G.; Benvenga, A.; Assenza, F.; Campana, C.; Di Pino, G.; Di Lazzaro, V. Hyperventilation induces sympathetic overactivation in mesial temporal epilepsy. Epilepsy Res. 2015, 110, 221–227. [Google Scholar] [CrossRef]
- Tombini, M.; Squitti, R.; Cacciapaglia, F.; Ventriglia, M.; Assenza, G.; Benvenga, A.; Pellegrino, G.; Campana, C.; Assenza, F.; Siotto, M.; et al. Inflammation and iron metabolism in adult patients with epilepsy: Does a link exist? Epilepsy Res. 2013, 107, 244–252. [Google Scholar] [CrossRef]
- Buettner, R.; Rieg, T.; Frick, J. Machine Learning Based Diagnosis of Diseases Using the Unfolded EEG Spectra: Towards an Intelligent Software Sensor. In Proceedings of the Information Systems and Neuroscience; Davis, F.D., Riedl, R., vom Brocke, J., Léger, P.-M., Randolph, A., Fischer, T., Eds.; Springer International Publishing: Cham, Switzerland, 2020; pp. 165–172. [Google Scholar]
© 2020 by the authors. Licensee MDPI, Basel, Switzerland. This article is an open access article distributed under the terms and conditions of the Creative Commons Attribution (CC BY) license (http://creativecommons.org/licenses/by/4.0/).

 ,
, 


