1. Introduction
The recent developments of the microsystems have been so promising that nowadays they offer a great potential to many applications which require a high grade of miniaturization. Nevertheless, using microsurgery to heal diseases with a minimal invasive approach is still an ambitious challenge because of severe requirements (accuracy, precision, reliability, reduced consumption, limited costs, small size, high performance repeatability, short response time, efficiency in wet or liquid environments). One way of coping with this challenge consists in modifying the common Micro Electro Mechanical Systems (MEMS) to increase their degrees of freedom (usually unitary) and dexterity, for example, providing them with several revolute pairs. These microsystems need to be tested in a significant environment, starting from room environment (in air), but this is not so obvious as it could appear at first sight. In fact, these systems need to be analyzed by means of SEM, which implies putting the mechanisms within a vacuum chamber, rather than a particular environment. Therefore, significant operational tests must be performed by other means of observations, such as microscopy or interferometric profilometry. However, the latter instruments have less resolution than a SEM and their use can be critical to inspect the smallest parts of a microsystem.
This paper shows that microscopy observation can still be very effective in MEMS operational tests under environmental conditions. An effort has been made to assess microscopy observation of MEMS by comparing this means with a higher class, but also a more expensive and difficult-to-use instrument, namely, a profilometer. The statistical treatment of the results of two experimental campaigns (optical microscope and profilometer) shows that the characterization and image acquisition capability of the optical microscope is comparable to that of the profilometer, while the optical microscope maintains a larger degree of freedom in setting the operational parameters.
Given the interdisciplinary nature of the present investigation, it is helpful to give a glimpse to the different types of involved competences. It is particularly important to review some previous contributions concerning the operational conditions that would be required to a micro-electro- mechanical system in surgery.
A first survey of MEMS for surgical applications [
1] showed how MEMS technology may improve the functionality of existing surgical devices and also add new capabilities that give rise to new treatments. For example, MEMS can improve surgical outcomes, with lower risk, by providing the surgeon with real-time feedback on the operation. From the mechanical and operational point of view, microgrippers for different applications have been extensively proposed in literature [
2,
3].
There are many other different applications where MEMS can play a significant role. For a representative example, MEMS-Technology based micro-accelerometers [
4] are able to measure the heart wall motion of patients who have undergone coronary artery bypass graft surgery (CABG). Furthermore, there are many other applications where MEMS could be conveniently used to improve success in surgery, such as in laparoscopic sleeve gastrectomy (LSG) with cruroplasty [
5], in surgical treatment of gastrointestinal stromal tumors of the duodenum [
6] in colovesical fistula surgery with minimally invasive approach [
7], in Endoluminal loco-regional resection by Transanal Endoscopic Microsurgery (TEM) [
8,
9,
10], and in Low Rectal Anterior Resection (LAR) [
11].
These kinds of applications require very specific actions during the different stages of design, fabrication and packaging, because their correct working is depending on many physical parameters, such as temperature, humidity of the environment, presence of water or other liquids, chemical reactions and pressure. For example, the influence of temperature and humidity on the adsorbed water layer on micro scale monocrystalline silicon (Si) films has been investigated in air, using an Si-MEMS kHz-frequency resonator [
12]. Water proof or water insensitive three-axis MEMS based accelerometers have been presented [
13] for encouraging their operation in laboratory scale experiments. The theory of water electrolysis in a closed electrochemical cell has been described [
14] to develop a new actuation principle for MEMS. A special apparatus has been employed to study the adhesive friction due to water in the nanometer range, where the water layer thickness greatly affects friction and adhesion [
15]. Heat transfer characteristics of isolated bubble of water were investigated by local wall temperature measurement using a novel MEMS based sensor [
16]. MEMS-OR-PAM (optical-resolution photoacoustic microscopy) has also been proved [
17] to be a powerful tool for studying highly dynamic and time-sensitive biological phenomena.
Although MEMS still have not developed their potential for surgery applications, there are many more examples of their use in biomedical instruments [
18,
19,
20]. The mechanical characteristics of cells provide information on their functionality and their state of health, while their geometry can be linked to genetic alterations and apoptosis; the importance of these analyses could help in the collection of phenotypic information or for the diagnosis of pathological disorders [
21]. For example, a study [
22] was conducted about the viscoelasticity of L929 cells, to investigate their cellular structure, notoriously linked to important physiological functions. In addition, applications of microspectroscopic techniques [
23] have been conducted to characterize the viscoelastic properties of living cells. The study of the mechanical properties of cells, also concerns the muscle cells: for example the mechanical response, in terms of strength and displacement, of some smooth muscle cells subjected to elongation has been studied [
24] with the aim of better understanding the links between their functionalities and their structure. A study [
25] on skeletal muscle cells described how the relationship between the stiffness and the force exerted by some actin filaments can indicate the physiological state of the actin cytoskeleton. Moreover, the mechanical properties of tissue-engineered vascular constructs have been studied by monitoring pressure and diameter variations of vascular constructs submitted to hydrostatic loading [
26]. A silicon microgripper has also been proposed [
27] to characterize the mechanical stiffness of biological tissues, with the wider prospective of developing a professional inspecting instrument for laboratory measurements or surgical operations.
More recently, new emerging MEMS-Technology based instruments for biomedical and surgical applications have been developed. In fact, based on a new concept hinge [
28,
29], a class of different microgrippers, equipped with rotary comb-drives, has been developed [
30,
31,
32,
33], also in significant environments [
34], and fabricated [
35,
36]. Thanks to their size, these instruments are expected to be employed in surgery and diagnostics. This class of microsystem is the focus of the present investigation.
2. Experimental Characterization of MEMS-Technology Based Instruments in Operational Environments
In spite of MEMS’ great potential for biomedical applications, only a few studies [
37] focus on their characterization in an operational environment.
In fact, SEM observation is often a necessity to characterize MEMS, but this means it could be detrimental for the assessment of tests under real operational conditions, basically because tests are performed in vacuum conditions.
Considering the extensively spread biomedical applications, it is also worth mentioning the Optical Coherence Tomography (OCT), which is an optical imaging technique used primarily to investigate the internal microstructure of biological tissues, in ophthalmology and in dentistry [
38]. The main advantage of OCT compared to other traditional systems is that this method offers the possibility of a non-invasive in vivo visualization of the tissue with high-resolution three-dimensional images [
39]. Despite the axial resolution of some OCT systems (such as Ultrahigh-resolution OCT) [
40] that can reach a few micrometers [
41], the lateral resolution is affected by the diffraction limits due to the spot size in the focal plane of the probe beam. In fact, the lateral resolution often presents values between 10 and 20
m [
42,
43]. Indeed, the above mentioned values of lateral resolution, together with higher costs, make OCTs less attractive than the light microscopy for the characterization of microgrippers in operational conditions.
Considering the above mentioned characteristics for SEM and OCT, traditional light microscopy is quite competitive since it allows test stands to be less expensive in a widespread range of test conditions.
In this investigation a performance characterization of some comb-driven microgrippers in operative condition has been carried out.
The characterization of MEMS-Technology based microgrippers has been recently approached by using a profilometer [
44], while the present work will show that a more simple commercial light microscope is still capable to satisfy the same activity with no detriment of measurement significance. Since optical microscopy is widely used in laboratories, it is believed that this paper might have some impact on the future characterizations of microsystems in air, wet or liquid environments. The importance of micromanipulation of mobile micro-particle suspended in liquid well has been recently underlined and a visual-servo automatic micromanipulating system has been presented [
45].
Since the intrinsic resolution of optical microscopy is generally rather worse than SEM or profilometer imaging, its real aptitude and efficacy in examining micro-objects remains something that must be validated. Therefore, the present paper will endorse microscopy observation to characterize a microsystem in environmental conditions, by comparing the results obtained by means of both optical microscope and profilometer image analysis techniques. This is justified since the optical devices are the most suitable for carrying out measurements on microsystems without contact and in operative conditions.
In this work, the above mentioned characterization involved the measurements of the angular displacements of a rotary comb-drive embedded into an independently developed microgripper, when a voltage is applied to the device. This is obtained by an in-house Image Analysis Software (IAS) implemented by the authors. The analysis of the measurement results has been achieved by means of uncertainty models for the evaluation of the corresponding error sources. For this purpose, the two image acquisition systems and the corresponding measurement chains will be described, together with the analysis of the relative sources of uncertainty. Finally, the measurements carried out with the Optical Profilometer System (OPS) and Light Trinocular Microscope (LTM) systems will be analyzed to check whether the two groups of results could be considered comparable and consistent within the interval of experimental uncertainties.
3. Materials and Methods
The evolution of MEMS gave rise to different kinds of microsystems that have been based on MEMS Technology. However, despite the relevant elements mentioned above, one cannot help but notice that, in the international technical-scientific panorama, guidelines, protocols and regulations regarding the characterization of these devices are still lacking, both under the metrological and the mechanical point of view. The present investigation is part of a larger project dedicated to the development of new concept microgrippers for surgical applications and it attempts to partially fill this gap and to validate the optical image analysis as a proper means of characterization of the developed microsystems under operative conditions.
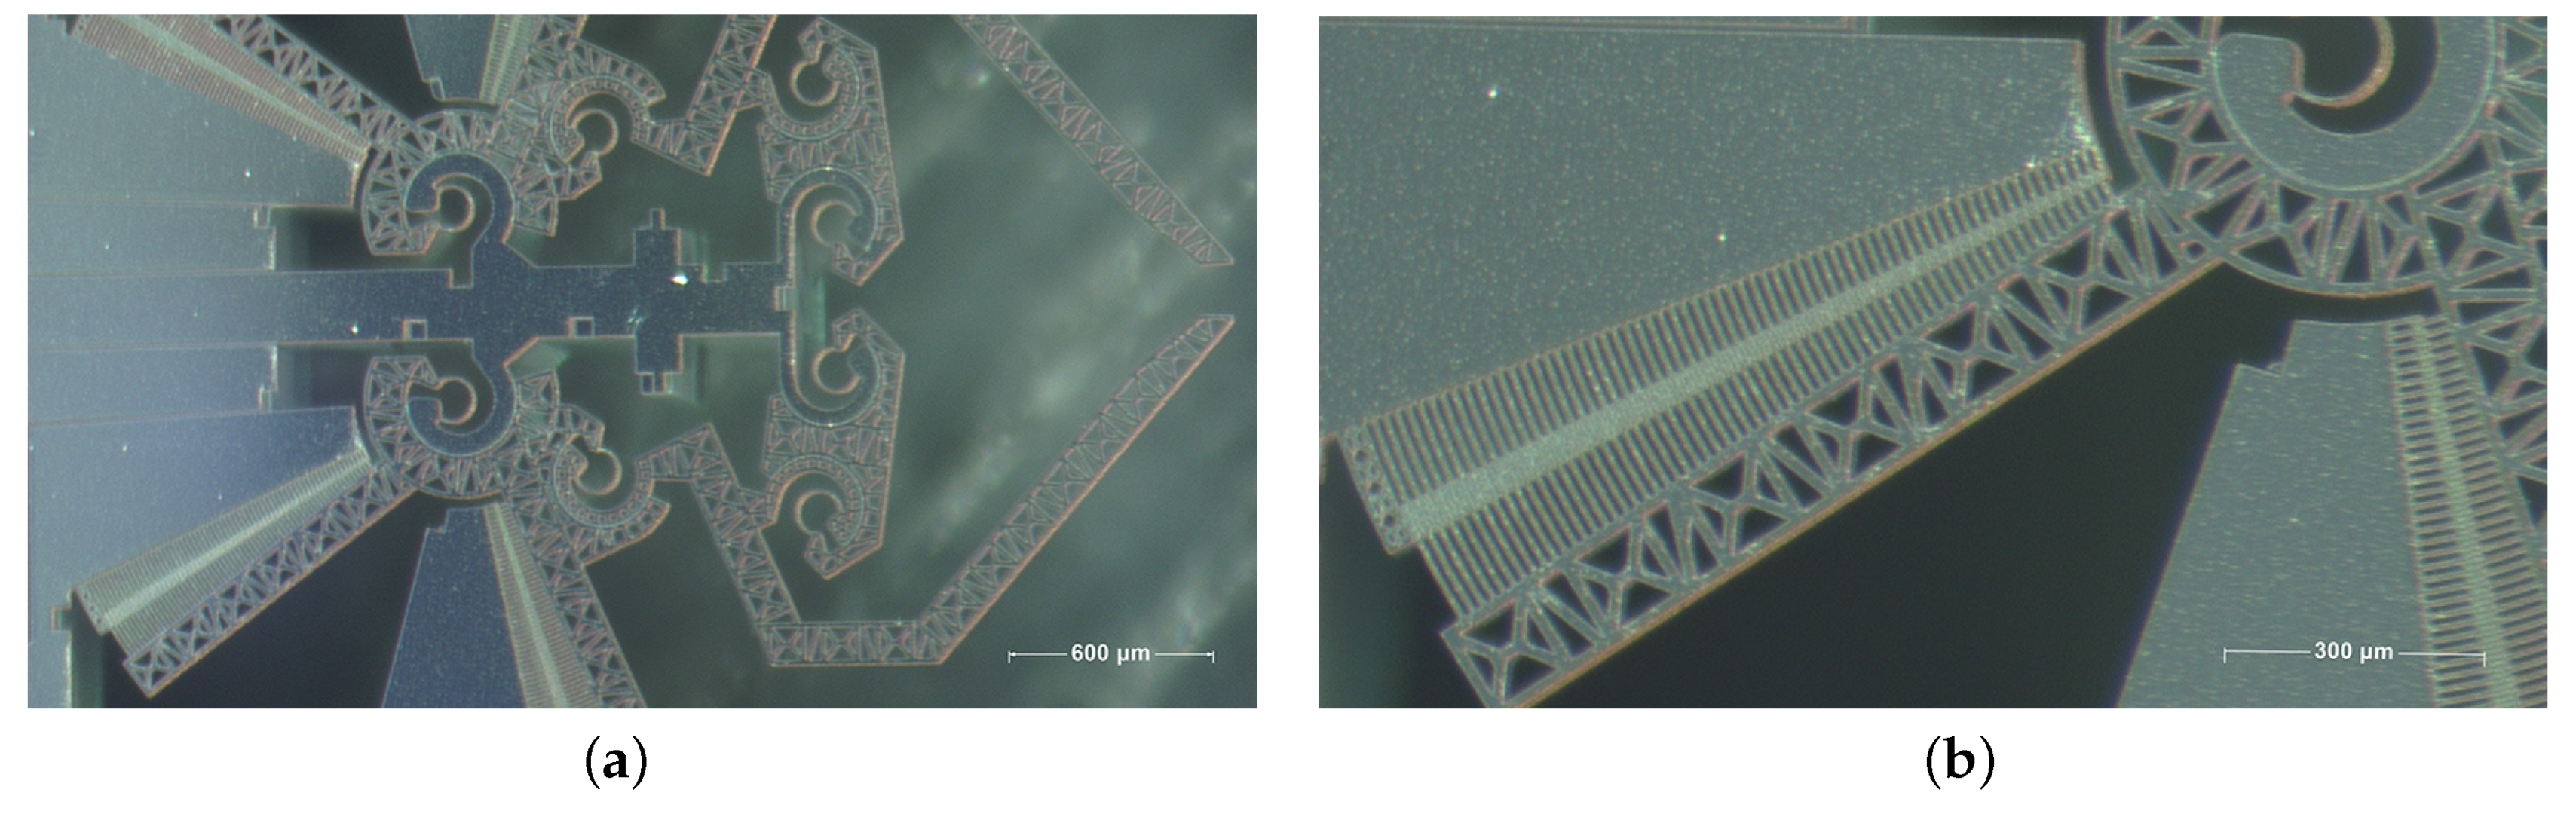
The peculiar object of this investigation is a rotary comb-drive depicted in
Figure 1. This component consists in an electrostatic actuator that provides motion to the microgripper illustrated in
Figure 1a. The rotary comb-drive is composed of a pair of sets of fingers, as shown in the more detailed
Figure 1b. The mobile series of fingers rotates as a function of the applied voltage and the determination of the voltage-rotation curve is greatly important for the operational aspects. Two measurement chains have been set up to measure such voltage-rotation function. The first is composed by a Fogale Zoomsurf 3D Optical Profiling System (OPS,
Table 1), while the second is composed of a NB50TS Eurotek Light Trinocular Microscope (LTM,
Table 2).
For the sake of the present investigation it is convenient to underline that the two sets of images from the two devices have been both processed using the same in-house built software in order to properly discriminate which one, between OPS and LTM, is the most suitable system to characterize the microgripper devices.
3.1. OPS and LTM Experimental Setups
The Device Under Test (DUT) consists of a microgripper prototype made up of pseudo-rigid beams and flexure hinges. Any jaw of the microgripper is actuated by a capacitive rotary comb-drive that provides a torque when a voltage is applied to the electrodes.
During the first experimental campaign, performed with the Optical Profiling System, a variable voltage source has been used to supply the DUT and to evaluate the angular displacements of its comb drive. In this investigation, a power supply Keithley 236 SMU with 0.06 V output voltage accuracy (Range
V) has been used (
Figure 2).
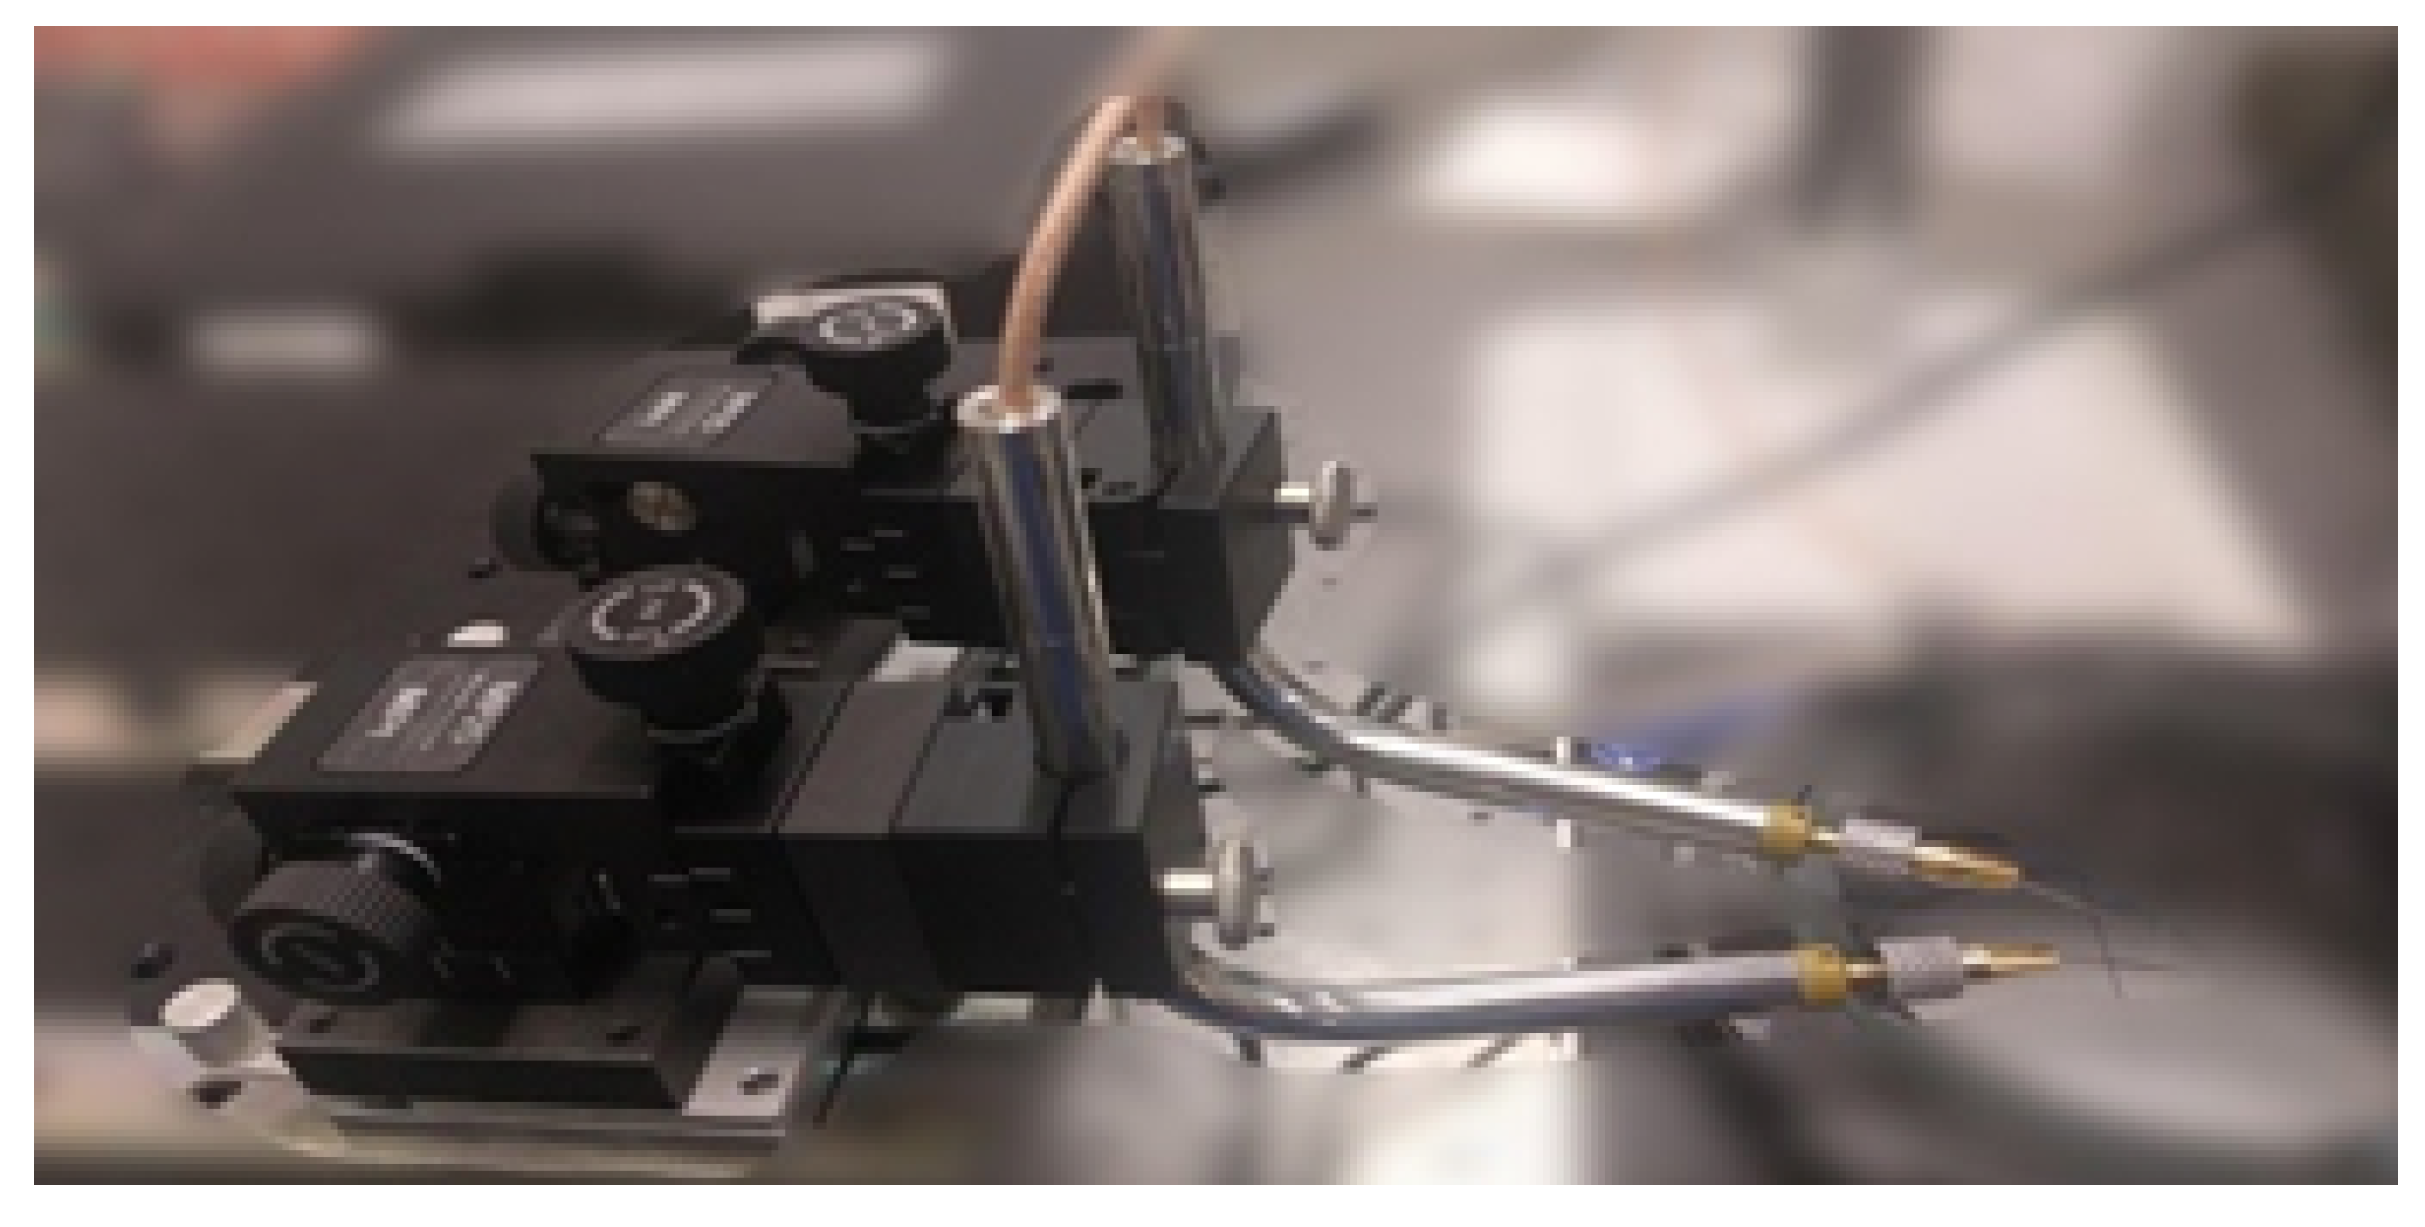
Two micropositioners with 5
m resolution have been used, each one being equipped with tungsten needles, in order to apply the voltage to the DUT electrodes,
Figure 3, and a set of digital images have been acquired using a Fogale Zoomsurf 3D OPS. The digital image resolution of 0.6 pixel/
m is provided by the Profilometer embedded software.
During the image acquisition campaign performed by means of the LTM system the same microgripper sample has been analyzed. The power supply device is a HP E3631A, with 0.04 V output voltage accuracy (Range 0 to +25 V). An electric protection circuit, equipped with a fuse, has also been connected in series, between the power supply and the DUT, to cautiously prevent the passage of a current exceeding 200 mA, which could compromise the device. Two micropositioners have been used (
Figure 3) and the microgripper angular displacements have been measured by means of acquired images and collected by a NB50TS Eurotek trinocular microscope system. The optical resolution is limited by the diffraction of the visible light and it is about 0.45–0.6
m, as in conventional light microscopes [
46]; in this study, the worst case of 0.6
m has been considered. The pixel resolution has been provided by means of calibration procedure; by means of Matlab software, a length of 1000
m on an image of a micrometer slide was considered and 15 tests were performed. By means of this procedure, the pixel density of
pixel/
m was calculated. Furthermore, the sampling constraints (Nyquist limit) and the density of the photo sites on the digital sensor also limit the whole systems resolution. To achieve a
higher level particle characterization (i.e., differentiation based upon higher order measurements such as circularity), the size of the particle or the object under examination must be greater than 4
m [
46]. In our case, in fact, it is possible to verify that it is impossible to resolve the comb-drive finger gap, that is 3
m. However, the distance between two fingers, that is 10
m, is clearly discriminated (see also Ref. [
27]); for all these reasons, a overall resolution of about 4
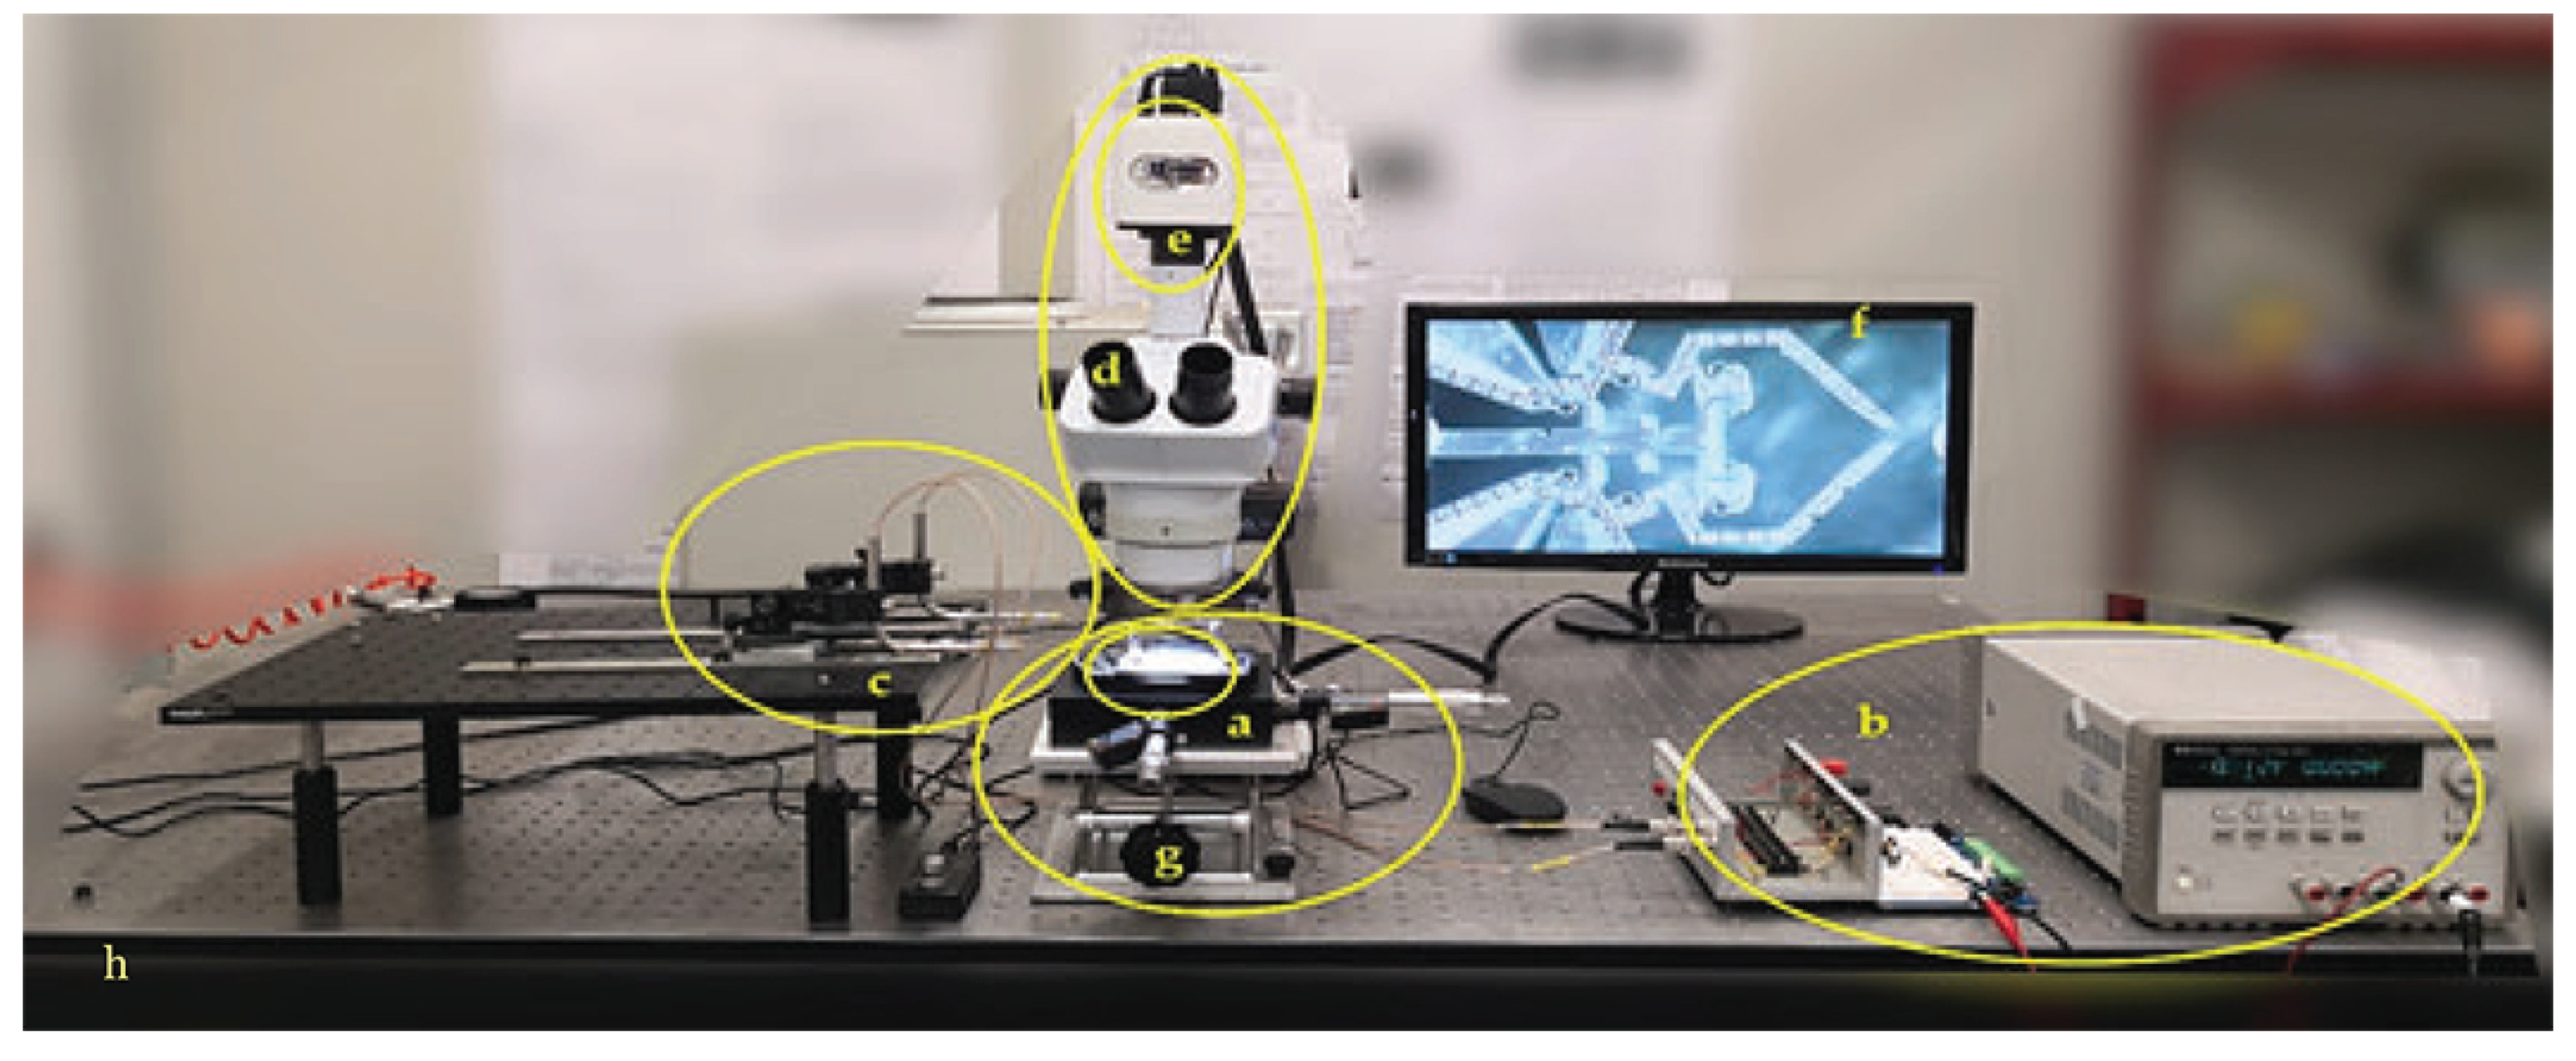
m for the LTM system is assumed. In
Figure 4, the entire LTM setup is shown and some specifications of its main components are reported in
Table 2. Once the device has been positioned on the DUT stage, it has been powered by means of two probes with tungsten needles. Through the micropositioners, the tungsten needles are approached to the microgripper electrical connections.
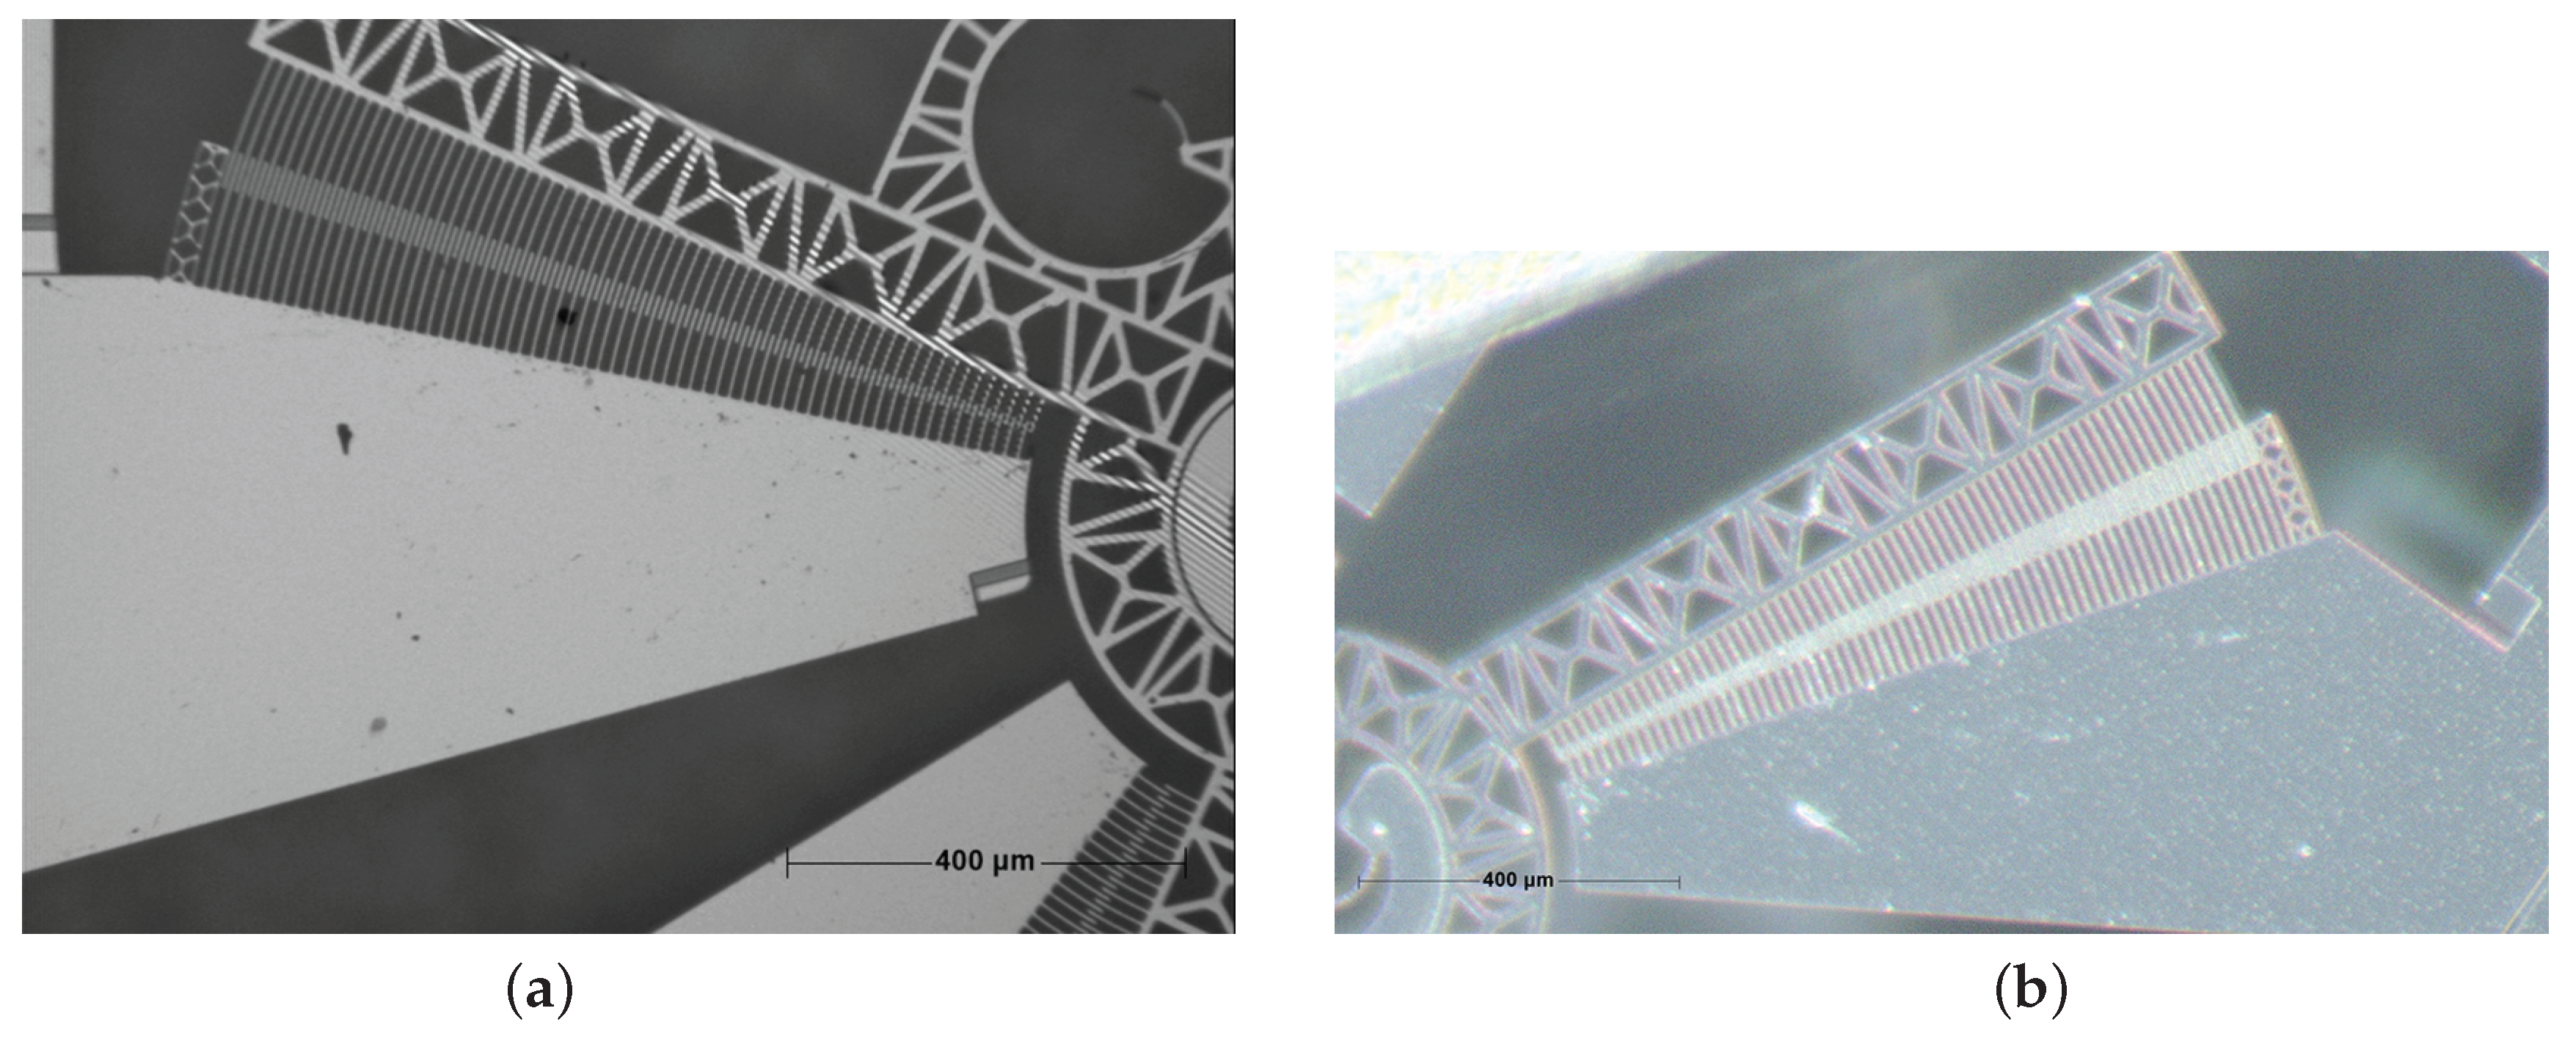
Considering the OPS measurement chain, a set of images has been acquired, each one corresponding to a specific voltage setting: to calculate the angular displacement of the comb-drive, the first acquired image referred to 0 V, has been compared with the others (i.e., 2 V, 4 V, …, 28 V);
Figure 5a illustrates an example of an image that has been processed by the in-house built software. Considering the LTM measurement chain, the same steps have been carried out. However, in order to calculate the angular displacements, the first acquired image (0 V) has been compared with the other images referred to voltages up to 24 volts (i.e., 2 V, 4 V, …, 24 V) instead of 28 V (as in the previous case);
Figure 5b shows an example of image that has been processed by the in-house software. Considering the OPS, a set of 12 images has been acquired at each voltage, for a total of 180 images; considering the LTM image acquisition system, a set of 16 images has been acquired at each voltage, for a total of 208 images.
The OPS experimental investigation was made before the LTM campaign. Therefore, the testing voltages used in the second campaign have been influenced by the need of not imposing values that could damage the comb-drives, avoiding the pull-in effect. Such phenomenon occurred during the OPS campaign when the applied voltage was greater than 25 V. Above this value the fingers were unstable; in fact, they were used to get in contact quite often, inducing a short circuit.
Despite that the LTM system has a higher digital resolution of the acquired images, its Signal-to- Noise Ratio (SNR) is lower than the OPS SNR. This characteristic can be related to multiple factors, such as environmental noise, light source (i.e., non-homogeneous light source), optical aberrations, image A/D conversion and processing.
3.2. Image Analysis Software
A semi-automatic software has been implemented in Matlab according to the following steps.
- 1.
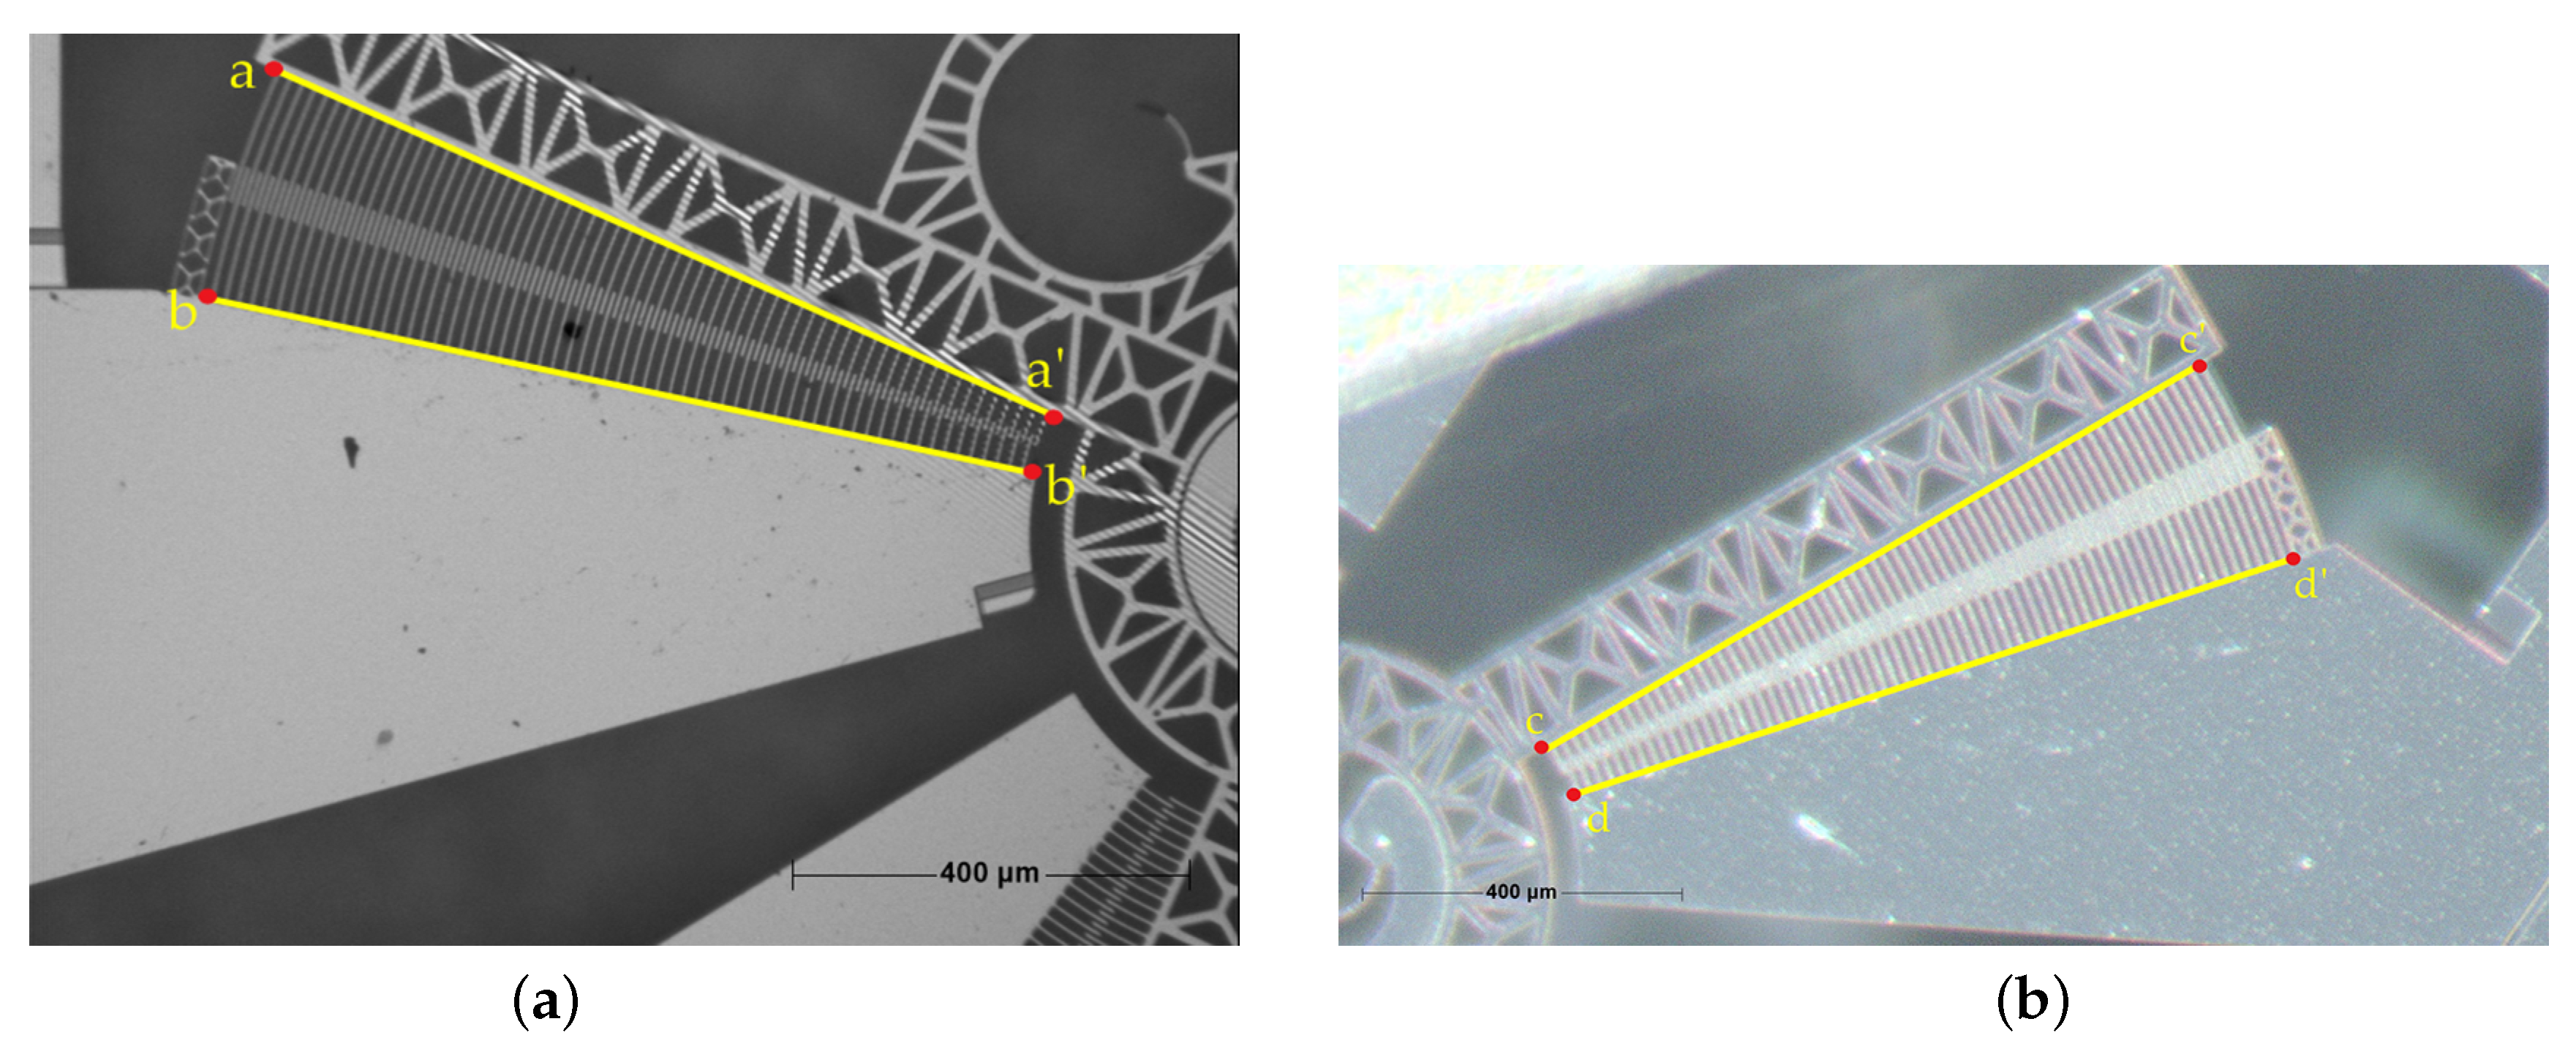
At first, it is important to find the Instant Center of Rotation (ICR) of the DUT comb-drive. Considering the image that corresponds to 0 V (both for OPS and for LTM systems), four point are manually selected (a, a’, b, b’ and c, c’, d, d’) on the edges of the comb-drive and the ICR has been found as the intersection of the two lines (
Figure 6).
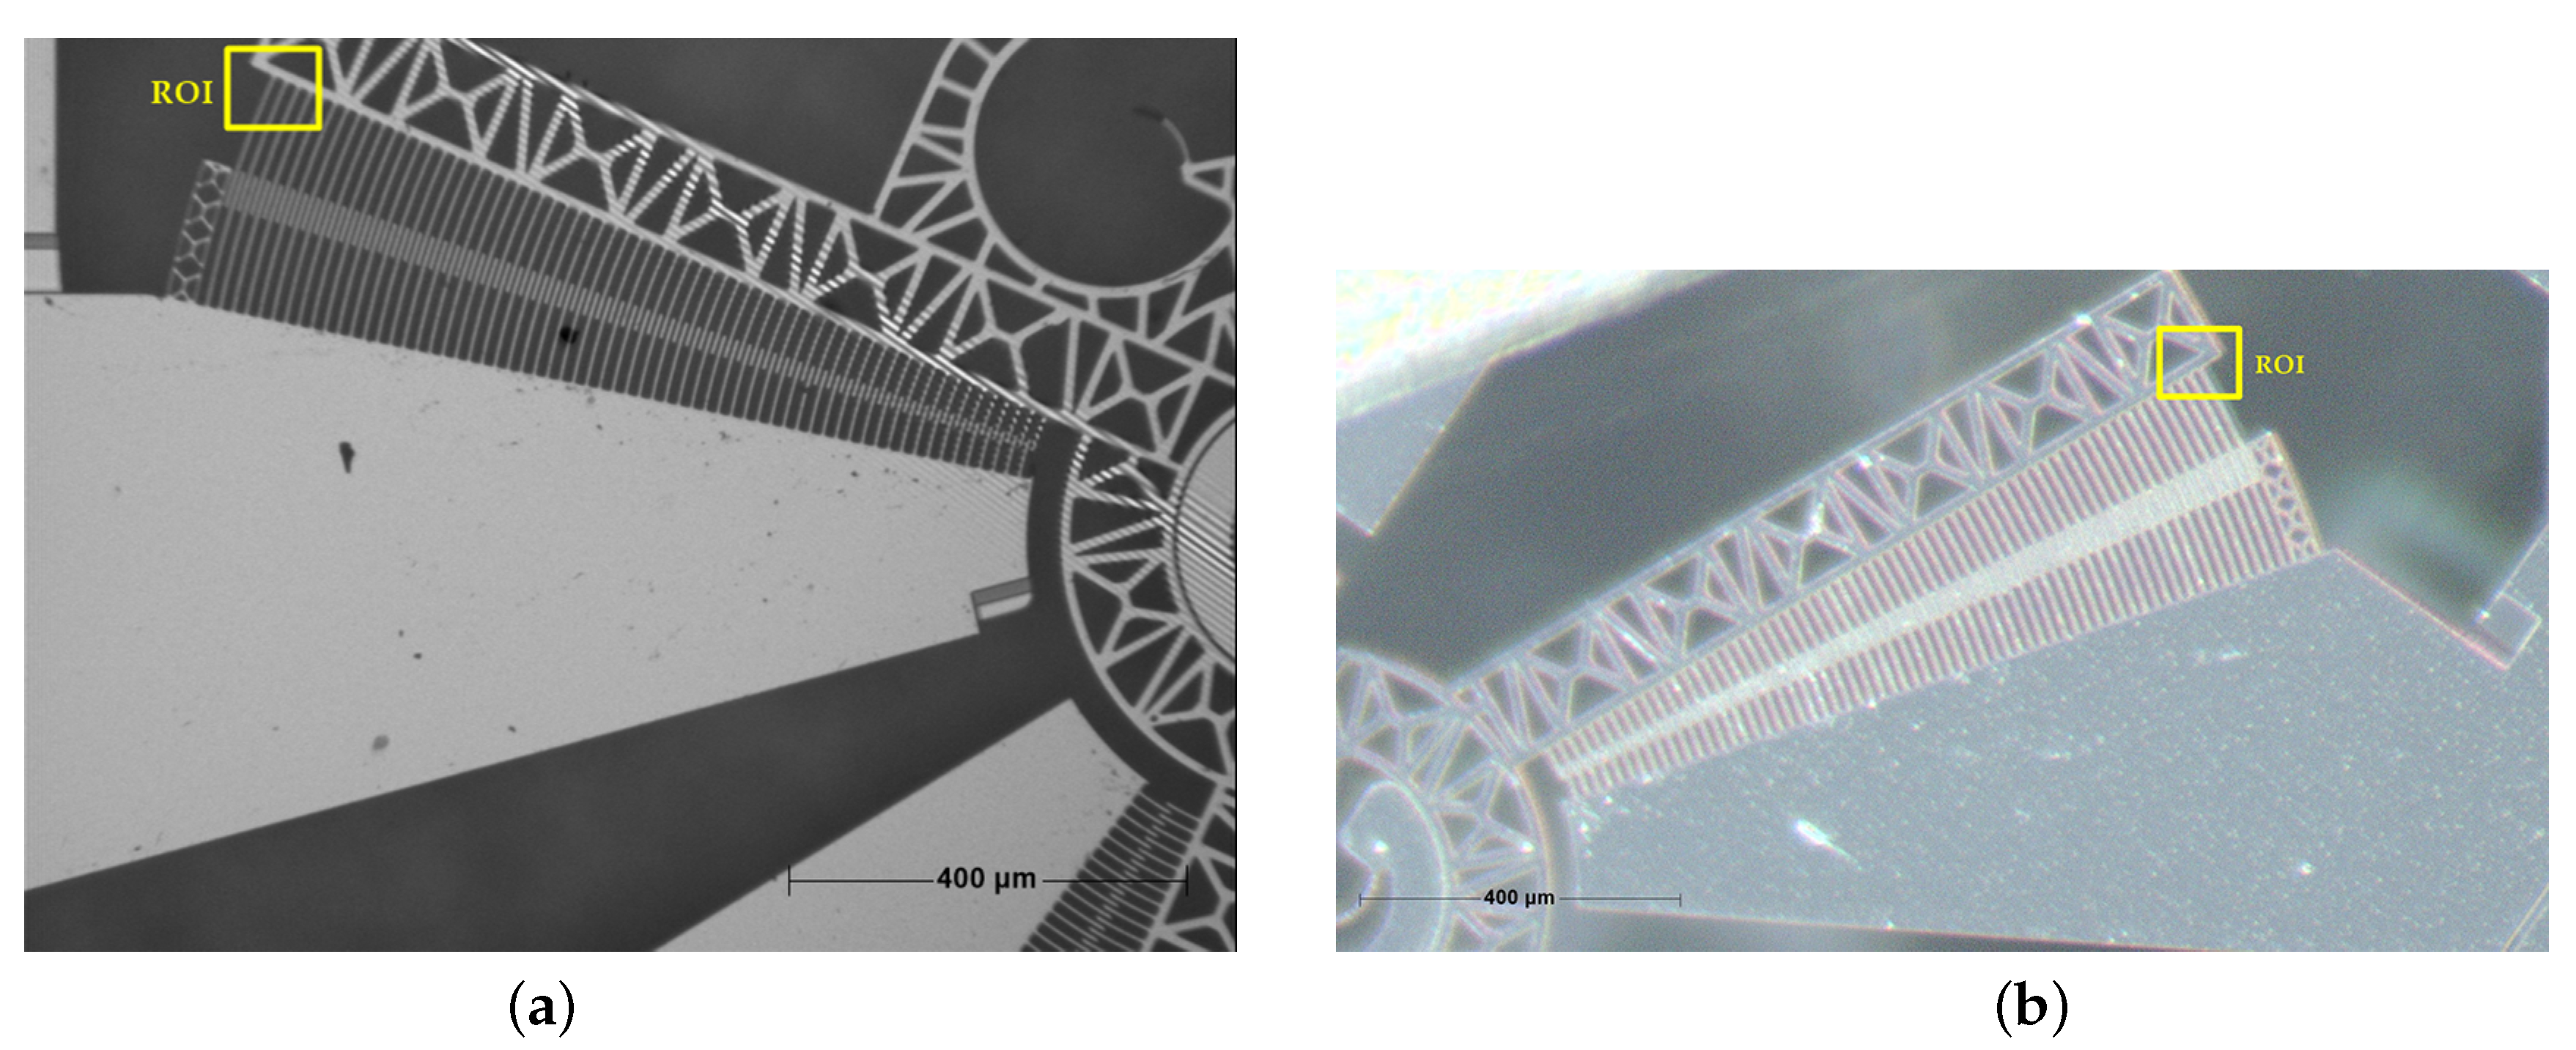
- 2.
The second step regards the manual selection of a particular Region Of Interest (ROI) on the same image considered previously. The identified ROI is characterized by a particular pixel pattern, which is compared with subsequent images (that correspond to 2 V, 4 V, …, 28 V for OPS and 2 V, 4 V, …, 24 V for LTM) to identify where this pattern is located. This procedure is carried out through a template-matching algorithm, which identifies for each image the coordinates of the point corresponding to the center of gravity (COG) of the ROI. This point corresponds to one of the three vertices of the triangle necessary to identify the angular aperture of the device comb-drive. The comb-drive has a static part fixed to the structure of the MEMS device and a mobile part. The ROI has been chosen on the mobile part of the microgripper comb-drive (
Figure 7).
The first and second above described steps of the implemented software are the only ones in which the manual selection of an operator is necessary to properly select points on the images and the positions and dimensions of the ROI. The following ones have been automated.
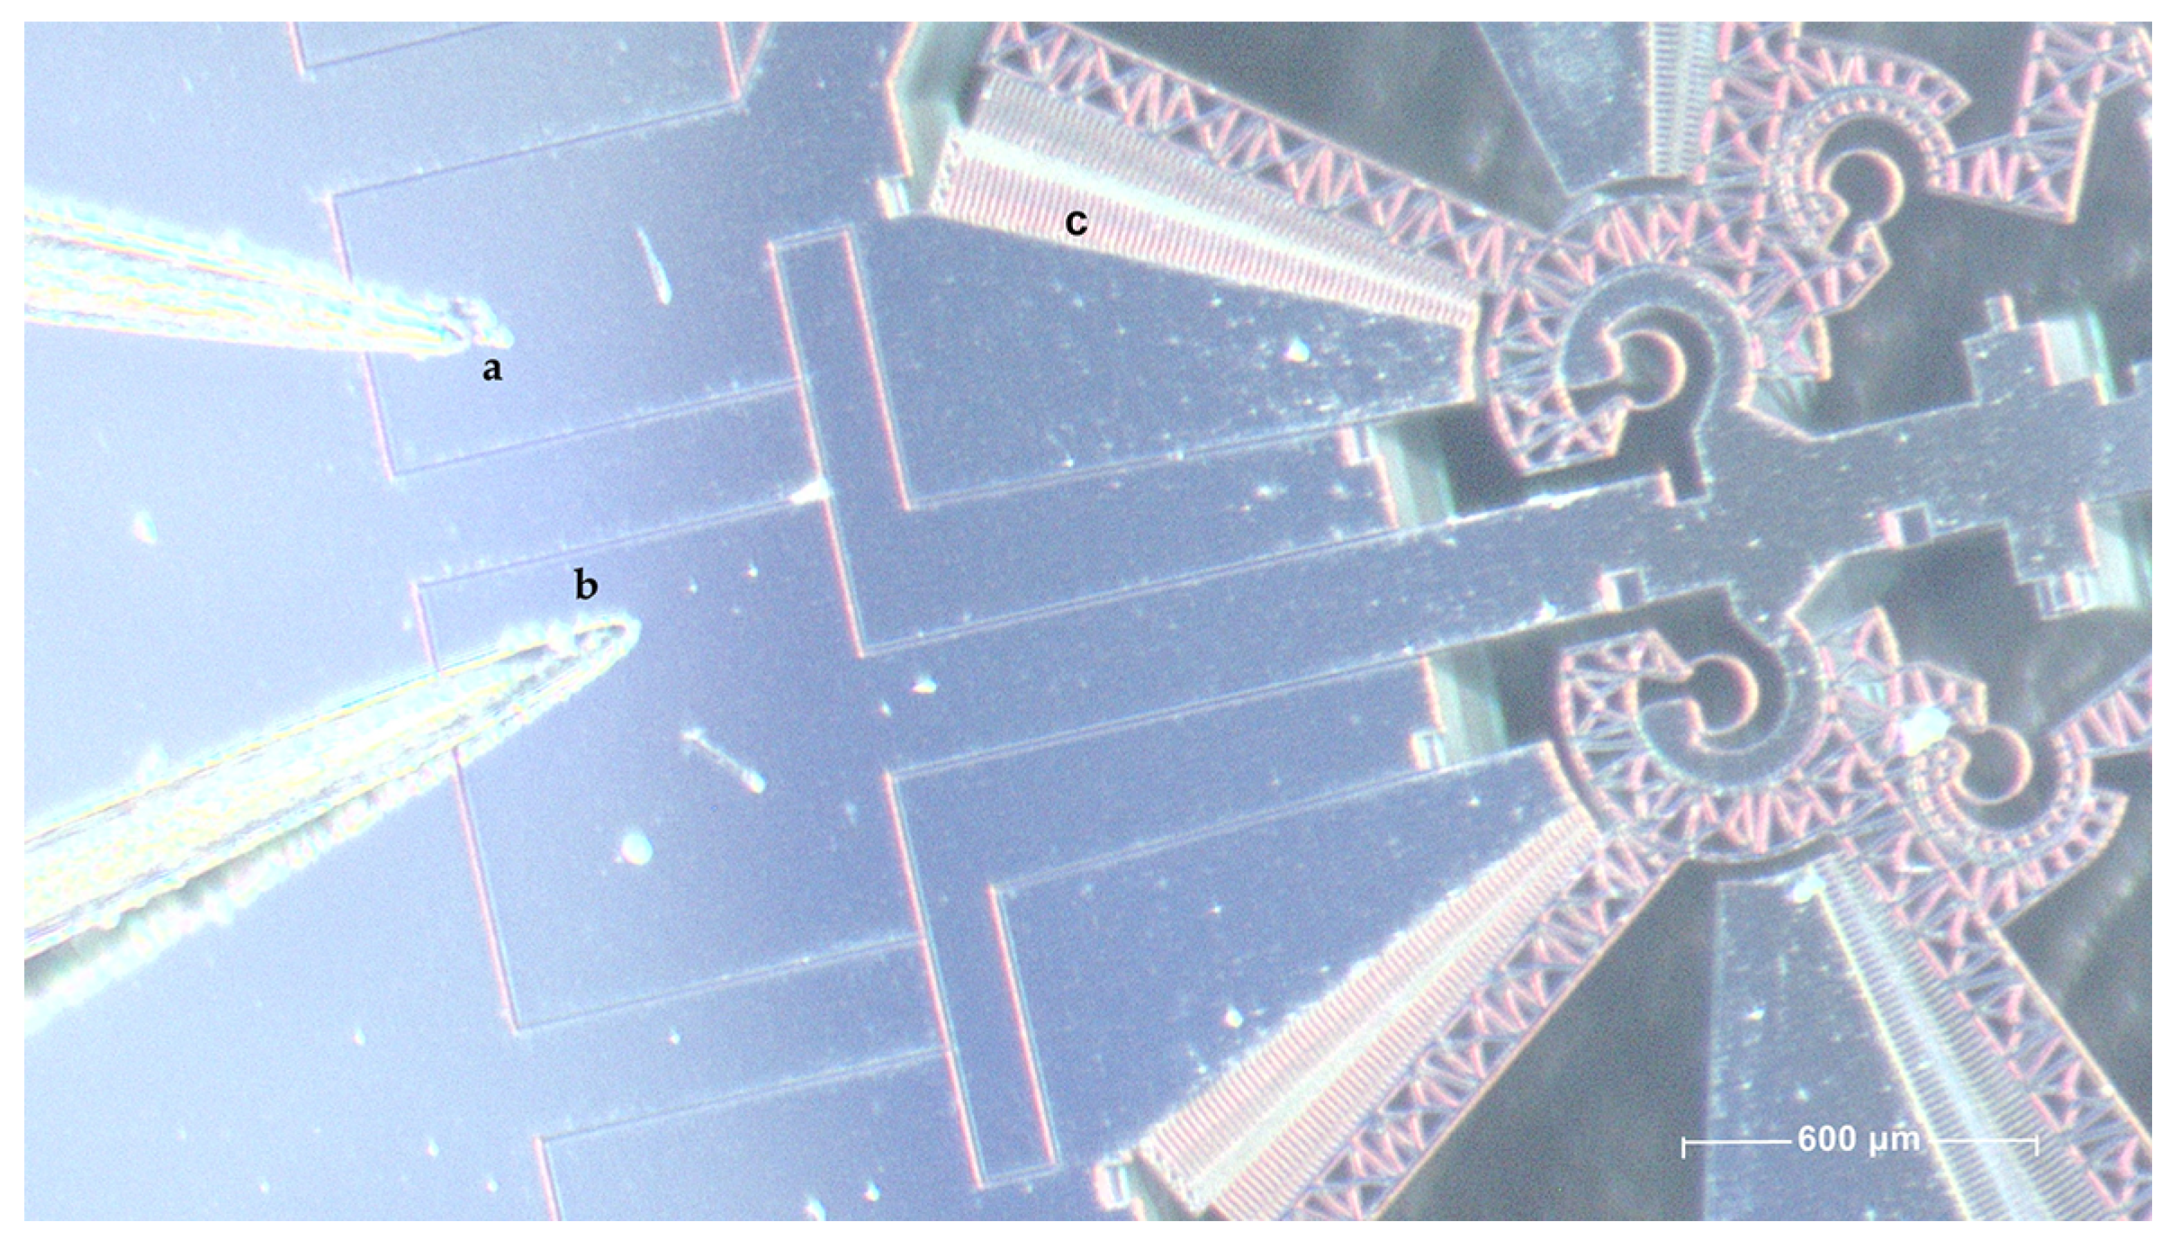
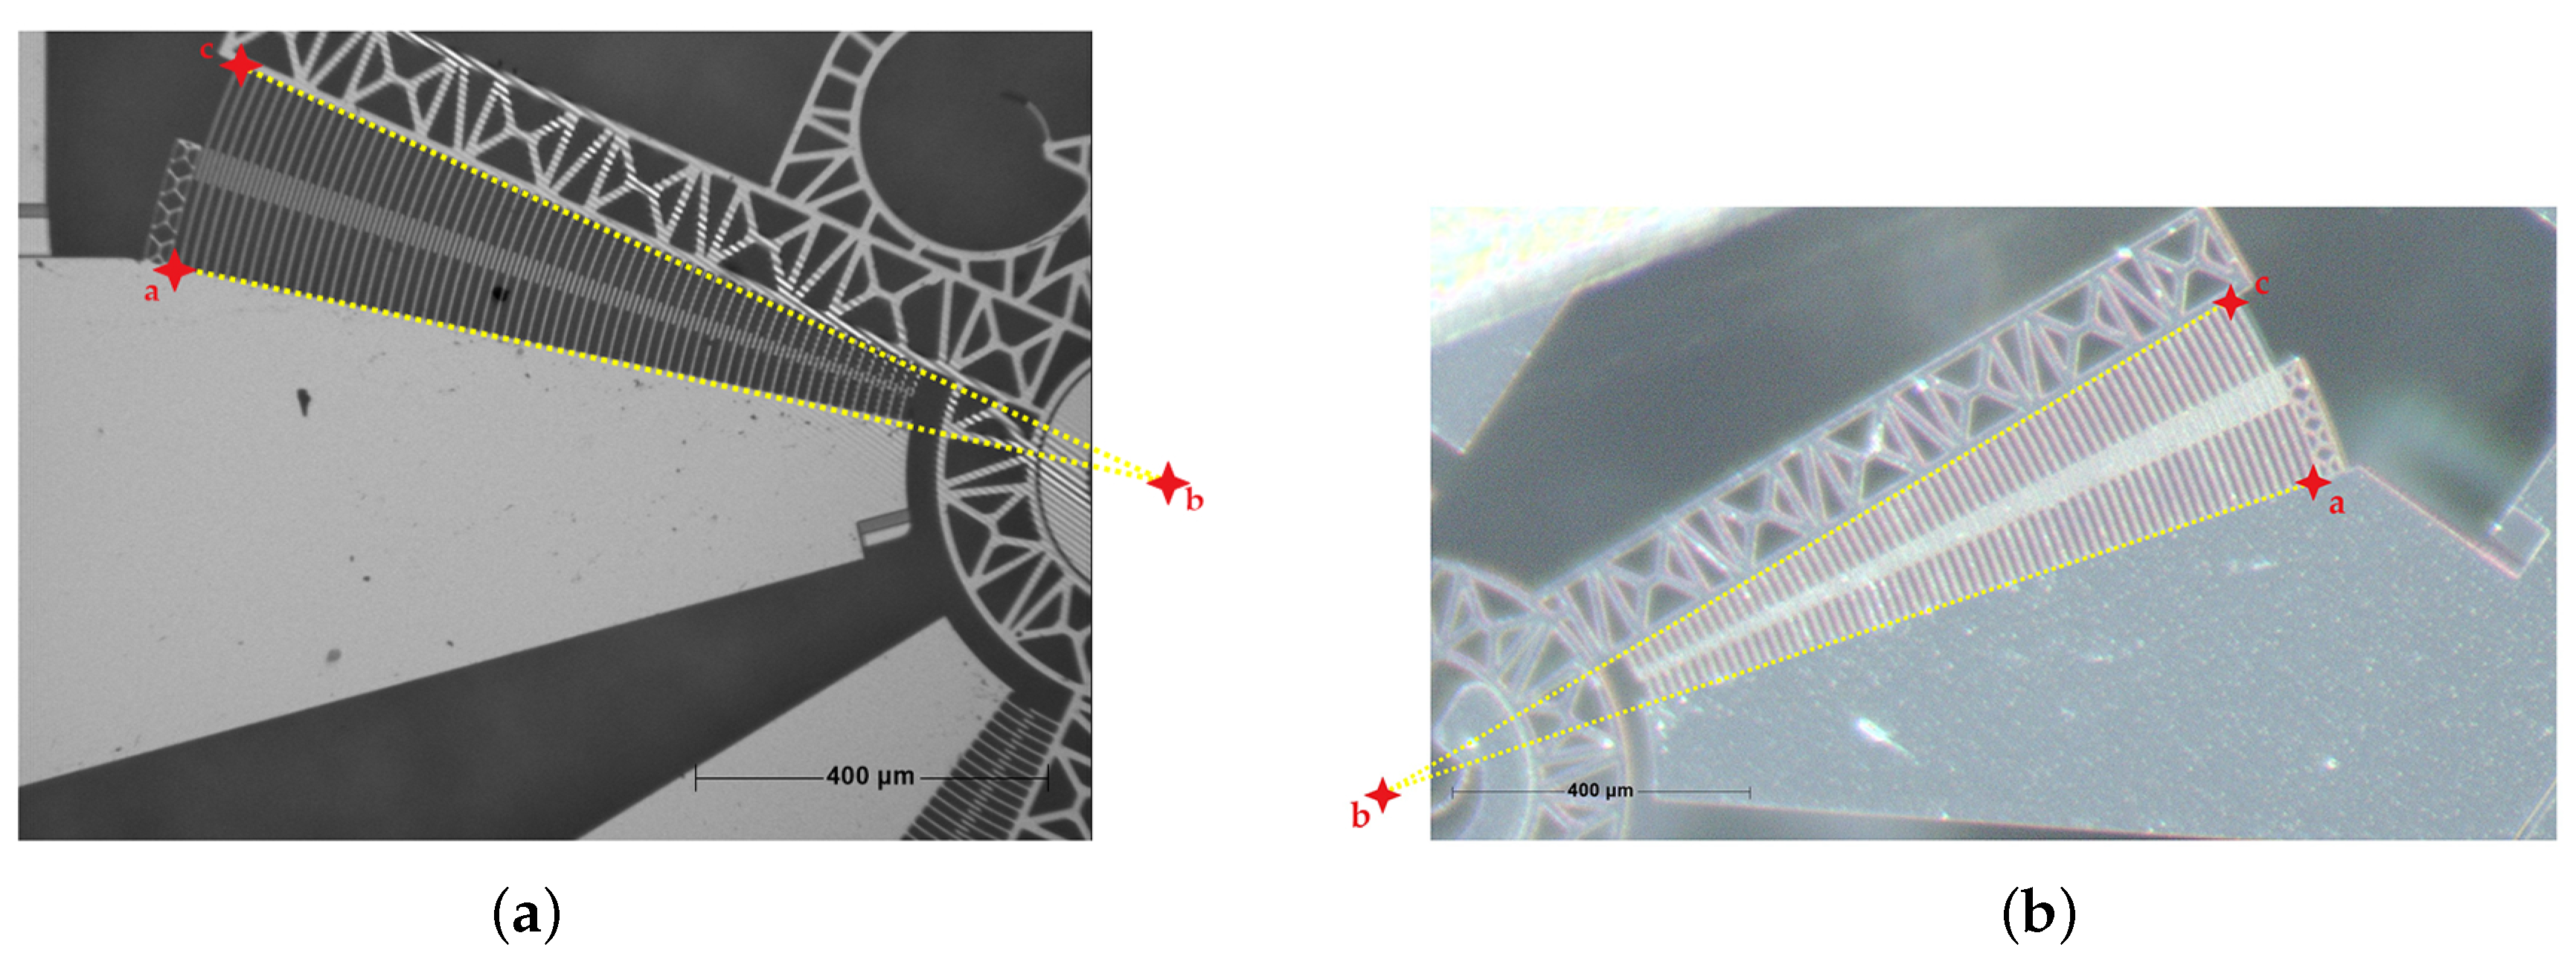
- 3.
As shown in
Figure 8, the automatic part of the implemented software considers the coordinates of the following three points on the images:
The most distant point from the ICR on the fixed part of the comb-drive (a);
The ICR of the comb-drive (b);
The center of the ROI (c);
The first two points remain fixed for all the following images, under the hypothesis of no deformation due to the movement of the comb-drive, while the only point, whose coordinates change for each considered image, is the center of the ROI.
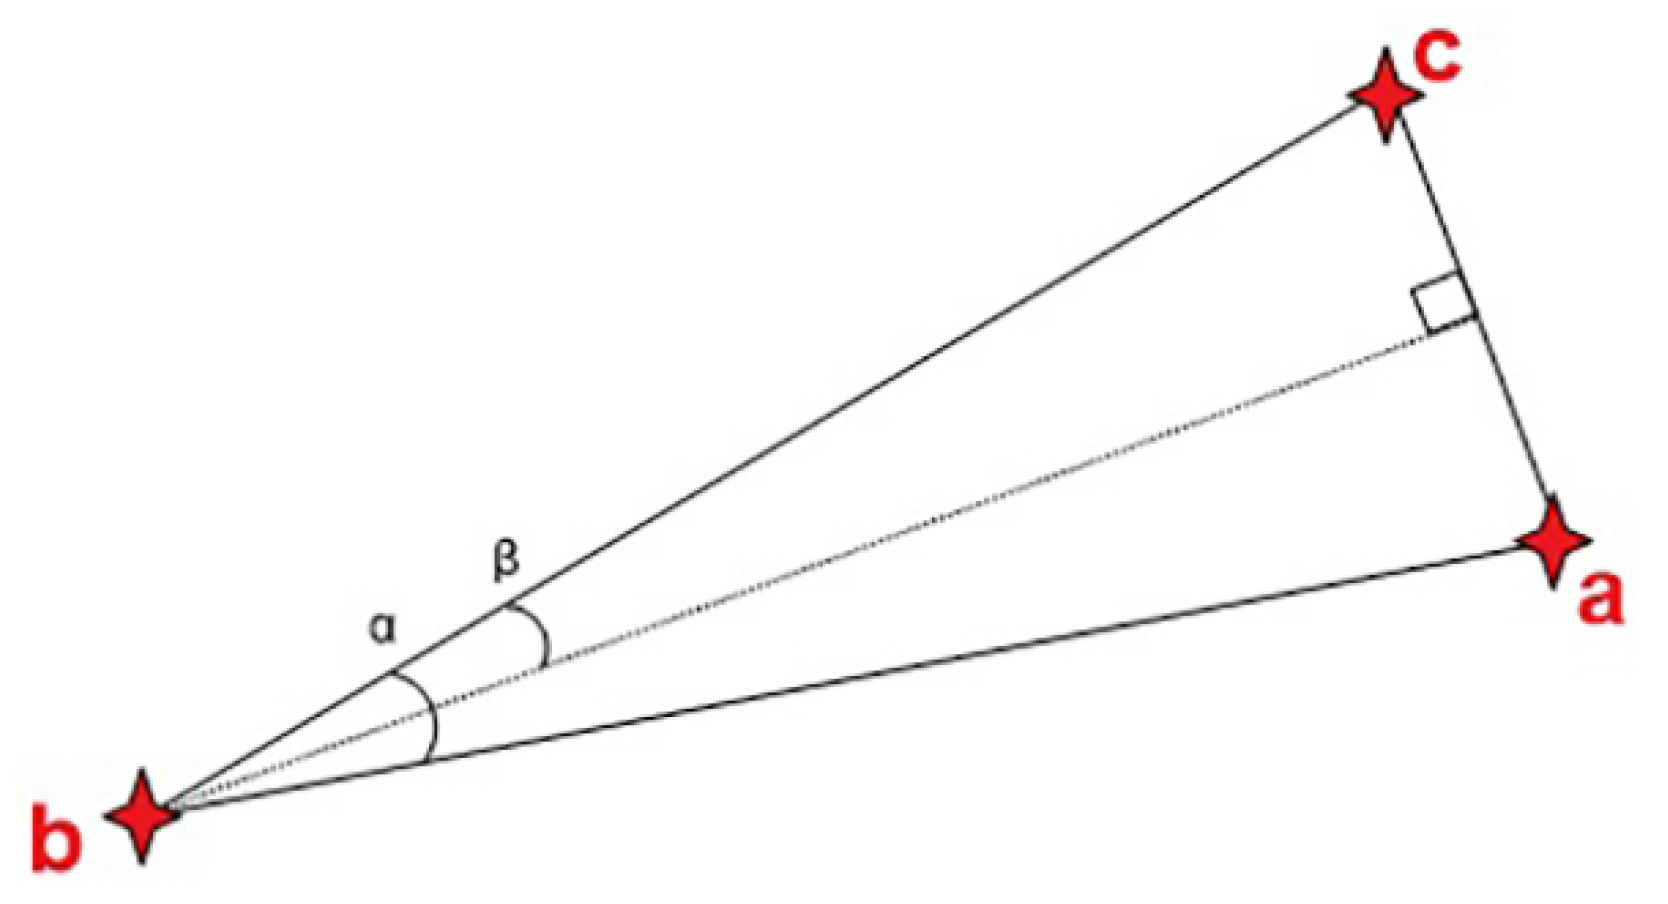
- 4.
These three points determine a triangle, where the vertex ICR corresponds to the angular opening
of the comb-drive. With reference to
Figure 9, points
a,
b and
c are considered to be the vertices of an isosceles triangle, where
with
and
. Using a template matching algorithm, a match is found between the coordinates of the center of the selected ROI on the first image (i.e., that corresponds to 0 V supply) and on all the subsequent images. Through this operation the in-house software detects the new coordinates of the ROI center of gravity (ROIGC) for each subsequent image and therefore for each applied voltage. The ROIGC changes its coordinates and, consequently, it changes also the shape of the corresponding triangle and the angular aperture of the DUT comb-drive, depending on the different voltage supply.
- 5.
The angular displacement is obtained from the comb-drive angular aperture at each voltage value.
The above described software can be used with any type of image. For example, in this study two sets of images have been considered, acquired by the optical profilometer and the light microscope, respectively. The limit associated with this type of analysis is that the procedure provides a first semi-automatic part, which must be carried out by the operator. This approach introduces some sources of uncertainty, due to the variability in selecting the initial points for the determination of the comb-drive ICR, as well as the variability in the selection of the size and position of the Region of Interest, together with the uncertainty of the code itself. These sources of uncertainty will be considered in the next section, where a model will be proposed for the analysis of the uncertainty of both the entire measurement chains.
3.3. A Model for the Uncertainty Analysis of the Measurements
The purpose of this section is to estimate the overall uncertainty associated with the two measurement systems and for this reason a model for measurement uncertainty analysis is proposed; an analysis of the main uncertainty sources of the two measurement setups is carried out and the calculation of the measurement uncertainty relative to the angular displacements of the comb-drive device is performed, both for the profilometer and the light microscope.
For each value of the angular displacements, the mean
and standard deviation of the mean
have been obtained, based on a statistical analysis conducted on a number of observations
for the profilometer and
for the light microscope, for each considered voltage. On the hypothesis that the sample comes from a normal population, a Student’s t-distribution has been used. For the calculation of the overall uncertainty of the measurement systems considered, it is necessary to combine the type A and type B uncertainties [
47], using the following expression:
First, the main uncertainty sources for both measurement systems have been identified and evaluated, as shown in
Table 3, where for each source a probability density function
together with the uncertainty type and mean
m is determined.
3.3.1. Uncertainty Analysis for OPS Measurement Setup
Type A, namely , uncertainty are evaluated by statistical methods (statistical analysis of a series of observations) and have been calculated from standard deviation of the experimental measurements; Type B, , uncertainty are evaluated by means other than the statistical analysis of series of observations. The main sources of type B uncertainty considered are:
Power Supply uncertainty has been evaluated through the data sheet and a Gaussian distribution has been assumed;
OPS uncertainty has been evaluated considering its maximal lateral resolution, limited by diffraction of the light; a uniform distribution with 0.6 m semi-amplitude has been assumed;
Digital image uncertainty has been evaluated considering the digital resolution of the acquired images (0.6 px/
m). A uniform distribution with 2 pixels semi-amplitude has been assumed [
44,
48,
49];
3.3.2. Uncertainty Analysis for LTM Measurement Setup
In this case, still represents Type A uncertainty, whereas are the Type B uncertainty. The main sources of type B uncertainty considered are:
Power Supply uncertainty has been evaluated through the data sheet and a Gaussian distribution has been assumed;
LTM system uncertainty has been evaluated considering its maximal lateral resolution, limited by diffraction of the light; a uniform distribution with 0.6 m semi-amplitude has been assumed.
Digital image uncertainty has been evaluated considering the digital resolution of the acquired images (1.359 px/m). A uniform distribution with 2 pixels semi-amplitude has been assumed.
Uncertainty due to the plane planarity, the focusing plane variation, and the vibration of the DUT have been considered negligible, thanks to optical table with pneumatic vibration isolators that increase the stability of the device and reduce vibrations that could cause an incorrect characterization.
To evaluate the total uncertainty of the two measurement systems, according to Equation (
2), two contributions have been determined: the first is related to the uncertainty contribution evaluable with a statistic analysis of the measurements dispersion obtained with the measurement system (
), while the other is due to the overall uncertainty from the main error sources related to the experimental setup (
). In order to evaluate the
uncertainty, two main contributions have been determined: the first is associated to the derivative of the function that expresses the angular displacement
of the comb-drive with respect to the applied voltage
, multiplied by the uncertainty due to the power supply
, while the other is related to the measurement of the comb-drive angle
[
47]
In particular, a second order polynomial function
where
a,
b, and
c are obtained experimentally, approximates the trend of the angular displacements.
The term
is composed by two terms, the first
is the angle measurement uncertainty due to the OPS and LTM system, associated to the variability of the parameters related to the manual measurement of the lengths
,
,
, and
, carried out by the operator; while the other
, is the angle measurement uncertainty due to the template-matching algorithm of image processing software. This last contribution is evaluated [
44] by means of a Monte Carlo Simulation (with 10,000 iterations) implemented in MATLAB©;
corresponds to
, at 95% confidence level.
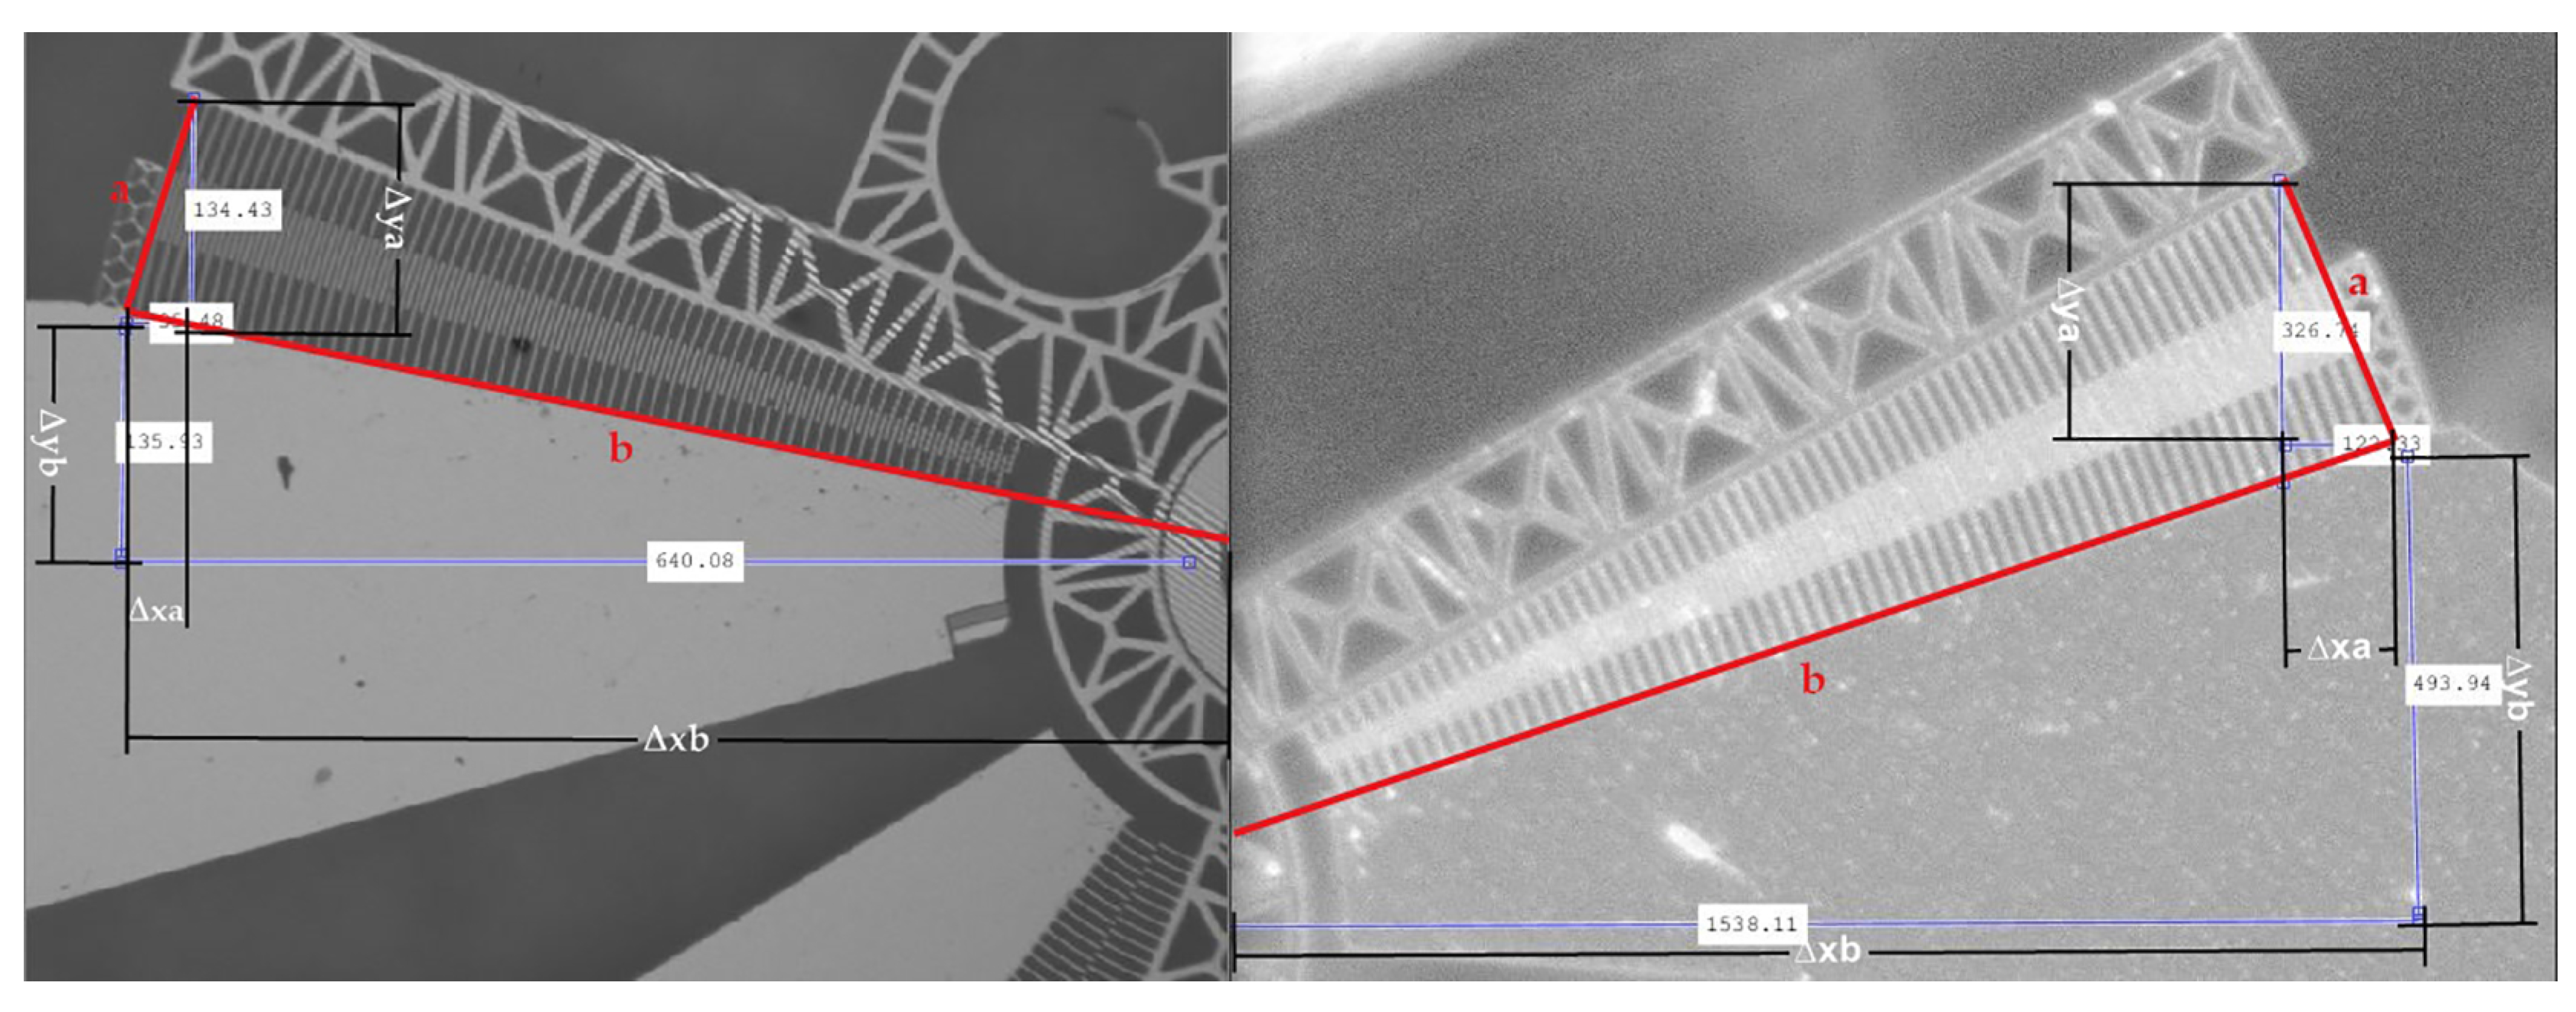
The angle measurement uncertainty
has been measured by means of the triangular properties as shown in
Figure 10. For the measurement of values
,
,
and
, 10 tests were carried out for each of the segments and their mean value has been considered.
The uncertainty related to the light microscope and profilometer error can be obtained as approximated in [
44]:
where
and
The quantities
a and
b in (
7) depend on the image resolution and size. For this study, the lengths of the comb-drive triangle in the profilometer image are considered for the maximum rotation (
), i.e.,
pixel,
pixel,
pixel, and
pixel, therefore
pixel, and
pixel. Instead, the lengths of the comb-drive triangle in the microscope image are considered for the maximum rotation (
), i.e.,
pixel,
pixel,
pixel, and
pixel, therefore
pixel, and
pixel.
4. A Comparison between the Two Measurement Systems
At first, a comparison between the results obtained from the uncertainty analysis for both image acquisition systems has been carried out; from the results obtained through the analysis software it has been possible to collect a series of measurements attributable to the comb-drive angular displacement depending on the voltage supply. In particular, 12 measurements were obtained for each applied voltage value, for the OPS, and 16 measurements for each applied voltage value, for the LTM system. In a second stage, it has been necessary to verify whether the two sets of results are comparable, within the interval of the experimental uncertainties.
To verify the initial hypothesis that, using two different measurement systems, the angular displacement measurement of the comb-drive is the same, the approach described in Ref. [
50] has been followed. Considering the average values, the total uncertainties
of OPS and LTM have been obtained by using Equation (
2) and then reported in the form of standard deviations in
Table 4. The available data are expressed in the form:
where
and
are the mean values of
X and
Y (OPS and LTM measurements, respectively), while
and
represent the measured values according to the standard [
47]. To evaluate whether the two different measurements can be considered consistent or not, it is necessary to find the best estimate for the difference
and establish the highest and the lowest probable values of
. The highest probable value for
is obtained if
assumes its higher probable value,
, and at the same time
assumes its lowest probable value,
. In this way the highest probable value for
is
Similarly, the lowest probable value for
is obtained if
assumes its lowest probable value,
, and at the same time
assumes its highest probable value,
,
Combining (
11) and (
12), the difference between the measured values is
The evaluation of the difference and the sum is fundamental for the sake of our investigation. In fact, if the difference has the same order of magnitude as, or even less than, the sum , then the two different systems, namely OPS and LTM, measure the angular displacement of the comb-drive without significant difference.
5. Results
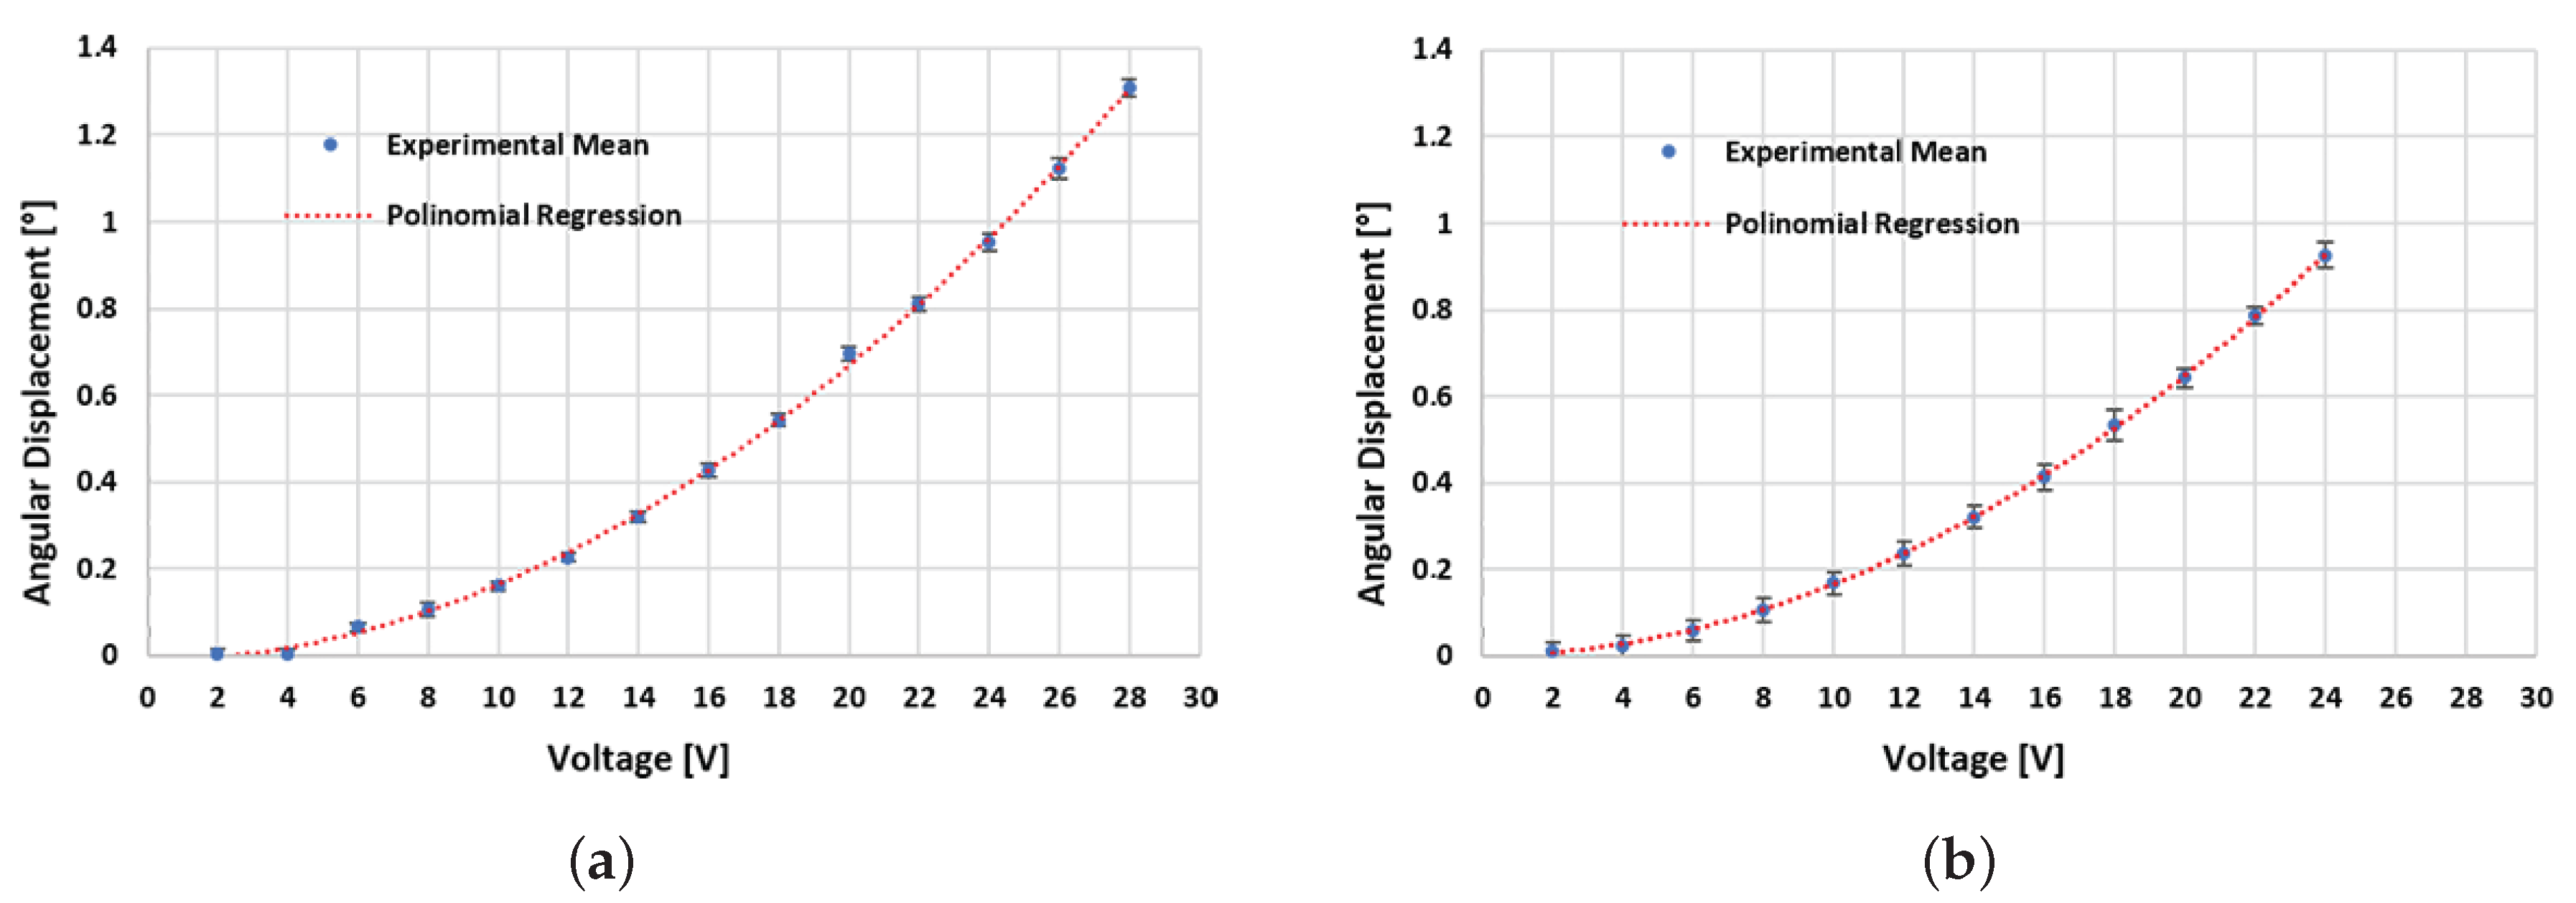
All the measurement data have been processed and interpolated to provide a curve fitting of the motion of the comb-drive depending on the voltage supply; in
Figure 11 the two curves related to the two measurement setups are shown, while the detailed results are reported in
Table 4.
For low values of the voltage, the observations reveal that the microgripper mobile parts face a certain resistance while attempting to move, showing a certain instability. In fact, the torque-voltage function presents an increasing rate of change. This phenomenon is one of the main source of a high dispersion of the results at low values of voltage, while this problem does not occur for higher values (>4 V).
In
Table 5 the results of the comparison between the OPS and LTM systems are shown.
As already observed in Ref. [
44], for the optical profilometer, even if we consider the image acquisition system of the light microscope, it is possible to observe a concordant behavior with the results reported in Refs. [
35,
37].
Second order polynomial regression curves have been determined by a least squares fitting method to describe the outcome from the OPS and the LTM systems: the fitting capacity is confirmed by the high value
coefficients [
51], equal to 0.999 for both the OPS and LTM systems.
The Equations (
3) and (
4) have been used to calculate the type B uncertainty
.
Table 4 shows that above 16 V the total relative uncertainty of the optical profilometer is less than 4.0%, while for the microscope it is less than 7.2%. Since the same software for digital image processing has been used, these results may be mainly related to the two different setups. The greatest contribution in the calculation of uncertainty is given by the
uncertainty, composed by the angle measurement uncertainty due to the OPS and LTM,
, and the angle measurement uncertainty due to the template-matching algorithm of the image processing software
, that correspond to
both for OPS and LTM systems. As mentioned above, the OPS and the LTM generally have different typical values of SNR and this fact is also affecting uncertainty in the two measurement systems.
A second evaluation of the two experimental setups has been conducted; indeed, it has been necessary to evaluate whether the different results relative to the mean values of the angular displacement of the comb drive for the two experimental setups are comparable or not, to properly establish if the two measurement systems produce the same results, based on the verification that the differences between the measured mean values are smaller or comparable with the sum of the original uncertainties.
Table 5 shows that, for each applied voltage value, there is no significant difference between the results obtained by the two methods. It is therefore possible to conclude that the measurements carried out with the OPS and LTM systems can be considered consistent, within the interval of the experimental uncertainties. From the point of view of total relative uncertainty, the results obtained with the profilometer appear to be better than those obtained with the microscope. However, considering the high costs of a profilometer system (about two times higher than the light microscope here used) and also the ease of use of a system such as the light microscope, the latter appears to be the best trade-off system able to carry out performance characterization of a device like microgripper for biomedical application. Furthermore, despite both image acquisition systems being able to characterize the microgripper in operating conditions, only the microscope permits a real-time study; this last feature is certainly the most important because it allows LTM to characterize the device in static and dynamic conditions.
6. Discussion
The first step of this investigation has been the mechanical characterization of a microgripper prototype. The comb-drive angular displacement has been expressed as a function of the applied voltage. Two different measurement systems, OPS and LTM, have been used. Both systems showed that the two rotation-voltage curves follow the same quadratic trend. In order to perform the measurements, a systematic approach has been developed based on in-house built software. This gave rise to a system which has quite high repeatability and low-operator-dependence. Moreover, an analysis of the uncertainties has been carried out, with the construction of a model that considers the main sources of uncertainty present in the measuring setups. The evaluation of the accuracy of the considered setups has shown that for voltages greater than 14 V, the total relative uncertainty of OPS is less than 4.0%, while for the LTM is less than 7.2%. A verification to check whether the two sets of results are consistent, within the interval of the experimental uncertainties has been carried out.
The same in-house software has been used for image processing and therefore the differences in the obtained results are due to the uncertainty of the two image acquisition systems. The main considered contributions were:
Type A uncertainty evaluated by means of a statistic analysis of the measurements results;
the angle measurement uncertainty due to the OPS and LTM systems;
the angle measurement uncertainty due to the template-matching algorithm of image processing software and
the power supply uncertainty .
Despite the obtained results showing that the OPS system has a total relative uncertainty lower than those of the LTM system, the light microscope is still the image acquisition system that will best suit the characterization of MEMS-Technology based microgrippers. In fact, profilometer or electronic microscopy are not practical or even unfeasible for the characterization of these devices in working or in real-time conditions. Therefore, the light microscope is the most promising image acquisition system because it may perform a mechanical characterization, and because of its use in biomedical or surgical real-time scenarios.
7. Conclusions
Nowadays there is a growing need of more accurate and precise devices, especially in microsurgery or diagnostics. The developments of the manufacturing technology offer new tools, such as microgrippers, suitable for a variety of biomedical applications, including minimally invasive surgery. However, SEM observation is impossible in air, wet or liquid environments, while profilometer or OCT measurements are often unpractical or more expensive in operational or real-time scenarios. The aim of this paper is therefore encouraging the use of light microscopes in future investigations, by validating, for the test case, light microscopy as the best trade-off among the characterization accuracy and the need of a large operational range and real time response. The validation method has been applied to a MEMS-technology based microgripper developed earlier by the research group.

 ,
, 


