Abstract
Knowledge of the mechanical and primarily fracture parameters of composites with a brittle matrix is essential for the quantification of their resistance to crack initiation and growth, and also for the specification of material model parameters employed for the simulation of the quasi-brittle behavior of structures made from this type of composite. Therefore, the main target of this paper is to quantify the mechanical fracture parameters of alkali-activated slag composites with steel microfibers and the contribution of the matrix to their fracture response. The first alkali-activated slag composite was a reference version without fibers; the others incorporated steel microfibers amounting to 5, 10, 15 and 20% by weight of the slag. Prism specimens with an initial central edge notch were used to perform the three-point bending fracture tests. Load vs. displacement (deflection at midspan) and load vs. crack mouth opening displacement diagrams were recorded during the fracture tests. The obtained diagrams were employed as inputs for parameter identification, the aim of which was to transfer the fracture test response data to the desired material parameters. Values were also determined for fracture parameters using the effective crack model, work-of-fracture method and double-K fracture model. All investigated mechanical fracture parameters were improved by the addition of steel microfibers to the alkali-activated matrix. Based on the obtained results, the addition of 10 to 15% of microfibers by weight is optimal from the point of view of the enhancement of the fracture parameters of alkali-activated slag composite.
1. Introduction
The global production of cement in 2018 was about 4.1 billion tons []. That immense volume of cement production is related to a very substantial impact on the environment: the carbon dioxide emissions produced by the cement industry contribute up to 8% of worldwide CO2 emissions [].
The majority of Portland cement (PC) is employed to produce concrete, mortars and plasters in the building industry. To decrease cement consumption, supplementary cementitious materials with good hydraulic cementitious properties (especially fly ash and ground granulated blast furnace slag) are often used as partial substitutes for PC in specific applications. They are also employed as constituent parts of blended cements []. The other possibility is to use alternative types of binder. Alkali-activated materials (AAM) are one example of the relatively new binders now being produced via the alkaline activation of different materials of geological origin or by-product materials that are rich in silicon and aluminum. The utilization of secondary raw materials (fly ashes, slags, etc.) or other aluminosilicate materials during alkali activation leads to a decrease in cement consumption, resulting in the more efficient reduction of CO2 emissions and energy consumption. Although the production of alkaline activators is connected with CO2 emissions it is assumed that the global warming potential of alkali-activated composites is approximately 40–70% lower than that of ordinary PC-based composites [,]. AAMs also show good durability compared to Portland cement [,].
Just like materials based on Portland cement, AAMs are quasi-brittle materials that show what is known as tensile softening. The different types of steel, synthetic or natural fibers which are used in Portland cement-based materials [,,,] are added to improve the material’s resistance to crack propagation. Knowledge of the mechanical and primarily fracture parameters of composites with a brittle matrix is essential for the quantification of their resistance to crack initiation and growth, as well as for the specification of material model parameters employed for the simulation of the quasi-brittle behavior of structures or their parts made from this type of composite. Studying the mechanical response of specimens made of such composites under static and dynamic/fatigue loading is complicated due to their highly nonlinear nature. Numerical tools for modeling both elastic (elastic-plastic) behavior, and also the fracture process, are commonly used to predict or assess this response. Such tools—often based on the finite element method [] or physical discretization of the continuum []—usually exploit a type of nonlinear fracture model that simulates the cohesive nature of the cracking of quasi-brittle material [,,]. The parameters of this fracture model are determined from records of fracture tests; this is carried out either using evaluation methods built on the principle of the used non-linear fracture model, e.g., the work-of-fracture method [] or the size effect method [], or using inverse analysis with the possible application of advanced identification methods [,,]. The fracture models for quasi-brittle composites are most often based on the standardized geometry of specimens with stress concentrators; the three-point bending test [] or wedge splitting test [,] are typically used.
As mentioned above, in order to perform the realistic numerical modeling of the response of quasi-brittle composite structures it is essential to determine the parameters of the used material models from experimental measurements. Unfortunately, the literature on the fracture properties of alkali-activated mortars which can be used as suitable inputs for material models is still fairly limited. Most of the published articles are only concerned with the determination of basic mechanical parameters, i.e., compressive and flexural strengths, or in some cases modulus of elasticity [,,,,,,,]. Only a few researchers’ findings connected with the fracture behavior of this kind of material have been published. Goncalves et al. [] presented a study about the crack growth resistance of fiber-reinforced alkali-activated fly ash concrete exposed to extreme conditions. Alomayri [] investigated the effects of glass microfiber content on the mechanical properties of fly ash-based geopolymer. It was found that the optimal amount of glass microfibers is 2 mass% from the point of view of the enhancement of fracture toughness, compressive strength, Young’s modulus and hardness. Ding et al. [,] examined the fracture properties of alkali-activated slag (AAS) and ordinary Portland cement (OPC) concrete and mortar. It was observed that the fracture energy value was lower in the case of AAS mortar, as compared to OPC mortar with the same compressive strength. Sarker et al. [] investigated the effect of geopolymer binder on the fracture characteristics of concrete. The fracture energy of geopolymer determined by the work-of-fracture method was similar to that of the investigated OPC concrete. The critical stress intensity factor was higher in the case of geopolymer compared to OPC concrete with the same compressive strength. Ngyuen et al. [] ascertained that the addition of polypropylene fibers to AAS mortar leads to an increase in fracture energy and fracture toughness compared to mortar without fibers.
Because of the lack of information about the fracture properties of composites with alkali-activated matrix which could be used as relevant inputs for the material model, the main aim of the present work is to determine the fracture parameters of alkali-activated slag composites with steel microfibers and quantify the contribution of the matrix of AAS composites to their fracture response. Five AAS composites were investigated. The first was a reference version without fibers; the others contain steel microfibers amounting to 5, 10, 15 and 20% by weight of the slag. The AAS mixtures were cast into molds with dimensions of 40 × 40 × 160 mm so as to prepare prismatic specimens for use in fracture testing. The fracture characteristics were determined based on the results of three-point bending tests conducted on specimens which were provided with an initial central edge notch before testing. Load vs. displacement (deflection at midspan) and load vs. crack mouth opening displacement diagrams were recording during the fracture tests. Each diagram was processed in order to obtain the component that corresponds to the structural response of the matrix of the composite, which consists of AAS matrix and the steel microfibers reinforcing that matrix. The obtained diagrams were employed as inputs for parameter identification, the aim of which was to transfer the fracture test response data to the required material parameters. Values were also determined for the fracture parameters using the effective crack model [], work-of-fracture method [] and double-K fracture model [].
2. Materials and Methods
2.1. Mixtures
The first alkali-activated slag composite was a reference version without fibers. Granulated blast furnace slag provided by Kotouč, s.r.o. (CZ) was chosen as a binder. The specific surface and mean grain size of the slag were 383 m2/kg and 15.5 μm, respectively. Solid sodium silicate (Susil MP 2.0) fabricated by Vodní sklo, a.s. (CZ) was used to achieve the alkali activation of the slag. The alkaline activator has a molar SiO2/Na2O ratio equal to 2.0, and a SiO2 content of 52.4%. The fine-grained AAS composites were produced using quartz sand with a maximum grain size of 2.5 mm. Brass coated steel microfibers with an average length of 6 mm and a diameter of 0.175 mm supplied by KrampeHarex CZ s.r.o. were used as reinforcement (see Figure 1). The added steel microfibers amounted to 5, 10, 15 and 20% of the weight of the slag.
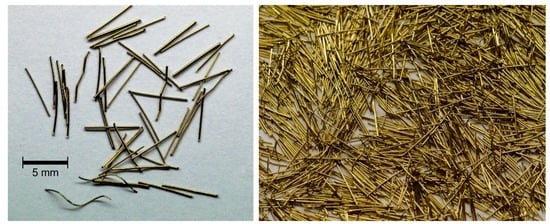
Figure 1.
The used steel microfibers with an average length of 6 mm and a diameter of 0.175 mm.
The AAS mixtures used for casting the prismatic specimens were prepared according to the following previously optimized procedure. At first, solid alkaline activator was suspended in water in which it dissolved partially. Then, the slag and quartz sand were added to the activator and the mixture was stirred in the planetary mixer for about 5 min to provide a fresh slurry. The aggregate to slag ratio was equal to 3.0. Finally, steel microfibers were added to the mixture and further mixed for another 3 min so as to disperse them properly. The AAS mixture composition is presented in Table 1. The designation of individual mixtures is based on their steel microfiber content: SF00, SF05, SF10, SF15, and SF20. Mixture SF00 is a reference mix without steel microfibers.

Table 1.
Composition of alkali-activated slag mixtures.
The prepared fresh mixtures were cast into prismatic moulds of 40 × 40 × 160 mm in size. Three specimens were made from each mixture. After 24 h the hardened specimens were immersed in a water bath at 20 °C for further 27 days. Before the fracture tests were performed, all specimens were pulled out of the water and allowed to dry spontaneously under ambient conditions for 24 h.
2.2. Fracture Test Configuration
The determination of the mechanical fracture parameters of composites with brittle matrix is most often based on fracture tests conducted on specimens of standardized geometry with stress concentrators; the three-point bending test [] or wedge splitting test [,] are typically used. In this case, the three-point bending configuration was chosen because of the availability of testing equipment. Standardized prism specimens with a nominal size of 40 × 40 × 160 mm, which are typically used for the determination of basic mechanical properties of mortars, were used for the fracture tests. An initial notch was cut by a diamond blade saw in the center of the prisms. The nominal depth was about 13 mm. The span length was 120 mm. The fracture tests were performed at the age of 29 days.
A very stiff mechanical testing machine (LabTest 6-1000.1.10, LaborTech s.r.o., Opava, Czech Republic) was used to perform the fracture tests. The stiffness of the testing machine is required to be adequate in comparison to the specimen’s stiffness so as to enable stable fracture tests to be conducted without any interruption in the post-peak branch. The loading was conducted so that displacement occurred in constant increments, which were equal to 0.02 mm/min. This loading procedure is slow enough for the whole post-peak behavior of test specimens to be recorded.
The dependence between loading force and the deflection of the center of the prism specimen (F‒d diagram), as well as crack mouth opening displacement (F‒CMOD diagram), constituted the outputs of the performed fracture tests. The deflection and CMOD values were gauged using an inductive sensor placed above the support and by extensometer placed between blades fixed close to the initial notch, respectively (see Figure 2 and Figure 3). The mentioned parameters together with time were continuously recorded by an HBM Quantum X data logger (HBM, Darmstadt, Germany); the frequency was 5 Hz.
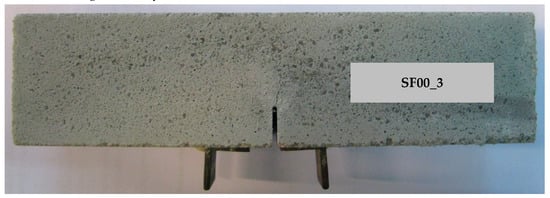
Figure 2.
The selected reference specimen after the fracture test was performed with crack propagation from initial notch; detail of blades fixed close to the initial notch used for measurement of CMOD.
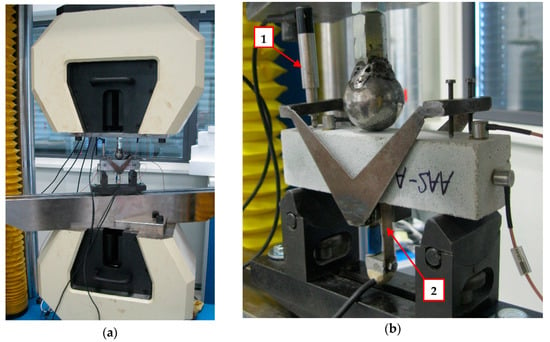
Figure 3.
Fracture test configuration: (a) Overall view of the testing machine; (b) Detail of the positions of measuring sensors (1—deflection sensor fixed in the measurement frame, 2—extensometer).
2.3. Adjustment of Measured F−d and F−CMOD Diagrams
At the beginning of the specimen loading, small-sized deviations in the measured values of monitored parameters are often recorded. This effect is caused by small projections on the specimen’s surface being crushed due to the pressure at the support and loading points. These phenomena usually occur over a short period at the beginning of the loading test, after which the measured diagram proceeds with a linear part. It follows that it is appropriate to adjust the beginning part of the diagram in order to obtain the correct input values for the subsequent evaluation of diagrams using the selected fracture model. The first step is to construct a straight best-fit line for the linear part of the diagram, after which the intersection of the line with the horizontal axis must be pinpointed. The second step consists in the shifting of all points of the diagram equidistantly, thus making the intersection the new origin of the coordinate system.
The adjustment of the recorded diagrams was performed in GTDiPS software (v3.01, developed by Petr Frantík and Jan Mašek, Brno University of Technology, Czech Republic) [], which is based on advanced transformation methods used for the processing of extensive point sequences. The adjustment of diagrams in this case incorporated the erasing of duplicate points, the moving of the origin of the coordinate system, the smoothing of the diagram and the reduction of the number of points.
Thereafter, each diagram was processed to obtain the component that corresponds to the structural response of the matrix of the composite and the steel microfibers reinforcing that matrix. The individual steps of the decomposition procedure are as follows: first, the measured diagram of the steel microfiber-reinforced AAS composite specimen is plotted; then, the last part of this diagram (after the substantial drop in the curve) is assumed to be the result of the contribution of the steel microfibers only and the composite matrix is not expected to have an effect here. That last part is subjected to a straightforward linear regression analysis so that an approximation of the initial part of the diagram can also be obtained (a polynomial function is used here with extrapolation to the origin of the diagram space). Finally, the approximation is subtracted from the recorded diagram, which results in a simulated diagram corresponding to the plain AAS matrix for the next evaluation. A detailed illustration of the used procedure can be found in [].
The above-described procedure was applied to all measured F–d and F–CMOD diagrams. For the purpose of illustration, Figure 4 shows corrected F–CMOD diagrams of AAS composites with various amounts of microfibers. The use of the F–d diagrams after the decomposition procedure is described in the following section.
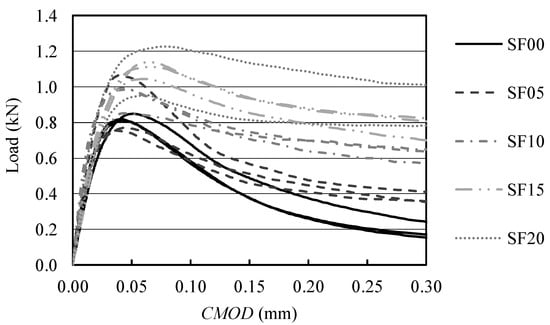
Figure 4.
F–CMOD diagrams of alkali-activated slag (AAS) composites with various amounts of microfibers.
2.4. Identification of Material Parameters
After the previously mentioned adjustment, the F–d diagrams were utilized as input data for parameter identification with the aim of transferring the fracture test response data to the desired material parameters. The FiCubS application [] developed by co-author Petr Frantík was used for this purpose. The FiCubS application is used to simulate the performance of a fracture test in the three-point bending configuration on a fiber-reinforced composite prism with a notch.
Using symmetry, half of the specimen is modeled as an elastic body connected to the plane of symmetry by boundary conditions, which can be released and replaced by cohesive forces. The release of a particular condition occurs after the tensile strength of the material is overstepped. Cohesive forces are dependent on displacements of the released ligament area and on the identified cohesive function. The used cohesive function consists of two components: cohesion provided by the matrix and by fiber resistance. The matrix cohesive function is modeled by the Hordijk function []:
where σ is cohesive stress, ft is tensile strength, w is crack opening displacement, wc is critical crack opening displacement, and c1 and c2 are material constants.
The fiber resistance is modeled by the proposed function:
where σ is the cohesive stress applied for displacement w, σmax is the approximate maximum cohesive stress, wcf is the displacement limit where cohesion disappears and k, p are parameters determining the initial and finite slope. Initial and finite slopes are given by:
The total fracture energy G represented by this function is given by the relation:
From the identified parameters of the model (seven independent values) it was necessary to determine the effective modulus of elasticity of the composite, the tensile strength of the composite, the fracture energy and the coefficient of transverse contraction.
To illustrate, Figure 5 shows F–d diagrams for selected specimens of AAS composite with various amounts of steel microfibers. The following diagrams are plotted in the graphs: a measured diagram of composite reinforced by microfibers (COMP); a simulated diagram corresponding to the plain AAS matrix (MTX); an identified diagram of AAS composite reinforced by microfibers (ID).
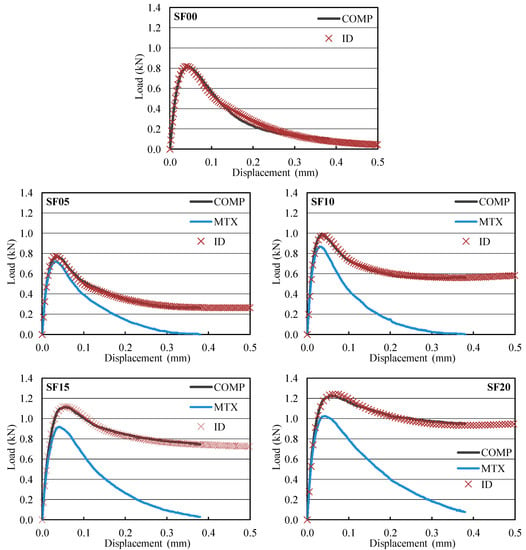
Figure 5.
F–d diagrams for selected specimens of individual AAS composites with various amounts of steel microfibers: COMP—a measured diagram of composite reinforced by microfibers; MTX—a simulated diagram corresponding to the plain AAS matrix; ID—an identified diagram of composite reinforced by microfibers.
2.5. Evaluation of F−d Diagrams
After the previously mentioned diagram adjustment, the ascending linear parts of the F‒d diagrams were utilized to estimate the modulus of elasticity Ec values according to []:
where Fi is load in the ascending linear part of the diagram; di is deflection at midspan corresponding with load Fi; B and D are the breadth and depth of the specimen, respectively; q is the self-weight of the specimen per unit length; S is length of the span and with α0 = a0/D, and Y(x) is the geometry function for the three-point bending configuration [] (a0 is the depth of the initial notch).
The effective fracture toughness KIce was determined based on the F–d diagrams using the effective crack model []. First, the effective crack length ae corresponding with the maximum load Fmax and matching deflection at midspan dFmax was calculated. From the effective crack concept, it follows that the ae can be calculated from rearranged Equation (6) using Fmax and dFmax instead of Fi and di. Subsequently, the effective fracture toughness values were calculated using a linear elastic fracture mechanics formula according to [,]:
where Y(αe) is the geometry function with αe = ae/D [].
The complete F‒d diagrams, including their post-peak parts, were employed to determine the work of fracture WF*, which is given by the area under the F‒d diagram. After that, the specific fracture energy values were determined according to the RILEM method [,]:
2.6. Evaluation of F−CMOD Diagrams
After the previously mentioned diagram adjustment, the double-K fracture model was employed for subsequent evaluation of the F‒CMOD diagrams. The benefit of the double-K fracture model lies in its ability to predict the different phases that occur during crack propagation in quasi-brittle material: crack initiation and both stable and unstable crack propagation. The different phases of the fracture process in quasi-brittle material can be connected with two size-independent parameters: the initiation fracture toughness KIcini and unstable fracture toughness KIcun. The determination of double-K model parameters is based on an approach involving the action of cohesive forces on the faces of the fictitious (effective) crack increment combined with the stress intensity factor criterion (for details refer to (for example) Kumar and Barrai []).
In the instance of the present research, as the first step the unstable fracture toughness KIcun was determined. In the second step, the cohesive fracture toughness KIcc was determined. As the last step, the following formula based on the formerly obtained parameters was utilized to calculate the initiation fracture toughness KIcini:
The exact procedure concerning the determination of cohesive and unstable fracture toughness values can be found in many published works, e.g., [,].
In general, the relation between the cohesive stress and the effective crack opening displacement is given by the cohesive stress function in the cohesive crack model. The cohesive stress at the tip of an initial notch at the critical state can be gained from the softening function. In this study, a non-linear softening function (1) (as stipulated in Hordijk []) was used. The parameters of the softening function were considered to be as follows: the tensile strength ft was considered based on identification described in Section 2.4, the fracture energy was determined according to Equation (8), and the material constants were considered according to [] as being c1 = 3 and c2 = 6.93.
Finally, the load Fini, which expresses the load at the outset of stable crack propagation from the initial crack/notch, was determined according to this relation:
where W is the section modulus (calculated as W = 1/6∙B∙D2), S is span length, F1(α0) is the geometry function for a three-point bending configuration [] and α0 is the a0/D ratio.
3. Results and Discussion
The average values (determined based on 3 independent measurements) and sample standard deviations (given by the error bars) of selected mechanical fracture parameters of AAS composites with different amounts of steel microfibers obtained from F–d and F–CMOD diagrams are summarized in the following figures. The values obtained for the monitored parameters using the above-described non-linear fracture models were determined for composite reinforced by microfibers (COMP) and for the plain AAS matrix (MTX) which results when the decomposition procedure is applied to the measured diagrams. Selected parameters were determined via the inverse analysis of F–d diagrams of AAS composites reinforced by microfibers (ID).
Compressive and tensile strength values gained for AAS composite with different amounts of steel microfibers are shown in Figure 6. The compressive strength was determined according ČSN EN 196-1 [] from two parts of the prismatic specimens obtained after the fracture tests were finished. The reference AAS composite achieved a compressive strength equal to 65 MPa, which is comparable with values gained for alkali-activated slag [] and fly ash-based composite [] that have been published in the literature. The addition of steel microfibers did have a reinforcing effect: compressive strength gradually increased with the addition of microfibers amounting to 5 and 10% by weight. The highest mean value of 93 MPa was obtained for the composite with a 15% microfiber content. However, there is no significant difference between microfiber contents of 10 to 20%.
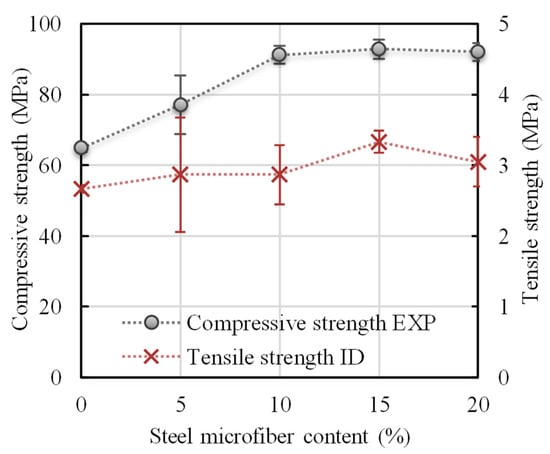
Figure 6.
Compressive and tensile strength of AAS mortar with different amounts of steel microfibers.
The tensile strength value was obtained by identification from measured F–d diagrams. The tensile strength of the reference AAS composite was 2.7 MPa. As in the case of compressive strength, the highest mean value was obtained for the composite with a 15% microfiber content, the increase being about 25% in comparison with composite without fibers.
The modulus of elasticity of the reference AAS composite was 15.1 GPa (see Figure 7), which is comparable with values for alkali-activated slag-based composite published in the literature []. The modulus of elasticity increased with the addition of microfibers by about 30–40%. The highest mean value of 21.1 GPa was reached for the composite with a 5% microfiber content. However, the standard deviation for higher amounts of microfibers is so high that the modulus of elasticity can be considered to be almost the same. The higher standard deviation especially for 20% microfiber content is caused by heterogeneity of material when the uniform dispersion of fibers became more difficult to achieve. The same trend seen for the modulus of elasticity with the addition of microfibers was observed for the values obtained by identification. The identified values are about 5% higher. If only the contribution of plain AAS matrix is taken into consideration, then the modulus of elasticity is up to 5% lower in comparison with AAS composite containing steel microfibers.
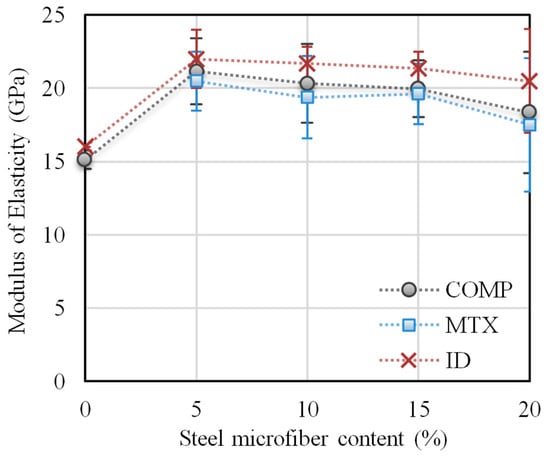
Figure 7.
Modulus of elasticity of AAS mortar with different amounts of steel microfibers.
The fracture toughness values for AAS mortar with different amounts of steel microfibers determined by two different non-linear fracture models are presented in Figure 8a. Fracture toughness gradually increased with the addition of steel microfibers in both cases. The fracture toughness values obtained by both models are the same in the case of microfiber contents of 5–10%. The fracture toughness obtained by the double-K model is about 15% lower in the case of the reference composite and composites with a microfiber content of 15% and more. The fracture toughness of the reference AAS composite is comparable with values gained for alkali-activated slag-based composite with similar compressive strength that have been published in the literature [].
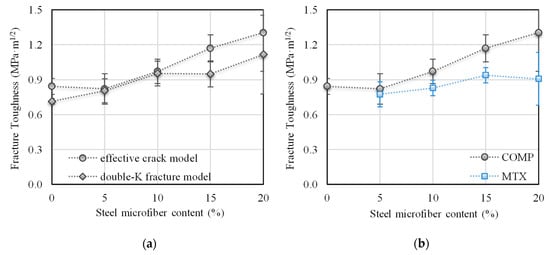
Figure 8.
Fracture toughness of AAS mortar with different amounts of steel microfibers determined by: (a) Two different fracture models; (b) The effective crack model—contribution of plain AAS matrix.
If only the contribution of plain AAS matrix is taken into consideration, then the fracture toughness is about 95, 85, 80 and 70% of the fracture toughness of AAS composites containing steel microfibers SF05, SF10, SF15 and SF20, respectively (see Figure 8b). The same trend was also observed for fracture toughness determined by the double-K fracture model.
The fracture energy values gained for AAS mortar with various amounts of steel microfibers determined by the work-of-fracture method are presented in Figure 9. The specific fracture energy of the reference composite is 113 J/m2, and this gradually increases as the amount of steel microfibers rises. The fracture energy of the reference AAS composite is comparable with that of an AAS composite with similar compressive strength published in the literature []. The highest mean value was obtained for the composite with a 20% microfiber content. This is more than 2.5 times higher than the reference composite value. However, the standard deviation is so high that the value can be considered to be almost the same as for the composite with a 15% microfiber content. The same trend in fracture energy values with the addition of microfibers was observed for values gained via identification. The values obtained in this way are about 15–25% lower in comparison to those obtained via the work-of-fracture method. The sample standard deviation is significantly higher in the case of values determined by identification. If only the contribution of plain AAS matrix is taken into consideration, the fracture energy ranges between 40–50% of that of AAS composite containing steel microfibers.
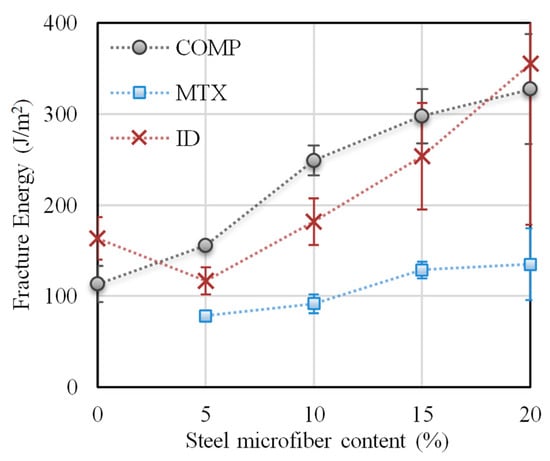
Figure 9.
Fracture energy of AAS mortar with different amounts of steel microfibers.
The KIcini/KIcun ratio (fracture toughness ratio, see Figure 10a), which expresses resistance to stable crack propagation, decreased by about 15% in the case of composite with a steel microfiber content of up to 10%. For composite with a higher steel microfiber content, the fracture toughness ratio is comparable with that of the reference composite.
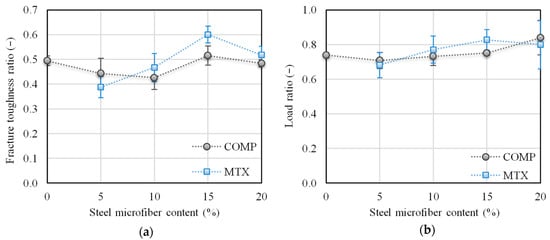
Figure 10.
Fracture toughness ratio (a) and load ratio (b) of AAS mortar with different amounts of steel microfibers.
The ratio between the load at the outset of stable crack propagation and the maximum load obtained during the test (load ratio, see Figure 10b) shows a trend analogous to that of the fracture toughness ratio. The addition of steel microfibers (5% by weight) caused a slight decrease in the load ratio. The load ratio for higher amounts of steel microfibers is comparable with that of the reference composite when standard deviation is taken into consideration.
From the obtained results it is obvious that the addition of steel microfibers has a positive effect on resistance to unstable crack propagation and the post-peak behavior of composite. However, resistance to stable crack propagation is rather negatively affected by the addition of steel microfibers, which can be attributed to the heterogeneity of the specimens which occurs when fibers are added. If only the contribution of plain AAS matrix is taken into consideration, the resistance to stable crack propagation is about 10–15% higher than in the case of AAS composite with a steel microfiber content of more than 10%.
4. Conclusions
Because of the lack of information concerning the fracture properties of composites with alkali-activated matrix which could be used as inputs for material models, the main aim of the present research was to assess the fracture parameters of alkali-activated slag composites with steel microfibers and quantify the contribution of the matrix of AAS composites to their fracture response. The following conclusions can be drawn based on the obtained experimental research results:
- The compressive strength value increased by up to 40% in the case of composite with a steel microfiber content of more than 10%;
- The modulus of elasticity increased with the addition of steel microfibers by about 30–40%. The highest mean value was obtained for the composite with a 5% content of steel microfibers by weight. If a comparison is made between AAS matrix alone and the composite including steel microfibers, it can be seen that the values are almost the same.
Generally, the addition of steel microfibers to AAS matrix should contribute to a lowering in the tendency to crack, and to an enhancement in the tensile properties of AAS based materials. The presented research results are in line with these suppositions:
- The addition of steel microfibers to the AAS matrix caused the resistance to unstable crack propagation expressed here by the fracture toughness to gradually increase by up to 50% for the composite with a 20% content of steel microfibers;
- The steel microfiber-reinforced AAS composites proved to have a much better load carrying capacity after the maximum load is reached in comparison with the reference composite;
- The addition of steel microfibers to the AAS matrix caused the fracture energy value to gradually increase by up to 2.5 times the reference composite value for the composite with a 20% content of steel microfibers; the energy absorption mechanism is related to the de-bonding and pull-out of microfibers that bridge cracks.
Based on the performed study, the addition of 10 to 15% by weight of microfibers to AAS composite is optimal from the point of view of the enhancement of the fracture properties of this composite. The obtained results can be used when designing alternative binders for Portland cement, as well as relevant input data for material models for the realistic numerical modeling of the response of structures or their parts which are made from this type of composite.
Author Contributions
Conceptualization, P.R.; methodology, H.S. and P.F.; software, P.F.; validation, P.R., P.F. and Z.K.; formal analysis, H.S. and P.F.; investigation, P.R., P.S. and H.S.; resources, P.R. and P.S.; data curation, H.S., P.F. and P.R.; writing—original draft preparation, H.S. and P.F.; writing—review and editing, P.R. and Z.K.; visualization, H.S.; supervision, P.R. and Z.K.; project administration, P.R.; funding acquisition, P.R.
Funding
This researcher was funded by the Czech Science Foundation, project No. 16-00567S, and the Ministry of Education, Youth and Sports of the Czech Republic under “National Sustainability Programme I” (project No. LO1408 AdMaS UP).
Conflicts of Interest
The authors declare no conflict of interest.
References
- U.S. Geological Survey. Mineral Commodity Summaries 2019; U.S. Geological Survey: Reston, VA, USA, 2019; 200p. [CrossRef]
- Andrew, R.M. Global CO2 emissions from cement production. Earth Syst. Sci. Data 2018, 10, 195–217. [Google Scholar] [CrossRef]
- McLellan, B.C.; Williams, R.S.; Lay, J.; van Reissen, A.; Corder, G.D. Costs and carbon emissions for geopolymer pastes in comparison to ordinary portland cement. J. Clean. Prod. 2011, 19, 1080–1090. [Google Scholar] [CrossRef]
- Keun-Hyeok, Y.; Jin-Kyu, S.; Keum-Il, S. Assessment of CO2 reduction of alkali-activated concrete. J. Clean. Prod. 2013, 39, 265–272. [Google Scholar] [CrossRef]
- Provis, J.L.; van Deventer, J.S. (Eds.) Alkali Activated Materials: State-of-the-Art Report RILEM TC 224-AAM, 1st ed.; Springer: Dordrecht, The Netherlands, 2014; 388p. [Google Scholar] [CrossRef]
- Shi, C.; Krivenko, P.V.; Roy, D. Alkali-Activated Cements and Concretes, 1st ed.; CRC Press: London, UK, 2003; 392p. [Google Scholar] [CrossRef]
- Johnston, C.D. Fiber-Reinforced Cements and Concretes, 1st ed.; Taylor & Francis Group: London, UK, 2010; 261p. [Google Scholar]
- Zanichelli, A.; Carpinteri, A.; Fortese, G.; Ronchei, C.; Scorza, D.; Vantadori, S. Contribution of date-palm fibres reinforcement to mortar fracture toughness. Procedia Struct. Integr. 2018, 13, 542–547. [Google Scholar] [CrossRef]
- Smarzewski, P. Influence of basalt-polypropylene fibres on fracture properties of high performance concrete. Compos. Struct. 2019, 209, 23–33. [Google Scholar] [CrossRef]
- Kizilkanat, A.B.; Kabay, N.; Akyüncü, V.; Chowdhury, S.; Akça, A.H. Mechanical properties and fracture behavior of basalt and glass fiber reinforced concrete: An experimental study. Constr. Build. Mater. 2015, 100, 218–224. [Google Scholar] [CrossRef]
- Červenka, V.; Jendele, L.; Červenka, J. ATENA Program Documentation—Part 1: Theory; Červenka Consulting: Prague, Czech Republic, 2016. [Google Scholar]
- Frantík, P. FyDiK Application. 2015. Available online: http://fydik.kitnarf.cz/ (accessed on 1 April 2019).
- Bažant, Z.P.; Planas, J. Fracture and Size Effect in Concrete and other Quasibrittle Materials, 1st ed.; CRC Press: Boca Raton, FL, USA, 1998; 640p. [Google Scholar]
- Karihaloo, B.L. Fracture Mechanics and Structural Concrete, 1st ed.; Longman Scientific & Technical: Harlow, UK, 1995; 330p. [Google Scholar]
- Shah, S.P.; Swartz, S.E.; Ouyang, C. Fracture Mechanics of Structural Concrete: Applications of Fracture Mechanics to Concrete, Rock, and Other Quasi-Brittle Materials, 1st ed.; John Wiley& Sons, Inc.: New York, NY, USA, 1995; 592p. [Google Scholar]
- RILEM TC—50 FMC (Recommendation). Determination of the fracture energy of mortar and concrete by means of three-point bend tests on notched beams. Mater. Struct. 1985, 18, 287–290. [Google Scholar] [CrossRef]
- RILEM TC—89 FMT (Recommendation). Size-effect method for determining fracture energy and process zone size of concrete. Mater. Struct. 1990, 23, 461–465. [Google Scholar] [CrossRef]
- Frantík, P. CheCyId Application. 2017. Available online: http://checyid.kitnarf.cz (accessed on 1 April 2019).
- Novák, D.; Lehký, D. ANN inverse analysis based on stochastic small-sample training set simulation. Eng. Appl. Artif. Intell. 2006, 19, 731–740. [Google Scholar] [CrossRef]
- Lehký, D.; Novák, D.; Keršner, Z. FraMePID-3PB software for material parameter identification using fracture tests and inverse analysis. Adv. Eng. Softw. 2014, 72, 147–154. [Google Scholar] [CrossRef]
- Brühwiler, E.; Wittmann, F.H. The wedge splitting test, a new method of performing stable fracture mechanics tests. Eng. Fract. Mech. 1990, 35, 117–125. [Google Scholar] [CrossRef]
- Tschegg, E.K. New equipments for fracture tests on concrete. Mater. Test. 1991, 33, 338–342. [Google Scholar]
- Bagheri, A.; Nazari, A.; Sanjayan, J.G. Fibre-reinforced boroaluminosilicate geopolymers: A comparative study. Ceram. Int. 2018, 44, 16599–16605. [Google Scholar] [CrossRef]
- Nath, P.; Sarker, P.K. Flexural strength and elastic modulus of ambient-cured blended low-calcium fly ash geopolymer concrete. Constr. Build. Mater. 2017, 130, 22–31. [Google Scholar] [CrossRef]
- Marjanović, N.; Komljenović, M.; Baščarević, Z.; Nikolić, V.; Petrović, R. Physical–mechanical and microstructural properties of alkali-activated fly ash–blast furnace slag blends. Ceram. Int. 2015, 41, 1421–1435. [Google Scholar] [CrossRef]
- Aydin, S.; Baradan, B. Effect of activator type and content on properties of alkali-activated slag mortars. Compos. B Eng. 2014, 57, 166–172. [Google Scholar] [CrossRef]
- Rashad, A.M. A comprehensive overview about the influence of different additives on the properties of alkali-activated slag—A guide for Civil Engineer. Constr. Build. Mater. 2013, 47, 29–55. [Google Scholar] [CrossRef]
- Aydin, S.; Baradan, B. The effect of fiber properties on high performance alkali-activated slag/silica fume mortars. Compos. B Eng. 2013, 45, 63–69. [Google Scholar] [CrossRef]
- Natali, A.; Manzi, S.; Bignozzi, M.C. Novel fiber-reinforced composite materials based on sustainable geopolymer matrix. Procedia Eng. 2011, 21, 1124–1131. [Google Scholar] [CrossRef]
- Puertas, F.; Amat, T.; Fernández-Jiménez, A.; Vázquez, T. Mechanical and durable behaviour of alkaline cement mortars reinforced with polypropylene fibres. Cem. Concr. Res. 2003, 33, 2031–2036. [Google Scholar] [CrossRef]
- Goncalves, J.R.A.; Boluk, Y.; Bindiganavile, V. Crack growth resistance in fibre reinforced alkali-activated fly ash concrete exposed to extreme temperatures. Mater. Struct. 2018, 51, 42. [Google Scholar] [CrossRef]
- Alomayri, T. The microstructural and mechanical properties of geopolymer composites containing glass microfibers. Ceram. Int. 2017, 43, 4576–4582. [Google Scholar] [CrossRef]
- Ding, Y.; Dai, J.G.; Shi, C.J. Fracture properties of alkali-activated slag and ordinary Portland cement concrete and mortar. Constr. Build. Mater. 2018, 165, 310–320. [Google Scholar] [CrossRef]
- Ding, Y.; Dai, J.G.; Shi, C.J. Mechanical properties of alkali-activated concrete: A state-of-the-art review. Constr. Build. Mater. 2016, 127, 68–79. [Google Scholar] [CrossRef]
- Sarker, P.K.; Haque, R.; Ramgolam, K.V. Fracture behaviour of heat cured fly ash based geopolymer concrete. Mater. Des. 2013, 44, 580–586. [Google Scholar] [CrossRef]
- Nguyen, H.; Carvelli, V.; Adesanya, E.; Kinnunen, P.; Illikajnen, M. High performance cementitious composite from alkali-activated ladle slag reinforced with polypropylene fibers. Cem. Concr. Compos. 2018, 90, 150–160. [Google Scholar] [CrossRef]
- Kumar, S.; Barai, S.V. Concrete Fracture Models and Applications, 1st ed.; Springer: Berlin, Germany, 2011; 262p. [Google Scholar] [CrossRef]
- Frantík, P.; Mašek, J. GTDiPS Software. 2015. Available online: http://gtdips.kitnarf.cz/ (accessed on 24 August 2018).
- Havlíková, I.; Frantík, P.; Schmid, P.; Šimonová, H.; Veselý, V.; Abdulrahman, A.; Keršner, Z. Components of Fracture Response of Steel Fibre Reinforced Concrete Specimens. Appl. Mech. Mater. 2016, 827, 287–291. [Google Scholar] [CrossRef]
- Frantík, P. FiCubS Application. 2017. Available online: http://ficubs.kitnarf.cz (accessed on 2 October 2018).
- Hordijk, D.A. Local Approach to Fatigue of Concrete. Ph.D. Thesis, Technische Universiteit Delft, Delft, The Nederlands, 1991. [Google Scholar]
- Nallathambi, P.; Karihaloo, B.L. Determination of specimen-size independent fracture toughness of plain concrete. Mag. Concr. Res. 1986, 38, 67–76. [Google Scholar] [CrossRef]
- Karihaloo, B.L.; Abdalla, H.M.; Imjai, T. A simple method for determining the true specific fracture energy of concrete. Mag. Concr. Res. 2003, 55, 471–481. [Google Scholar] [CrossRef]
- Zhang, X.; Xu, S. A comparative study on five approaches to evaluate double-K fracture toughness parameters of concrete and size effect analysis. Eng. Fract. Mech. 2011, 78, 2115–2138. [Google Scholar] [CrossRef]
- ČSN EN 196-1 Methods of Testing Cement—Prat 1: Determination of Strength; ÚNMZ: Prague, Czech Republic, 2016.
- Al-mashhadani, M.M.; Canpolat, O.; Aygörmez, Y.; Uysal, M.; Erdem, S. Mechanical and microstructural characterization of fiber reinforced fly ash based geopolymer composites. Constr. Build. Mater. 2018, 167, 505–513. [Google Scholar] [CrossRef]
© 2019 by the authors. Licensee MDPI, Basel, Switzerland. This article is an open access article distributed under the terms and conditions of the Creative Commons Attribution (CC BY) license (http://creativecommons.org/licenses/by/4.0/).