Article

Risk Factors for Distortion Product Otoacoustic Emissions in Young Adults

1
School of Speech, Language, and Hearing Sciences, San Diego State University, San Diego, CA 92182, USA
2
School of Social Work, College of Health and Human Services, San Diego State University, San Diego, CA 92182, USA
*
Author to whom correspondence should be addressed.
Appl. Sci. 2019, 9(8), 1608; https://doi.org/10.3390/app9081608
Submission received: 9 March 2019 / Revised: 10 April 2019 / Accepted: 13 April 2019 / Published: 18 April 2019
(This article belongs to the Special Issue Theoretical and Clinical Applications of Otoacoustic Emissions)

Abstract

:
Young adults with normal hearing may exhibit risk factors for hearing loss. The purpose of this study was to evaluate how self-reported personal music (PM) system volume use, preferred listening level, and self-reported alcohol use affects distortion product otoacoustic emissions (DPOAEs). Two-hundred, sixteen young adults, 161 women and 55 men, participated. Questionnaire data included the PM system and alcohol use. DPOAEs were obtained from 1–6 kHz and collapsed into 1/3rd octave bands and a probe microphone was used to determine preferred listening level. Alcohol was defined as drinks per month (DPM), categorized as No, Light (≤14), and Heavy (>14). Men who reported loud/very loud volume use had statistically significant lower DPOAEs at 1.5, 2, and 3 kHz than men who reported lower volume use. Light and Heavy DPM men had lower DPOAEs at 1.5, 2, and 3 kHz than no DPM men, but this was not statistically significant. There were no DPOAE differences for either variable in women and there was no association between preferred listening level and DPOAEs for women or men. Men who reported loud/very loud volume use and any DPM had poorer mid-frequency DPOAEs. There was not an association for volume use or DPM and DPOAEs in women.

1. Introduction

There is an increase in the research involving young adults, their use of personal music (PM) systems with earphones, and the possible effects on the auditory system. Exposure to recreational noise has risen significantly because of the high percentage of young, college-aged adults (between 90–95%) who report using digital PM systems [1,2]. Listening habits of young adults, using questionnaire data has been obtained [1,2,3,4,5]. Specifically, Zogby [3] reported fewer than 50% of young adults listened to a PM system up to one hour for a single session and others have found 70–75% of young adults reported single listening sessions of one hour [2,4]. Portnuff et al. [5] did find that young adults reported, on average, over 14 h a week of listening to a PM system with earphones. PM system use with earphones is a recreational noise exposure that is an intermittent and variable exposure unlike occupational noise exposure; however, the level at which this use occurs is also a critical component.
Researchers have been objectively evaluating the preferred listening levels of young adults using probe microphone measures [1,6,7,8,9,10], although few have adjusted these measures for a closed canal and diffuse or free field equivalent [7,9,10]. The researchers that did these conversions all reported that preferred listening level was approximately 70 dBA, although all were measured in the presence of a quiet background. These preferred listening levels, however, are considered well below those that would be defined as hazardous, albeit from an occupational noise exposure perspective [11,12].
Torre and Reed [10] collected preferred listening level data within a sound-treated room in an auditory research lab space. Participants were allowed to change musical tracks or adjust the volume, but this setting is not a place young adults would likely listen to music for an hour. Allowing the participants to change tracks and volume during the hour was to replicate a real-world listening condition, but when using a PM system, there is some type of background noise present, especially on a university campus. In these types of listening environments, young adults will turn the level up [7,9]. In fact, 25% (39 of 155) of university students reported having a lot of trouble hearing people or cannot hear people while wearing a PM system with earphones [10].
Torre and Reed [10] further evaluated how well young adults assessed their PM system use by comparing answers to volume-specific questions to measured levels using a probe microphone. Almost 90% of young adults who reported loud or very loud volume with a PM system, listened at >85 dBA; and 83% of those that reported have a lot of trouble hearing people or cannot hear people while using a PM system listened at >85 dBA. These data show that questionnaires can be used to identify potentially risky listening behaviors in young adults.
Thus, young college-aged, adults are very likely to be using PM systems with earphones, although they might not be listening at hazardous levels, and subjectively, they can rate their volume habits accurately. The effects of these listening habits on distortion product otoacoustic emissions (DPOAEs) has been mixed. Some researchers have shown an effect of PM system use on distortion product otoacoustic emissions (DPOAEs) [13] whereas others have not [14,15], even in the presence of normal hearing sensitivity. Because some young adults do not demonstrate preferred listening levels with a PM system that might be considered at risk, are these young adults involved in other risk exposures that might contribute to subclinical damage to the cochlea (i.e., DPOAEs)? In other words, do college-aged young adults participate in activities where there is a likelihood of extensive background noise that can affect DPOAEs?
One behavior of young adults linked to extensive background noise is the consumption of alcohol; particularly the consumption of alcohol in bar environments. Alcohol use in college-aged young adults most likely occurs in a bar or nightclub setting or within a private residence (“house party”) [16,17]. In young adults, aged 19–28 years, 68.4% reported using alcohol in the last 30 days and 5.4% reported daily use of alcohol in the last 30 days [18]. Average noise levels measured in a bar setting are approximately 96 dBA with levels as high as 108 dBA [19]; to date, there is not any research on noise levels measured within “house parties”. There is evidence linking loud music to increased alcohol consumption and alcohol-related harms. Specifically, in a systematic review of studies, Hughes and colleagues [20] found participants drank faster and consumed more alcohol in bar venues with noisy, loud music. In a laboratory-based study, female participants consumed alcoholic beverages faster in the presence of music [21]. Similarly, males consumed more beer and drank beer at a faster rate when drinking in a bar environment with loud music relative to quieter bar environments [22]. Furthermore, in a field study conducted within 66 college parties, Clapp and colleagues [23] found no relation between the presence of loud music and a higher level of alcohol intoxication; however, given the subjective ratings of music volume, this result is not unexpected. Overall, it appears exposure to loud music in bar environments is associated with increased alcohol consumption as well as an increased rate of consumption in both men and women.
The purpose of this study was to evaluate specific risk factors in these adults and the possible association with DPOAEs. The specific research questions were: (1) Is self-reported volume use associated with differences in DPOAEs in young, college-aged adults with normal hearing?; (2) Is preferred listening level, using a probe microphone, associated with differences in DPOAEs in young, college-aged adults with normal hearing?; and (3) Is self-reported alcohol use associated with differences in DPOAEs in young, college-aged adults with normal hearing?

2. Materials and Methods

2.1. Participants

As observed in Table 1, a total of 216 San Diego State University (SDSU) undergraduate students were recruited from Exercise and Nutritional Sciences, Public Health, and Social Work courses (i.e., non-Speech, Language, and Hearing Sciences courses). There were 161 women (mean age = 21.0 years, SD = 2.7 years) and 55 men (mean age = 20.9 years, SD = 3.1 years) who volunteered for the study and received extra credit in their course for their participation. Almost 30% (n = 64) of participants reported their ethnicity as Hispanic or Latino and 150 (69.4%) participants reported their ethnicity as Not Hispanic or Latino, 2 (1.0%) declined to state ethnicity. Participants also had the opportunity to provide racial background data (Table 1).

2.2. Procedures

These data are a portion of the data that were included in the Risk Factors for Hearing Loss in Young Adults Study approved by the SDSU Institutional Review Board. Once informed consent was obtained, research assistants administered The Risk Factors Survey. Due to the sensitivity of some of the survey questions, all data collected were anonymous. In addition, participants were told to refrain from loud noise exposure for 24 h in advance of their participation.

2.3. Measures

A section of this survey included demographic questions of sex, age, ethnicity, race, and questions specific to PM system use. If the participant answered “No” to the question, “Do you listen to a personal music system using earphones?” then that part of the survey was not completed. If “Yes”, then additional questions regarding the type of earphone used, typical duration of listening, longest single use during the day, most common volume used, and if they noticed any problems (e.g., ringing, hearing loss) after using a personal music system were completed. Two of the closed-set survey questions of interest in this study were: “For a typical day, what is the most common volume used during this day?” “Low”, “Medium/Comfortable”, “Loud”, or “Very Loud”; and “Do you listen to your personal music system at a volume where you…” “Easily hear people”, “Have a little trouble hearing people”, “Have a lot of trouble hearing people”, or “Cannot hear people”.
Alcohol use was determined as part of The Risk Factors Survey. For the alcohol questions, a drink was defined as 12 ounces of beer, 5 ounces of wine, or one shot of liquor or a drink containing liquor. These alcohol questions were included from ones developed from a National Institute on Alcohol Abuse and Alcoholism task force that generated recommended sets of alcohol consumption questions [24]. Participants who indicated alcohol consumption during the past 30-days were asked to report the number of days during the past month they consumed a drink containing alcohol as well as the number of drinks they usually consumed when they drank.
All participants were seated in a double-walled sound-treated room (Industrial Acoustics Company, Inc., North Aurora, IL, USA) for pure-tone air-conduction testing. Using supra-aural earphones (TDH-50P) connected to a clinical audiometer (GSI 61; Grason Stadler, Inc., Eden Prairie, MN, USA), binaural pure-tone air-conduction testing was completed from 0.25 through 8 kHz, including 3 and 6 kHz. All participants had normal hearing (≤20 dB HL) based on pure-tone audiometry and normal middle ear function, confirmed with a type A tympanogram, binaurally, based on the tympanogram peak pressure range of +55 and −90 daPa and the peak acoustic admittance range of 0.3 and 1.8 mmho. The test ear was randomly determined for all subsequent research procedures.
While the participant remained in the sound-treated room, a probe assembly was placed in the ear canal of participants and the participants were instructed to remain quiet during the procedure and there was no response needed. DPOAE stimuli were transmitted through ER 2 earphones (Etymotic Research Inc., Elk Grove Village, IL, USA) coupled to an ER 10B+ low noise DPOAE microphone (Etymotic Research Inc). DPOAE recordings were obtained between 2f1f2 frequencies of 1 and 6 kHz using two stimulus tones swept in frequency at 8 sec/octave. The frequency ratio between the stimulus tones (f2/f1; f2 > f1) was fixed at 1.22 with stimulus levels fixed at L1,L2 = 55,40 dB SPL The use of these lower level stimuli has been shown to be sensitive to smaller noise-induced changes in otoacoustic emissions [25,26]. If the noise floor level increased because of participant movement or from external noise during the frequency sweep causing a <+6 dB signal-to-noise ratio (SNR), then the sweep was stopped and discarded. The frequency sweep was started again from the first frequency until the required number of sweeps was obtained. A minimum of six sweeps was averaged.
After DPOAE measures were completed, the preferred listening level was obtained while the participants listened to music through earphones while still seated in the sound-treated room (i.e., a quiet background setting). This level was collected using an ER 7C Probe Microphone Series B (Etymotic Research, Inc.) system set to a 0 dB gain connected to Electroacoustics Toolbox software (Version 3.8.3; Faber Acoustical, LLC, Lehi, UT, USA) on an iMac (Apple, Inc., Cupertino, CA, USA) computer. The probe microphone was placed approximately 28 mm into the ear canal from the intertragal notch. The Sound Level Meter and Octave Band Analyzer programs within the Electroacoustics Toolbox were used. The Sound Level Meter function was used to measure the A-weighted equivalent sound level (LAeq) while the Octave Band Analyzer was used to collect 1/3 octave data. The probe microphone was secured in the test ear canal in two ways: a small piece of medical tape on the ear lobe; and the participant’s preferred earphones. The participant then listened to one hour of continuous music; it was their choice of music (i.e., Spotify, Pandora, etc.) and they were allowed to change music and the level as they desired. When one hour was finished, the average LAeq and 1/3 octave band data were exported from the Electroacoustic Toolbox software. Using an Excel spreadsheet, the LAeq was converted to diffuse-field equivalent level for a closed canal and which included free-field equivalent (FFE) transformation to determine preferred listening level.

2.4. Statistical Analyses

Variable Definitions

Volume use was categorized using the same definitions as Torre and Reed [10]. Briefly, participant responses to the question asking about typical volume use were categorized into two groups. Variable name-Loud was defined as Non-Loud (comprised of low and medium/comfortable responses) and Loud (comprised of loud and very loud). Based on their responses to the question asking about whether they can hear and understand others when listening to their PM system, two additional groups were generated with a variable name-Hear. First, Can Hear was comprised of participants who reported they could easily hear people or have a little trouble hearing people. Second, Cannot Hear included combined responses of have a lot of trouble hearing people and cannot hear people.
Drinks per month (DPM) was calculated by the number of days having a drink containing alcohol multiplied by the number of drinks usually consumed each time. Those who did not report drinking in the last 12 months and those who did not report drinking in the last 30 days were defined as No DPM. The DPM variable was stratified using the median value from the participant data.
The main outcome variable was DPOAE data which was collapsed into 1/3rd octave bands centered around 1, 1.5, 2, 3, 4, and 5 kHz. To be included in the data analyses, DPOAE data had to meet a minimum of +3 dB signal-to-noise ratio. Mixed analyses of variance (ANOVA) (SAS, Version 9.4; SAS Institute, Cary, NC, USA) was used where the independent between subjects variables included in all models were sex, age, and test ear. Each volume/level-related variable or DPM variable was included in separate ANOVA models. The independent within-subjects variable for these analyses was DPOAE frequency to account for multiple measures within one subject. Interaction terms for the independent variables were also included in all analyses.

3. Results

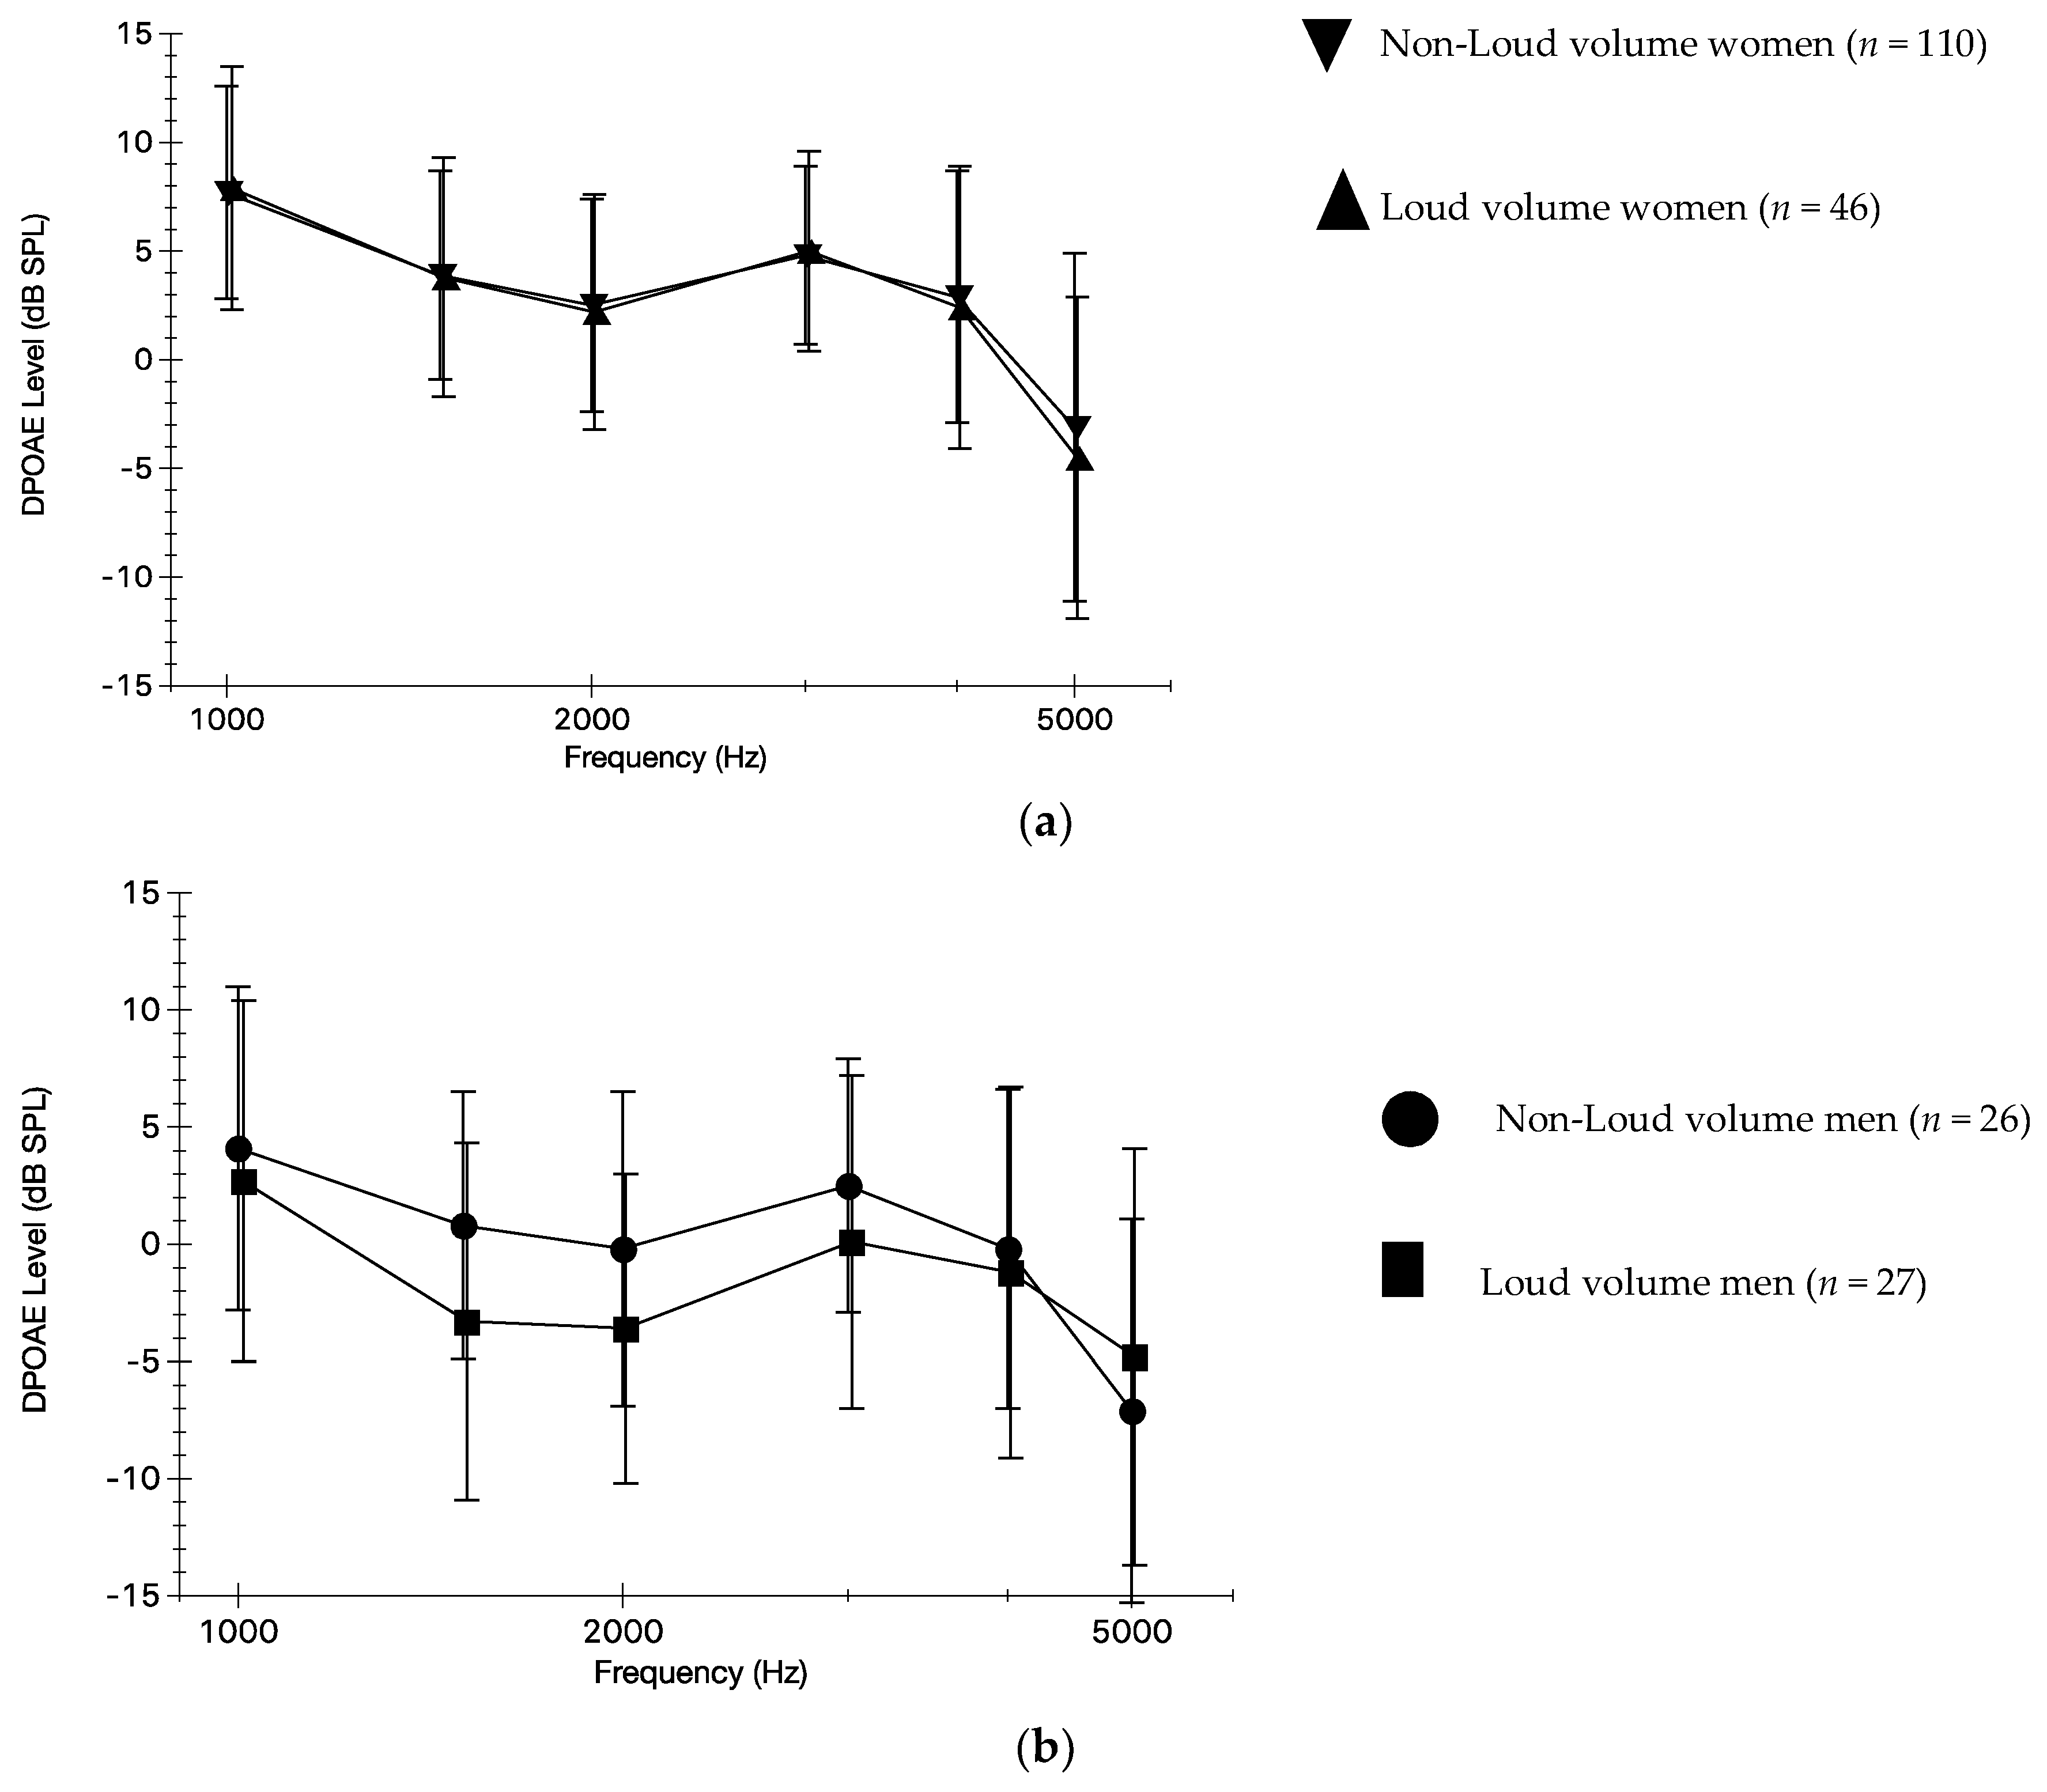
3.1. Self-Reported Volume Use and DPOAEs

Some PM system use characteristics are shown in Table 2. Over half of the participants listening between 1 and 7 h/week and approximately ¾ reported a single longest use per day up to 1 h. The percentages between women and men for these use characteristics were similar. Few participants reported tinnitus after using their PM system, although more women reported tinnitus than men. The percent for self-reported volume categories for all participants and women and men are also shown in Table 2.
Over 50% of men reported using a loud or very loud volume setting with a PM system with earphones, while just under 30% of women reported those same volume settings. Over 30% of men reported having a lot of trouble hearing people or not being able to hear people when using a PM system with earphones, which is slightly higher than the 22.4% of women who reported those same difficulties. After adjusting for test ear and age, there was a statistically significant Sex-by-Loud-by-Frequency interaction (F[16,1024] = 2.22, p < 0.05) for DPOAEs, so sex-specific ANOVAs were performed. For women only, there was no statistically significant Loud-by-Frequency interaction for DPOAEs (F[5,769] = 0.80, p > 0.05) nor a statistically significant main effect for Loud (F[1,769] = 0.12, p > 0.05). Figure 1a shows the means and standard deviations for DPOAEs across the collapsed frequencies and the considerable overlap in the Non-Loud and Loud women. For men only, however, there was a statistically significant Loud-by-Frequency interaction (F[5,255] = 2.93, p < 0.05) and this is shown in Figure 1b where men in the Loud category have poorer mean DPOAEs at 1.5, 2, and 3 kHz.
The results for the Hear variable were similar such that there was a statistically significant Sex-by-Hear-by-Frequency interaction for DPOAEs (F[16,1029] = 4.20, p < 0.05). For men only again, there was a statistically significant Loud-by-Frequency interaction (F[5,260] = 6.75, p < 0.05) where men who reported having a lot of trouble hearing people or cannot hear people had poorer mean DPOAEs at 1.5, 2, and 3 kHz.

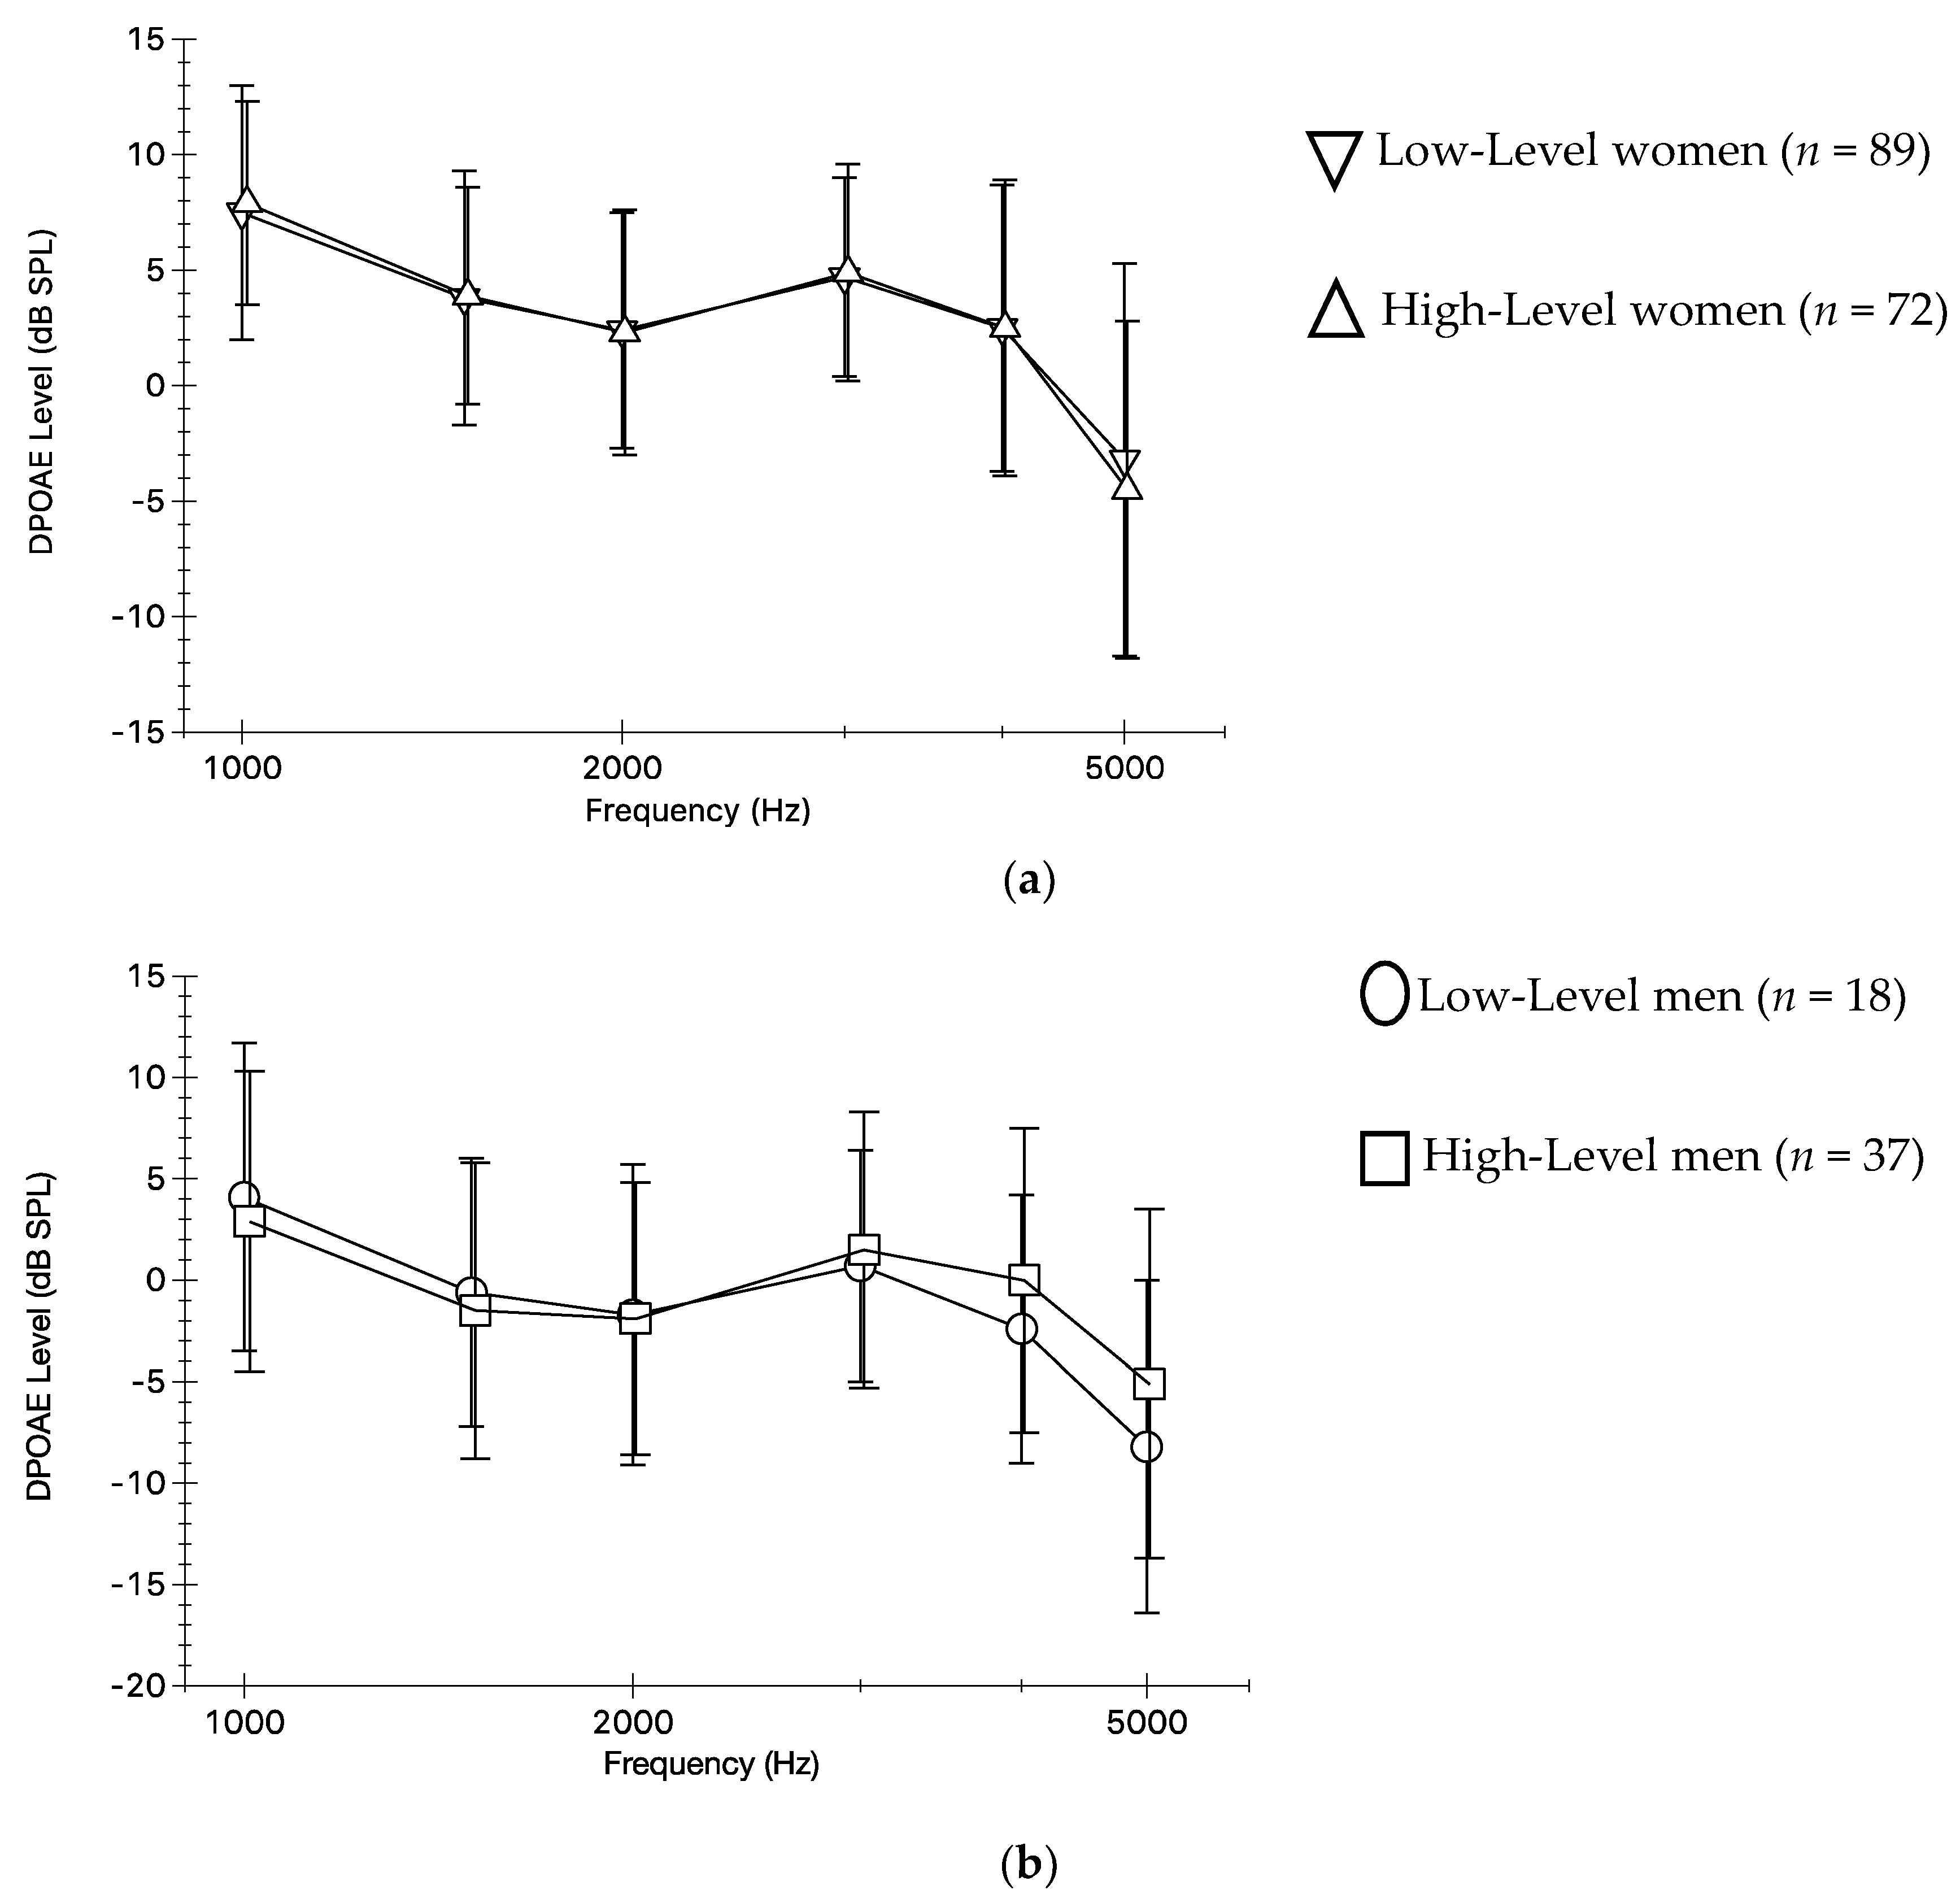
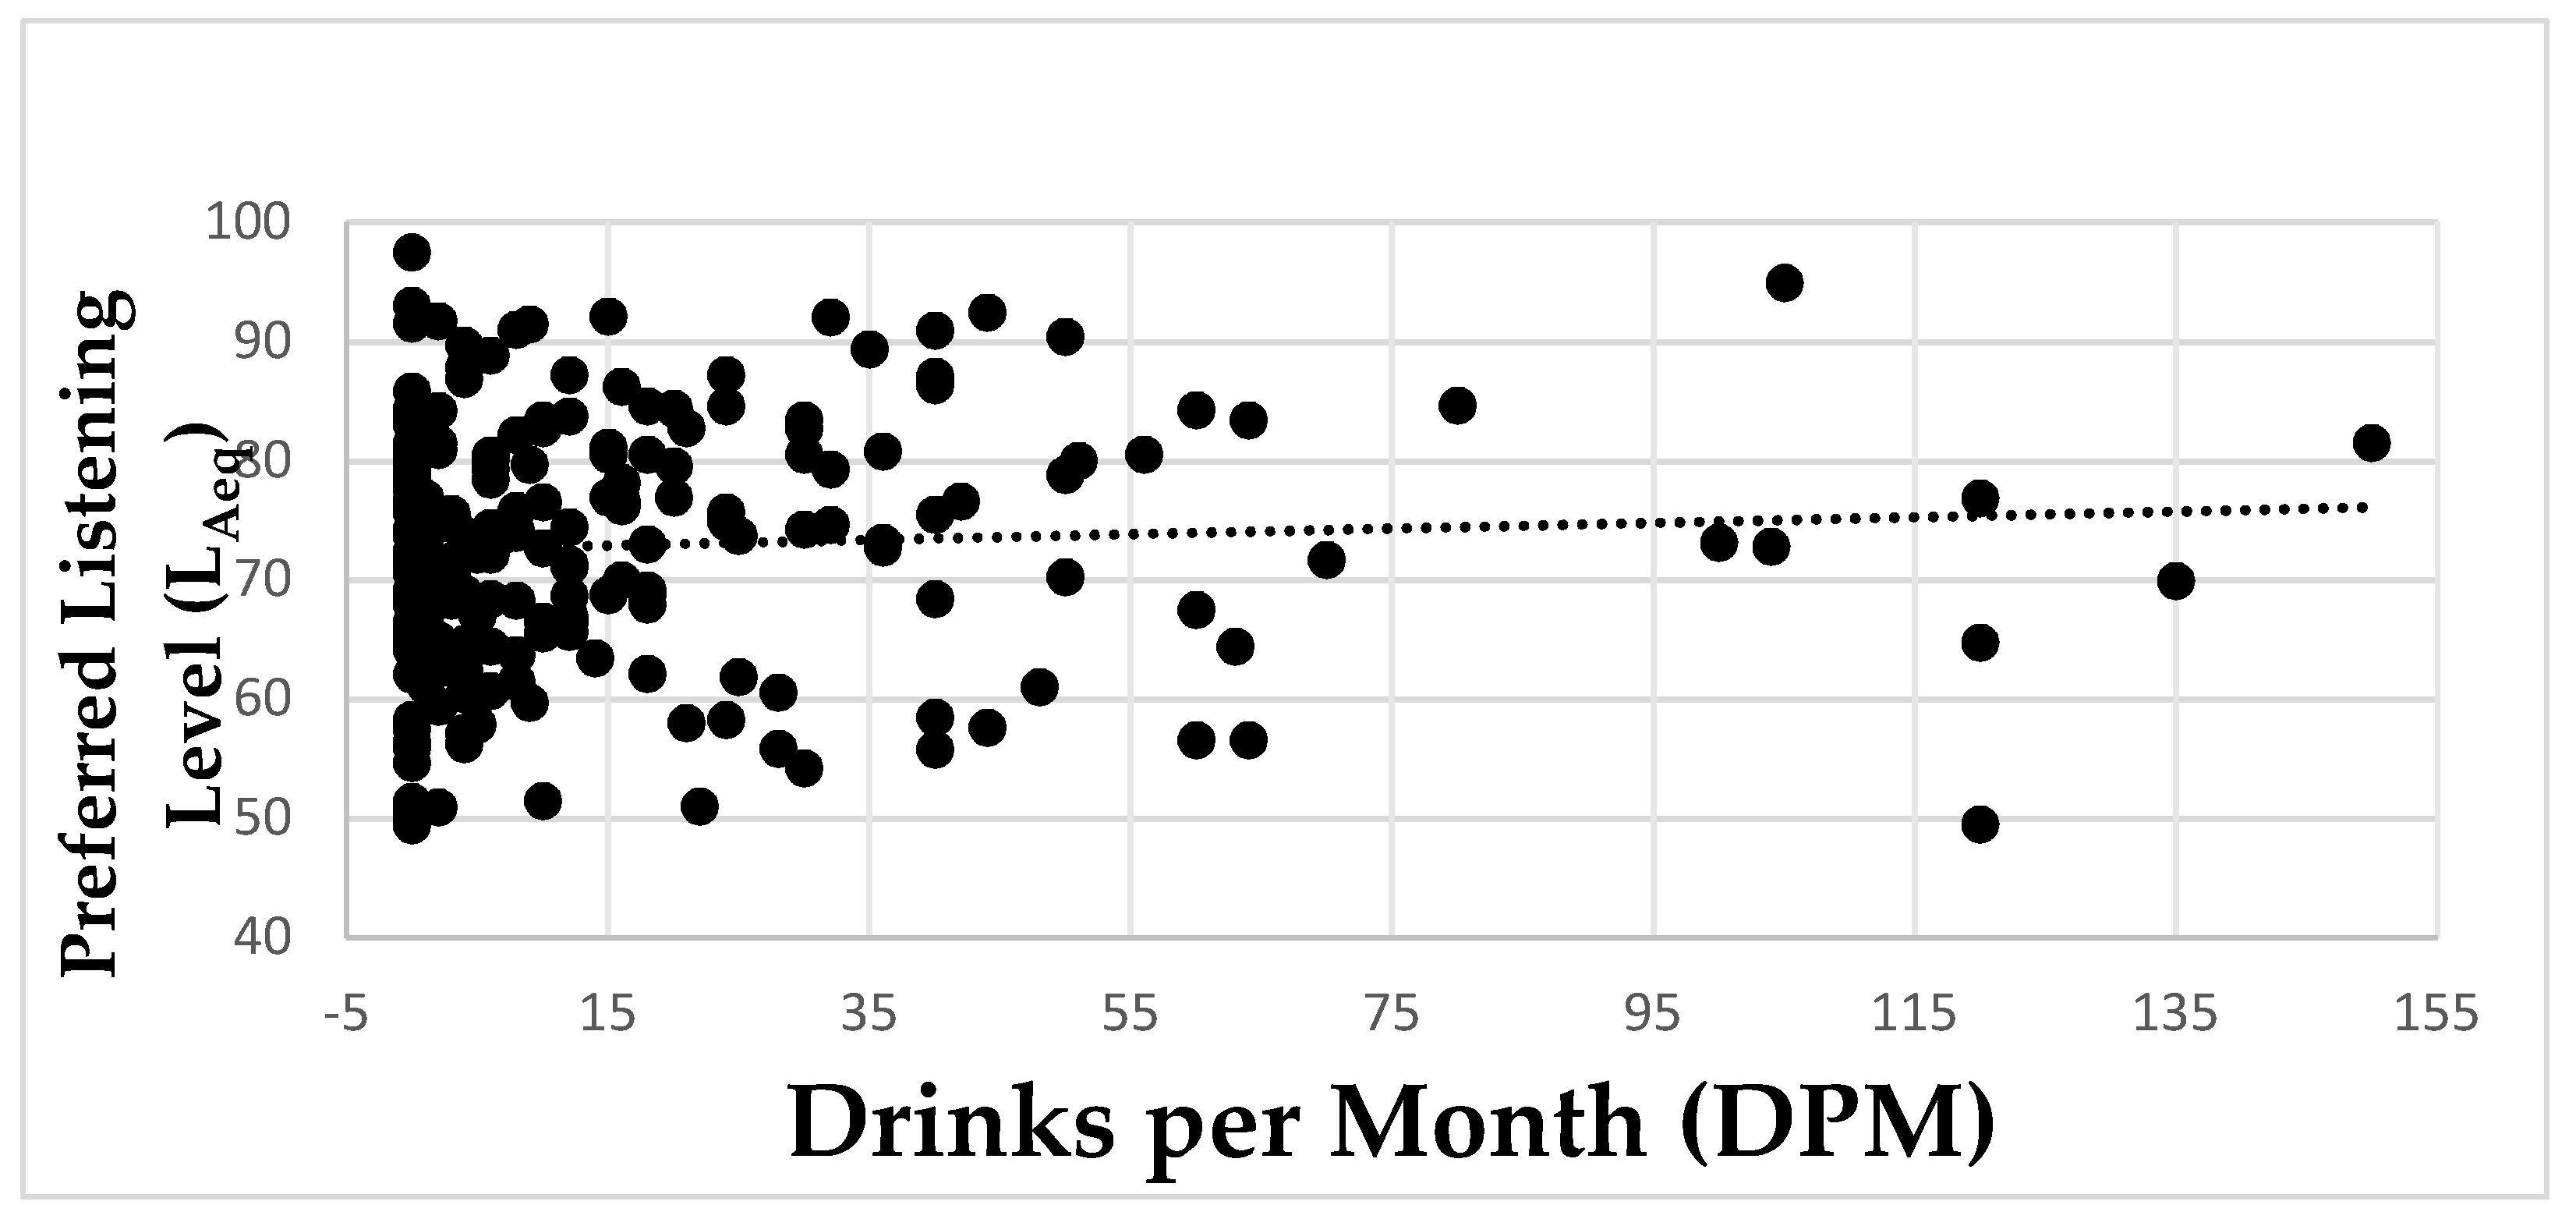
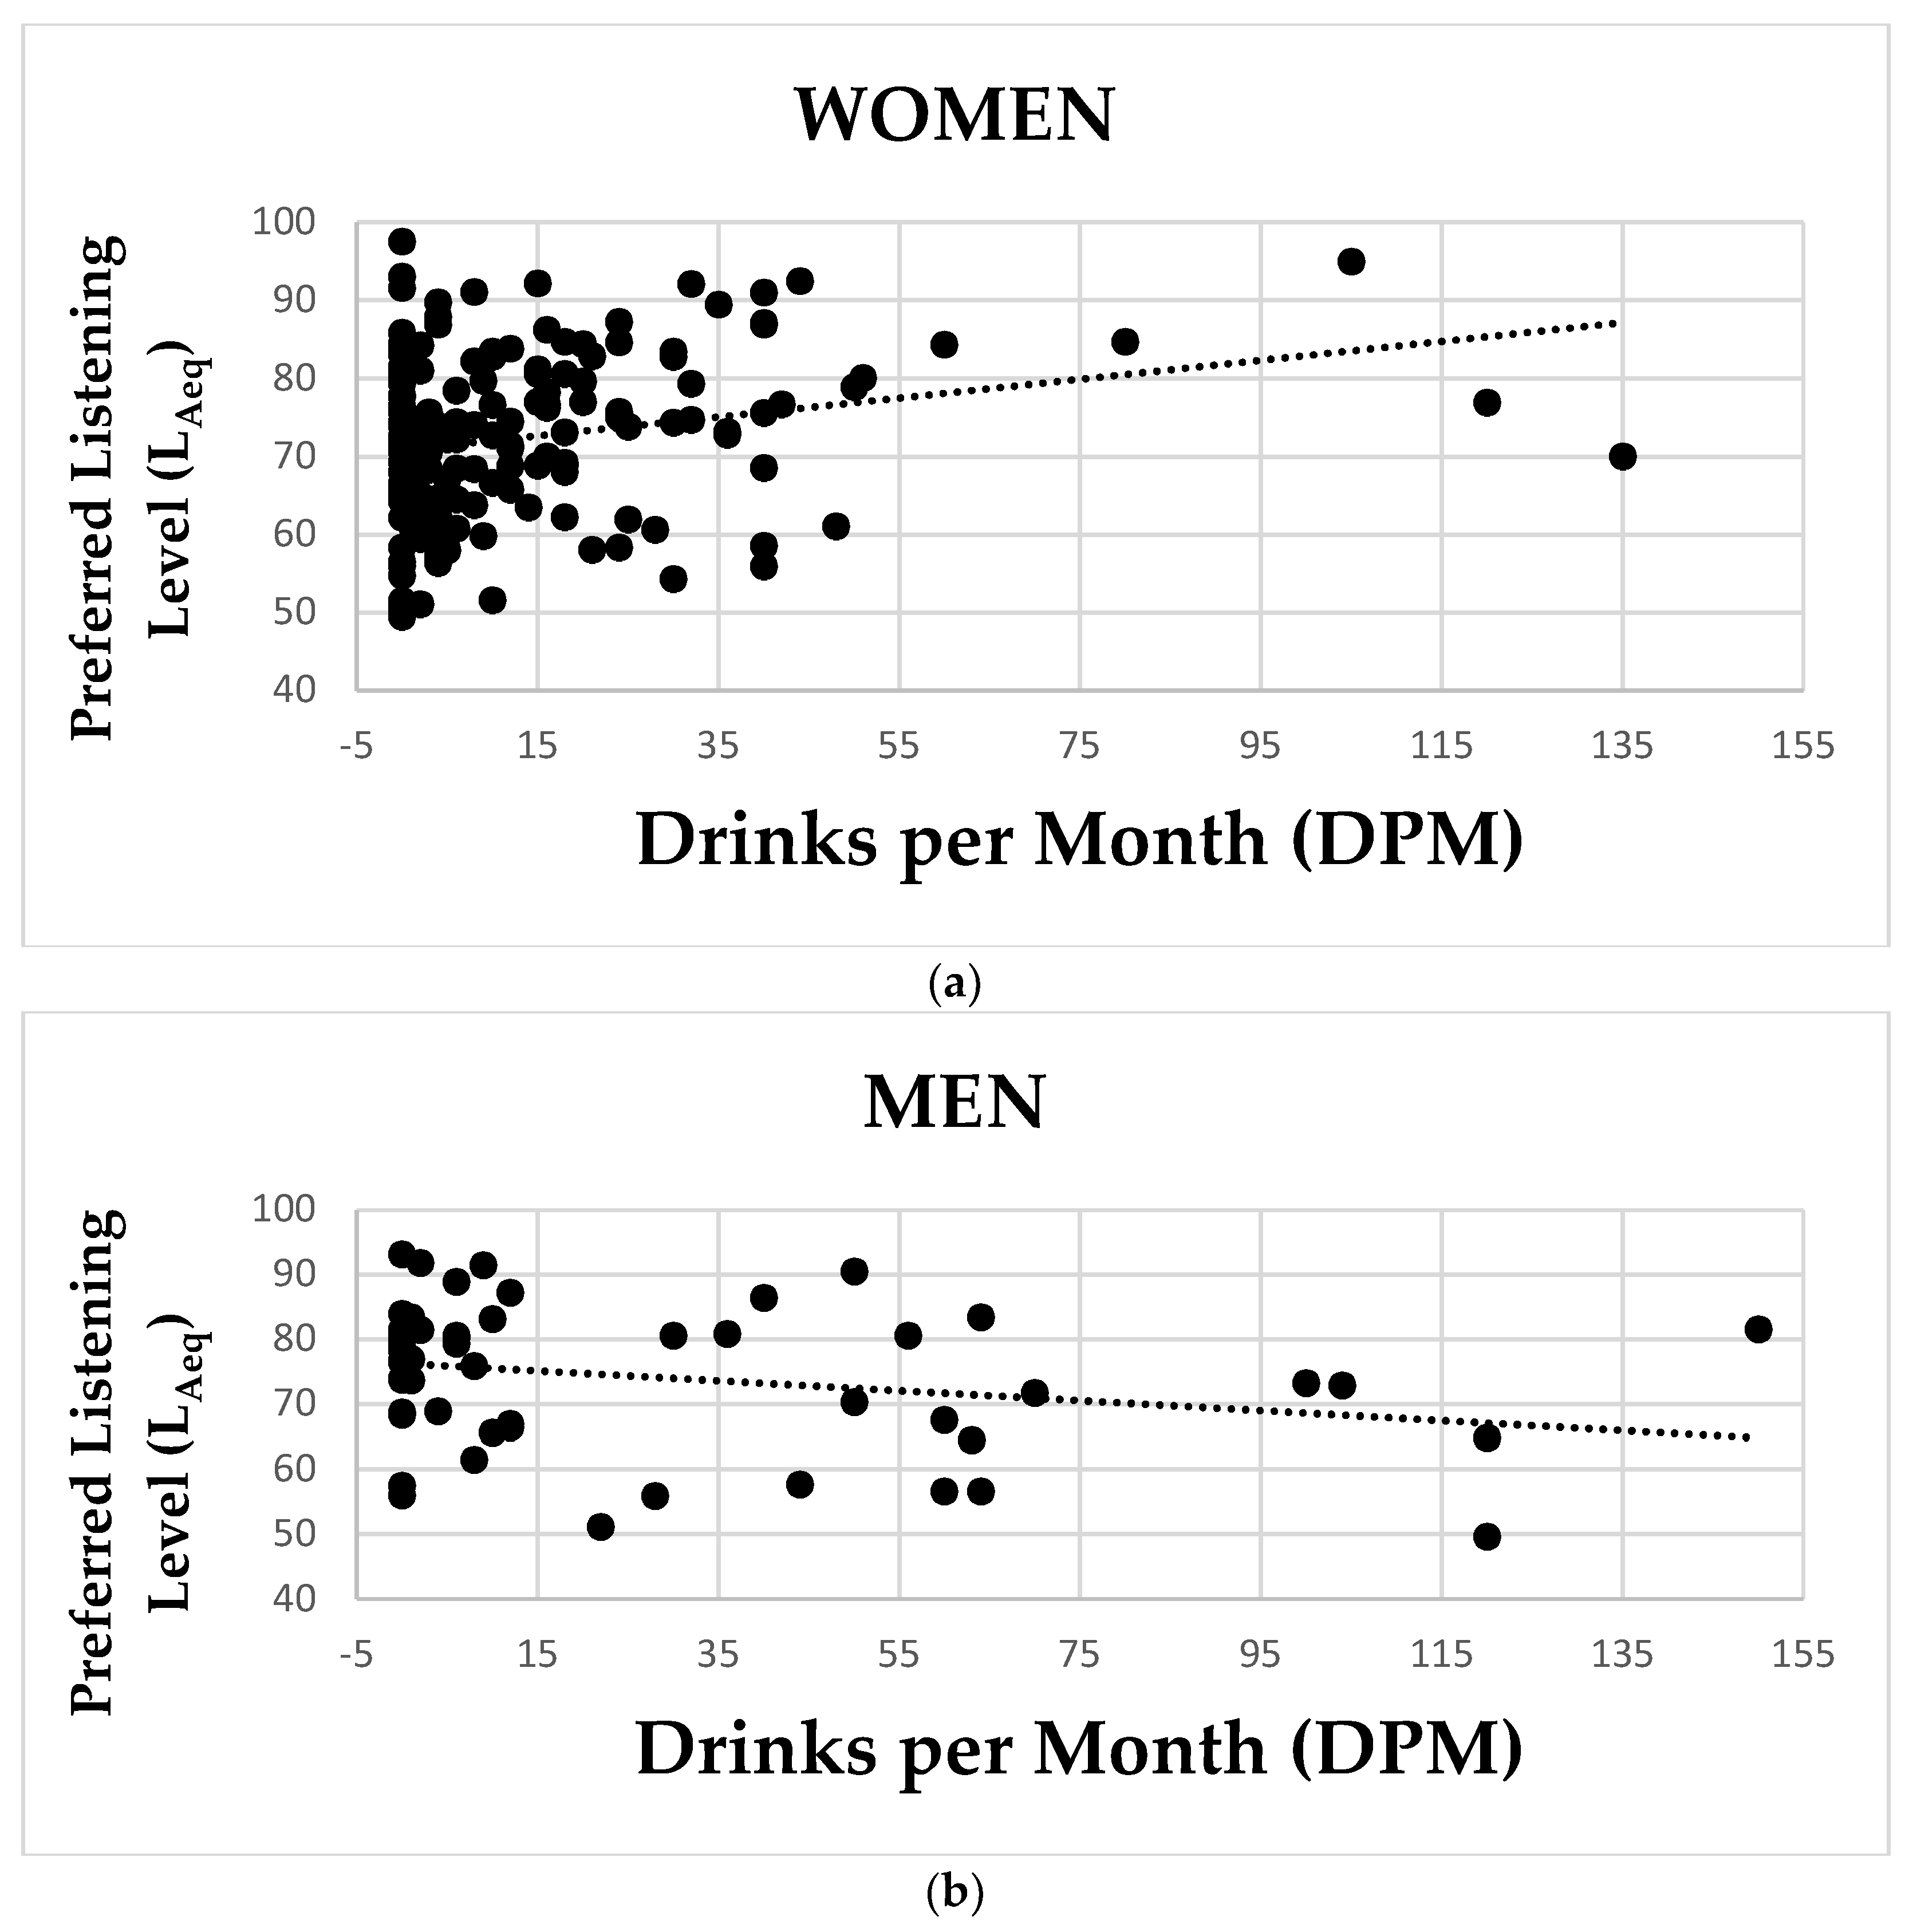
3.2. Preferred Listening Level and DPOAEs

The mean preferred listening level (LAeq) for all participants was 73.0 dBA (SD = 10.7 dBA), but the mean for men was slightly higher (mean = 76.5 dBA, SD = 10.1 dBA) compared to the mean for women (mean = 71.8, SD = 10.7) (Table 2). In fact, only 25 of the sample (11.6%) listened at >85 dBA, but there was a slightly higher percentage of men, 16.4%, than women, 9.9%, who listened at this level. The maximum preferred listening level, however, was 97.5 dBA for this quiet background setting. In the analysis of preferred listening level on DPOAEs, after adjusting for age and test ear, the Sex-by-LAeq-by-Frequency interaction was not statistically significant (F[11,1064] = 1.29, p > 0.05) nor was the LAeq main effect (F[1,1064) = 0.40, p > 0.05). So those that had a higher preferred listening level did not have poorer DPOAEs. Subsequent analyses were completed with the preferred listening level as a dichotomous variable, LEVEL, based on the median value (73.7 dBA). Low-level was defined as those who listened ≤73.7 dBA and high-level was those who listened >73.7 dBA. After adjusting for age and test ear, the Sex-by-LEVEL-by-Frequency was borderline statistically significant (F[16,1060] = 1.61, p = 0.06). For the sex-specific mixed ANOVAs, the LEVEL-by-Frequency was not statistically significant for women (F[5,794] = 1.01, p > 0.05) or men (F[5,265] = 1.54, p > 0.05). This is shown in Figure 2a (women) and Figure 2b (men) where the mean, and standard deviation, distributions overlap for the low- and high-level categories.

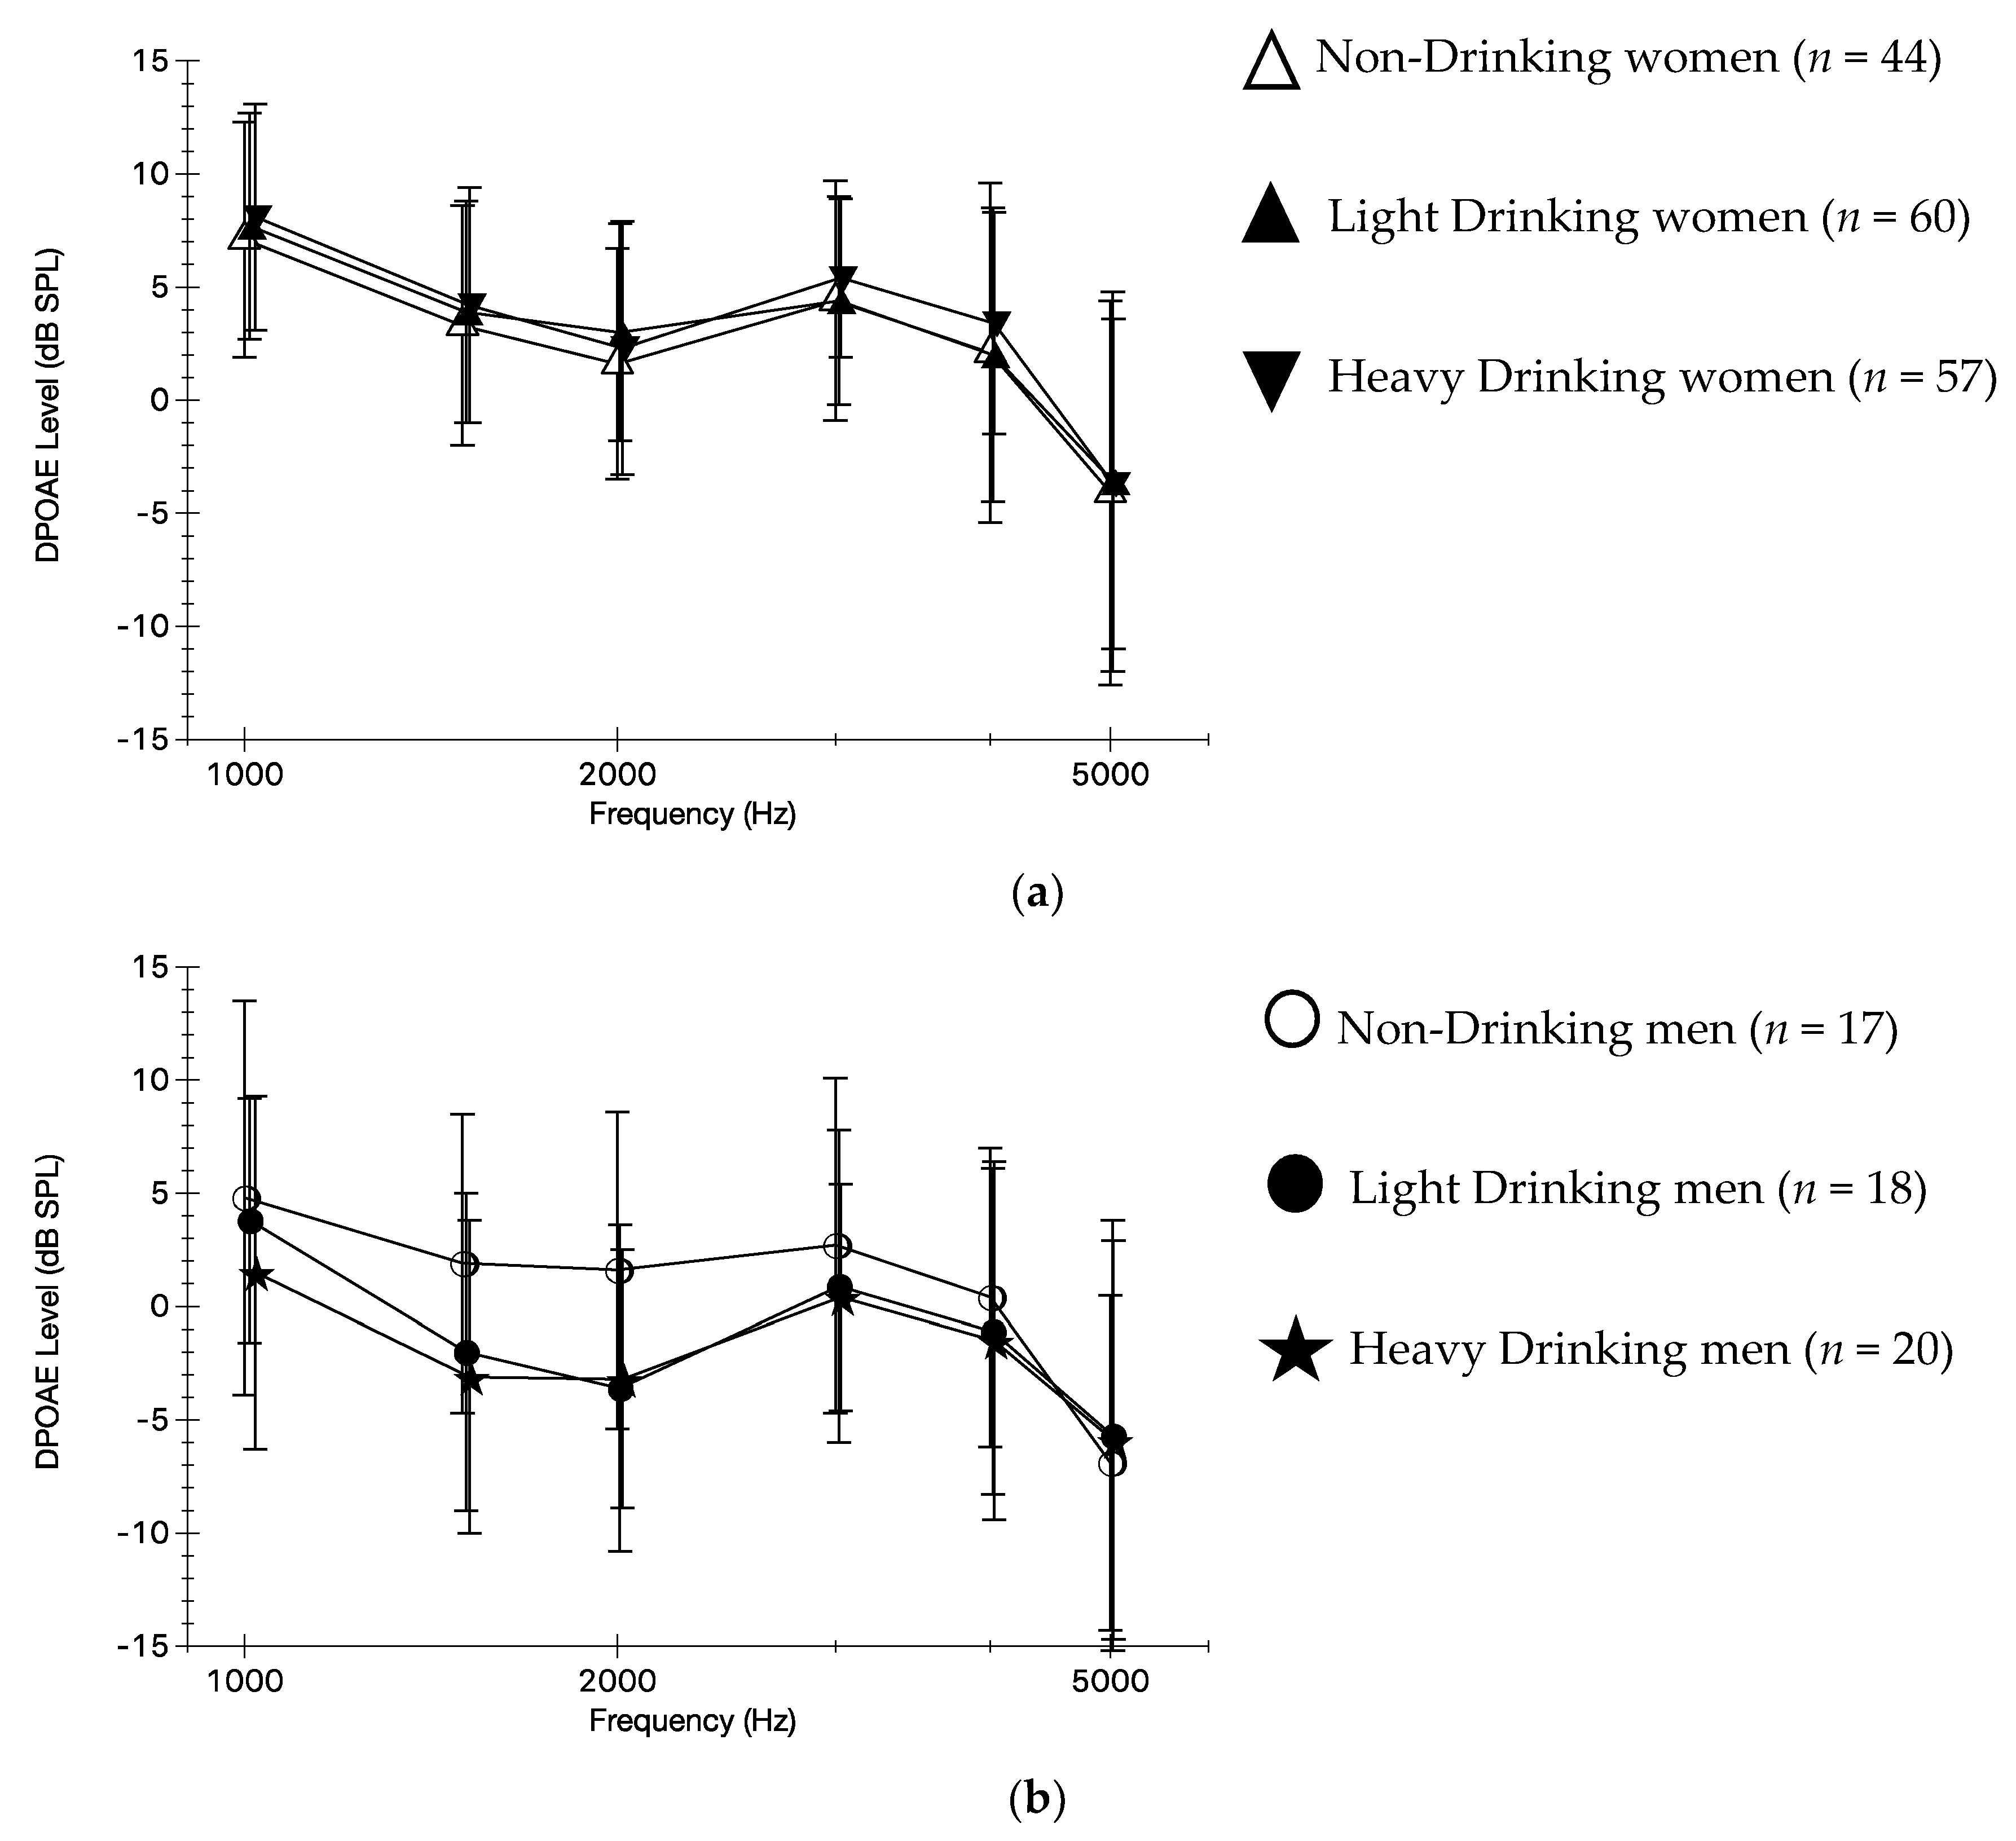
3.3. Self-Reported Alcohol Use and DPOAEs

In addition, in Table 2, the distribution of participants for DPM is shown. For DPM, the median value for the amount of drinks reported in the month was 14 and this number was used to define Light drinking (≤14 drinks) and Heavy drinking (>14 times). Almost 30% of all participants were either: those who reported never drinking; did not drink within the last year; or did not drink within the last 30 days. Approximately 36% reported being a Light or Heavy drinker within the last 30 days. The distributions for women and men were similar across the categories such that about 1/3 of the participants were in each group.
After adjusting for age and test ear, the Sex-by-DPM-by-Frequency interaction approached statistical significance (F[27,1050] = 1.39, p = 0.09). Exploratory sex-specific mixed ANOVAs were performed, and the DPM-by-Frequency interaction was not statistically significant for women (F[10,789] = 0.55, p > 0.05) or men (F[10,260] = 1.34, p > 0.05). Figure 3a (women) and Figure 3b (men) show the means and standard deviations for DPOAEs and DPM categories.

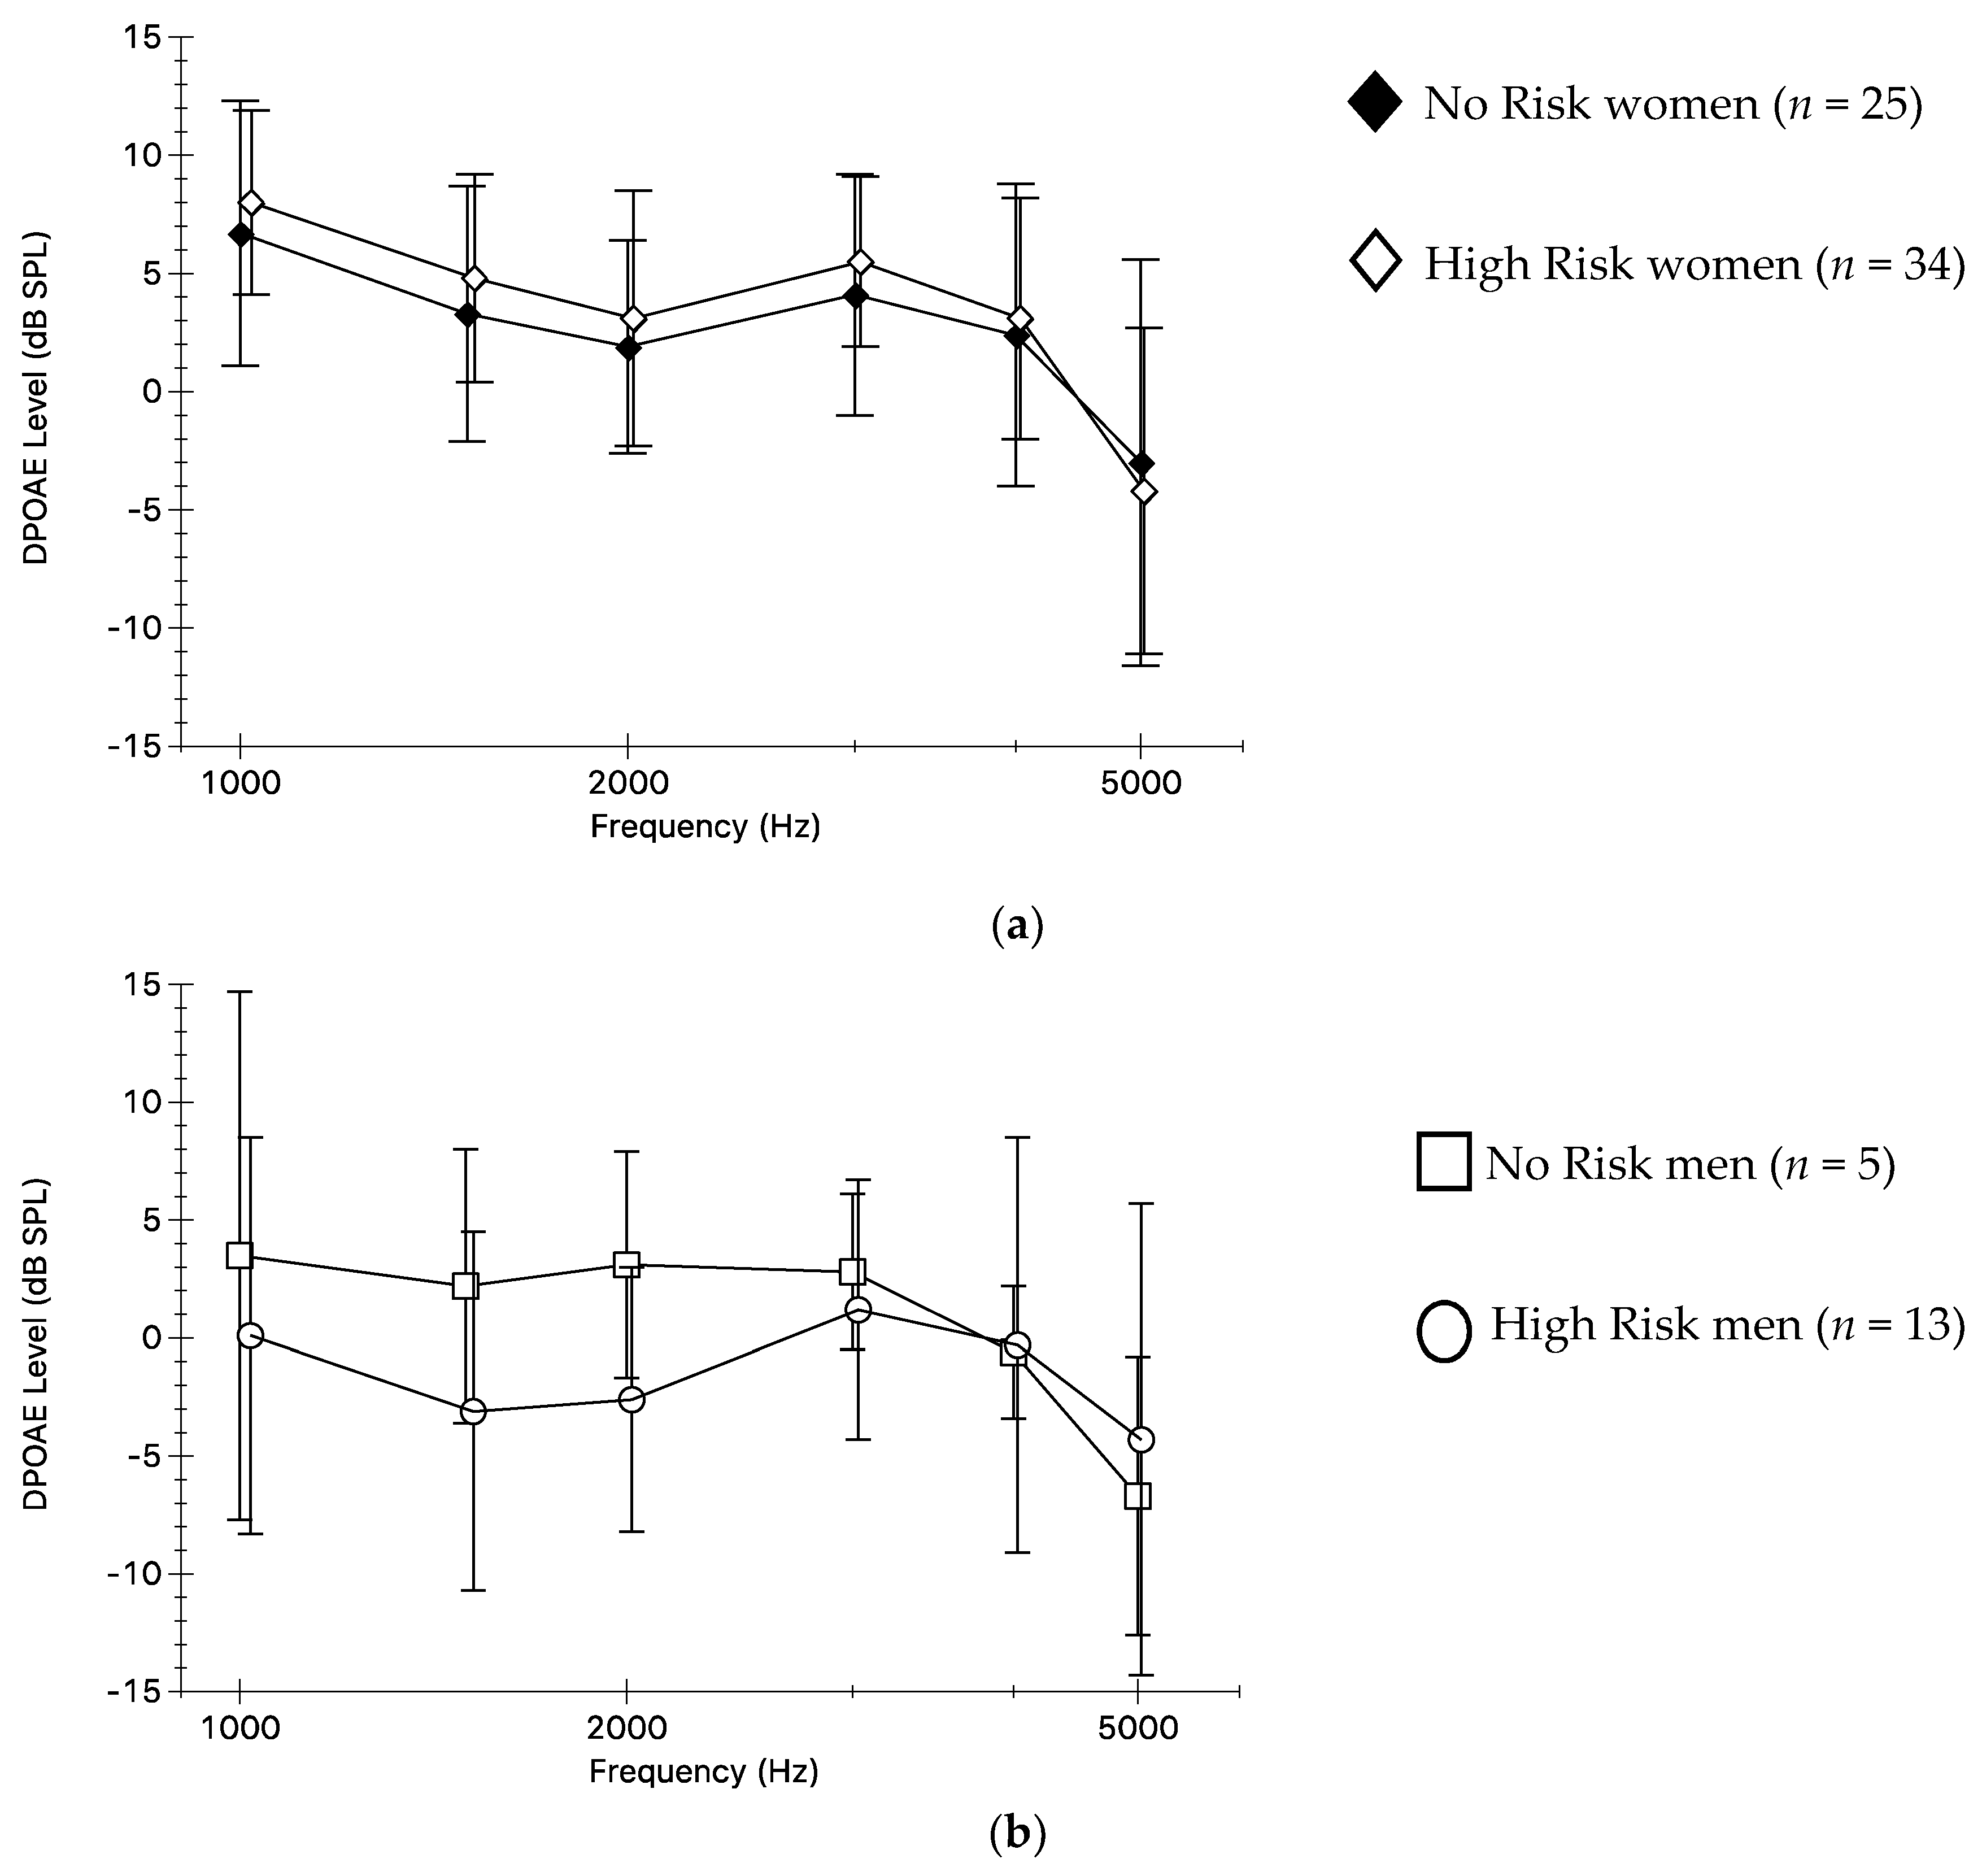
3.4. Multiple Risk Factors and DPOAEs

The combination of these risk factors was also evaluated. The scatterplot for all participants for DPM and preferred listening level is shown in Figure 4. The DPM axis was offset to −5 DPM so as to be able to visualize those participants in the No DPM category. There is a slight positive association (regression line shown) between reported DPM and preferred listening level. However, for the sex-specific data, there are differing associations. For women, there was a statistically significant positive association between DPM and preferred listening level (F[1,158] = 2.13, p < 0.05) (Figure 5a), but for men, there was a non-statistically significant negative association between DPM and preferred listening level (F[1,52] = 0.49, p > 0.05) (Figure 5b). In the mixed ANOVA with both preferred listening level, as a continuous variable, and DPM, there were no statistically significant interactions or main effects on DPOAEs. Further, when the LEVEL variable was used in the mixed ANOVA, the results were still not statistically significant.
In an additional analysis, a new variable was defined in an effort to evaluate the extreme categories of these risk factors. The RISK variable was defined as follows: No Risk—those who reported No DPM and listened at ≤73.7 dBA; and High Risk those who reported Heavy DPM and >73.7 dBA. There were 77 participants in this subset analysis; 30 participants (25 women and 5 men) in the No Risk group and 47 participants (34 women and 13 men) in the High-Risk group. After adjusting for age and test ear, the Sex-by-RISK-by-Frequency interaction was statistically significant (F[16, 364] = 1.89, p < 0.05). For the sex-specific mixed ANOVAs, the RISK-by-Frequency was not statistically significant for women (F[5,285] = 1.08, p > 0.05) or men (F[5,80] = 1.29, p > 0.05). In Figure 6a, the High-Risk women had slightly higher DPOAEs from 1 through 4 kHz compared to the No Risk women; whereas for the men, High Risk had poorer DPOAEs from 1 through 3 kHz compared to the No Risk men (Figure 6b). The results on this additional analysis should be interpreted cautiously given the smaller sample sizes, particularly in men.

4. Discussion

In this study of over 200 young adults with normal hearing, almost 35% reported listening to a PM system with earphones at a loud or very loud volume while almost 25% reported that when using a PM system, they had a lot of trouble or could not hear people. In a quiet background environment, however, the mean preferred listening level, measured with a probe microphone over one hour, was below what would be considered hazardous although the maximum level measured in our sample was 97.5 dBA. Lastly, over 70% of participants reported drinking in the last month which is higher than national estimates of 30-day self-reported alcohol consumption (62%) among college students [18]. Overall, young adult men had higher percentages of self-reported: loud or very loud volume use; having a lot of trouble or cannot hear people; heavy drinking (>14 drinks); and a higher mean preferred listening level compared to women.
The mean preferred listening level for all participants was 73.0 dBA and this is consistent with what other researchers have reported for a quiet background condition [7,9,10]. Further young adult men in the current study had a statistically significant higher preferred listening level than women, which has been reported previously [7,10]. Few participants (25 of 216, 11.6%) listened to music >85 dBA which is most likely a result of listening in a quiet background and not having to compete with extraneous noise. Further, this music exposure was one hour and together the measured preferred listening level would not be considered hazardous; although the maximum preferred listening level obtained in the current study would be considered hazardous from a NIOSH perspective [11].
Men that reported loud or very loud volume during PM system use had statistically significant poorer DPOAEs at 1.5, 2, and 3 kHz compared to men that reported low or medium volume use. For women, though, self-reported volume use was not associated with DPOAE levels. Lee et al. [27] found that in a large sample of young adults, those who reported listening to a PM system at maximum or near maximum volume had statistically significant lower DPOAEs at 1.5, 2, 3, and 4 kHz compared to those who reported listening at other volumes. Those general findings are consistent with the current study although Lee et al. [27] did not present sex-specific DPOAE data so it is not clear whether or not those data include sex-specific significant differences like the current study. Most researchers have reported significantly lower DPOAEs in PM system users compared to non-users [13,28] although recruiting verifiable control participants might be problematic given the very high prevalence of PM system use among young adults [1,2]. Further, some reported poorer DPOAEs in those who reported more hours of PM system use per week [13] although more recently Torre et al. [14] did not report a weekly use effect on DPOAEs and Le Prell et al. [15] reported that years of PM system use was not significantly associated with poorer DPOAEs.
For women, DPOAEs were similar for the three DPM categories. For men, however, there was a trend indicating poorer DPOAEs at 1.5, 2, and 3 kHz in men who reported any drinking relative to men who reported no past month drinking. The empirical evidence linking alcohol consumption to hearing is limited but one study with a small sample size (n = 8) found statistically significant mean decreases in higher frequency (i.e., 5.5 and 6.6 kHz) DPOAEs after 30 min and 1-h post alcohol consumption [29]. Mean DPOAE levels at these frequencies recovered to pre-consumption levels after 2 h. There were only negligible, non-significant mean changes in DPOAE levels from 0.7 to 4.4 kHz after alcohol consumption. An important finding from Hwang et al. [29] is that there were no changes in pure-tone thresholds after alcohol consumption suggesting that the higher frequency outer hair cells may be vulnerable to moderate alcohol consumption. More research is needed in this area to further evaluate the effects of alcohol on underlying cochlear function.
In contrast there is a large literature on the association between self-reported alcohol use on hearing sensitivity [30,31,32,33,34], however, the results are mixed. Specifically, self-reported moderate alcohol use was associated with a protective effect (i.e., better hearing sensitivity) on hearing [31,32] whereas others have found no significant association between self-reported moderate or heavy alcohol use and hearing sensitivity [33,34,35]. Conversely, self-reported high alcohol use was associated with an increased risk of hearing loss [30,31]. It is difficult to evaluate the alcohol and hearing association because of other variables that are associated with hearing loss. The abovementioned studies included older adults with longer histories of both recreational and occupational noise exposure, two risk factors that are significantly associated with hearing loss and accounting for these factors can be challenging from an analytical perspective. Even though the outcome of the current study was DPOAEs, these data were collected in young adults (mean age = 21.0 years) with normal hearing with shorter histories of noise exposure in an effort to minimize those risk factors.
One limitation in the current study was the measurement of preferred listening level in a quiet background setting; this is likely not representative of a real-world listening environment. Most college-aged young adults listen to a PM system while either exercising or while on campus [1] although it is possible that as students, they listen to a PM system while in the library which would represent a quiet background setting. The survey used in the present study only used questions regarding PM system use. No other recreational noise exposure or occupational noise exposure data were obtained so it is possible unaccounted noise exposures (i.e., concert attendance, dance clubs, recreational vehicles) may have affected the results, especially for the sex differences. Additionally, undergraduate students do not represent all young adults for this age group. It is possible that young adults with lower levels of education (i.e., less than high school or completion of high school only) tend to be employed in settings with higher levels of noise exposure. Epidemiologic data have shown associations between hearing loss with both levels of education and occupation [36,37]. The association between education level and hearing loss remained after adjusting for occupational noise exposure [38]. Another limitation is that the DPM variable was defined based on self-report which can introduce recall bias; however, it is important to note self-report measures of alcohol consumption have generally been shown to be good predictors of actual use [39,40].

5. Conclusions

To summarize, approximately 35% of young, college-aged adults in the current study reported listening to a PM system at a loud or very loud volume although the mean preferred listening level would not be considered a hazardous level. Men who reported loud or very loud volume use had statistically significant poorer mid-frequency DPOAEs compared to men who reported low or medium volume. Further, there was a non-statistically significant trend for men who reported any DPM to have poorer mid-frequency DPOAEs compared to No DPM men. The research literature generally supports an association between level of environmental music and alcohol consumption [20,22,23] and results of a recent field study showed an association between alcohol and/or drug use and temporary noise-induced hearing loss among attendees of an outdoor music festival in the Netherlands [41]. However, more investigation is needed in the field to collect data on noise levels in settings where alcohol is consumed while measuring the alcohol consumed in those settings. Furthermore, to assess exposure to noisy drinking environments over time, longitudinal studies examining noisy setting and alcohol consumption in a variety of settings (e.g., bars, parties, concerts) will need to be conducted. These data can contribute to a better understanding of how these specific risk factors affect the auditory system in young adults.

Author Contributions

Both authors contributed equally to the research design, statistical approach, and writing of the manuscript.

Funding

This research received no external funding.

Acknowledgments

We would like to acknowledge Sumitrajit Dhar for providing the software and programming used to collect and analyze these data. We also acknowledge the students who participated in this study.

Conflicts of Interest

The authors declare no conflict of interest.

References

  1. Torre, P., III. Young adults’ use and output level settings of personal music systems. Ear Hear. 2008, 29, 791–799. [Google Scholar] [CrossRef] [PubMed]
  2. Danhauer, J.L.; Johnson, C.E.; Byrd, A.; DeGood, L.; Meuel, C.; Pecile, A.; Koch, L.L. Survey of college students on iPod use and hearing health. J. Am. Acad. Audiol. 2009, 20, 5–27. [Google Scholar] [CrossRef] [PubMed]
  3. Zogby, J. Survey of Hispanic adults, adults in general, hispanic teens, and teens in general about the use of personal electronic devices with head phones. Am. Speech Lang. Hear. Assoc 2006. Available online: https://www.asha.org/uploadedFiles/HeadphoneSurveyDomestic.pdf (accessed on 16 April 2019).
  4. Hoover, A.; Krishnamurti, S. Survey of college students’ MP3 listening: Habits, safety issues, attitudes, and education. Am. J. Audiol. 2010, 19, 73–83. [Google Scholar] [CrossRef]
  5. Portnuff, C.D.F.; Fligor, B.J.; Arehart, K.H. Self-report and long-term field measures of MP3 player use: How accurate is self-report? Int. J. Audiol. 2013, 52, S33–S40. [Google Scholar] [CrossRef]
  6. Hodgetts, W.E.; Rieger, J.M.; Szarko, R.A. The effects of listening environment and earphone style on preferred listening levels of normal hearing adults using an MP3 player. Ear Hear. 2007, 28, 290–297. [Google Scholar] [CrossRef]
  7. Worthington, D.A.; Siegel, J.H.; Wilber, L.A.; Faber, B.M.; Dunckley, K.T.; Garstecki, D.C.; Dhar, S. Comparing two methods to measure preferred listening levels of personal listening devices. J. Acoust. Soc. Am. 2009, 125, 3733–3741. [Google Scholar] [CrossRef]
  8. Torre, P., III; Grace, J. Changes in distortion product otoacoustic emission components after music exposure. J. Am. Acad. Audiol. 2014, 25, 805–813. [Google Scholar] [CrossRef]
  9. Park, Y.; Guercio, D.; Ledon, V.; Le Prell, C.G. Variation in music player listening level as function of campus location. J. Am. Acad. Audiol. 2017, 28, 295–313. [Google Scholar] [CrossRef]
  10. Torre, P., III; Reed, M.B. Can self-reported personal audio system volume predict actual listening levels in young adults? J. Am. Acad. Audiol. 2019, 30, 153–161. [Google Scholar] [CrossRef]
  11. National Institute for Occupational Safety and Health. Criteria for a Recommended Standard: Occupational Noise Exposure (Revised Criteria 1998); No. 98-126; US Department of Health and Human Services (NIOSH): Cincinnati, OH, USA, 1998.
  12. Occupational Safety & Health Administration. Occupational Noise Exposure Standard (29 CFR 191.25). Code of Federal Regulations; US Department of Labor: Washington DC, USA, 2007.
  13. Montoya, F.S.; Ibargüen, A.M.; Vences, A.R.; Sanchez del Rey, A.; Fernandez, J.M.S. Evaluation of cochlear function in normal-hearing young adults exposed to MP3 player noise by analyzing transient evoked otoacoustic emissions and distortion products. J. Oto-Head Neck Surg. 2008, 37, 718–724. [Google Scholar]
  14. Torre, P., III; Grace, J.; Hansen, C.; Millman, P.; Martin, H. Gender, music, and distortion product otoacoustic emission components. Ear Hear. 2013, 34, e74–e81. [Google Scholar] [CrossRef]
  15. Le Prell, C.G.; Siburt, H.W.; Lobarinas, E.; Griffiths, S.K.; Spankovich, C. No reliable association between recreational noise exposure and threshold sensitivity, distortion product otoacoustic emission amplitude, or word-in-noise performance in a college student population. Ear Hear. 2018, 39, 1057–1074. [Google Scholar] [CrossRef]
  16. Clapp, J.D.; Reed, M.B.; Holmes, M.R.; Lange, J.E.; Voas, R.B. Drunk in public, drunk in private: The relationship between college students’ drinking environments and alcohol consumption. Am. J. Drug Alcohol Abus. 2006, 32, 275–285. [Google Scholar] [CrossRef] [PubMed]
  17. Harford, T.C.; Wechsler, H.; Seibring, M. Attendance and alcohol use at parties and bars in college: A national survey of current drinkers. J. Stud. Alcohol Drugs 2002, 63, 726–733. [Google Scholar] [CrossRef]
  18. Schulenberg, J.E.; Johnston, L.D.; O’Malley, P.M.; Bachman, J.G.; Miech, R.A.; Patrick, M.E. Monitoring the Future National Survey Results on Drug Use, 1975–2016: Volume II, College Students and Adults Ages 19–55. Ann Arbor: Institute for Social Research, The University of Michigan, 2017. Available online: http://monitoringthefuture.org/pubs.html#monographs (accessed on 4 January 2019).
  19. Bray, A.; Szymański, M.; Mills, R. Noise induced hearing loss in dance music disc jockeys and an examination of sound levels in nightclubs. J. Laryngol. Otol. 2004, 118, 123–128. [Google Scholar] [CrossRef] [PubMed]
  20. Hughes, K.; Quigg, Z.; Eckley, L.; Bellis, M.; Jones, L.; Calafat, A.; Kosir, M.; Van Hasselt, N. Environmental factors in drinking venues and alcohol-related harm: The evidence base for European intervention. Addiction 2011, 106, 37–46. [Google Scholar] [CrossRef] [PubMed]
  21. Stafford, L.D.; Dodd, H. Music increases alcohol consumption rate in young females. Exp. Clin. Psychopharmacol. 2013, 21, 408–415. [Google Scholar] [CrossRef]
  22. Gueguen, N.; Jacob, C.; Le Guellec, H.; Morineau, T.; Lourel, M. Sound level of experimental music and drinking behavior: A field experiment with beer drinkers. Alcohol Clin. Exp. Res. 2008, 32, 1795–1798. [Google Scholar] [CrossRef]
  23. Clapp, J.D.; Min, J.W.; Shillington, A.M.; Reed, M.B.; Ketchie, C.J. Person and environment predictors of blood alcohol concentrations: A multi-level study of college parties. Alcohol Clin. Exp. Res. 2008, 22, 100–107. [Google Scholar] [CrossRef]
  24. Recommended Alcohol Questions. Available online: https://www.niaaa.nih.gov/research/guidelines-and-resources/recommended-alcohol-questions (accessed on 1 April 2019).
  25. Marshall, L.; Lapsley Miller, J.A.; Heller, L.M. Distortion-product otoacoustic emissions as a screening tool for noise-induced hearing loss. Noise Health 2001, 3, 43–60. [Google Scholar] [PubMed]
  26. Marshall, L.; Lapsley Miller, J.A.; Heller, L.M.; Wolgemuth, K.S.; Hughes, L.M.; Smith, S.D.; Kopke, R.D. Detecting incipient inner-ear damage from impulse noise with otoacoustic emissions. J. Acoust. Soc. Am. 2009, 125, 995–1013. [Google Scholar] [CrossRef] [PubMed]
  27. Lee, G.J.C.; Lim, M.Y.; Kuan, A.Y.W.; Teo, J.H.W.; Tan, H.G.; Low, W.K. Relationship between leisure noise exposure and otoacoustic emissions in a young Asian population. Int. J. Audiol. 2014, 53, 462–468. [Google Scholar] [CrossRef]
  28. Sulaiman, A.H.; Husain, R.; Seluakumaran, K. Evaluation of early hearing damage in personal listening device users using extended high-frequency audiometry and otoacoustic emissions. Eur. Arch. Otorhinolaryngol. 2014, 271, 1463–1470. [Google Scholar] [CrossRef]
  29. Hwang, J.H.; Tan, C.T.; Chiang, C.W.; Liu, T.C. Acute effects of alcohol on auditory thresholds and distortion product otoacoustic emissions in humans. Acta Otolaryngol. 2003, 123, 936–940. [Google Scholar] [CrossRef]
  30. Rosenhall, U.; Sixt, E.; Sundh, V.; Svanborg, A. Correlations between presbyacusis and extrinsic noxious factors. Int. J. Audiol. 1993, 32, 234–243. [Google Scholar] [CrossRef]
  31. Popelka, M.M.; Cruickshanks, K.J.; Wiley, T.L.; Tweed, T.S.; Klein, B.E.K.; Klein, R.; Nondahl, D. Moderate alcohol consumption and hearing loss: A protective effect. J. Am. Geriatr. Soc. 2000, 48, 1273–1278. [Google Scholar] [CrossRef]
  32. Gopinath, B.; Flood, V.M.; McMahon, C.M.; Burlutsky, G.; Smith, W.; Mitchell, P. The effects of smoking and alcohol consumption on age-related hearing loss: The blue mountains hearing study. Ear Hear. 2010, 31, 277–282. [Google Scholar] [CrossRef] [PubMed]
  33. Curhan, S.G.; Eavey, R.; Shargorodsky, J.; Curhan, G.C. Prospective study of alcohol use and hearing loss in men. Ear Hear. 2011, 32, 46–52. [Google Scholar] [CrossRef] [PubMed]
  34. Dawes, P.; Cruickshanks, K.J.; Moore, D.R.; Edmondson-Jones, M.; McCormack, A.; Fortnum, H.; Munro, K.J. Cigarette smoking, passive smoking, alcohol consumption, and hearing loss. J. Assoc. Res. Otolaryngol. 2014, 15, 663–674. [Google Scholar] [CrossRef] [PubMed]
  35. Curhan, S.G.; Eavey, R.; Wang, M.; Stampfer, M.J.; Curhan, G.C. Prospective study of alcohol consumption and self-reported hearing loss in women. Alcohol 2015, 49, 71–77. [Google Scholar] [CrossRef] [Green Version]
  36. Cruickshanks, K.J.; Wiley, T.L.; Tweed, T.S.; Klein, B.E.K.; Klein, R.; Mares-Perlman, J.A.; Nondahl, D.M. Prevalence of hearing loss in older adults in Beaver Dam, Wisconsin: The epidemiology of hearing loss study. Am. J. Epidemiol. 1998, 148, 879–886. [Google Scholar] [CrossRef]
  37. Cruickshanks, K.J.; Nondahl, D.M.; Tweed, T.S.; Wiley, T.L.; Klein, B.E.K.; Klein, R.; Chappell, R.; Dalton, D.S.; Nash, S.D. Education, occupation, noise exposure history and the 10-yr cumulative incidence of hearing impairment in older adults. Hear Res. 2010, 264, 3–9. [Google Scholar] [CrossRef]
  38. Nash, S.D.; Cruickshanks, K.J.; Klein, R.; Klein, B.E.K.; Nieto, F.J.; Huang, G.H.; Pankow, J.S.; Tweed, T.S. The prevalence of hearing impairment and associated risk factors. The beaver dam offspring study. Arch. Otolaryngol. Head Neck Surg. 2011, 137, 432–439. [Google Scholar] [CrossRef]
  39. Del Boca, F.K.; Darkes, J. The validity of self-reports of alcohol consumption: State of the science and challenges for research. Addiction 2003, 98 (Suppl. 2), 1–12. [Google Scholar] [CrossRef]
  40. Simmons, J.S.; Wills, T.A.; Emery, N.N.; Mark, R.M. Quantifying alcohol consumption: Self-report, transdermal assessment, and prediction of dependence symptoms. Addict. Behav. 2015, 50, 205–212. [Google Scholar] [CrossRef]
  41. Kraaijenga, V.J.C.; van Munster, J.J.C.M.; van Zanten, G.A. Association of behavior with noise-induced hearing loss among attendees of an outdoor music festival: A secondary analysis of a randomized clinical trial. JAMA Otolaryngol. Head Neck Surg. 2018, 144, 490–497. [Google Scholar] [CrossRef]
Figure 1. (a) The means and standard deviations are shown for DPOAE levels across the frequencies tested in women only by self-reported volume categories; (b) The means and standard deviations are shown for DPOAE levels across the frequencies tested in men only by self-reported volume categories.
Applsci 09 01608 g001
Figure 2. (a) The means and standard deviations are shown for DPOAE levels across the frequencies tested in women only by Level categories. Low-level was ≤73.7 dBA, the median value and high-level was >73.7 dBA; (b) The means and standard deviations are shown for DPOAE levels across the frequencies tested in men only by Level categories. Low-level was ≤73.7 dBA, the median value and high-level was >73.7 dBA.
Applsci 09 01608 g002
Figure 3. (a) The means and standard deviations are shown for DPOAE levels across the frequencies tested in women only by self-reported drinking categories; (b) The means and standard deviations are shown for DPOAE levels across the frequencies tested in men only by self-reported drinking categories.
Applsci 09 01608 g003
Figure 4. The scatterplot for drinks per month (DPM) and preferred listening level (LAeq) is shown for all 216 participants. The linear regression line is also shown.
Applsci 09 01608 g004
Figure 5. (a) The scatterplot for drinks per month (DPM) and preferred listening level (LAeq) is shown for women only (n = 161). The linear regression line is also shown; (b) The scatterplot for drinks per month (DPM) and preferred listening level (LAeq) is shown for men only (n = 55). The linear regression line is also shown.
Applsci 09 01608 g005
Figure 6. (a) The means and standard deviations are shown for DPOAE levels across the frequencies tested in women only by Risk categories.; (b) The means and standard deviations are shown for DPOAE levels across the frequencies tested in men only by Risk categories.
Applsci 09 01608 g006
Table 1. Sex, ethnicity, and race characteristics of the study participants.
Participants (n = 216)
nPercent
Women16174.5
Men5525.5
Ethnicity (n = 216)
Hispanic or Latino6429.6
Not Hispanic or Latino15069.4
Decline to state21.0
Race (n = 216)
American Indian/Alaska Native31.4
Asian2411.1
Native Hawaiian/Pacific Islander52.3
Black/African American209.3
White13462.0
Decline to state3013.9
Table 2. The number, and percentages of participants who reported listening to a PM system at Low/medium volume and Loud/very loud volume and who reported number of drinks per month are shown. The means, standard deviations, minimums, and maximums for preferred listening level are also presented. These data are further separated for women and men.
ALL (n = 216)WOMEN (n = 161)MEN (n = 55)
Self–reported PM system use 1
Light (≤1 h/wk)30 (14.3%)24 (15.4%)6 (11.1%)
Moderate (1–7 h/wk)123 (58.6%)95 (60.9%)28 (51.9%)
Heavy (>7 h/wk)57 (27.1%)37 (23.7%)20 (37.0%)
Longest single use during a typical day 1
<1 h93 (44.3%)73 (46.8%)20 (37.0%)
1 h63 (30.0%)44 (28.2%)19 (35.2%)
2 h38 (18.1%)29 (18.6%)9 (16.7%)
3 h15 (7.1%)10 (6.4%)5 (9.3%)
4 h1 (0.5%)0 (0.0%)1 (1.8%)
Volume use 1
Low/medium volume136 (65.1%)110 (70.5%)26 (49.1%)
Loud/very loud volume73 (34.9%)46 (29.5%)27 (50.9%)
Hear people 2
Easily hear/have a little trouble hearing people158 (75.2%)121 (77.6%)37 (68.5%)
Have a lot of trouble/cannot hear people52 (24.8%)35 (22.4%)17 (31.5%)
Report tinnitus after PM system use 1
Yes27 (12.9%)23 (14.7%)4 (7.4%)
Preferred listening level LAeq (dB)
Mean (SD)73.0 (10.7)71.8 (10.7)76.5 (10.1)
Minimum, maximum49.4, 97.549.4, 97.549.6, 93.1
Drinks per month (DPM)
Non–drinkers61 (28.2%)44 (27.3%)17 (30.9%)
Light drinkers (≤14 drinks)78 (36.1%)60 (37.3%)18 (32.7%)
Heavy drinkers (>14 drinks)77 (35.7%)57 (35.4%)20 (36.4%)
1 Seven participants (5 women, 1 man) reported not using a personal music system with earphones and 1 man could not recall volume use; 2 Six participants (5 women, 1 man) reported not using a personal music system with earphones.

