Article

Acquisition and Repeatability of High-Frequency Distortion Product Otoacoustic Emissions Using Two Different Calibration Methods in Newborns

School of Speech, Language, and Hearing Sciences, San Diego State University, 5500 Campanile Dr., San Diego, CA 92182-1518, USA
*
Author to whom correspondence should be addressed.
Appl. Sci. 2019, 9(15), 2947; https://doi.org/10.3390/app9152947
Submission received: 1 June 2019 / Revised: 12 July 2019 / Accepted: 19 July 2019 / Published: 24 July 2019
(This article belongs to the Special Issue Theoretical and Clinical Applications of Otoacoustic Emissions)

Abstract

:

Featured Application

The potential application of this work lies in the ability to monitor the highest frequencies evoking an otoacoustic emission to assess basal cochlear health in newborns receiving ototoxic treatments.

Abstract

Distortion-product otoacoustic emissions (DPOAEs) elicited with high-frequency (HF; up to 16 kHz) stimuli are measurable and repeatable in normal-hearing adults and children, adult patients, and are sensitive to ototoxic insults in adults. However, objective tests for monitoring basal cochlear function in those too young to respond subjectively need to be developed. DPOAE levels recorded at frequencies <10 kHz are well characterized, but DPOAE levels measured up to 16 kHz do not exist for newborns. The goal of the current study is to determine if HF DPOAEs are measurable and repeatable in newborns. DPOAEs were measured from 2–16 kHz (f2/f1 of 1.22; L1/L2 = 65/55 dB SPL) using two different calibration methods (forward pressure level—FPL and in-the-ear—SPL) in 26 newborns. To assess repeatability, the probe was removed then re-inserted for a second round of testing. Results indicate that HF DPOAEs can be evoked and are repeatable in newborns and the use of FPL calibration shows promise for measuring HF responses and maximizing repeatability. To be implemented in monitoring programs where the highest frequencies with responses are continuously tested, stimulus parameters used to evoke newborn HF DPOAEs and calibration methods need further exploration.

1. Introduction

Otoacoustic emissions (OAEs) are low-level sounds generated by the active processes of the cochlea, namely outer hair cells (OHCs). Evoked OAEs are generated in response to auditory stimuli, while spontaneous OAEs naturally occur in the absence of stimulation. Distortion-product otoacoustic emissions (DPOAEs) are generated by presenting two closely spaced pure-tones simultaneously in the ear canal. The intermodulation distortion generated by the two pure tones at the level of the basilar membrane generates several new acoustic frequency components, the largest being 2f1–f2 in humans [1,2]. To generate DPOAEs, the higher frequency evoking stimulus tone, f2, and the lower frequency stimulus tone, f1, must sufficiently overlap along the basilar membrane. This relationship of the evoking stimuli is dictated by the frequency ratio (f2/f1). In addition to the frequency ratio, f1 and f2 are presented at a given level, which can be equivalent (L1 = L2), offset by a given amount (e.g., L1 = L2 + 10 dB), or one stimulus can be varied while the other is fixed (input/output function). Traditionally, discrete frequencies (≤10 kHz) of the primary tones are varied with fixed levels (e.g., L1/L2 = 65/55 dB SPL) and ratio (1.22) for clinical applications. The 1.22 ratio is sufficient for determining whether DPOAEs are present over a wide frequency range despite the fact this ratio does not necessarily yield the largest DPOAE level at each tested frequency, which is especially true for higher frequencies [3,4,5].
Over the last four decades, DPOAE responses have been characterized at frequencies (≤10 kHz) across the lifespan in those with and without hearing loss [6,7,8,9,10,11,12,13]. Given DPOAEs provide objective frequency specific information regarding cochlear health; one of the major applications of this measurement lies in testing those who cannot provide reliable behavioral responses [14]. When comparing emissions measured in newborns and adults, findings indicate that the cochlear mechanisms responsible for generating emissions are mature and adult-like at birth, but differences in outer and middle ear properties can influence the forward transmission of signals [15]. DPOAE levels in infants are higher than those measured in adults, suggesting age-related differences [8,16]. Specifically, newborns’ ear canal and middle ear spaces are non-adult like. As the newborn ages, the inner two-thirds of the external auditory canal ossifies and the canal length increases resulting in increased canal stiffness and decreased resonance [17]. The tympanic membrane rotates its angle more vertically and decreases in thickness [18,19]. Middle ear mass decreases due to changes in ossicle bone density and reduction of middle ear mesenchyme [20]. These developments, occurring over the course of weeks to years, alter the acoustic properties of the newborn outer and middle ear, thus influencing OAE measures.
Middle ear pathologies can reduce or extinguish OAE levels and should be monitored to ensure that any variability in OAE levels are due to cochlear changes only [16]. Another way to reduce DPOAE variability is to ensure accurate stimulus levels from one session to the next. Traditional calibration procedures involve placing a measurement probe at the entrance to the ear canal which creates standing waves, as not all of the sound is absorbed by the eardrum and some energy is reflected. The microphone in the measurement probe will record a pressure null relative to the eardrum pressure at approximately one-quarter of the wavelength of the stimulus frequency which corresponds to the distance between the measurement probe and the eardrum [21,22]. This results in a discrepancy up to 15–20 dB between the sound pressures at the eardrum versus the measurement microphone [5,22,23]. Given that ear canal lengths and measurement probe insertions vary, the sound pressure discrepancy occurs at frequencies greater than 2 kHz and a single correction factor cannot be applied [5,22]. Thus, alternative calibration methods have been explored to combat the issues of standing waves to provide better control over stimulus and emission levels [24]. Forward pressure level (FPL) is one such alternative where, in theory, the incident pressure is isolated allowing less susceptibility to standing waves in an enclosed ear canal, which in turn provides better accuracy of stimulus levels and consistent measurements [24,25,26]. With FPL, individual ear canal properties are accounted for while avoiding influences of reflected pressure from the eardrum [26]. It is suggested that FPL can be performed in any size ear canal and used to quantify stimulus levels up to 18 kHz [26]. To achieve FPL calibration, the incident and reflected signals in the ear canal need to be differentiated. So, the impedance characteristics of the source (measurement probe) and load (ear canal and eardrum) need to be determined. Using the Thévenin-equivalent, a simplification of a complex electrical circuit, both source pressure and impedance of the measurement probe is determined by presenting a wideband chirp stimulus to at least two known acoustic loads (e.g., cylindrical cavities of varying lengths). Then, the impedance of the load can be determined which allows the incident and reflected waves to be segregated. Technical and computational details pertaining to FPL calibration can be found in the literature [24,25,26,27,28,29,30]. The full extent of the influence of FPL on DPOAE measurements in newborns has not been established given the continued ear canal and middle ear development over weeks to years following birth. For example, the more flaccid ear canal walls of newborns will impact how sound energy presented to the ear is reflected, which might influence whether FPL proves beneficial [31]. It is postulated that the calibration technique will have less influence on DPOAEs measured at frequencies ≤8 kHz versus those measured at higher frequencies (8–16 kHz) in newborns due to shorter ear canal lengths (~15 mm; [17,32]) compared to adults (22–31 mm; [33,34]), resulting in standing waves occurring at frequencies > 6 kHz in an enclosed ear canal [22]. Being attentive to ear canal and middle ear development, as well as calibration techniques used, can aid in reducing variability in serial DPOAE measures.
Once DPOAE variability is minimized, repeatability of the measurement needs to be determined in order for DPOAE testing to be used in monitoring programs. Probe reinsertion is the single greatest source of variability in OAE measures [35]. Significant DPOAE level changes for immediate test–retest trials (no probe removal) or up to 5 to 10 days apart are defined as exceeding approximately 0.7 to 7 dB for frequencies between 0.5 and 5 kHz [36,37,38]. Greater variability is reported for higher frequency measurements where a change of 2.3 to 8 dB constituted a significant change for frequencies of 6–7 kHz [38,39]. To increase the accuracy for estimating DPOAE short-term test–retest change expectations, a meta-analysis including data from 10 published studies was completed [40]. The 90% reference limit for DPOAE test–retest changes ranged from ±3.76 to ±5.63 dB for f2 frequencies spanning 1 to 6 kHz. Additionally, reference limits increased slightly for the higher frequencies analyzed, 4 and 6 kHz [41].
DPOAE testing is used in serial monitoring programs due to its objective, quick, frequency-specific, and repeatable nature [40,41,42,43,44,45,46], but testing is restricted to frequencies ≤10 kHz due to a lack of commercially available equipment able to reliably produce stimulus tones >10 kHz. Ideally, cochlear health would be monitored at the highest frequencies producing a response as this is where damage initially occurs due to ototoxic drug exposures [47]. Using customized equipment, HF (up to 16 kHz) DPOAEs have been measured [5,48] and are repeatable across testing sessions in normal-hearing young adults and children [5,49,50,51,52], in those with cystic fibrosis tested between ototoxic treatments [51], and identified the earliest signs of damage at the highest frequencies with present DPOAEs in adults exposed to ototoxic agents [53], but have not been recorded in newborns. While DPOAEs may not be recorded at the highest frequencies of human hearing for each individual based on their cochlear health, it is imperative to monitor the highest frequencies with a response in individuals exposed to ototoxic agents to identify the earliest signs of damage [53,54]. For clinical applications, this may necessitate that higher stimulus levels, varied stimulus frequency ratios, and criteria defining a present DPOAE may be altered to maximize monitoring capabilities at the highest frequencies for each individual.
As spontaneous otoacoustic emissions (SOAEs) show sensitivity to cochlear damage, are present in newborns, occur at higher frequencies in newborns compared to adults, and can influence DPOAE levels [16,55,56,57], SOAEs should be measured continuously as well in monitoring programs. SOAEs are sounds recorded from the inner ear without external stimulation. SOAEs arise from active cochlear mechanisms and can influence DPOAE recordings. Those with SOAEs had significantly greater DPOAE levels compared to those without detectable SOAEs in adults [16,58] and infants [16]. Given that SOAE presence has significant effects on DPOAE responses, the effects should be considered in clinical applications of DPOAE measurements. SOAE levels range between −18 to 25.5 dB SPL ([56,59] and decrease with increasing age [60,61,62]. Strickland [62] reported SOAE levels as high as 29.3 dB SPL in children and 30.4 dB SPL in infants. SOAEs recorded in infants, children, and adults, typically occur within the frequency range of 1–5 kHz [63,64,65] and the average number of SOAEs per ear is reported to be between 2 to 3 emissions [62,65]. As age increases, the frequency range of SOAEs tends to decrease [61,65,66,67]. In children and infants the majority of SOAEs are recorded between 2.5–5 kHz, whereas in adults most SOAEs are recorded between 1–2 kHz [60,61,62,64]. Less often, SOAEs have been reported at frequencies of 7 kHz and higher [59,68]. The lack of recording higher-frequency SOAEs may be related to limitations of some clinically available instruments with a 6.25 kHz upper frequency cutoff [69]. Asymmetries in the number of SOAEs recorded between ears exist in children and adults, with significantly more SOAEs recorded in the right ears of subjects with unilateral or bilateral SOAEs [56,59,61,66,70,71]. Also, gender differences are apparent in infants and adults, with the prevalence and level of SOAEs greater in females compared to males [62,65,71,72,73]. While these differences between ears and gender for SOAEs remain unexplained, McFadden [74] suggests that these findings might be related to less efferent inhibition in females and in right ears. Additionally, some studies report that females tend to have more SOAEs than their male counterparts [55,61,66]. When recording SOAEs in newborns, Qi et al. [55] reported that 56.7% of newborn ears exhibited SOAEs and they occurred at higher frequencies than adults. More recently, Abdala et al. [54] reported that 85% of newborns have at least one SOAE, with an average of four to five SOAEs per emitting ear. Overall, a high percentage of newborns exhibit SOAEs and this measurement should not be ignored when recording cochlear responses.
The purpose of this study is to measure and determine the repeatability of HF DPOAEs in newborns and assess if there is an influence of calibration technique, in-the-ear SPL versus FPL, on the measurements. Given a high percentage of newborns exhibit SOAEs, which can influence DPOAE measures, SOAEs were recorded as well [75].

2. Methods

2.1. Participants

Following parental consent, twenty-five term newborns (12 females, 13 males) with gestational ages ranging from 37 to 41 weeks and one 36 week gestational age female newborn participated in this study. All passed their newborn hearing screening using automated auditory brainstem response testing (Natus Algo, click stimulus at 35 dBnHL) and were deemed eligible for participation because they were all healthy and awaiting discharge. Predominantly, one ear of each newborn was tested and was chosen based on ease of access, as the newborns were typically on their side in the bassinette. Otoscopy was performed to ensure clear ear canals. A total of nine right and 18 left ears were evaluated, as one newborn had their right ear tested for trial 1 and their left ear tested for trial 2. So, for each trial 26 ears were evaluated and the newborn who had a different ear tested for each trial was excluded in the comparison made between trials. Each newborn’s chronological age at the time of testing ranged from 1 to 3 days. The Institutional Review Boards at San Diego State University and University of California, San Diego, approved this study before data were collected. The average weight was 3279 g and 14 newborns were delivered vaginally, 11 by cesarean section (C-section), and 1 via vaginal birth after cesarean (VBAC).

2.2. Equipment, Calibration, and Software

An emission probe system with all capabilities necessary to reliably measure DPOAES up to 16 kHz was used. The signals for both the f2 and f1 channels were generated at the digital-to-analog converter of a MOTU 96 kHz Audio Firewire Interface (Cambridge, MA, USA), which was connected to a laptop, and presented through the Etymotic Research ER-10X (Elk Grove Village, IL, USA), a low-noise DPOAE probe assembly with built-in sound pressure transducers positioned in the subject’s ear canal. The probe assembly also housed the emission probe microphone (ER-10X), which recorded the sound pressure in the ear canal. The signal measured by the ER-10X microphone was amplified (20 dB) before being digitized by the analog-to-digital converter of the MOTU Audio Firewire Interface.
Two methods of calibration were utilized. First, using EMAV software [76] the source pressure and impedance of the emission probe system were estimated by presenting a chirp stimulus in SPL to five cylindrical cavities of varying length (70.21, 55.32, 43.48, 37.9, and 31.50 mm) housed in the ER10X unit. Thévenin source characteristics are obtained by repetitively solving five linear equations to minimize the difference between measured and expected pressure responses. Error values of less than one for each sound source were achieved and this indicates a good calibration. Once the probe was placed in the newborns ear, the in-the-ear calibration phase of the test was performed and this determined the load pressure. The Thévenin source characteristics previously obtained are combined with the ear canal pressure measured in the newborn to calculate the load impedance, which is required to convert measured pressure in the ear canal to FPL [24,25,26]. Second, the stimulus and DPOAE levels were measured at the plane of the emission probe microphone near the entrance to the ear canal for conventional in-the-ear sound pressure level (SPL) calibration.
EMAV software was used to collect DPOAE data. The software samples the ear-canal sound pressure in 46 ms time windows, accumulates these samples into two interleaved buffers, and averages each buffer in the time domain. The two subaverages are then subtracted (A − B) and Fast Fourier transformed to provide an estimate of the background noise floor. The grand average ([A + B]/2) is transformed to estimate the levels and phases of both stimuli and distortion products present in the ear canal. The level of the noise at the distortion-product frequencies is also estimated from the A–B spectrum. Sampling occurred, for a minimum of 4 s or longer, until one of two stopping rules were met: the noise floor at the distortion-product frequency was less than −20 dB SPL or until 4 s of artifact-free sampling had been averaged. To estimate system distortion, probe microphone measurements were made in an acoustic cavity (B&K 4157 ear simulator) with impedance characteristics similar to the human ear canal. System distortion (energy recorded in the test cavity at 2f1–f2) was at least 80 dB below the stimulus levels used in this study.
Spontaneous otoacoustic emissions (SOAEs) were recorded using SysRes software[77] and the ER10X probe. SysRes is capable of recording real time responses and a sample rate of 32 kHz was used to record SOAEs. A total of 65,536 samples were recorded for a total of one average. No stimulus was used during the recording. A fast Fourier transform was performed on the saved average. Spectral averaging was used to decrease the variance of the noise and allow the measurement of small level SOAEs. In total there were 3639 frequencies evaluated ranging from 0.001 through 15.989 kHz (in 0.004395 Hz steps).

2.3. Procedures

Following consent, testing was performed in the mother’s hospital room while the newborn was swaddled in their bassinet or occasionally in a parent’s arm. Despite only one family per hospital room, the testing environment was not ideal as family members and nursing staff would come and go, visitors did not always abide by the request to keep noise at a minimum, and no incentives were given to assist in the data collection process. Thus, the test team had little control over the test environment. Newborns were tested while awake and quiet or during natural sleep and testing took approximately 20 to 40 min. Stimulus parameters were chosen to mimic typical clinical procedures. DPOAE testing was conducted at discrete frequencies (f2 = 2, 4, 8, 10, 12, 14, and 16 kHz) using an f2/f1 = 1.22. Stimulus levels were L1/L2 = 62/52 dB FPL and 65/55 dB SPL depending on the method chosen for calibration, FPL or SPL. At the start of the session, adequate probe insertion was assessed by determining if the probe was leaking and if a ½ wave resonance of greater than 8 kHz, typical for an adult ear with a shorter ear canal length, was measured. SysRes software was used to ensure the probe was not leaking by presenting a chirp stimulus and examining the frequency response. If a drop in pressure was noted below 1 kHz, a leak was suspected and the probe was reinserted. The ½ wave resonance of the newborn ear canal was recorded using EMAV software and a chirp stimulus. Measured resonances ranged between 9.5 and 11.6 kHz. Once an adequate probe insertion was obtained, discrete frequency sweeps (7 frequencies) were collected starting with SPL and ending with FPL calibration techniques. Two authors were present for data collection. One operated the equipment while the other monitored the probe in the newborn’s ear. If the probe shifted, data collection was paused until probe placement resulted in the same ½ wave resonance as initially measured. Typically, it took under two minutes to collect the data for each discrete frequency sweep. Following the discrete frequency sweep measurement with SPL and FPL calibrations, the probe was removed completely and the testing was repeated, first ensuring adequate probe placement with ½ wave resonances matched from the previous recording. Thus, test-retest repeatability for each calibration method was assessed by completely removing the probe from the newborn’s ear canal and reinserting, resulting in a total of four trials (two discrete frequency sweeps using dB FPL and two discrete frequency sweeps using dB SPL). If time permitted and the newborn remained quiet, SOAEs were collected two times, but without probe removal.
Initial testing occurred using the smallest silicone eartip (3–5 mm Flanged Sanibel Red Silicone) available for use with the ER10X probe, herein referred to as red eartip. Upon initial evaluation of the data, it was realized that many newborns had DPOAEs that would not be classified as present, see data analysis, in comparison to a pilot study using the ER10B+ and a 3 or 4 mm silicone eartip. It was determined that the red eartip used in the current study was slightly different than the one used previously with the ER10B+. After consultations with those that measure DPOAEs in newborns (personal communication Abdala & Luo, 2018), we chose to modify a yellow silicone eartip (3 mm Flanged Sanibel Yellow Silicone), herein referred to as yellow eartip. The yellow eartip was modified by trimming the base to allow a snug fit on the ER10X probe. A deeper and tighter insertion in the ear was achieved with the smaller yellow eartip. See Figure 1 for a photographic reproduction of the eartips used in this study.

2.4. Data Analysis

All discrete frequency sweeps and SOAE data were imported to a spreadsheet for analyses. Only DPOAE level and noise floor data were evaluated at each frequency from the sweep. DPOAE levels had to be 6 dB above the noise floor and greater than −20 dB SPL to be considered present and included in the average data. As a result, not every data point is the average of all 26 newborns. The number of newborns included in the average varied and is indicated in the figures. SOAEs were deemed present if the level exceeded the surrounding data points by minimally 3 dB and then a visual inspection of the spectrum was completed to determine if the higher level than the surrounding points appeared viable. Three of the co-authors completed the visual inspection of the data separately and discussed any points where there was not a consensus. Generally speaking, the frequency region necessitating the greatest discussions occurred at frequencies less than 1.5 kHz where recordings were the noisiest. For those newborns where SOAEs were tested two times, the frequencies where SOAEs were deemed present had to occur in both trials.

3. Results

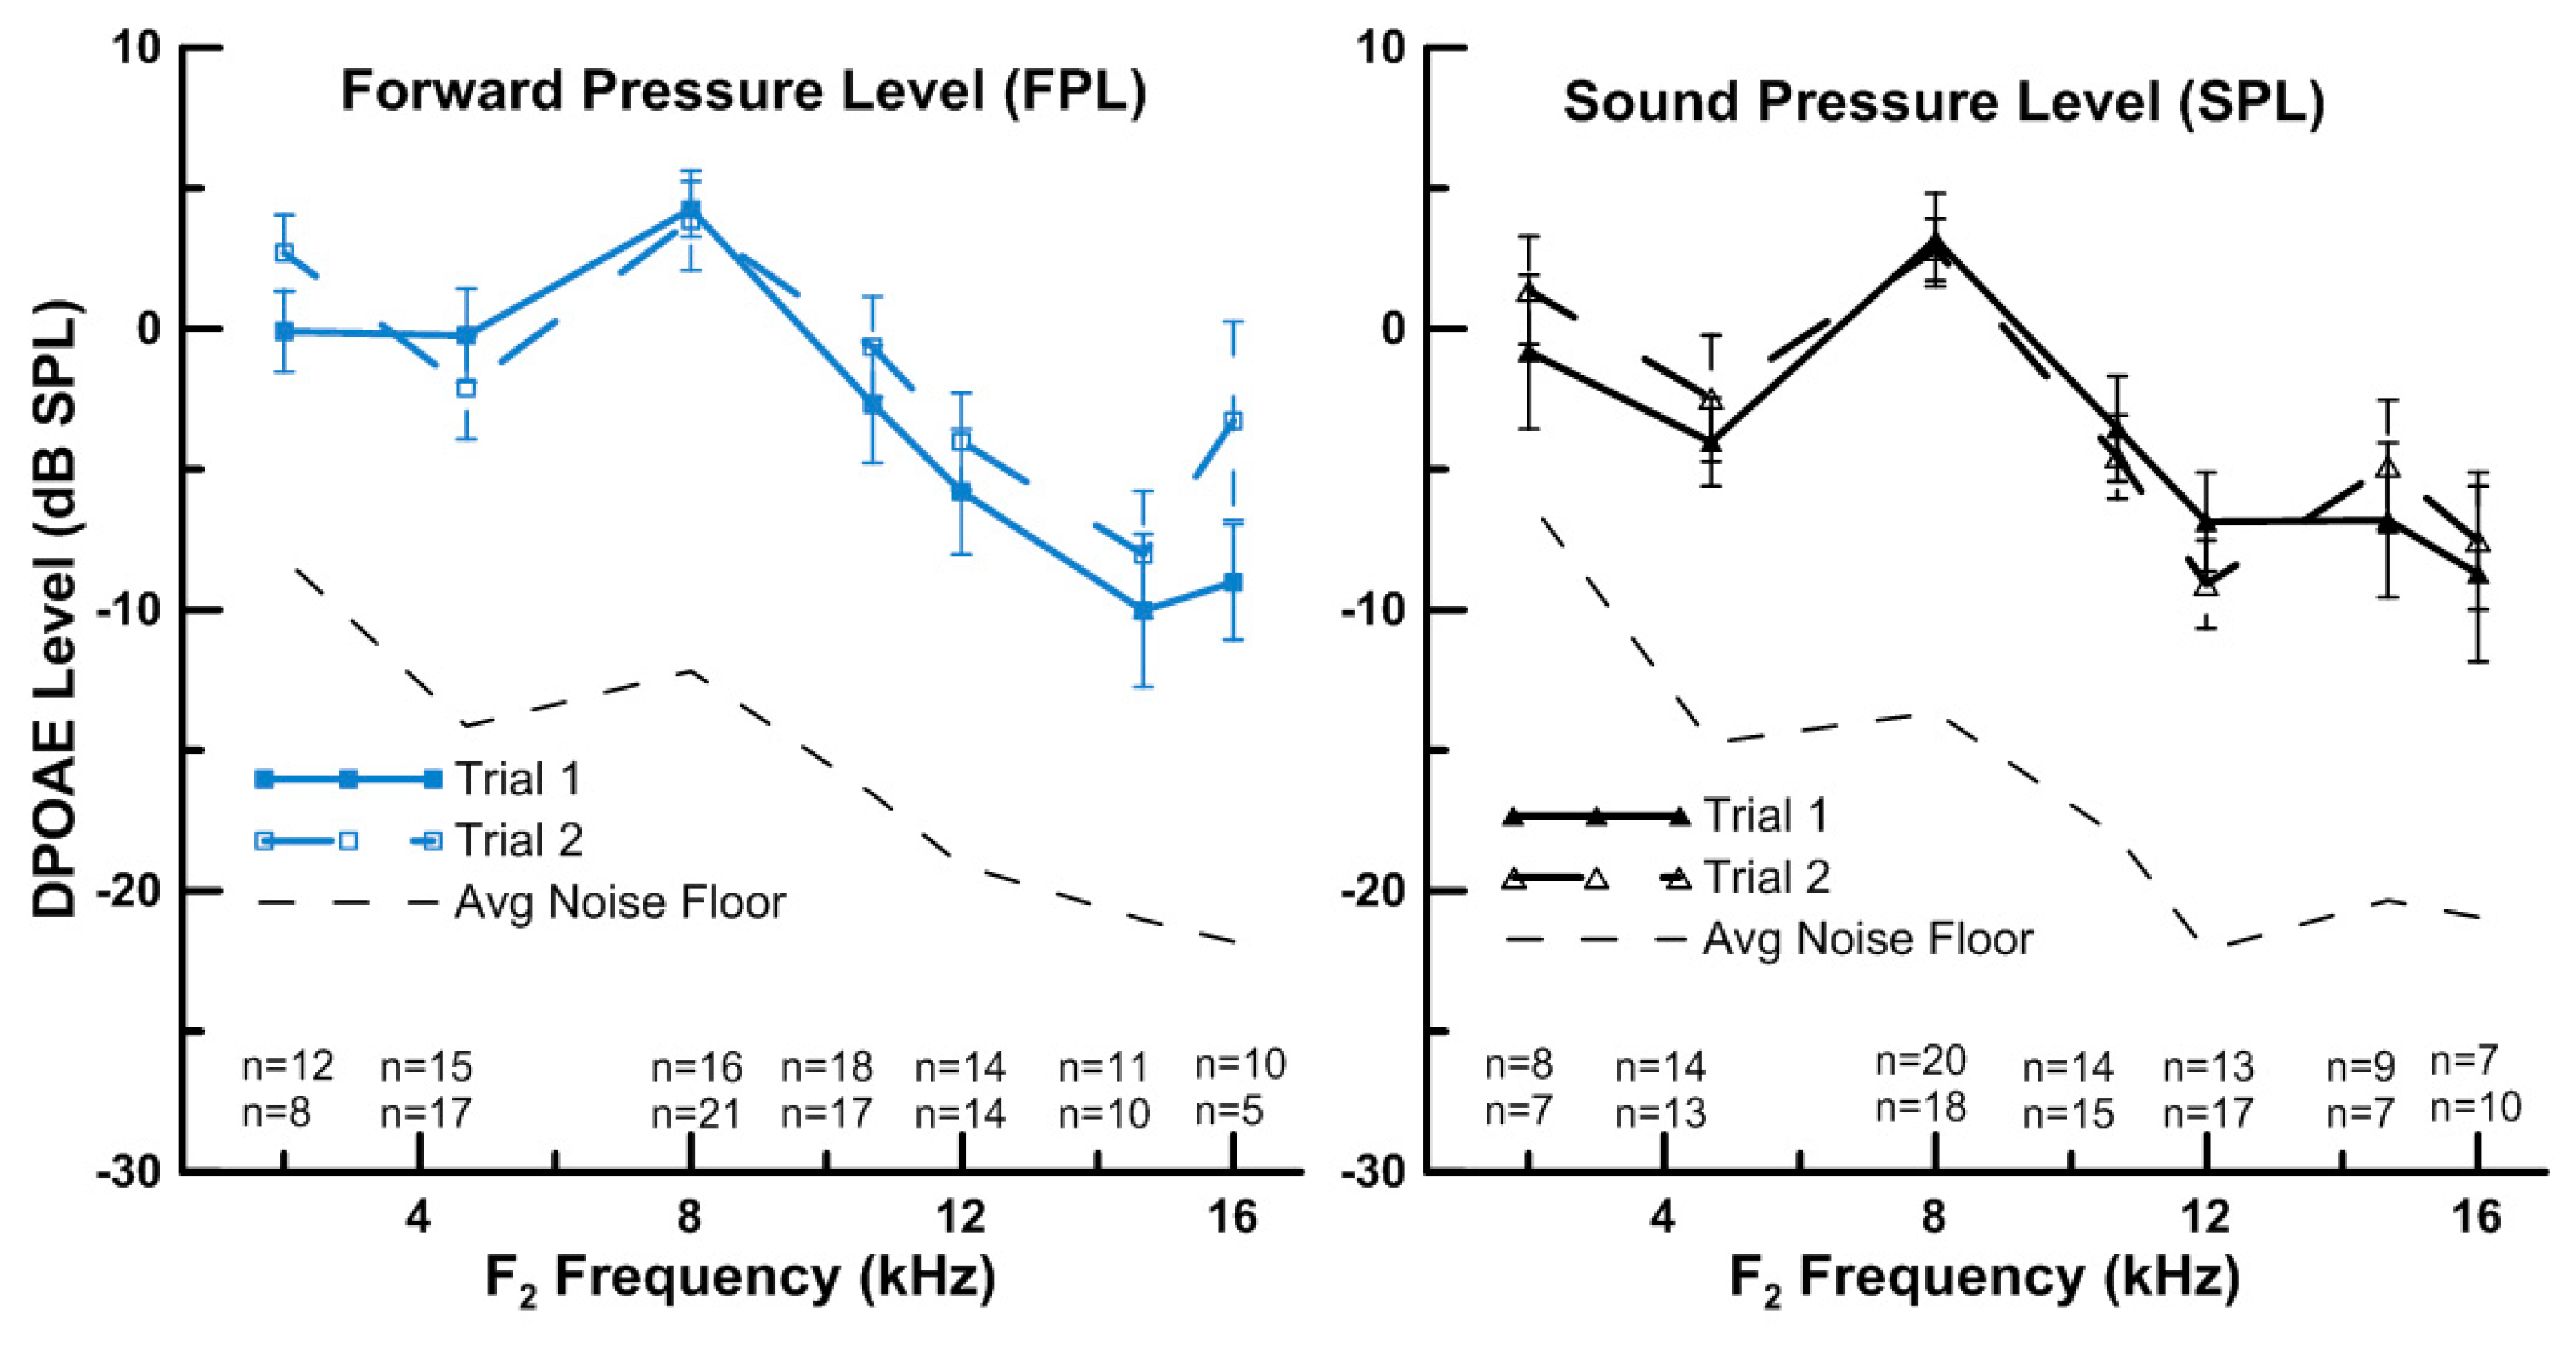
3.1. Measurement of HF DPOAEs (up to 16 kHz)

DPOAEs elicited with HF stimuli can be measured in newborns. Average DPOAE levels compared with the average noise floor from 2 through to 16 kHz across the two trials for each calibration method are shown in Figure 2 for newborns with present emissions. The left panel in Figure 2 displays the results obtained with FPL calibration and in the right panel are the results from traditional SPL calibration. In each panel, the solid and long-dashed lines represent trial 1 and 2, respectively, and error bars are standard error of the mean (SEM). The short-dashed lines denote the average noise floor across the two test trials for those who had present DPOAEs. It should be noted that, despite using research equipment, the average noise floor levels are higher (worse) at all frequencies than have been recorded when testing in a quiet room within a clinic [51] and in a room housed in an infusion center [53], but are no worse, and actually better, than the typical noise floor measured with clinical equipment. For DPOAE levels to be considered present a signal-to-noise ratio (SNR) of 6 dB and a level greater than −20 dB SPL needed to be met, so not every data point includes data deemed present from all 26 ears at each of the seven frequencies tested. In addition, one newborn was too noisy to be tested with the final discrete frequency sweep using FPL calibration so there are only 25 newborns represented in trial 2 for FPL calibration. The number of newborns with present DPOAEs at each frequency for each trial are indicated just above the frequency on the x-axis. The top row of numbers is for trial 1 and the bottom row for trial 2. The frequency with the greatest number of ears with present DPOAEs is 8 kHz, no matter which calibration method is used. Generally, the least number of newborns with present DPOAEs occurred at the lowest (2 kHz) and highest (16 kHz) frequency tested for both calibration methods. When examining data from all frequencies tested (n = 357), for data obtained with FPL calibration, 56 (16%) data points did not meet the overall level criterion of > −20 dB SPL whereas 113 (32%) of the data did not meet the criterion of a 6 dB SNR. If we examine these same values for frequencies of 10 through 16 kHz (n = 203) and 2 through 8 kHz (n = 154), 50 (25%) and 6 (4%) did not meet the criterion of > −20 dB SPL and 55 (27%) and 58 (38%) did not meet the criterion of a 6 dB SNR, respectively. For SPL calibration, when examining data from all frequencies tested (n = 364), 78 (21%) data points did not meet the overall level criterion of > −20 dB SPL whereas 118 (32%) of the data did not meet the criterion of a 6 dB SNR. While examining these same values for frequencies of 10 through 16 kHz (n = 207) and 2 through 8 kHz (n = 157), 63 (31%) and 13 (8%) did not meet the criterion of > −20 dB SPL and 53 (26%) and 65 (41%) did not meet the criterion of a 6 dB SNR, respectively. This means that the majority of the data that did not meet the criteria of present at frequencies of 2 through 8 kHz were due to poor SNR, which is apparent with the high noise floors seen at these frequencies. Whereas, for frequencies of 10 through 16 kHz both poor SNR and decreased levels led to the classification of not present. For those with present DPOAEs, results are similar across the trials for both calibration methods. The overall DPOAE level is similar across the two calibration methods with the greatest levels occurring for frequencies of 8 kHz and below. The minimum, maximum, and average difference between DPOAE levels using FPL and SPL calibrations across both trials are 0.29 (16 kHz T1), 5.08 (12 kHz T2), and 2.16 dB, respectively. FPL calibration resulted in larger DPOAE levels 10 out of 14 times when making comparisons for both trials.

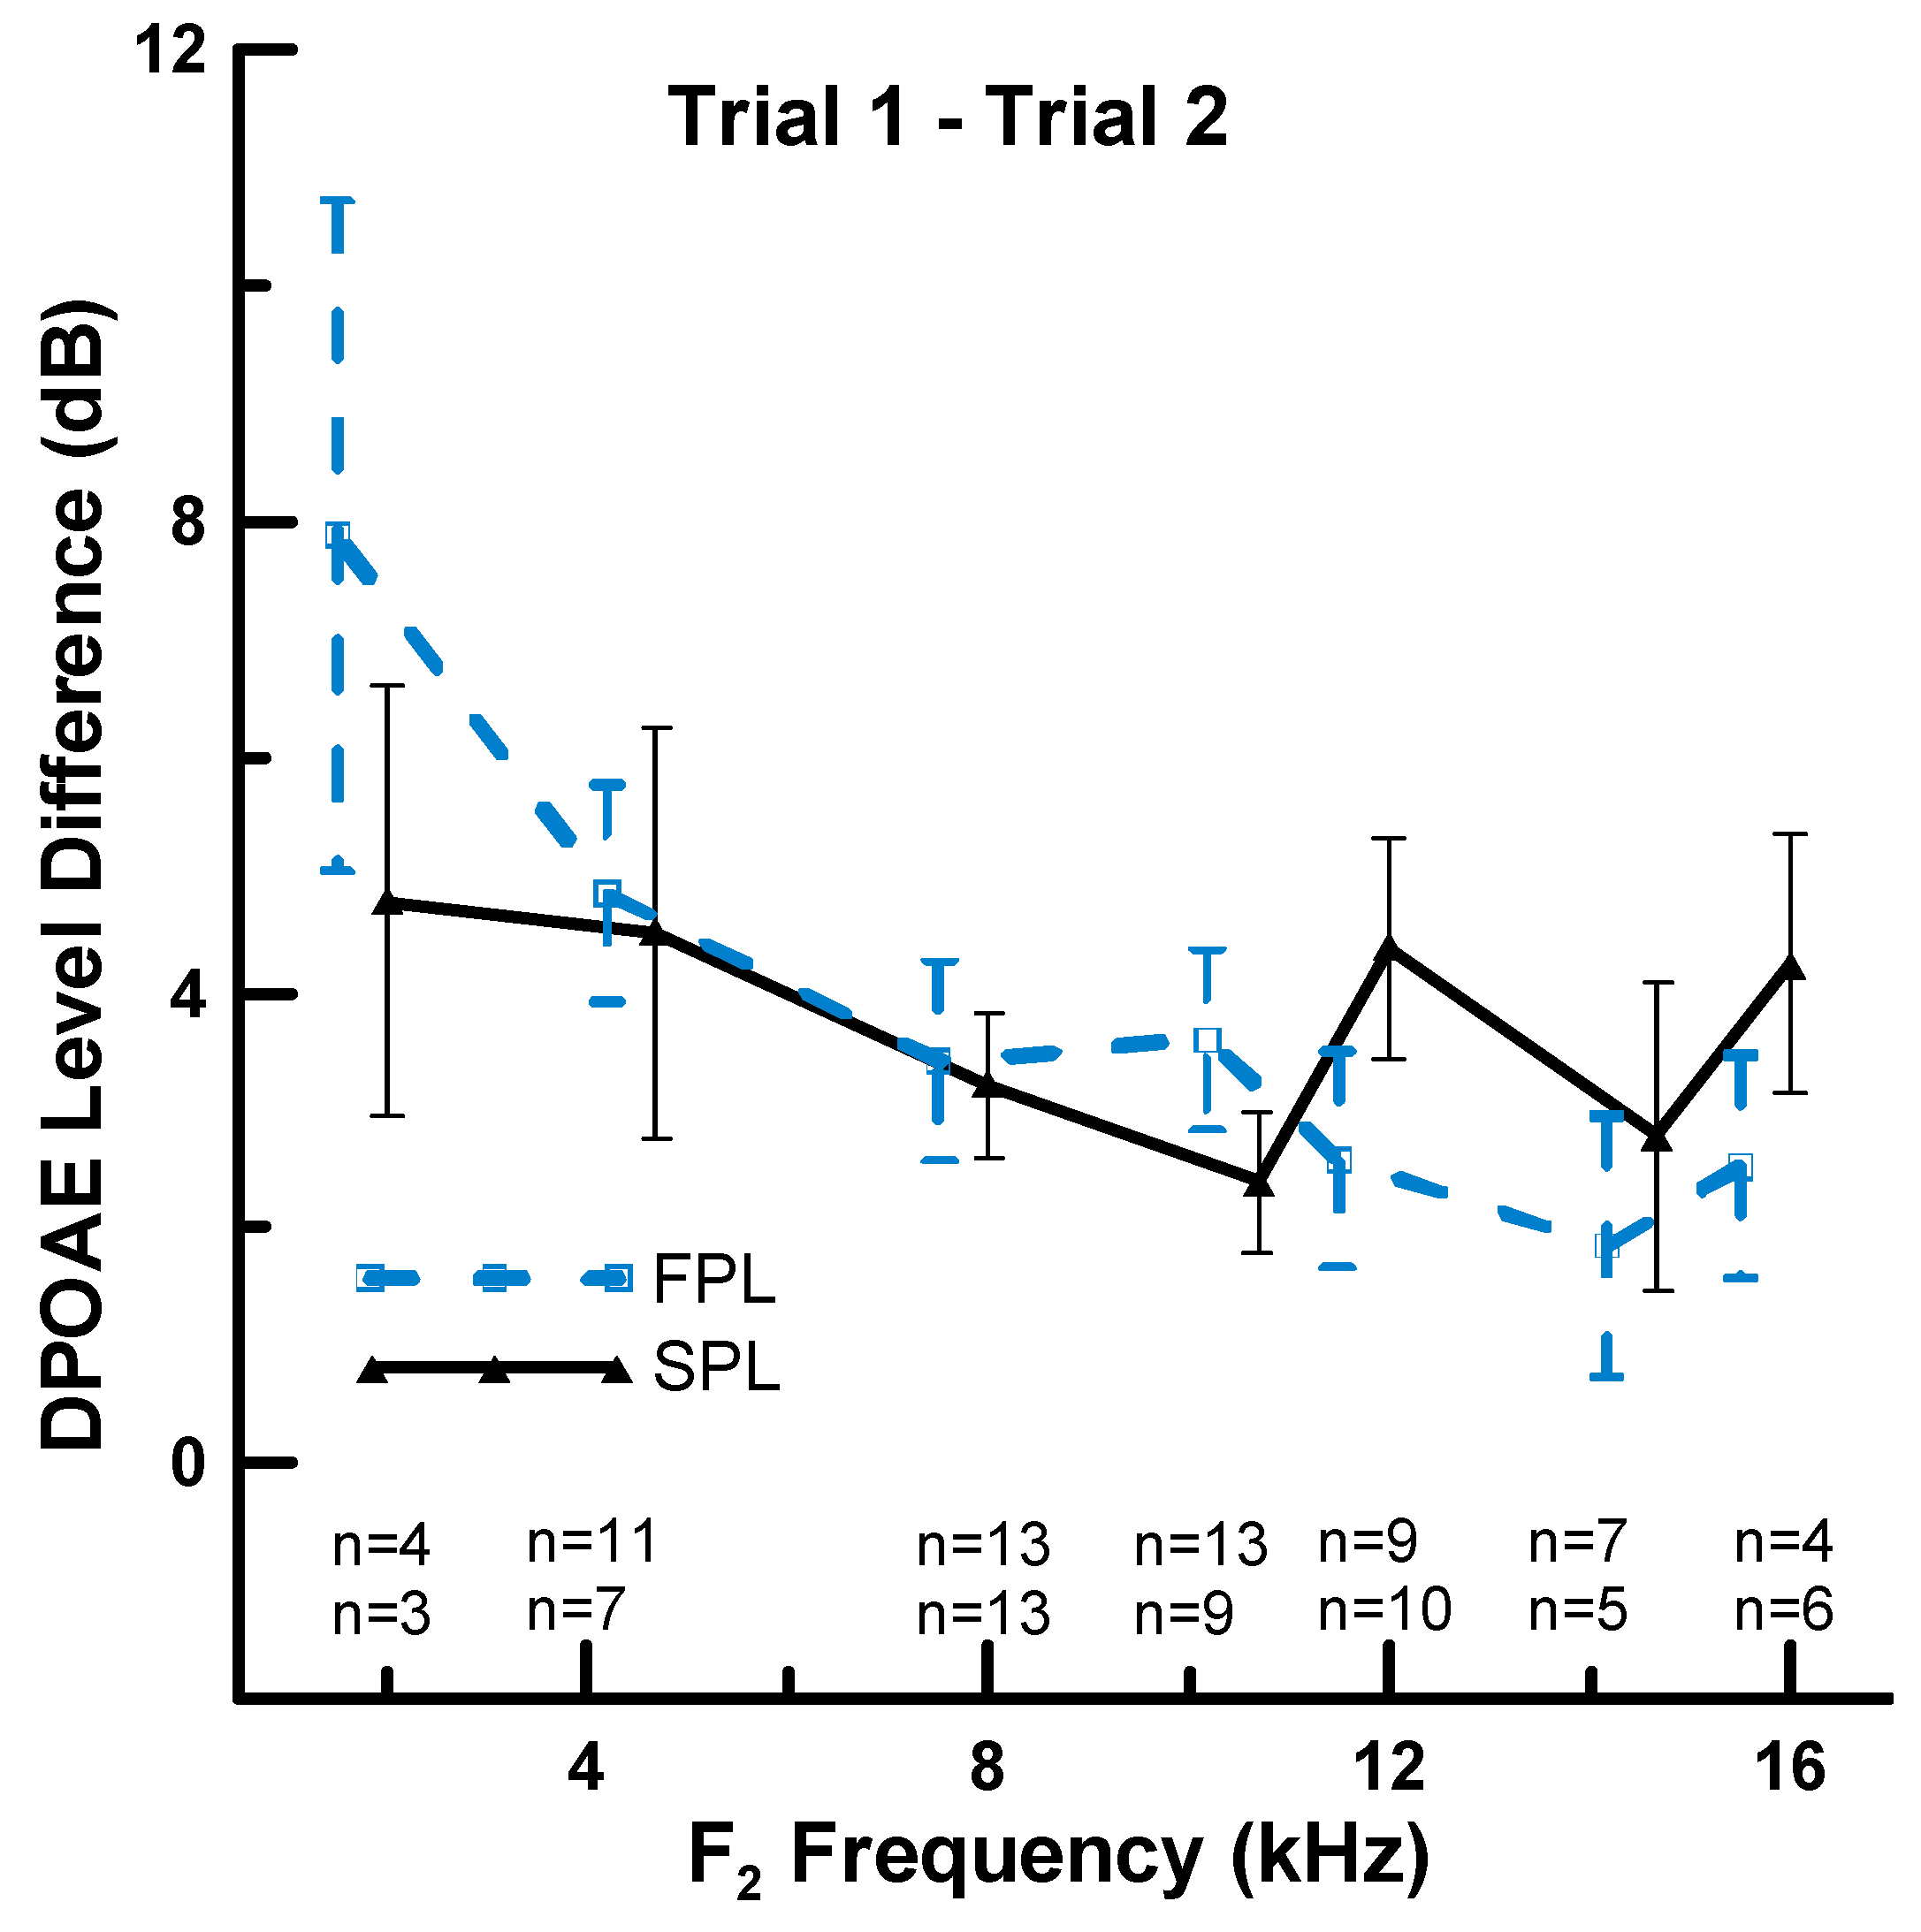
3.2. Effect of Calibration Method on Repeatability of HF DPOAEs

To examine if one calibration method results in less variability between measurements with probe removal in newborns, the average absolute difference in DPOAE levels between the two trials is plotted. If DPOAE levels are identical between trials the difference would be zero. To be included in this difference plot, newborns had to have data for each trial tested for at least one calibration method. While the number of observations is less than when considering only one trial, visual and descriptive analyses were still performed. As seen in Figure 3, the DPOAE level variability from trial 1 to 2 is similar for both FPL, light-blue short-dashed line, and SPL, black solid line, calibrations. At the highest frequencies tested (12–16 kHz), there is a trend that FPL shows slightly less variability in DPOAE levels across the two trials compared to SPL with an average absolute difference between trials of 2.31 versus 3.87 dB, respectively. The greatest variability between the two trials occurred at the two lowest frequencies tested for each calibration method.

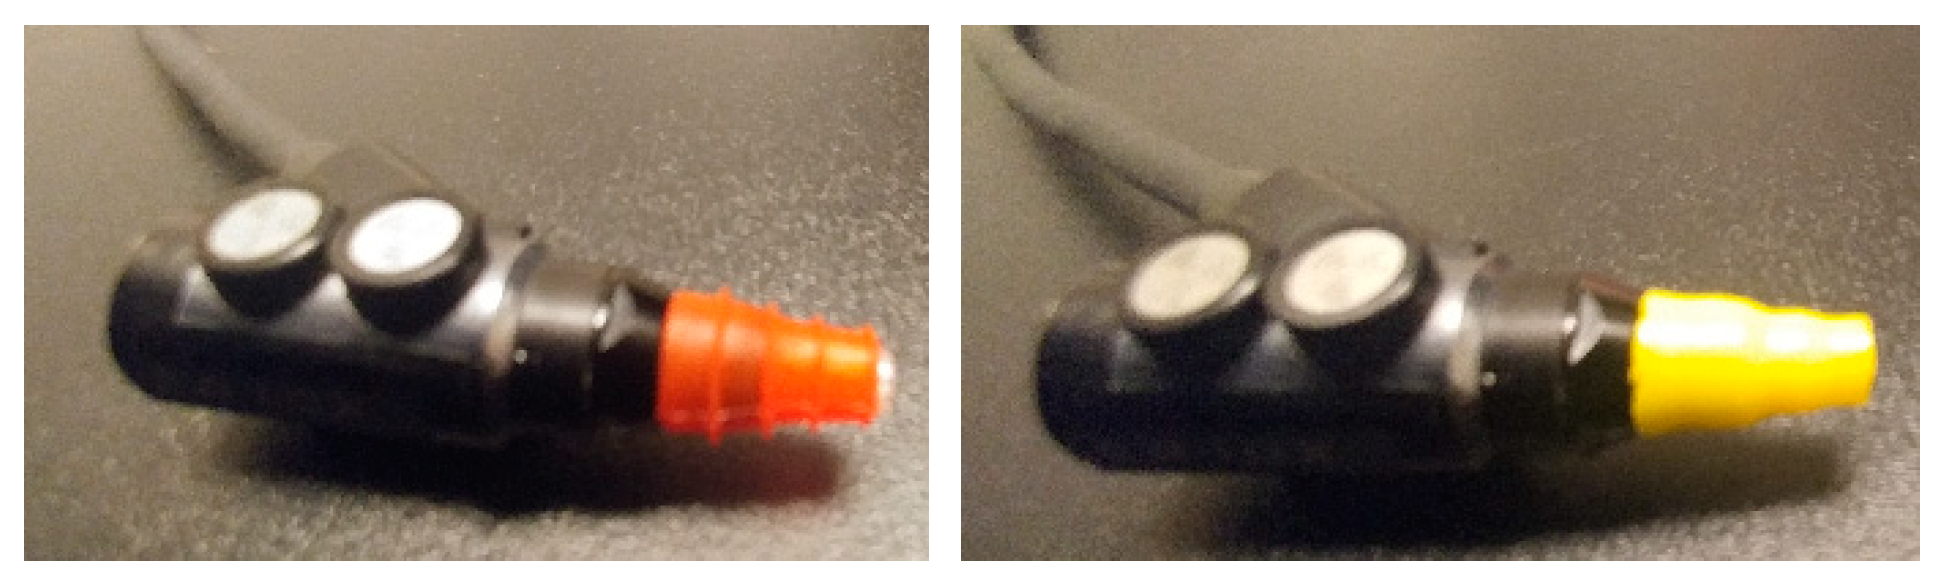
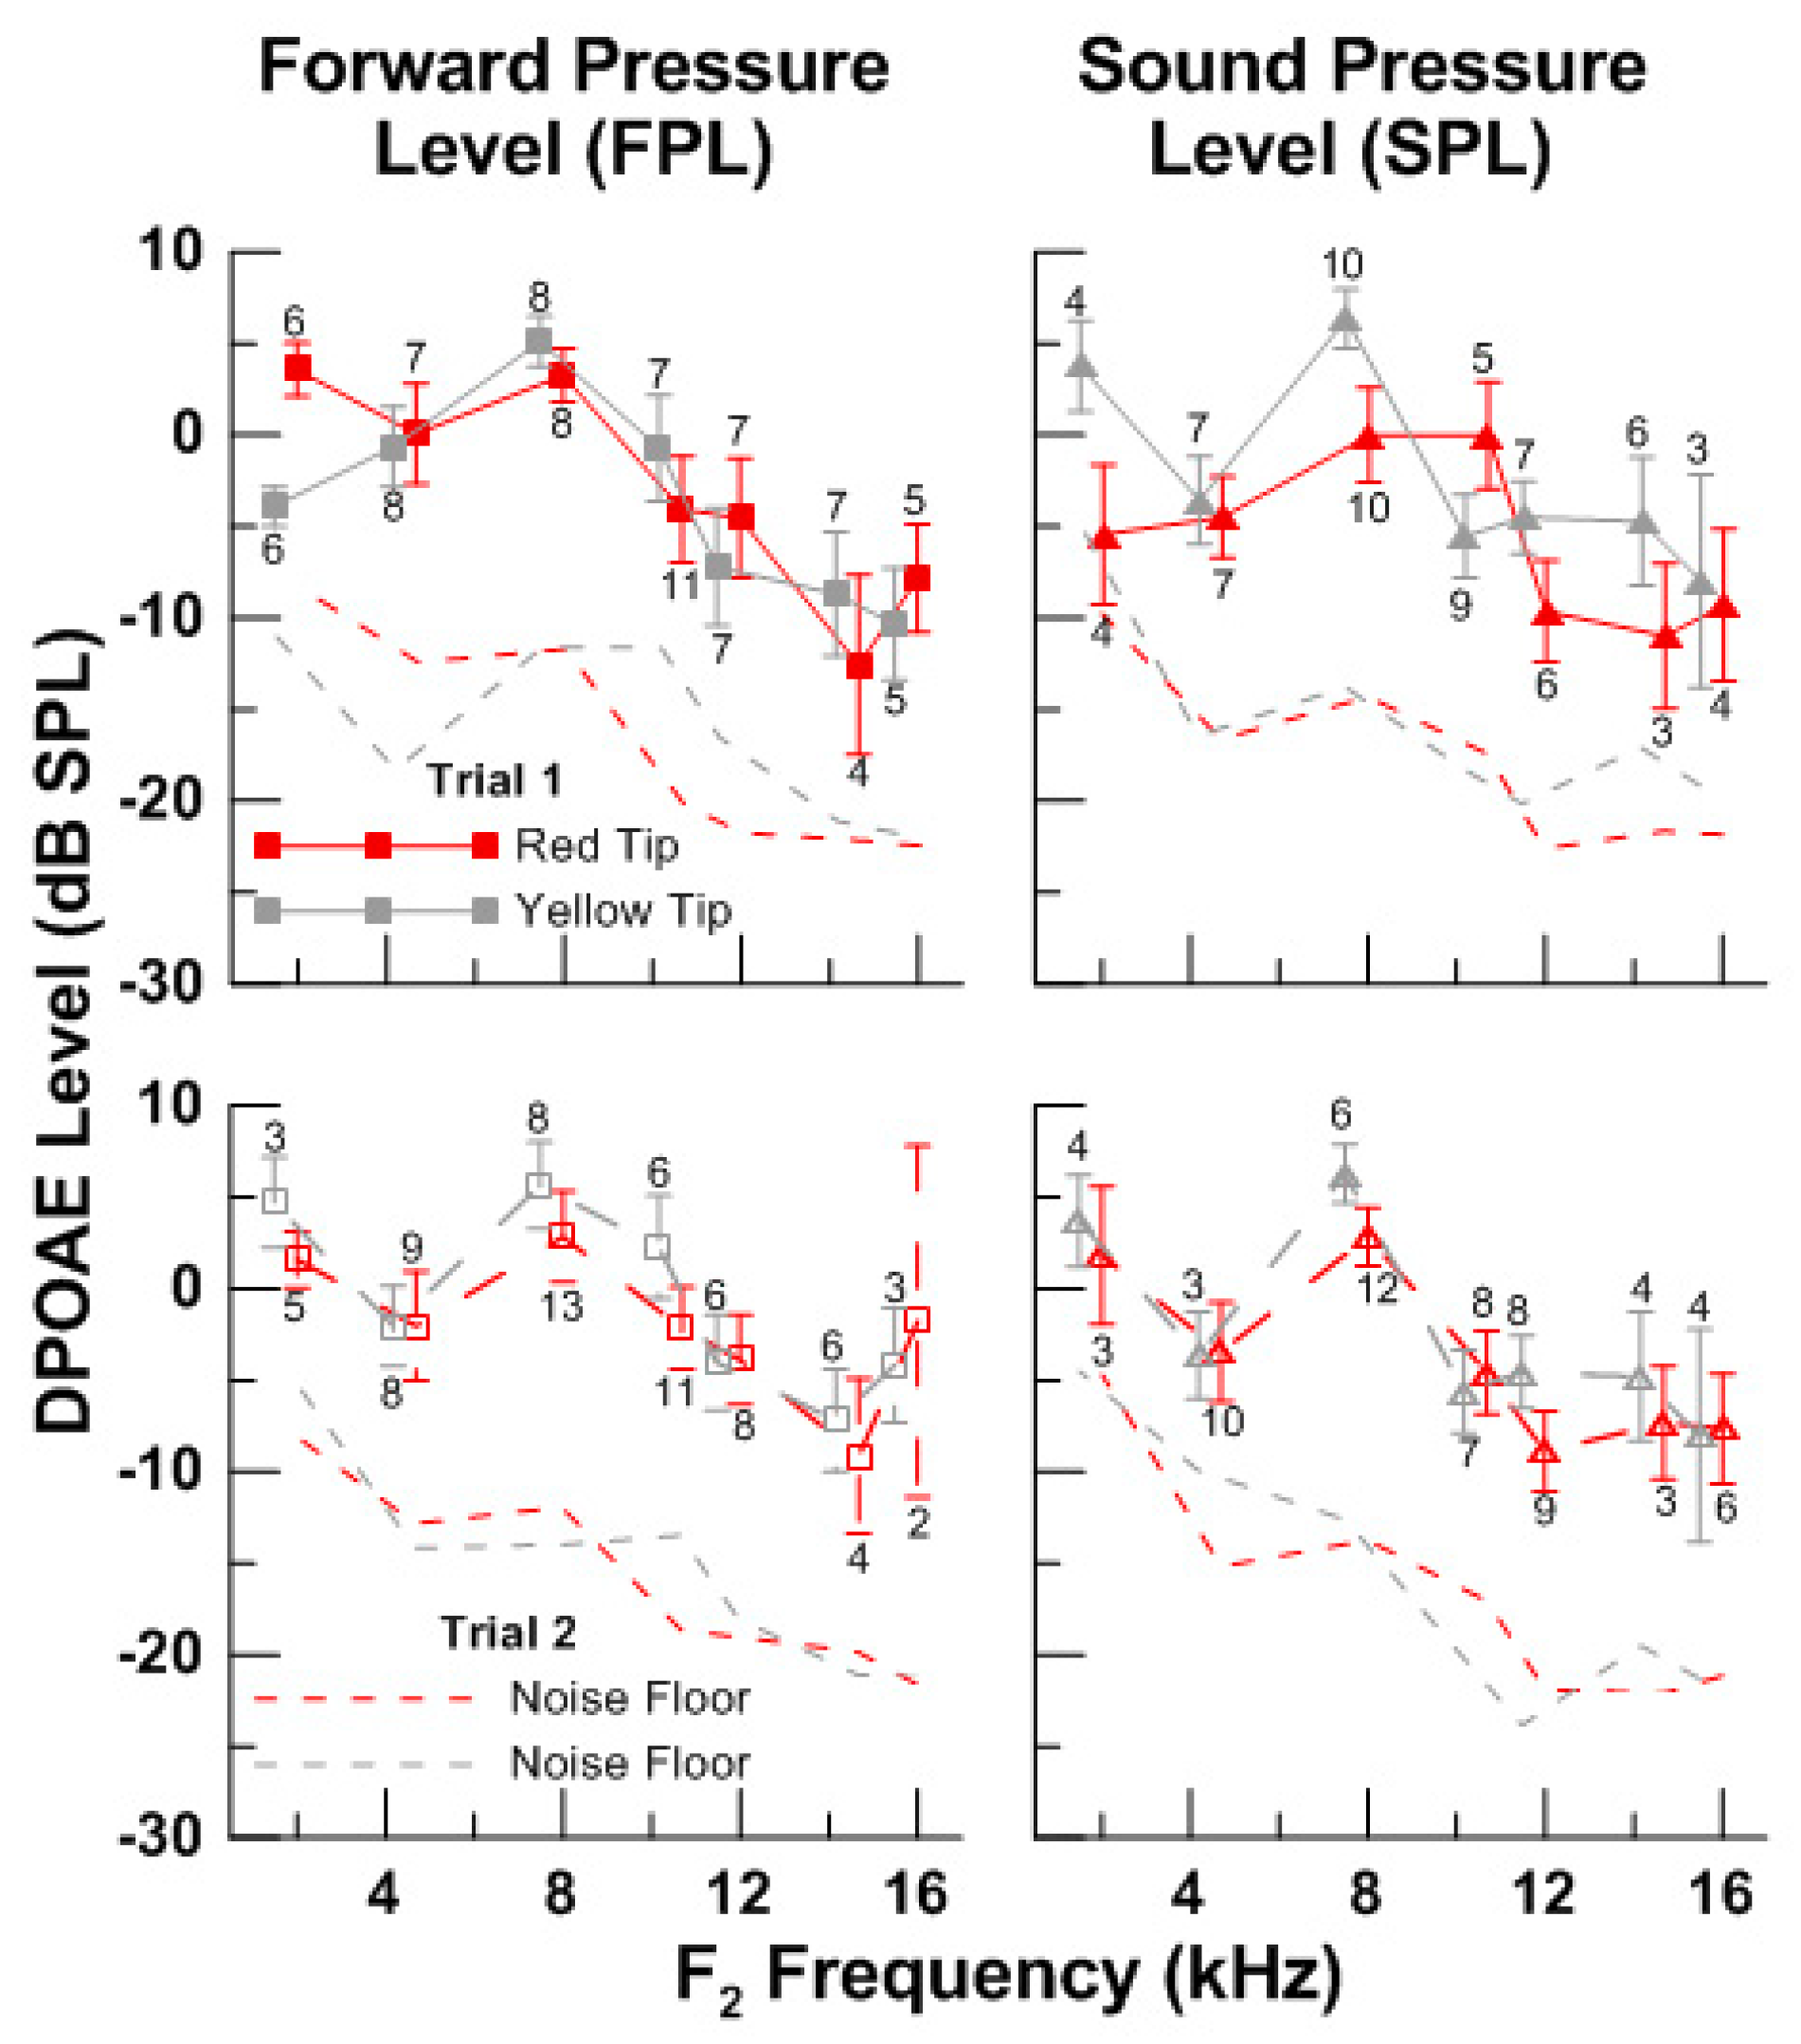
3.3. Effect of Eartip Fit on the Measurement of HF DPOAEs

As mentioned in the methods section, part way through data collection a modified yellow eartip was used versus the smallest red eartip that was slated for use with the ER10X (Figure 1). The yellow eartip yielded a greater number of present DPOAEs, approximately 10%, than the red eartip. Twenty-one newborns were tested with the red eartip, but only 15 had usable data (71%) in comparison to 12 newborns tested with the yellow eartip and 11 having usable data (92%). A deeper insertion depth was achieved with the smaller yellow eartip. As seen in Figure 4, there is a negligible difference in average DPOAE levels between the red and yellow eartip using FPL calibration (left panel), whereas the yellow eartip generally resulted in larger DPOAE levels using SPL calibration (right panel) across the frequencies tested. Red symbols indicate data collected with the red eartip and gray symbols represent data collected with the yellow eartip and the red and gray solid and dashed lines represent trial 1 and 2, respectively. The number of data points for each eartip color at each frequency are indicated in the figure.

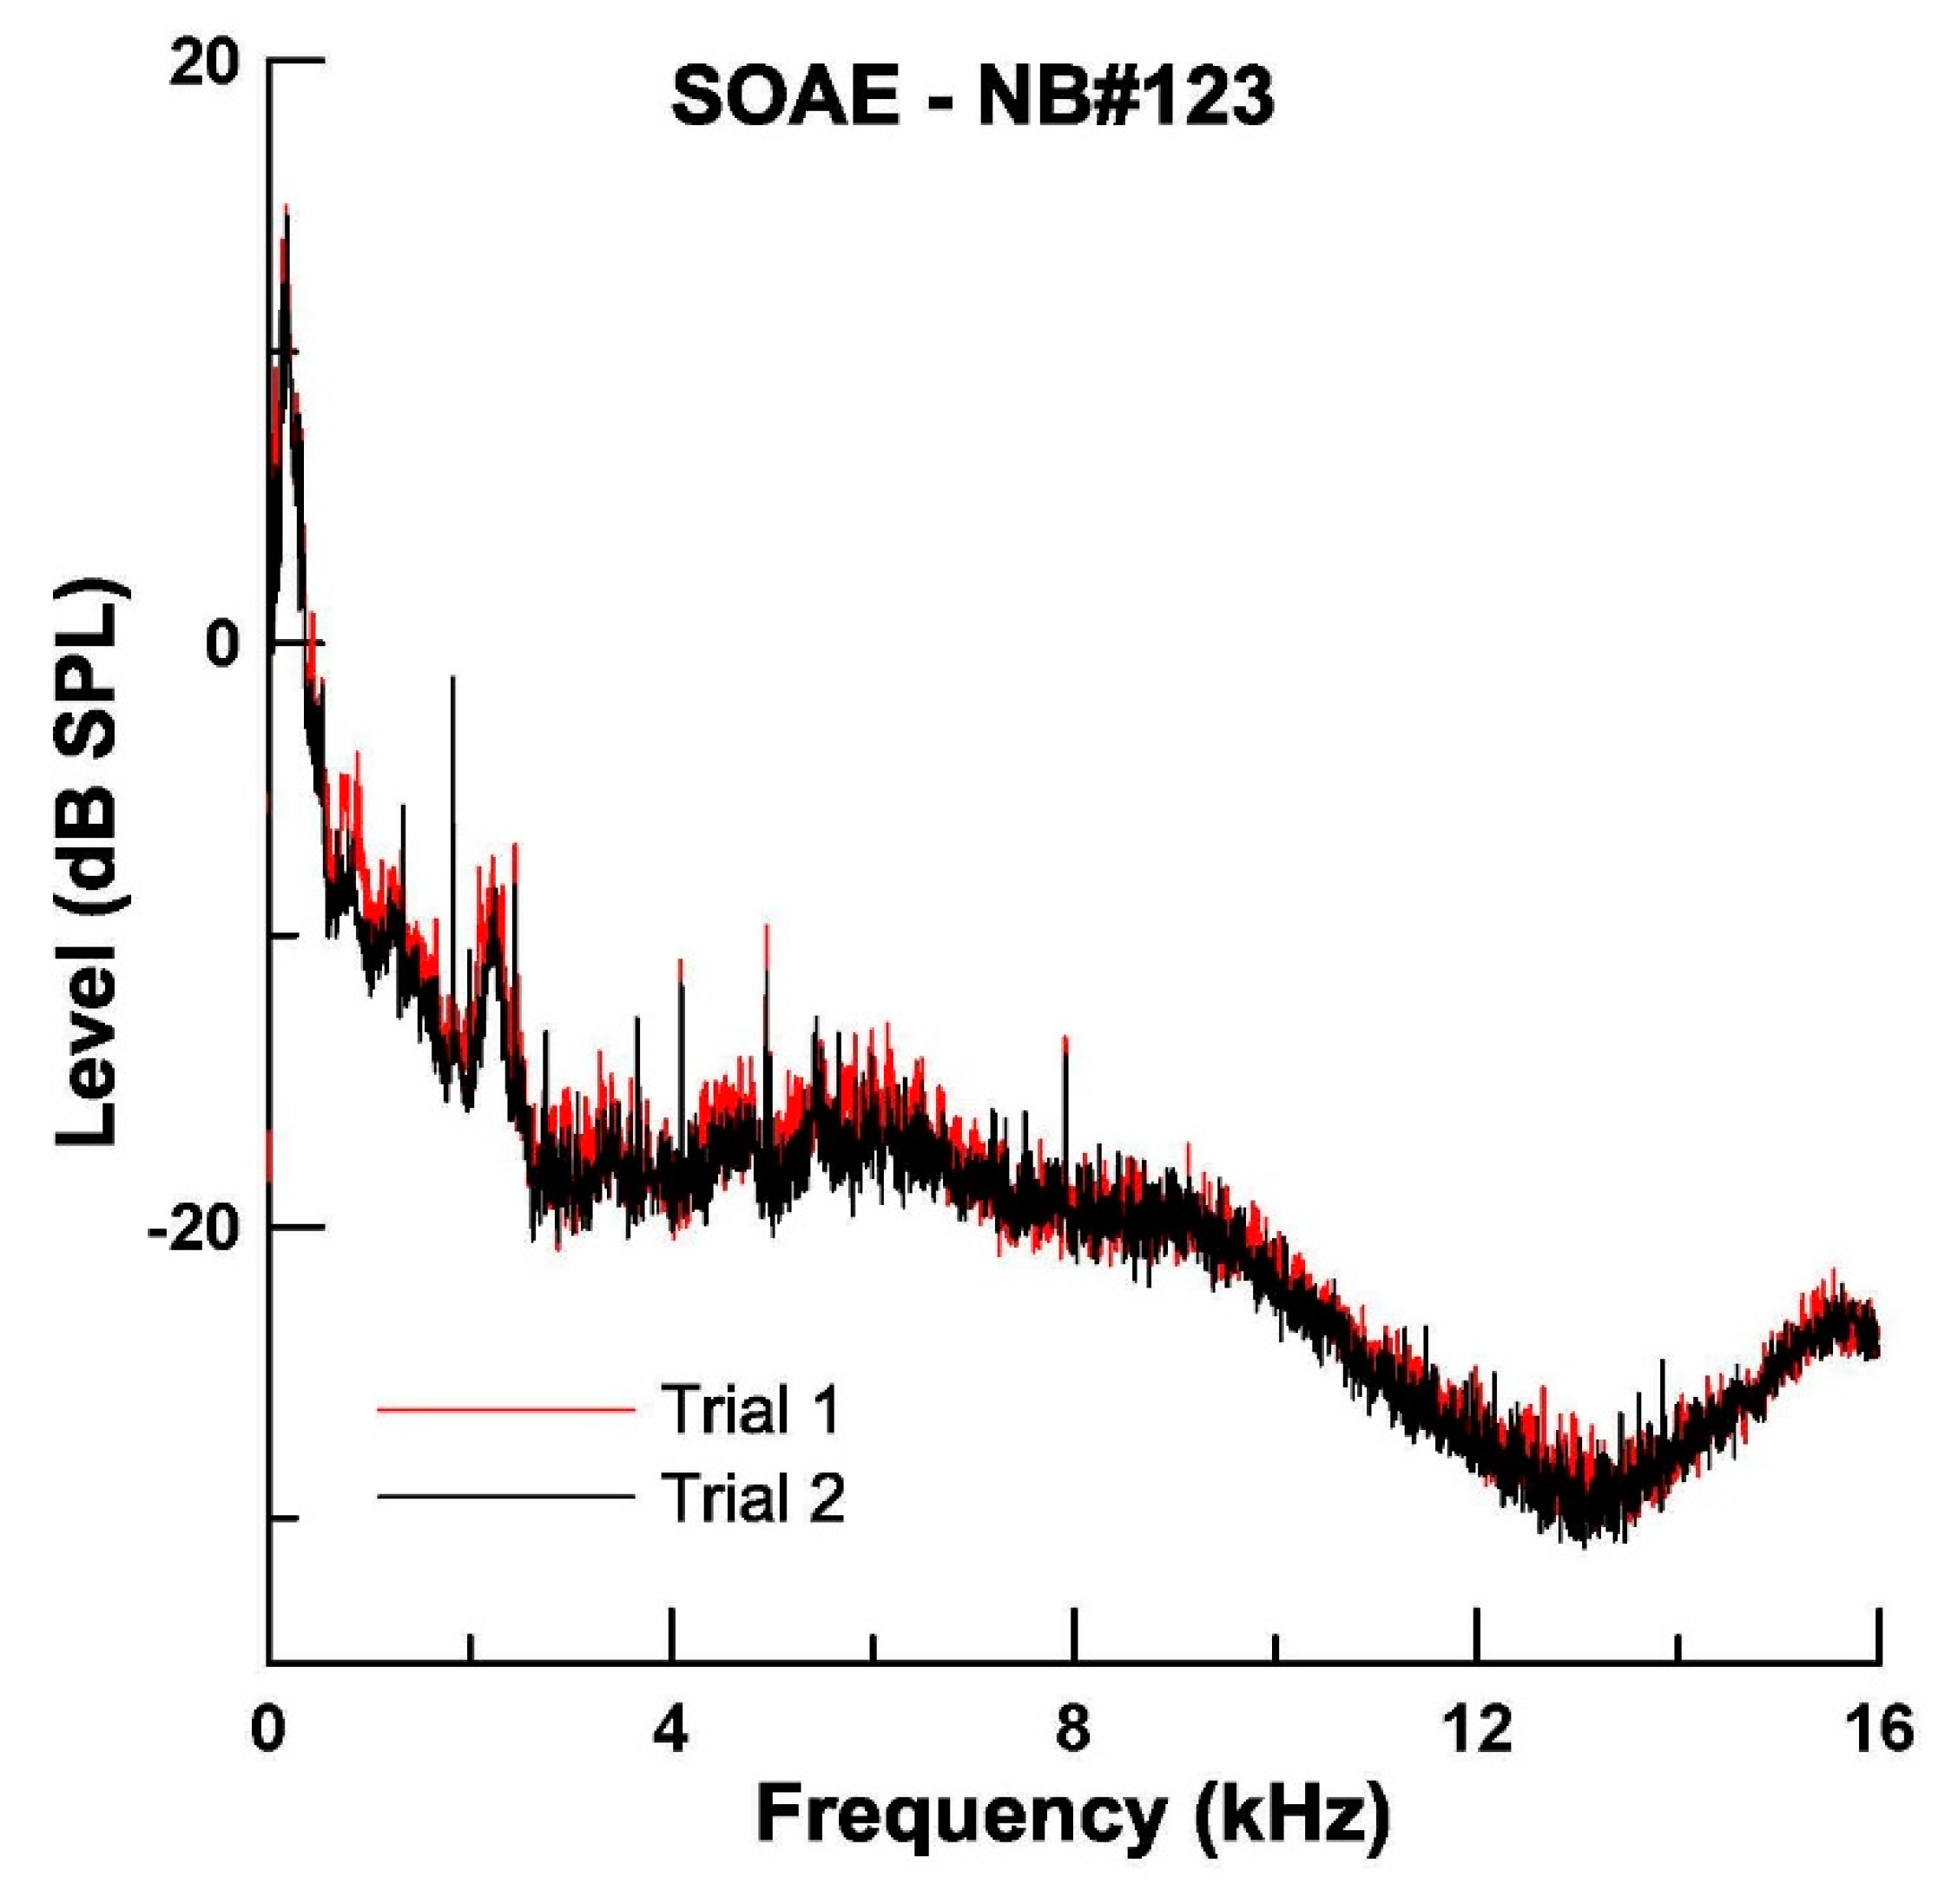
3.4. Measurement of SOAEs

Following DPOAE data collection, 21 of the 26 newborns were quiet enough to record spontaneous otoacoustic emissions (SOAEs) in the same ear where DPOAEs had been recorded. SOAEs were recorded and repeated without probe removal. To be considered an SOAE, the level had to be at least 3 dB greater than the surrounding points at both lower and higher frequencies, three co-authors had to agree that the SOAE was not noise, and identified SOAEs had to be present in both trials. Noise in the data varied among newborns making identification of SOAEs difficult in some, which is why three co-authors had to agree that the SOAEs identified did not appear random. While the minimum starting point was a level with an SNR of 3 dB in the spectrum, more often than not the SNR values were greater.
Data from one newborn (male) were too noisy to interpret and two newborns (one male and one female) had data that were quiet enough to analyze, but no SOAEs were identified. Thus, SOAEs are present in 18 newborns (86%), ten females and eight males. The number of SOAEs per ear examined range from 1–10 with an average of 4.94 SOAEs per newborn. A total of 47 and 54 SOAEs were identified in the females and males, respectively. SOAEs are present at frequencies ranging from 1.05–12.25 kHz, with 68% between 1–4 kHz, 18% between 4–8 kHz, and 14% above 8 kHz. SOAE levels range from −18.76 to 27.05 dB SPL. SOAEs from one newborn are shown in Figure 5.

4. Discussion

Previously, HF (up to 16 kHz) DPOAEs have been measured in normal-hearing children [48,49,52] and young adults [5,48,50,78]. However, DPOAE levels are reduced at higher frequencies compared to conventional frequencies and are not always present for every individual at the highest frequencies tested [5,48,50,78]. Newborns compared to children and adults have different ear canal and middle ear characteristics [8,15], which can influence DPOAE measures. Thus, it was unknown if HF DPOAEs could be evoked in newborns and if newer calibration techniques that offer more stability and less variability would influence measurements. DPOAEs up to 16 kHz are measurable in some newborns and the average DPOAE levels are comparable across frequencies for both calibration methods and trials and decline at frequencies greater than 8 kHz (Figure 2). Declining DPOAE levels as frequency is increased have been reported previously in term newborns, children, and adults [5,7,8,48,49,50,52]. Unlike previous studies which measured DPOAEs out to 16 kHz and demonstrated the largest DPOAE levels occurring around 4–5 kHz in children (≥3 years) and adults [5,48,49,50,52], the newborns in this study showed a peak DPOAE level at 8 kHz. This peak in DPOAE level occurring at a higher frequency in newborns, no matter which calibration method was used, could be reflective of non-adult-like outer and middle ears. However, given the unequal number of data points across the frequencies, further evaluation is needed to determine if this trend remains in a larger sample size. In term newborns, Abdala and Dhar [8] report DPOAE levels peaking around 1 kHz (17 dB SPL) and declining as frequency increased to approximately 6 dB SPL slightly less than 4 kHz. In addition, Abdala et al. [7] report mean DPOAE levels of 13.6 and 9.5 dB SPL at 2 and 4 kHz, respectively, declining to 5.8 dB SPL at 8 kHz. Mean DPOAE levels in the current study at 2 and 4 kHz were less than 5 dB SPL, whereas levels at 8 kHz approached 5 dB SPL. Thus, it might not be that our data peaks at 8 kHz, but that our data declines at 2 and 4 kHz compared to other term newborns and this should be explored further. The average noise floor is greatest at the lowest frequencies tested and declines at the highest frequencies tested, similar to previous reports [7,48,49,52]. The higher noise floor at the lowest frequencies tested would hinder the identification of lower level DPOAEs at these frequencies. When data were deemed unusable because the criteria for a present DPOAE were not met, the predominant reason for not meeting the inclusion criteria at the lowest frequencies tested was due to SNR values less than 6 dB and with elevated noise floors it is difficult to obtain high SNR values. The fewest data points for analysis did occur at the lowest and highest frequencies tested. At the highest frequencies evaluated, both SNR and decreased DPOAE levels were responsible for data being classified as not present. To illustrate this point further, if the average noise floor for one trial and one calibration method for all 26 newborns were calculated at 16 kHz and then all data for that trial and calibration method were compared to the average noise floor not the individual newborn’s noise floor, approximately six more newborns would have had present DPOAEs. While the average noise floors are not too high in those newborns with present DPOAEs (Figure 2), individual noise floors for each newborn could have had a spike that deemed the data not present. In adults and children at the highest frequencies tested (up to 16 kHz), average noise floors are less and DPOAE levels are higher than were recorded in the current study [5,48,49,50,52]. The testing environment for the current study also could have contributed to overall higher noise floors than previously recorded in clinical and patient rooms where it was only the tester and the patient [51,53]. Often, family members in addition to the parents were present during testing, as were nursing staff. It was stressed that this was a “hearing test,” but often the quiet environment did not remain stable throughout testing. Still, as the noise floor was the least at the highest frequencies tested, further study is warranted to maximize DPOAE responses at frequencies up to 16 kHz in newborns. While a stimulus frequency ratio of 1.22 was used in the current study, narrower ratios have been proposed as generating larger DPOAE levels at higher frequencies in adults [5]. Additionally, higher stimulus levels result in larger DPOAE levels [48,78]. So, if the goal is to generate a DPOAE at the highest frequencies possible for monitoring purposes, stimulus parameters required to maximize HF DPOAE recordings in newborns need to be determined as this can in turn benefit repeated recordings.
To determine if HF DPOAE levels are repeatable in newborns, initial measurements were made and then the probe was removed and reinserted. Probe removal has been reported to be the greatest source of variability in DPOAE measures [35]. For monitoring purposes, several measurements are made over time and compared to a baseline measure. One metric used for making comparisons across trials is to examine the average absolute differences between trials. In the current study, average absolute differences between trials collapsed across frequency (2–16 kHz) were 3.64 (SD = 3.27) and 3.59 (SD = 2.84) for FPL and SPL calibrations, respectively. These results in newborns are similar to those reported in children aged 3 to 6 and 10 to 12 years collapsed across frequency (2–16 kHz) with average absolute differences between trials of 3.56 (SD = 3.68) and 3.37 (SD = 3.73), respectively [49,52], utilizing an alternate calibration technique to better control stimulus levels. If only frequencies between 10 through 16 kHz are examined for newborns, the average absolute difference between trials was 2.82 (SD = 2.68) for FPL and 3.43 (SD = 2.62) for SPL calibrations. These results are less variable than for young, normal-hearing adults using SPL calibration [5] and more variable than cystic fibrosis patients monitored between ototoxic treatments using alternate calibration techniques [51] with average absolute differences between trials of 5.15 (SD = 4.40) and 1.96 (SD = 2.19), respectively. It should be noted that the newborns in this study only had DPOAEs measured in one session compared to the other literature referenced for comparison which involved data collection minimally across several hours, but more often at least two different days. Previously, the calibration method used has been shown to influence DPOAE repeatability measured in children, normal-hearing adults, and patients, but is inconclusive in newborns. However, FPL did not perform any worse than SPL calibrations, as overall DPOAE levels, noise floors, and average differences between trials for all frequencies were similar for both methods. This warrants further exploration using FPL calibration techniques in newborns, especially at frequencies known to be affected by standing waves.
Despite the inconclusive results in newborns in regard to repeated measurements benefiting from using FPL calibration (Figure 3), the results are promising and merit further study, especially at higher frequencies. Average absolute differences between trials for 12 through 16 kHz were 2.31 (SD = 2.57) and 3.87 (SD = 2.82) for FPL and SPL, respectively. Souza et al. [24] reported that SPL calibration is less able to overcome errors related to probe placement in an enclosed ear canal. For adults, standing wave effects created by closing off the ear canal result in alterations of DPOAE levels for frequencies between 3 and 7 kHz [5]. For newborns who have shorter ear canal lengths than adults (13–23 mm vs. 25–30 mm), the standing wave effects influence higher frequencies [79]. The frequency region where FPL calibration trended less variable results between trials was only seen at the higher frequencies tested in newborns. A larger sample size is needed to definitively determine if FPL versus SPL calibration is more beneficial for repeated measures at higher frequencies. Overall, it is difficult to get the same exact probe placement in the ear canal for serial measurements and FPL can assist in combatting added variability due to inconsistent probe placements [24].
In order to monitor cochlear health, baseline measurements have to be recorded, thus the fit of the probe tip is crucial. When the yellow eartip that provided a deeper insertion into the ear canal was used, a greater number of newborns (92%) and DPOAE responses were recorded compared to the red eartip (71%). The difference in the recorded DPOAE levels across frequency for the FPL calibration method for the red versus the yellow eartip is negligible (Figure 4), consistent with the literature that FPL is not as heavily influenced by probe placement and insertion depth [24,25,26]. However, for SPL calibrations, the yellow eartip generally yielded greater DPOAE levels at most frequencies tested. Monitoring a patient’s half wave resonance to ensure a deep insertion in the ear canal and similar placements for subsequent measures will help reduce variability in DPOAE measures. In addition, monitoring SOAEs is beneficial as these responses also can influence DPOAE levels.
Abdala et al. [75] reported that 85% of newborns have at least one SOAE, with an average of four to five SOAEs per emitting ear. Similarly, in the current study, SOAEs were identified in 86% of newborns with an average of five SOAEs per newborn. Others report that a greater number of SOAEs and higher levels are recorded in females than males [55,61,62,65,66,71,72,73]. The number of male and female newborns with present SOAEs was similar and the average number of present SOAEs was higher in males (6.75/ear) compared to females (4.7/ear). The SOAE average levels for females and males were only separated by 1 dB, with the females displaying the greater levels. Prieve et al. [16] reported that those with SOAEs had significantly greater DPOAE levels. Given the high percentage of newborns with present SOAEs, 32% recorded at frequencies >4 kHz, the recording parameters to evoke HF DPOAEs needs to be maximized in newborns so the influence of SOAE presence on DPOAE characteristics can be examined.

5. Conclusions

HF DPOAEs are measurable and repeatable in newborns. While DPOAE repeatability is similar between FPL and SPL calibration methods, the results are promising for improved results with FPL calibration, warranting further exploration. Deeper probe tip insertions resulted in a greater number of DPOAEs recorded in newborns, regardless of the calibration method used. Overall, for monitoring cochlear function at the highest frequencies with present DPOAEs, alternate calibration methods and eartips allowing a deeper insertion have the potential for maximizing the measurement of and repeatability of responses in newborns. SOAEs were measured in 86% of newborns with 32% of the recorded SOAEs occurring at frequencies greater than 4 kHz. Stimulus parameters need to be explored further and maximized for the measurement of HF DPOAEs, as well as determining the repeatability of these measures across sessions in newborns so these measures can be utilized in serial monitoring programs. Further examination of calibration techniques impact and the influence of SOAE presence on HF DPOAE measures need to be conducted in newborns. The results of this initial work show promise for developing objective measures of basal cochlear health in newborns.

Author Contributions

All authors contributed equally to data collection, analysis, and writing of the manuscript. The first three authors were responsible for the research design. Specifically, Conceptualization, L.D.H. and E.A.; Data Curation, L.D.H., N.P., E.A., W.H., D.K., S.M. and C.M.; Formal Analysis, L.D.H., N.P., E.A. and W.H.; Investigation, L.D.H., N.P. and E.A.; Methodology, L.D.H., N.P. and E.A.; Project Administration, L.D.H. and E.A.; Supervision, L.D.H.; Writing—Original Draft, L.D.H., N.P., E.A., W.H., D.K., S.M. and C.M.; Writing—Review & Editing, L.D.H., N.P., W.H., D.K., S.M. and C.M.

Funding

The second author received an undergraduate summer research award for salary, supplies needed to collect the data, and travel reimbursement to visit AbdaLab at the University of Southern California where Carolina Abdala and Ping Luo reside and have the expertise to measure OAEs in newborns. No other external funding was received to support this research.

Acknowledgments

We would like to acknowledge the parents who allowed their newborns to participate in this study as well as Dr. Stellwagen, a UCSD neonatologist, who granted us access to this population and assisted with IRB approval at UCSD. We are grateful for the constructive discussions with Carolina Abdala and Ping Luo regarding the measurement of OAEs in newborns. Finally, we are appreciative of the thorough and insightful suggestions by two anonymous reviewers.

Conflicts of Interest

The authors declare no conflict of interest.

References

  1. Kemp, D.T. Stimulated acoustic emissions from within the human auditory system. J. Acoust. Soc. Am. 1978, 64, 1386–1391. [Google Scholar] [CrossRef] [PubMed]
  2. Kemp, D.T.; Ryan, S.; Bray, P. A guide to the effective use of otoacoustic emissions. Ear Hear. 1990, 11, 93–105. [Google Scholar] [CrossRef] [PubMed]
  3. Harris, F.P.; Lonsbury-Martin, B.L.; Stagner, B.B.; Coats, A.C.; Martin, G.K. Acoustic distortion products in humans: systematic changes in amplitudes as a function of f2/f1 ratio. J. Acoust. Soc. Am. 1989, 85, 220–229. [Google Scholar] [CrossRef] [PubMed]
  4. Dhar, S.; Long, G.R.; Talmadge, C.L.; Tubis, A. The effect of stimulus-frequency ratio on distortion product otoacoustic emission components. J. Acoust. Soc. Am. 2005, 117, 3766–3776. [Google Scholar] [CrossRef] [PubMed]
  5. Dreisbach, L.E.; Siegel, J.H. Distortion-product otoacoustic emissions measured at high frequencies in humans. J. Acoust. Soc. Am. 2001, 110, 2456–2469. [Google Scholar] [CrossRef] [PubMed]
  6. Abdala, C.; Sininger, Y.S. The development of cochlear frequency resolution in the human auditory system. Ear Hear. 1996, 17, 374–385. [Google Scholar] [CrossRef]
  7. Abdala, C.; Oba, S.I.; Ramanathan, R. Changes in the DP-gram during the preterm and early postnatal period. Ear Hear. 2008, 29, 512–523. [Google Scholar] [CrossRef]
  8. Abdala, C.; Dhar, S. Maturation and Aging of the Human Cochlea: A View through the DPOAE Looking Glass. J. Assoc. Res. Otolaryngol. 2012, 13, 403–421. [Google Scholar] [CrossRef] [Green Version]
  9. Gorga, M.P.; Neely, S.T.; Bergman, B.; Beauchaine, K.L.; Kaminski, J.R.; Peters, J.; Jesteadt, W. Otoacoustic emissions from normal-hearing and hearing-impaired subjects: distortion product responses. J. Acoust. Soc. Am. 1993, 93, 2050–2060. [Google Scholar] [CrossRef]
  10. Lonsbury-Martin, B.L.; Harris, F.P.; Stagner, B.B.; Hawkins, M.D.; Martin, G.K. Distortion product emissions in humans. I. Basic properties in normally hearing subjects. Ann. Otol. Rhinol. Laryngol. Suppl. 1990, 147, 3–14. [Google Scholar]
  11. Lonsbury-Martin, B.L.; Martin, G.K. The clinical utility of distortion-product otoacoustic emissions. Ear Hear. 1990, 11, 144–154. [Google Scholar] [CrossRef] [PubMed]
  12. Lonsbury-Martin, B.L.; Cutler, W.M.; Martin, G.K. Evidence for the influence of aging on distortion-product otoacoustic emissions in humans. J. Acoust. Soc. Am. 1991, 89, 1749–1759. [Google Scholar] [CrossRef] [PubMed]
  13. Martin, G.K.; Ohlms, L.A.; Franklin, D.J.; Harris, F.P.; Lonsbury-Martin, B.L. Distortion product emissions in humans. III. Influence of sensorineural hearing loss. Ann. Otol. Rhinol. Laryngol. Suppl. 1990, 147, 30–42. [Google Scholar] [CrossRef] [PubMed]
  14. Abdala, C.; Visser-Dumont, L. Distortion Product Otoacoustic Emissions: A Tool for Hearing Assessment and Scientific Study. Volta Rev. 2001, 103, 281–302. [Google Scholar] [PubMed]
  15. Abdala, C.; Keefe, D.H. Effects of middle-ear immaturity on distortion product otoacoustic emission suppression tuning in infant ears. J. Acoust. Soc. Am. 2006, 120, 3832–3842. [Google Scholar] [CrossRef] [PubMed]
  16. Prieve, B.A.; Fitzgerald, T.S.; Schulte, L.E.; Kemp, D.T. Basic characteristics of distortion product otoacoustic emissions in infants and children. J. Acoust. Soc. Am. 1997, 102, 2871–2879. [Google Scholar] [CrossRef] [PubMed]
  17. Kruger, B. An update on the external ear resonance in infants and young children. Ear Hear. 1987, 8, 333–336. [Google Scholar] [CrossRef] [PubMed]
  18. Ikui, A.; Sando, I.; Sudo, M.; Fujita, S. Postnatal change in angle between the tympanic annulus and surrounding structures. Computer-aided three-dimensional reconstruction study. Ann. Otol. Rhinol. Laryngol. 1997, 106, 33–36. [Google Scholar] [CrossRef] [PubMed]
  19. Ruah, C.B.; Schachern, P.A.; Zelterman, D.; Paparella, M.M.; Yoon, T.H. Age-related morphologic changes in the human tympanic membrane. A light and electron microscopic study. Arch. Otolaryngol. Head Neck Surg. 1991, 117, 627–634. [Google Scholar] [CrossRef]
  20. Richany, S.F.; Bast, T.H.; Anson, B.J. The development and adult structure of the malleus, incus and stapes. Ann. Otol. Rhinol. Laryngol. 1954, 63, 394–434. [Google Scholar] [CrossRef]
  21. Stinson, M.R. The spatial distribution of sound pressure within scaled replicas of the human ear canal. J. Acoust. Soc. Am. 1985, 78, 1596–1602. [Google Scholar] [CrossRef] [PubMed]
  22. Siegel, J.H. Ear-canal standing waves and high-frequency sound calibration using otoacoustic emission probes. J. Acoust. Soc. Am. 1994, 95, 2589–2597. [Google Scholar] [CrossRef]
  23. Siegel, J.H.; Hirohata, E.T. Sound calibration and distortion product otoacoustic emissions at high frequencies. Hear. Res. 1994, 80, 146–152. [Google Scholar] [CrossRef]
  24. Souza, N.N.; Dhar, S.; Neely, S.T.; Siegel, J.H. Comparison of nine methods to estimate ear-canal stimulus levels. J. Acoust. Soc. Am. 2014, 136, 1768. [Google Scholar] [CrossRef] [PubMed]
  25. Scheperle, R.A.; Neely, S.T.; Kopun, J.G.; Gorga, M.P. Influence of in situ, sound-level calibration on distortion-product otoacoustic emission variability. J. Acoust. Soc. Am. 2008, 124, 288–300. [Google Scholar] [CrossRef] [PubMed]
  26. Scheperle, R.A.; Goodman, S.S.; Neely, S.T. Further assessment of forward pressure level for in situ calibration. J. Acoust. Soc. Am. 2011, 130, 3882–3892. [Google Scholar] [CrossRef] [PubMed] [Green Version]
  27. Keefe, D.H. Otoreflectance of the cochlea and middle ear. J. Acoust. Soc. Am. 1997, 102, 2849–2859. [Google Scholar] [CrossRef]
  28. Neely, S.T.; Gorga, M.P. Comparison between intensity and pressure as measures of sound level in the ear canal. J. Acoust. Soc. Am. 1998, 104, 2925–2934. [Google Scholar] [CrossRef] [PubMed]
  29. Voss, S.E.; Allen, J.B. Measurement of acoustic impedance and reflectance in the human ear canal. J. Acoust. Soc. Am. 1994, 95, 372–384. [Google Scholar] [CrossRef] [Green Version]
  30. Withnell, R.H.; Jeng, P.S.; Waldvogel, K.; Morgenstein, K.; Allen, J.B. An in situ calibration for hearing thresholds. J. Acoust. Soc. Am. 2009, 125, 1605–1611. [Google Scholar] [CrossRef] [Green Version]
  31. Keefe, D.H.; Bulen, J.C.; Arehart, K.H.; Burns, E.M. Ear-canal impedance and reflection coefficient in human infants and adults. J. Acoust. Soc. Am. 1993, 94, 2617–2638. [Google Scholar] [CrossRef] [PubMed]
  32. Kruger, B.; Rubin, R.J. The acoustic properties of the infant ear. Acta Otolaryngol. 1987, 103, 578–585. [Google Scholar]
  33. Chan, J.C.; Geisler, C.D. Estimation of eardrum acoustic pressure and of ear canal length from remote points in the canal. J. Acoust. Soc. Am. 1990, 87, 1237–1247. [Google Scholar] [CrossRef] [PubMed]
  34. Zemplenyi, J.; Gilman, S.; Dirks, D. Optical method for measurement of ear canal length. J. Acoust. Soc. Am. 1985, 78, 2146–2148. [Google Scholar] [CrossRef] [PubMed]
  35. Zhao, F.; Stephens, D. Test-retest variability of distortion-product otoacoustic emissions in human ears with normal hearing. Scand. Audiol. 1999, 28, 171–178. [Google Scholar] [CrossRef] [PubMed]
  36. Beattie, R.C.; Bleech, J. Effects of sample size on the reliability of noise floor and DPOAE. Br. J. Audiol. 2000, 34, 305–309. [Google Scholar] [CrossRef] [PubMed]
  37. Beattie, R.C.; Kenworthy, O.T.; Luna, C.A. Immediate and short-term reliability of distortion-product otoacoustic emissions. Int. J. Audiol. 2003, 42, 348–354. [Google Scholar] [CrossRef] [PubMed]
  38. Wagner, W.; Heppelmann, G.; Vonthein, R.; Zenner, H.P. Test-retest repeatability of distortion product otoacoustic emissions. Ear Hear. 2008, 29, 378–391. [Google Scholar] [CrossRef] [PubMed]
  39. Ng, I.-Y.; McPerson, B. Test-Retest Reliability of Distortion Product Otoacoustic Emissions in the 1 to 7 kHz Range. Audiol. Med. 2005, 108–115. [Google Scholar] [CrossRef]
  40. Konrad-Martin, D.; Poling, G.L.; Dreisbach, L.E.; Reavis, K.M.; McMillan, G.P.; Lapsley Miller, J.A.; Marshall, L. Serial Monitoring of Otoacoustic Emissions in Clinical Trials. Otol Neurotol 2016, 37, e286–294. [Google Scholar] [CrossRef]
  41. Reavis, K.M.; McMillan, G.P.; Dille, M.F.; Konrad-Martin, D. Meta-Analysis of Distortion Product Otoacoustic Emission Retest Variability for Serial Monitoring of Cochlear Function in Adults. Ear Hear. 2015, 36, e251–e260. [Google Scholar] [CrossRef] [PubMed] [Green Version]
  42. Roland, P.S. New developments in our understanding of ototoxicity. Ear Nose Throat J. 2004, 83, 15–16; discussion 16–17. [Google Scholar] [CrossRef] [PubMed]
  43. Dille, M.; McMillan, G.; Reavis, K.; Jacobs, P.; Fausti, S.; Konrad-Martin, D. Ototoxicity risk assessment combining distortion product otoacoustic emissions with a cisplatin dose model. J. Acoust. Soc. Am. 2010, 128, 1163–1174. [Google Scholar] [CrossRef] [PubMed]
  44. Konrad-Martin, D.; Knight, K.; McMillan, G.P.; Dreisbach, L.E.; Nelson, E.; Dille, M. Long-Term Variability of Distortion-Product Otoacoustic Emissions in Infants and Children and Its Relation to Pediatric Ototoxicity Monitoring. Ear Hear. 2017. [Google Scholar] [CrossRef] [PubMed]
  45. Reavis, K.M.; Phillips, D.S.; Fausti, S.A.; Gordon, J.S.; Helt, W.J.; Wilmington, D.; Bratt, G.W.; Konrad-Martin, D. Factors affecting sensitivity of distortion-product otoacoustic emissions to ototoxic hearing loss. Ear Hear. 2008, 29, 875–893. [Google Scholar] [CrossRef]
  46. Reavis, K.M.; McMillan, G.; Austin, D.; Gallun, F.; Fausti, S.A.; Gordon, J.S.; Helt, W.J.; Konrad-Martin, D. Distortion-product otoacoustic emission test performance for ototoxicity monitoring. Ear Hear. 2011, 32, 61–74. [Google Scholar] [CrossRef] [PubMed]
  47. Sha, S.H.; Taylor, R.; Forge, A.; Schacht, J. Differential vulnerability of basal and apical hair cells is based on intrinsic susceptibility to free radicals. Hear. Res. 2001, 155, 1–8. [Google Scholar] [CrossRef]
  48. Poling, G.L.; Siegel, J.H.; Lee, J.; Dhar, S. Characteristics of the 2f(1)-f(2) distortion product otoacoustic emission in a normal hearing population. J. Acoust. Soc. Am. 2014, 135, 287–299. [Google Scholar] [CrossRef] [PubMed]
  49. Conrad, A.; Dreisbach, L. Repeatability of high-frequency DPOAE measures in normal-hearing children. Am. Audit. Soc. Abstr. 2011, 36, 42. [Google Scholar]
  50. Dreisbach, L.E.; Long, K.M.; Lees, S.E. Repeatability of high-frequency distortion-product otoacoustic emissions in normal-hearing adults. Ear Hear. 2006, 27, 466–479. [Google Scholar] [CrossRef]
  51. Dreisbach, L.; Zettner, E.; Chang Liu, M.; Meuel Fernhoff, C.; MacPhee, I.; Boothroyd, A. High-Frequency Distortion-Product Otoacoustic Emission Repeatability in a Patient Population. Ear Hear. 2018, 39, 85–100. [Google Scholar] [CrossRef] [PubMed]
  52. Newman, S.; Dreisbach, L. Repeatability of high-frequency behavioral and DPOAE measures in normal-hearing children. Am. Audit. Soc. Abstr. 2012, 37, 57. [Google Scholar]
  53. Dreisbach, L.; Ho, M.; Reid, E.; Siegel, J. Effects of Oxaliplatin, Carboplatin, and Cisplatin Across Treatment on High-Frequency Objective and Subjective Auditory Measures in Adults. Perspect. ASHA Spec. Interest Gr. 2017, 2, 17–36. [Google Scholar] [CrossRef]
  54. Fausti, S.A.; Henry, J.A.; Helt, W.J.; Phillips, D.S.; Frey, R.H.; Noffsinger, P.D.; Larson, V.D.; Fowler, C.G. An individualized, sensitive frequency range for early detection of ototoxicity. Ear Hear. 1999, 20, 497–505. [Google Scholar] [CrossRef] [PubMed]
  55. Qi, B.; Cheng, X.; En, H.; Huang, L.; Zhang, L. Characterization of spontaneous otoacoustic emissions in full-term newborns. Int. J. Pediatr. Otorhinolaryngol. 2014, 78, 2286–2291. [Google Scholar] [CrossRef] [PubMed]
  56. Burns, E.M.; Arehart, K.H.; Campbell, S.L. Prevalence of spontaneous otoacoustic emissions in neonates. J. Acoust. Soc. Am. 1992, 91, 1571–1575. [Google Scholar] [CrossRef] [PubMed]
  57. McFadden, D.; Plattsmier, H.S. Aspirin Abolishes Spontaneous Otoacoustic Emissions. J. Acoust. Soc. Am. 1984, 16, 443–448. [Google Scholar] [CrossRef] [PubMed]
  58. Kuroda, T.; Fukuda, S.; Chida, E.; Kashiwamura, M.; Matsumura, M.; Ohwatari, R.; Inuyama, Y. Effects of spontaneous otoacoustic emissions on distortion product otoacoustic emission. Auris Nasus Larynx 2001, 28, S33–S38. [Google Scholar] [CrossRef]
  59. Penner, M.J.; Glotzbach, L.; Huang, T. Spontaneous otoacoustic emissions: measurement and data. Hear. Res. 1993, 68, 229–237. [Google Scholar] [CrossRef]
  60. Burns, E.M.; Campbell, S.L.; Arehart, K.H. Longitudinal measurements of spontaneous otoacoustic emissions in infants. J. Acoust. Soc. Am. 1994, 95, 385–394. [Google Scholar] [CrossRef]
  61. Lamprecht-Dinnesen, A.; Pohl, M.; Hartmann, S.; Heinecke, A.; Ahrens, S.; Müller, E.; Riebandt, M. Effects of age, gender and ear side on SOAE parameters in infancy and childhood. Audiol. Neurootol. 1998, 3, 386–401. [Google Scholar] [CrossRef] [PubMed]
  62. Strickland, E.A.; Burns, E.M.; Tubis, A. Incidence of spontaneous otoacoustic emissions in children and infants. J. Acoust. Soc. Am. 1985, 78, 931–935. [Google Scholar] [CrossRef] [PubMed]
  63. Bonfils, P. Spontaneous otoacoustic emissions: clinical interest. Laryngoscope 1989, 99, 752–756. [Google Scholar] [CrossRef] [PubMed]
  64. Groh, D.; Pelanova, J.; Jilek, M.; Popelar, J.; Kabelka, Z.; Syka, J. Changes in otoacoustic emissions and high-frequency hearing thresholds in children and adolescents. Hear. Res. 2006, 212, 90–98. [Google Scholar] [CrossRef] [PubMed]
  65. Kuroda, T. Clinical investigation on spontaneous otoacoustic emission (SOAE) in 447 ears. Auris Nasus Larynx 2007, 34, 29–38. [Google Scholar] [CrossRef] [PubMed]
  66. Kok, M.R.; van Zanten, G.A.; Brocaar, M.P. Aspects of spontaneous otoacoustic emissions in healthy newborns. Hear. Res. 1993, 69, 115–123. [Google Scholar] [CrossRef]
  67. Burns, E.M. Long-term stability of spontaneous otoacoustic emissions. J. Acoust. Soc. Am. 2009, 125, 3166–3176. [Google Scholar] [CrossRef]
  68. Moulin, A.; Collet, L.; Veuillet, E.; Morgon, A. Interrelations between transiently evoked otoacoustic emissions, spontaneous otoacoustic emissions and acoustic distortion products in normally hearing subjects. Hear. Res. 1993, 65, 216–233. [Google Scholar] [CrossRef]
  69. Hall, J.W. Handb. Otoacoust. Emiss.; Singular Thomson Learning: San Diego, CA, USA, 2000; pp. 67–93. [Google Scholar]
  70. McFadden, D.; Mishra, R. On the relation between hearing sensitivity and otoacoustic emissions. Hear. Res. 1993, 71, 208–213. [Google Scholar] [CrossRef]
  71. Snihur, A.W.; Hampson, E. Sex and ear differences in spontaneous and click-evoked otoacoustic emissions in young adults. Brain Cognit. 2011, 77, 40–47. [Google Scholar] [CrossRef]
  72. Zurek, P.M. Spontaneous Narrowband Acoustic Signals Emitted by Human Ears. J. Acoust. Soc. Am. 1981, 69, 514–523. [Google Scholar] [CrossRef] [PubMed]
  73. Collet, L.; Gartner, M.; Veuillet, E.; Moulin, A.; Morgon, A. Evoked and spontaneous otoacoustic emissions. A comparison of neonates and adults. Brain Dev. 1993, 15, 249–252. [Google Scholar] [CrossRef]
  74. McFadden, D. Sex differences in the auditory system. Dev. Neuropsychol. 1998, 14, 261–298. [Google Scholar] [CrossRef]
  75. Abdala, C.; Luo, P.; Shera, C.A. Characterizing spontaneous otoacoustic emissions across the human lifespan. J. Acoust. Soc. Am. 2017, 141, 1874. [Google Scholar] [CrossRef] [PubMed]
  76. Neely, S.T.; Liu, Z. EMAV: Otoacoustic Emission Averager. Tech. Memo No. 17 1993, 1–26. [Google Scholar]
  77. Neely, S.; Stevenson, R. SysRes. Tech. Memo No. 1 2002, 1–10. [Google Scholar]
  78. Dreisbach, L.E.; Siegel, J.H. Level dependence of distortion-product otoacoustic emissions measured at high frequencies in humans. J. Acoust. Soc. Am. 2005, 117, 2980–2988. [Google Scholar] [CrossRef] [PubMed]
  79. Charaziak, K.K.; Shera, C.A. Compensating for ear-canal acoustics when measuring otoacoustic emissions. J. Acoust. Soc. Am. 2017, 141, 515. [Google Scholar] [CrossRef] [PubMed]
Figure 1. The red eartip (3–5 mm Flanged Sanibel Red Silicone) used initially in this study is shown on the left and the yellow eartip (3 mm Flanged Sanibel Yellow Silicone) used for the remainder of the study is shown on the right.
Applsci 09 02947 g001
Figure 2. Average distortion-product otoacoustic emissions (DPOAE) levels across frequencies tested using either Forward pressure level (FPL) (left panel) or sound pressure level (SPL) (right panel) for calibration in newborns with present DPOAEs. The solid lines represent trial 1 and the long-dashed lines represent trial 2. Standard errors are shown. The short-dashed lines are the average noise floor for both trials. The number of newborns (n) with present DPOAEs for each frequency are indicated, where the top value is for trial 1 and the bottom value is for trial 2.
Applsci 09 02947 g002
Figure 3. Average absolute DPOAE level difference between trials 1 and 2 across frequency for newborns that had present DPOAEs for each trial. DPOAEs collected with FPL calibration are shown with open light-blue squares and a short-dashed line and those collected with SPL calibration are shown with black solid triangles and a solid line. The number of data points (n) for each frequency are indicated, where the top value is for FPL and the bottom value is for SPL. Standard errors are shown.
Applsci 09 02947 g003
Figure 4. Average DPOAE levels in newborns across frequency using either a red (red symbols) or yellow (gray symbols) eartip and FPL (left panel) or SPL (right panel) for calibration. Solid lines in the top panels represent trial 1 and long-dashed lines in the bottom panels represent trial 2 data. Short-dashed lines in all panels denote the average noise floor for each condition. The number of data points for each frequency are indicated at the top or bottom of the standard error bars in each plot.
Applsci 09 02947 g004
Figure 5. An example of spontaneous otoacoustic emissions (SOAEs) across frequency recorded from one newborn. There were 10 repeatable SOAEs identified for this newborn. Trial 1 is shown in red and trial 2 is shown in black.
Applsci 09 02947 g005

