Article

Simulation of Achievable Data Rates of Broadband Power Line Communication for Smart Metering

1
Department of Telecommunications, Brno University of Technology, Technicka 12, 61600 Brno, Czech Republic
2
Department of Electrical and Electronics Engineering, Karadeniz Technical University, 61830 Trabzon, Turkey
*
Author to whom correspondence should be addressed.
Appl. Sci. 2019, 9(8), 1527; https://doi.org/10.3390/app9081527
Submission received: 12 February 2019 / Revised: 26 March 2019 / Accepted: 8 April 2019 / Published: 12 April 2019
(This article belongs to the Special Issue State-of-the-Art of Smart Metering in Electricity Grids)

Abstract

:
Building real Smart Metering and Smart Grid networks is very expensive and time-consuming and also it is impossible to install different technologies in the same environment only for comparison. Therefore, simulation and experimental pilot measurements are an easy, economical, and time-affordable solution for a first comparison and evaluation of different technologies and solutions. The local area networks (LAN) are the core of Smart Metering and Smart Grid networks. The two predominant technologies are mostly sufficient for LAN networks, Power Line Communication (PLC), and radio frequency (RF) solutions. For PLC it is hard to allow prediction of the behaviour. Performance assessment for point-to-point connection is easy, but for complex PLC networks with repeaters it is quite expensive. Therefore, a simulation is an easy, fast, and cheap solution for understanding the grid configuration, influence of particular topological components, and performance possibilities. Simulation results can, thus, provide material for the design of a telecommunication infrastructure for Smart Metering. This paper presents results of such a simulation study. It is based on realistic PLC channel model implementation in Network Simulator 3, our modification and extension of this implementation for our use case scenario. It uses Shannon’s formula to calculate theoretical maximum channel capacity. In particular, it provides channel capacity and achievable distances of broadband PLC (BB-PLC). In this article we also exploit our novel idea of simple performance assessment of broadband PLC communication via simulation. It is supposed to be used to understand, evaluate, and test the grid configuration before deployment.

1. Introduction

The conventional concept of power grids was based on a small number of power plants with huge power. In this concept the power generation was centralized at power plants and power flow was one-way from power plants to customers.
Nowadays, the widespread usage of electrical vehicles and renewable energy sources has initiated the need for new concept of power grid topology (called Smart Grid). In this new concept the power generation is decentralized with hierarchical levels. Reliable communication links are needed between the particular hierarchical levels.
According to hierarchical levels, the communication link should provide sufficient bandwidth and reliability to be feasible for particular Smart Grids requirements.
There is no doubt that future Smart Grids will exploit multiple types of communication links [1,2,3,4]. Therefore, the possibility of using Power Line Communication (PLC) using the power lines that are existing within the power grid is obvious.
PLC technologies fall into three areas [3]:
  • Ultra-Narrow Band (UNB) operates at a very low data rate (100 bps) in the low frequency band (0.3–3 kHz). UNB uses one-way communication, used for load control in particular. UNB has a very large operational range (hundreds of kilometres).
  • Narrowband (NB) operates in the frequency band 3–500 kHz (3–148.5 kHz in Europe). Single-carrier NB technologies achieve data rates of a few kbps-Low Data Rate NB-PLC (LDR NB-PLC). Nowadays, multicarrier technologies are capable of data rates of up to 800 kbps-High Data Rate NB-PLC (HDR NB-PLC).
  • Broadband (BB) operates in the high frequency band (1.8–30 (250) MHz) and has data rates of several Mbps up to hundreds of Mbps.
Nowadays, research efforts [1,5,6,7,8] and Smart Grids deployments [9] mainly focus on Smart Metring application on the Low Voltage (LV) segment. Smart metering, also known as Automatic Meter Reading (AMR), using Advanced Metering Infrastructure (AMI), enables remote control of utility meters, and therefore control of the power grid and optimizes energy consumption.
Several European utilities have chosen PLC for the accomplishment of their Smart Metering national roll-outs. PLC is well suited for quick and inexpensive deployments, but the low voltage (LV) grid is not the same in any utility because of particular grid evolution, architecture, circumstances, material, etc. Therefore, a simulation is a first, sufficient, and inexpensive evaluation of a possible deployment of PLC for particular conditions [5].
Currently we can distinguish three kinds of PLC suitable for the Smart Metering deployment:
  • Narrowband with a single-carrier (e.g., Open Smart Grid Protocol (OSGP), Meter and More, or G1-PLC). This communication will reach large distances (good coverage). Data rates are adequate for current smart metering needs, though may not be so for next-generation Smart Grid services. Protocols are maximally optimized and proprietary. However, there is a concern that higher throughput would be required to fulfil the evolution of Smart Grid applications (e.g., prediction, real-time control, or control time varying the nature of wind and photovoltaic sources). In view of the lack of standardization, Echelon are trying to implement their OSGP protocol as a standard [10].
  • Narrowband with OFDM (e.g., PRIME, G3-PLC, IEEE P1901.2, and ITU G.hnem standards). In comparison with narrowband with a single carrier it has a smaller range (low coverage), but thanks to DLMS/COSEM it has excellent standardization. Smart meters from different manufacturers can be used side by side in one network.
  • Broadband (e.g., TIA-1113, HomePlug, IEEE 1901, ITU-T G.hn). This communication reaches high data rates but has lower communication distances (coverage) than narrowband and OFDM. BB-PLC provides a solution for high bandwidth requirements to support the evolution of Smart Grid applications, but estimation on why much higher data rates may be needed is still missing. Again, despite the use of the TCP/IP standard, protocols are proprietary for energy solutions, and it is not possible to deploy equipment from different manufacturers side by side in one network. New standards IEEE 1901 and ITU-T G.hn provide a new solution for coexistence and high performance. The drawback of BB-PLC is the allowable frequency bandwidth, for example, if BB-PLC is used in medium voltage (MV) lines, its performance significantly decreases due to the need to control available frequency bandwidth (power spectral density).
Millions of smart meters will be deployed in Europe in the near future. Vast amounts of data from such meters and other intelligent electronic devices in distribution network substations will require high-speed communications, therefore, the BB-PLC is starting to be the best solution.
The contribution of this paper is three-fold. First, the proposal of the number and position of the repeaters for a real topology are proposed thanks to the simulation, and also supported by verification with real on-filed measurements. Second, the influence of the power line topological parameters, physical characteristics of the power line, noise, and distance on the throughput are revealed. Third, the results of simulations revealed limits of BPL technologies for particular grids (e.g., communication distances without repeaters, necessity of additional repeaters). In the power line it is quite hard to predict the PLC behaviour. Therefore, simulation offers an opportunity for understanding and performance assessment of the grid configuration before deployment (roll-out).

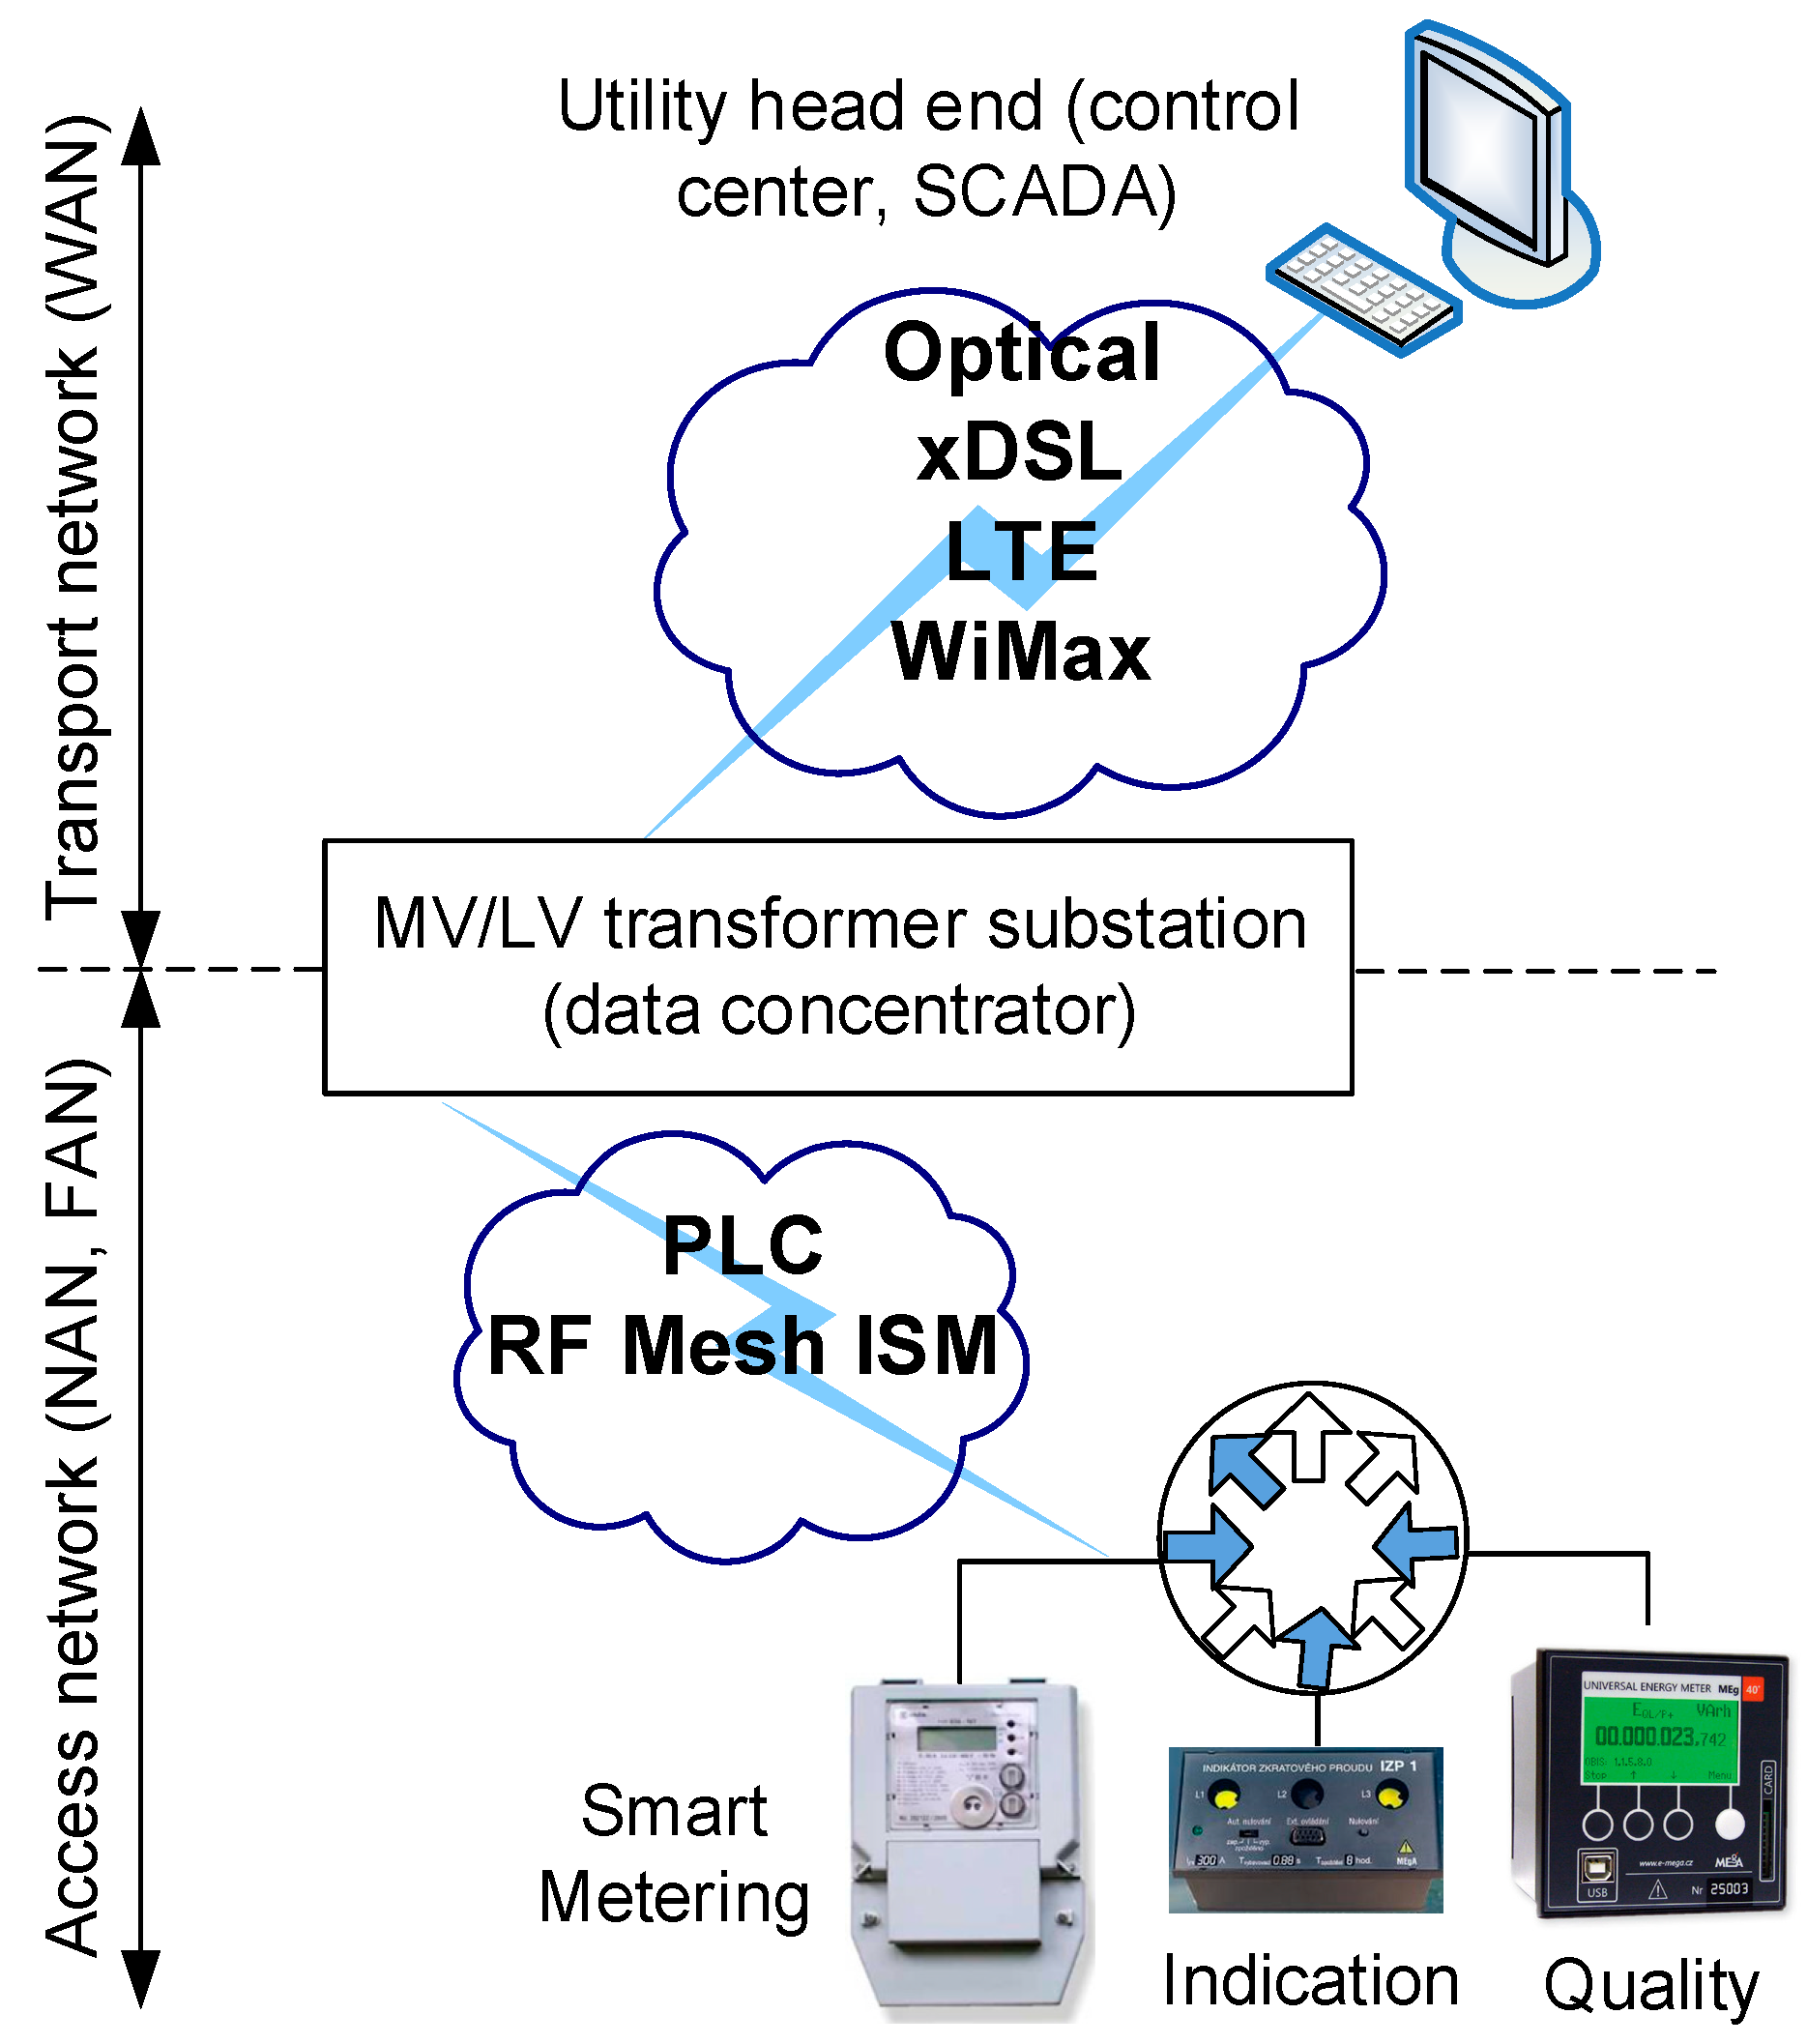
2. Communication Network Architecture for Smart Metering

In the Smart Metering environment, a communication network architecture could be represented by a hierarchical architecture classified by data rate and coverage. This hierarchical architecture for Smart Metering comprises (see Figure 1):
  • Neighbourhood area network (NAN) or field area network (FAN). These networks provide communication from end devices (e.g., Smart Meters) to data concentrators located at medium voltage/low voltage (MV/LV) transformer substations.
  • Wide area network (WAN). This network provides communication from the utility head end out to data concentrators located at MV/LV transformer substations.
Optical communication, cellular and WiMAX are commonly used as a communication medium between LV transformer substations and utility head end due to their high capacity and low latency.
Power line communication [11,12] and radio mesh [13] are widely used for communication from end devices (e.g., Smart Meters) to data concentrators located at MV/LV transformer substations due to low cost and simplicity.
Figure 2 shows a typical communication network architecture, which is considered for pilots, future deployments, or national roll-out in the Czech Republic. There is no doubt that the Smart Metering access networks (NAN, FAN) will be deployed mainly by PLC and for remote rural Smart Meters via wireless communications. A BB-PLC solution could be deployed in both MV and LV segments [11,12]. A comprehensive review of PLC standards can be found in previous studies [11,13].

Smart Metering Application and Communication Requirements

According to previous studies [5,12,14], mainly NB-PLC has been used in smart metering roll-out in Europe.
According to other studies [11,15], Smart Metering applications in NAN and FAN include demand response, load management, prepaid services, user information, real-time pricing and control, outage management, remote meter reading, firmware update, prepayment, TOU pricing, and service switch operation. Network requirements for Smart Metering vary according to application type: on-demand, scheduled (e.g., 1 min, 15 min), or bulk meter reading. The article [15] also analyzed typical data sizes, latency, and reliability of these Smart Metering applications.
For these Smart Metering applications, the communication requirements are:
  • Reliability >98%.
  • Latency: seconds.
  • Typical data size: 100–2400 bytes/per meter with sampling 1 min or 15 min.
  • Data rate 100 kbps–10 Mbps.
  • Transmission from a large number of smart meters.
  • Low cost.
  • Simplicity.
  • Secure communication and data privacy.
If we consider only scheduled remote meter reading for Smart Metering requirements [3,5], a NB-PLC provides adequate data rates. On the contrary, BB-PLC provides solution for broad-bandwidth requirements to fulfil the evolution of all Smart Metering applications (real-time). Therefore, this article focuses on the communication potential of BB-PLC technology for fulfilling all Smart Metering requirements useable for real-time Smart Metering applications.

3. Performance of Broadband Power Line Communication—Related Works

3.1. BB-PLC Standardization

TIA-1113 was the first BB-PLC standard adopted by the Telecommunications Industry Association (TIA) and released in 2001. This standard was based on HomePlug specifications 1.0. HomePlug 1.0 allowed a PHY data rate of 14 Mbps based on OFDM [16]. After that the HomePlug AV specification was available with an 85 Mbps PHDY data rate [17].
In 2010, IEEE 1901 and ITU-T G.hn standards were released. Both specify the physical and data link layers, coexistence mechanisms, and PSD masks. Similarly, HomePlug published the HomePlug AV2.
HomePlug AV2 specification delivers gigabit rates due to the extended frequency range (from 30 to 86 MHz) [18].
The IEEE 1901 standard uses the 2–30 MHz frequency band with an optional extended band of up to 50 MHz. The IEEE 1901 is defined for in-home and access networks. This standard defines two physical layer specifications, FFT-OFDM [19] and Wavelet-OFDM [20]. Wavelet OFDM PHY specification employs 512 subcarriers with 360 active subcarriers used for data modulation in the range from 1.8 MHz to 28 MHz and a frequency spacing of 61.03515625 kHz. FFT OFDM PHY specification uses 4096 subcarriers with up to 1974 usable subcarriers in the range of 1.8–50 MHz, and the carrier spacing is approximately 24.414 kHz. Support for carriers above 30 MHz is optional. Of the subcarriers below 30 MHz, 917 are active.
The ITU-T G.hn standard is specified for home networking and HAN capable of operating over all types of in-home wiring (power line, phone lines, and coaxial cables) and provides bit rates up to 1 Gbps [21].
The IEEE 1901 and ITU-T G.hn standards are noninteroperable. However, coexistence is enabled through the ISP specified in IEEE 1901 and ITU-T G.9972 [22].
A comprehensive review of PLC standards can be found in previous studies [23,24].

3.2. Achievable Data Rates of Broadband Power Line Communication—Related Works

Channel capacities measurements in MV networks have been investigated in previous publications [25,26,27,28,29,30].
Shallow spectral notches in CFR are observed on MV lines in comparison with LV lines [31]. Therefore, the whole frequency band can be used for transmission. In contrast with LV lines, the MV line exhibits only two dominant types of noise:
  • Narrowband noise. This type of noise is time-variant, and it is the result of interference from other services operating in the same frequency range with BPL. This type of noise is hard to describe and model. The impact of narrowband noise in MV lines on performance is not significant. Our previous measurements [28] show that the narrowband noise caused a decrease of units of dB in the average SNR. This decrease caused only a small decrease in the total throughput.
  • Coloured background noise. This type of noise is caused by corona phenomenon [32] and depends on geographical location, type of cable (overhead, underground), height of cables above the ground, etc.
Theoretical channel capacity of 18 Mbps for 1000 m with attenuation −80 dB and 262 Mbps for 400 m with attenuation −40 dB were introduced in a previous study [25]. The underground MV network of 10 kV without considering EMC constraint in the frequency range of 1–30 MHz with power level 1 W was considered.
The publication [26] has shown channel capacity over a 10kV underground medium-voltage line of a length of 700 m with different EMC limits. A capacity of up to 32.7 Mbps could be reached, which agrees with prEN50561 limits.
Several EMC norms were accounted for in a previous study [27] to determine channel capacities. The capacity of the order of hundreds of Mbps for a noise PSD equal to 105 dBm/Hz representing the average background noise is achieved. Tens of Mbps are observed in bad channels (130 dBm/Hz representing the best-case noise scenario) for the 3–30 MHz frequency band and FCC limits.
Our previous measurements [28] show UDP throughput of 11.75 Mbps and TCP throughput of 7.2 Mbps for 411 m overhead medium lines of 22 kV and 13.4–23.4 MHz frequency band.
The results in previous studies [29,30] show that raw data rate of several tens of Mbps are achievable for MV power lines up to 500 m.
Channel capacities measurements in LV networks have been investigated in previous publications [33,34].
The TCP throughput of 83.65 Mbps for a single non-interfering channel was presented in a previous study [33]. The frequency band 2–28 MHz, Wavelet OFDM, HD-PLC solution from Panasonic, and low voltage line were considered.
A previous publication [34] presented laboratory testbed and PLC throughput measurements for HomePlug AV2 and IEEE1901 for 50 m length on a separate LV power line. The throughput was approximately 85 Mbps for UDP protocol and 30 Mbps for TCP protocol.
Simulations of achievable throughputs of BPL in LV networks have been investigated in previous publications [8,35,36,37,38].
Simulation results of network reliability (successful upload, delivery ratio, loss, delay, latency) for varied numbers of smart meters carried out in NS-3 were introduced in a previous study [8].
The simulation introduced in another study [35] focuses on the theoretical throughput calculation for the in-home PLC scenario via simulation for different PHY recommendations for IEEE P1901 (Windowed OFDM PHY and Wavelet OFDM PHY) [36]. The PLC in-home model proposed in a previous study [37] is a statistical approach that synthesizes different classes with a finite number of multi-path components. This model considers three power line channel classes: class 1 (strong signal attenuation), class 5 (medium signal attenuation), and class 9 (little signal attenuation).
The throughput results for SNR = 20 dB and with 360 active subcarriers in the range from 1.8 to 28 MHz and a frequency spacing of 61 kHz are 18 Mbps for class 9 (little signal attenuation), 15 Mbps for class 5 (medium signal attenuation), 12 Mbps for class 5 (strong background noise −120 dBm/Hz), and 20 Mbps for class 1.
The throughput results for SNR = 20 dB and with 917 active subcarriers for the windowed OFDM with carrier spacing of 24.414 kHz are 50 Mbps for class 9, 8 Mbps for class 5 and 0.3 Mbps for class 1.
In a previous study [38], the achievable throughputs for class 1, 5, and 9 models for power line channel were introduced for IEEE P1901 standard, where 917 subcarriers are considered. The achievable theoretical throughput for class 1 was approximately 90 Mbps, resp. 135 Mbps for class 5 and 200 Mbps for class 9.
There are several results of throughput measurements for MV, laboratory test bed LV measurement, and throughput simulation for LV. The simulation together with on-field measurement on LV voltage is missing. Therefore, this article focuses on throughput simulation for real topology together with on-field measurement for verification of simulation results.

3.3. Repeaters Positioning in PLC Networks—Related Works

The achievable rate of NB-PLC as a function of the number of repeaters was shown in a previous study [39]. This article focuses on strategies to efficiently use and operate repeaters via numerical results of a transmission model. In comparison, this article focuses on throughput simulation and repeater positioning in BPL for real topology together with on-field measurement for verification of simulation results.
The need for repeaters in general depends heavily on the topology (number of branches, etc.), as was described in a previous study [40]. The influence of power line topological parameters on CTF was analysed in many previous works [31].
In a previous study [41], the BPL performance simulation in NS-2 was conducted for two scenarios: single-hop transmission and 2-hop transmission using the repeater. In comparison, this article focuses on real topology with many repeaters.

4. Evaluation of PLC Systems for Smart Metering Using Simulation Tools—State of the Art and Motivation

PLC are very special due to their constraints [3,11,31]. For a power line it is quite hard to allow for prediction of the PLC behaviour. On the other hand the performance assessment via simulations for complex PLC networks with repeaters is an easy, fast, and cheap solution for understanding the grid configuration, influence of particular topological components, and performance possibilities.
Simulation of these PLC systems using the advanced simulation tools, such as OPNET, OMNeT++, NS3, etc., has become trendy among the power system research community.
A previous publication [42] introduced OPNET simulation for evaluation of Smart Metering Infrastructure based on PLC. Several scenarios of the Smart Metering infrastructure performance were evaluated. The PLC was considered for the transmission between local concentrators and smart meters. The PLC channel is considered as the bus-link in OPNET, because in the OPNET simulation tool the PLC channel is not designed. Therefore, the simulation does not respect the physical parameters of the power line, multipath propagation, noise, time and frequency dependency, maximum communication distances, and throughput for different PLC technologies and others.
A cross-platform simulator for G3-PLC implemented in OMNeT++ has been presented in a previous study [43]. A simulator of in-home HomePlug-AV networks has been presented in another study [44]. Software called WITS for broadband PLC channel simulations was presented in another study [45]. The above-mentioned simulators focus mainly on simulations of the broadband PLC for in-home scenarios.
The main representatives of simulators in MATLAB include the Cañete et al. simulator [46] and FTW et al. simulator [47]. These simulators in MATLAB focus mainly on CTF simulations.

Simulation Goals

There is significant reason to prefer BB-PLC to NN-PLC. BB-PLC holds potential for high performance broadband IP networks to support the evolution of all Smart Grid applications (real-time, security). On the other way, the key question for BB-PLC is: How will the high performance (defined according to standards and vendor solutions) be influenced by distance, noise, and frequency?
This article focuses on Smart Metering deployment in Europe, therefore the European LV topology was considered. The LV topology is typically radial with many branches and average length of LV lines is 150–400 m [5,8]. Also, different types of LV cable design for underground or overhead installation were considered. For that reason, another key question for BB-PLC is: How will the throughput be influenced by the topology and physical characteristics of the power line?
The key questions in the issue of PLC/BPL evaluation for deployment for Smart Metering are:
  • Is it possible to design replicable and repeatable methodology for the evaluation of PLC technologies for Smart Metering deployment?
  • Is it possible to perform experimental evaluation of PLC using a simulation tool and find the limits of particular PLC technologies, which will correspondent with real deployment?
Therefore, the main goals of simulation are to find:
  • The impact of topological parameters and physical characteristics of the power line on throughput (channel link capacity).
  • The impact of noise on throughput (channel link capacity).
  • The impact of repeaters on throughput and reliability of communication.
  • Communication distances without repeaters.

5. NS-3 Simulation Tool

Due to the lack of simulation tools for PLC, a framework for PLC simulations in NS-3 environment (hereinafter referred to as NS-3 Simulator) was developed [48].
Like the above-mentioned simulators, the NS-3 Simulator focuses on the behaviour of power line transfer channel and it is possible to simulate both narrowband and broadband communication. The simulator enables definition of a variety of topologies and includes time- and frequency-variable behaviour of the PLC channel in the simulations.
Based on this simulator, the G.hn (ITU standard for a PLC) Network Simulator was designed [49]. In a previous study [50], this NS-3 Simulator is used for medium access control scheduler simulation in a realistic in-home scenario.
In comparison to MATLAB, the advantage of NS-3 is that libraries for a large number of communication technologies are implemented in NS-3. This allows the user to combine multiple technologies and to simulate applications for the Smart Grid and heterogeneous/hybrid networks.

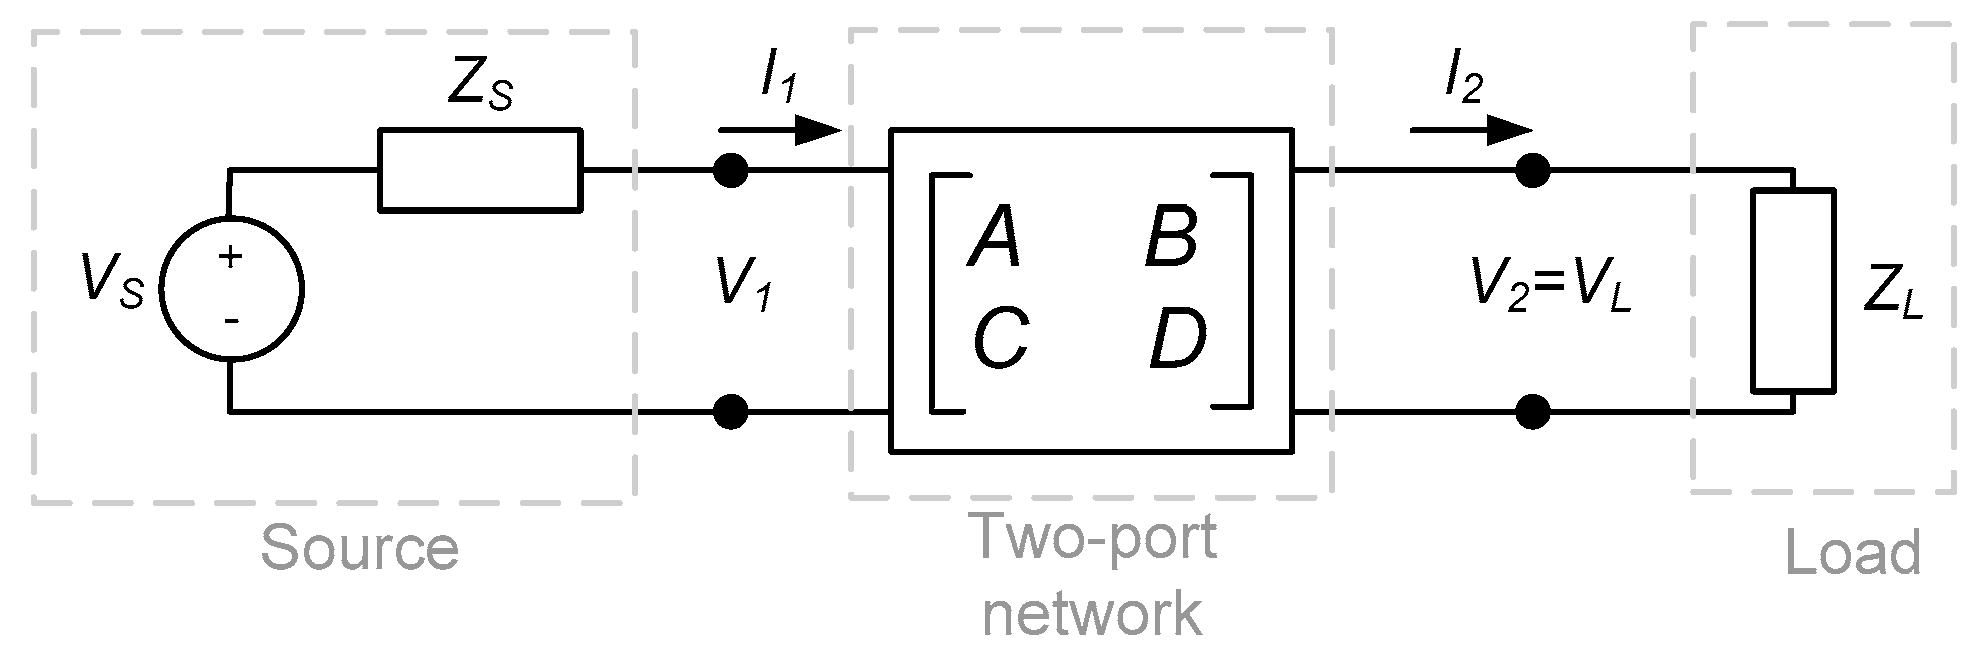
5.1. Channel Transfer Function

In order to develop efficient PLC systems and to propose improvements to the existing technology, it is necessary to accurately characterize the electrical infrastructure. The characteristics of the Channel Transfer Function (CTF) and the stationary noise give an indication of the PLC channel capacity and allow for evaluation of the PLC system performance.
The NS-3 Simulator uses a deterministic frequency domain method to compute the CTF of two-port networks. A frequency-domain-based method can be applied if the topology is well known and a detailed knowledge of the power line topology exists.
The transfer function and insertion loss of the power line channel can be calculated as a ratio of the load voltage to the source voltage, using the following equation (see Figure 3):
H = V 2 V 1 = Z S + Z L A · Z L + B + Z S · ( C · Z L + D ) H ( f ) = V 2 ( f ) V 1 ( f ) = Z S + Z L A ( f ) · Z L + B ( f ) + Z S · ( C ( f ) · Z L + D ( f ) ) .
I L = 20 · log | V 2 V 1 | = 20 · log | Z S + Z L A · Z L + B + Z S · ( C · Z L + D ) | I L ( f ) = 20 · log | V 2 ( f ) V 1 ( f ) | = 20 · log | Z S + Z L A ( f ) · Z L + B ( f ) + Z S · ( C ( f ) · Z L + D ( f ) ) |
A, B, C, and D are frequency-dependent coefficients, which are calculated from the secondary parameters: characteristic impedance ZC and propagation constant γ [51].
A previous article [31] described an extension of the framework for PLC communication simulations in NS-3 environment. The extension was an implementation of other cables and related calculations of primary parameters of power cables that have a big influence on the shape of the transfer function and channel capacity.
NS-3 Simulator could, according to user specified grid topologies, generate channel transfer functions and noise power spectral densities. From these quantities, signal-to-noise power ratio (SNR) and channel link capacity could be derived.

5.2. Channel Link Capacity

The maximum theoretical channel capacity can be estimated by Shannon’s Theory. Shannon’s Theory relates the theoretical channel capacity to the signal to noise ratio [52] using (2).
C = B · log 2 · ( 1 + S N ) .
where C indicates the maximum channel capacity in Sh/s, B is the channel bandwidth in Hz, and S/N is the received signal power to the noise signal power at the receiver.
In power line grid the noise is not invariant and the received signal varies with transfer function. Therefore, the received signal power density spectrum SRR, the noise spectral density spectrum SNN at the receiver, and transfer function H(f) must be considered. After that, theoretical channel capacity could be calculated using Equation (4).
C = B log 2 · ( 1 + S R R ( f ) S N N ( f ) ) d f = B log 2 · ( 1 + S T T ( f ) · | H ( f ) | 2 S N N ( f ) ) d f .
The channel is separated into N narrowband flat fading sub-channels of bandwidth Δf = B/N, where N is the number of samples of the CTF. After that channel capacity can be derived as follows [53]:
C = Δ f · v = 1 N log 2 · ( 1 + S R R ( f ) · | H ( f ) | 2 S N N ( f ) ) .
The power in the particular sub-channels v = 1 to N is:
P T T ( v ) = Δ f v S T T ( f ) d f
After this, with power the capacity is:
C = Δ f · v = 1 N log 2 · ( 1 + P T T ( v ) · | H ( v ) | 2 P N N ( v ) ) .
Finally, the capacity could be computed by:
C = Δ f · i = 1 N log 2 · ( 1 + S N R i )
where SNRi is:
S N R i = ( i 1 ) · Δ f i · Δ f S T T ( f ) · | H ( f ) | 2 S N N ( f ) d f
The NS-3 PLC simulator computes the channel capacity for a particular topology and modulation with a given number of modulation states.

6. Simulation—Basic Topologies

There are many simulation results of the influence of power line topology parameters on PLC systems. The power line topology parameters, e.g., load impedance, direct line length, and branch lengths, are considered and the influence of these parameters on channel transfer function were published in previous studies [31,51], but the influence of these power line topology parameters on throughput is missing.
Based on two-port PLC model and computation of the channel capacity, simple experimental topologies are used for an analysis of:
  • The influence of background noise on channel capacity.
  • The influence of direct line length from transmitter to receiver on throughput.
  • The influence of number of branches on throughput.
  • The influence of branch (tap) length on throughput.
  • The effect of branch length, number of branches, terminal load impedances, and time frequency varying behaviour on channel capacity.

6.1. Simulation Set-Up

To evaluate the capacity of BB-PLC channels for the best-case scenario, these parameters for basic topology simulation are considered:
  • The frequency band 1.8–30 MHz for broadband PLC.
  • The 64PSK modulation.
  • According to IEEE 1901 standard and FFT OFDM PHY specifications, 917 active carriers were considered.
  • Transmitter impedance was 40 Ω, receiver impedance 100 Ω, and node impedance was 250 Ω.
  • Transmitting power was −50 dBm/Hz.
  • Background noise for basic topologies was set according to real measurements [54] on the value of −90 dBm/Hz. This value represents ideal condition or environment in the real power line networks.

6.2. Influence of Background Noise on Channel Capacity

The aim of the investigation of the influence of white noise on channel capacity was to find the level of the white noise for particular conditions, e.g., laboratory condition (best-case), on-field good condition, and on-field very noisy condition (worst-case noise scenario).
The range of measured background noise varies in literature [55,56]. In a previous study [8], the value of −80 dBm/Hz was considered for simulation.
Average spectral noise power density (PSD) for high voltage lines measured in a previous study [57] was around −105 dBm/Hz. For low voltage lines, the PSD is slightly lower and it is approximately −120 dBm/Hz.
According to a previous study [58], for the underground high voltage lines, the average PSD is around −135 dBm/Hz and for the overhead high voltage line it is around 105 dBm/Hz. Low voltage line simulation in another study [54] was made with a noise floor of 10−9 W. In another study [59], noise with PSD equal to −105 dBm/Hz, representing the average background noise spectral density, was considered. Noise with PSD equal to −130 dBm/Hz, representing the best-case noise scenario, was introduced in another study [60].
Therefore, for the simulation the uniform average background noise PSD was considered as:
  • −90 dBm/Hz for ideal conditions (laboratory condition and on-field good condition).
  • −70 dBm/Hz for on-field very noisy condition (worst-case noise scenario).
To see the impact of the background noise on the throughput, the following scenario was considered: constant length between transmitter and receiver of 10 m, point-to-point connection without branches and cable NAYY150SE.
The throughput for −90 dBm/Hz for ideal conditions was 90.45 Mbps.
The throughput for −70 dBm/Hz for on-field very noisy conditions was 43.09 Mbps.

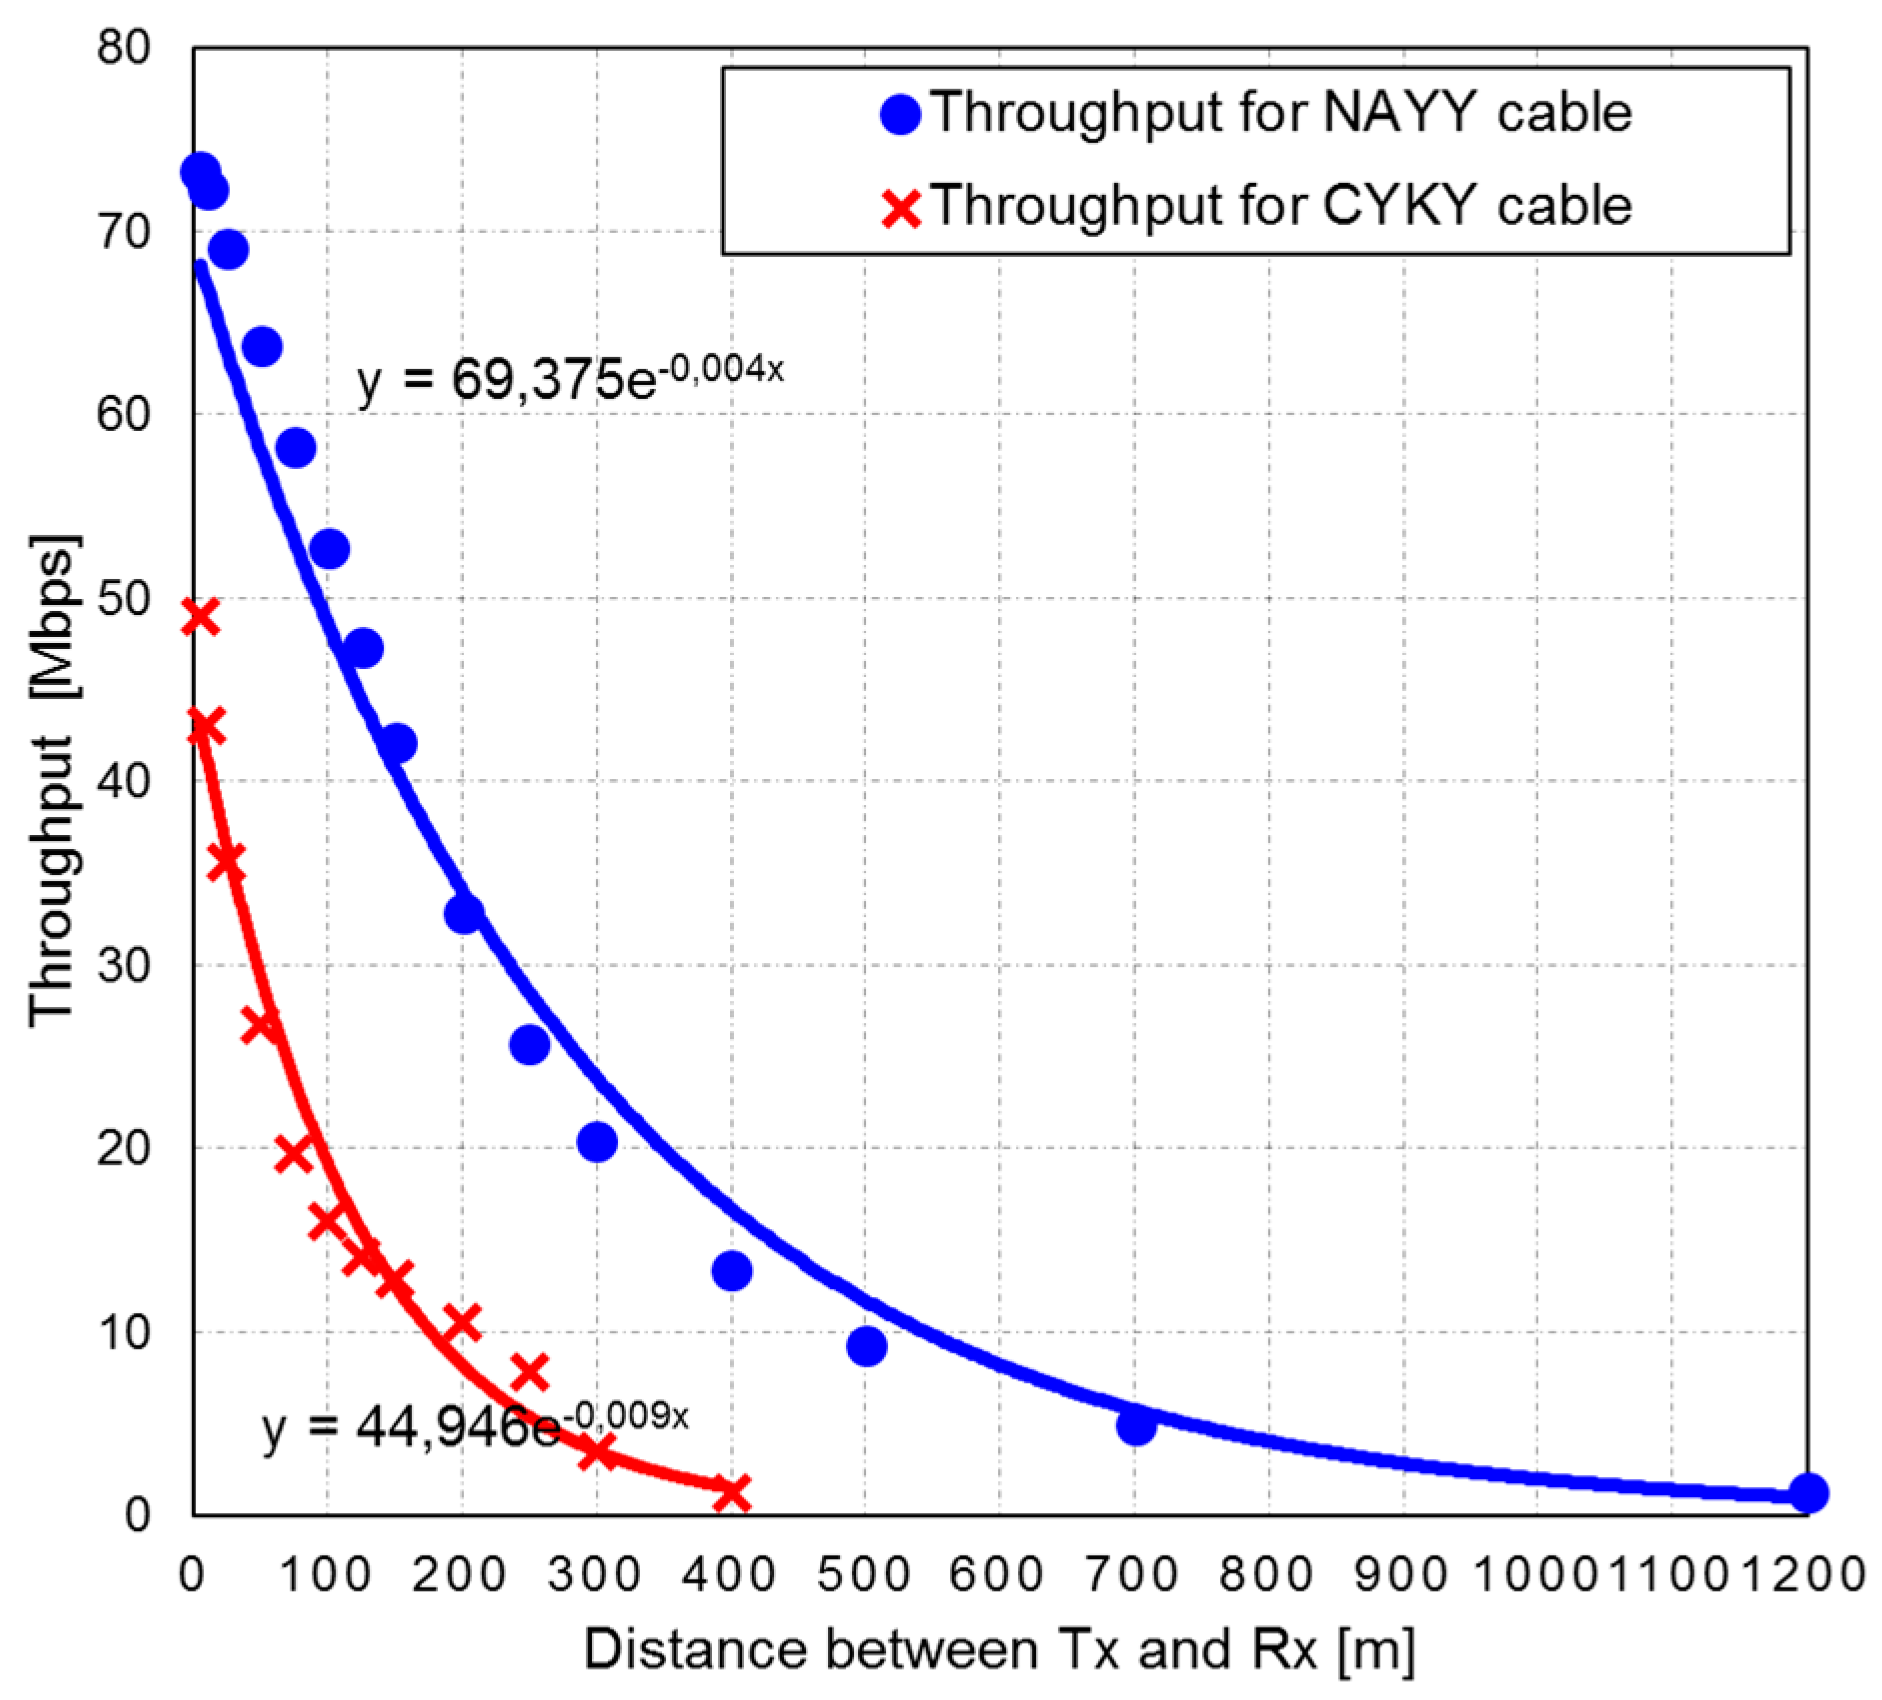
6.3. Influence of Direct Line Length from Transmitter to Receiver on Throughput

In this scenario the NAYY150SE underground power line cable was considered (cable used in the real installation for Smart Metering issue). Background noise was set up for ideal conditions at the value of −90 dBm/Hz. This value represents an ideal environment without branches, discontinuities, and transitions.
The peer to peer topology was considered and Figure 4 shows the results. It can be seen from the trend in this figure that the capacity of the cable channel decreases almost logarithmically with increasing length of the cable between transmitter and receiver. The decreasing capacity is caused by higher attenuation with increasing length. The channel capacity with overhead shows the decrease of capacity due to the header of the Ethernet frame (a data unit of 256 B was considered).
Figure 5 shows comparison of throughput for NAYY150SE and CYKY 3 × 2.5 cables. The NAYY150SE cable shows lower attenuation than CYKY 3 × 2.5, therefore it achieves higher throughput. For NAYY150SE cable, the theoretical communication distance was also longer.

6.4. Influence of Number of Branches on Throughput

The topology configuration with multiple branches and the NAYY150SE cable was considered. The distance between Tx and Rx varied from 150 to 1150 m and the branch length was 20 m (terminated by the 10 kΩ load). The number of branches varied from 1 to 3 branches. Figure 6 shows the throughput for different numbers of branches. It can be seen from the trend in this figure that the capacity decreases approximately by 4 Mbps from 22 Mbps to 18 Mbps for a 150 m cable between transmitter and receiver. With further increase in the number of branches (two and three), approximately the same capacity drop of 2 Mbps can be observed. This capacity drop is less significant for longer distances between transmitter and receiver.

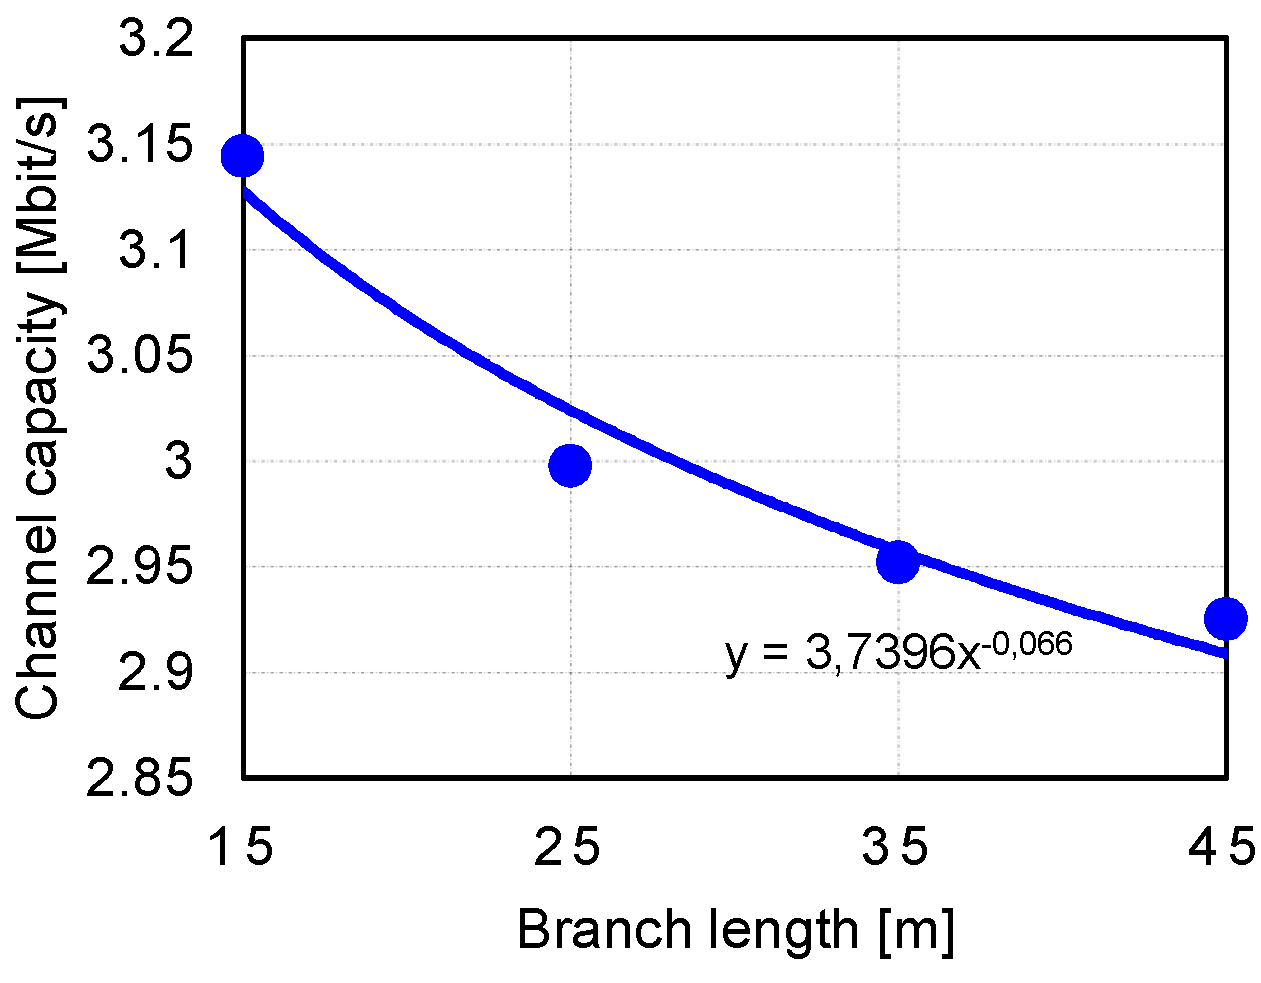
6.5. Influence of Branch (Tap) Length on Throughput

To see the impact of the branch (tap) length on the throughput, the following scenario was selected: constant length between transmitter and receiver of 1200 m and varying length of the branch (15, 25, 35 and 45 m). The increasing length of the branch caused decreasing channel capacity, but for the distance between transmitter and receiver of 1200 m it is not significant. The drop of 0.23 Mbps from 3.15 to 2.92 Mbps is caused by increasing the length of the branch from 15 to 45 m (see Figure 7).

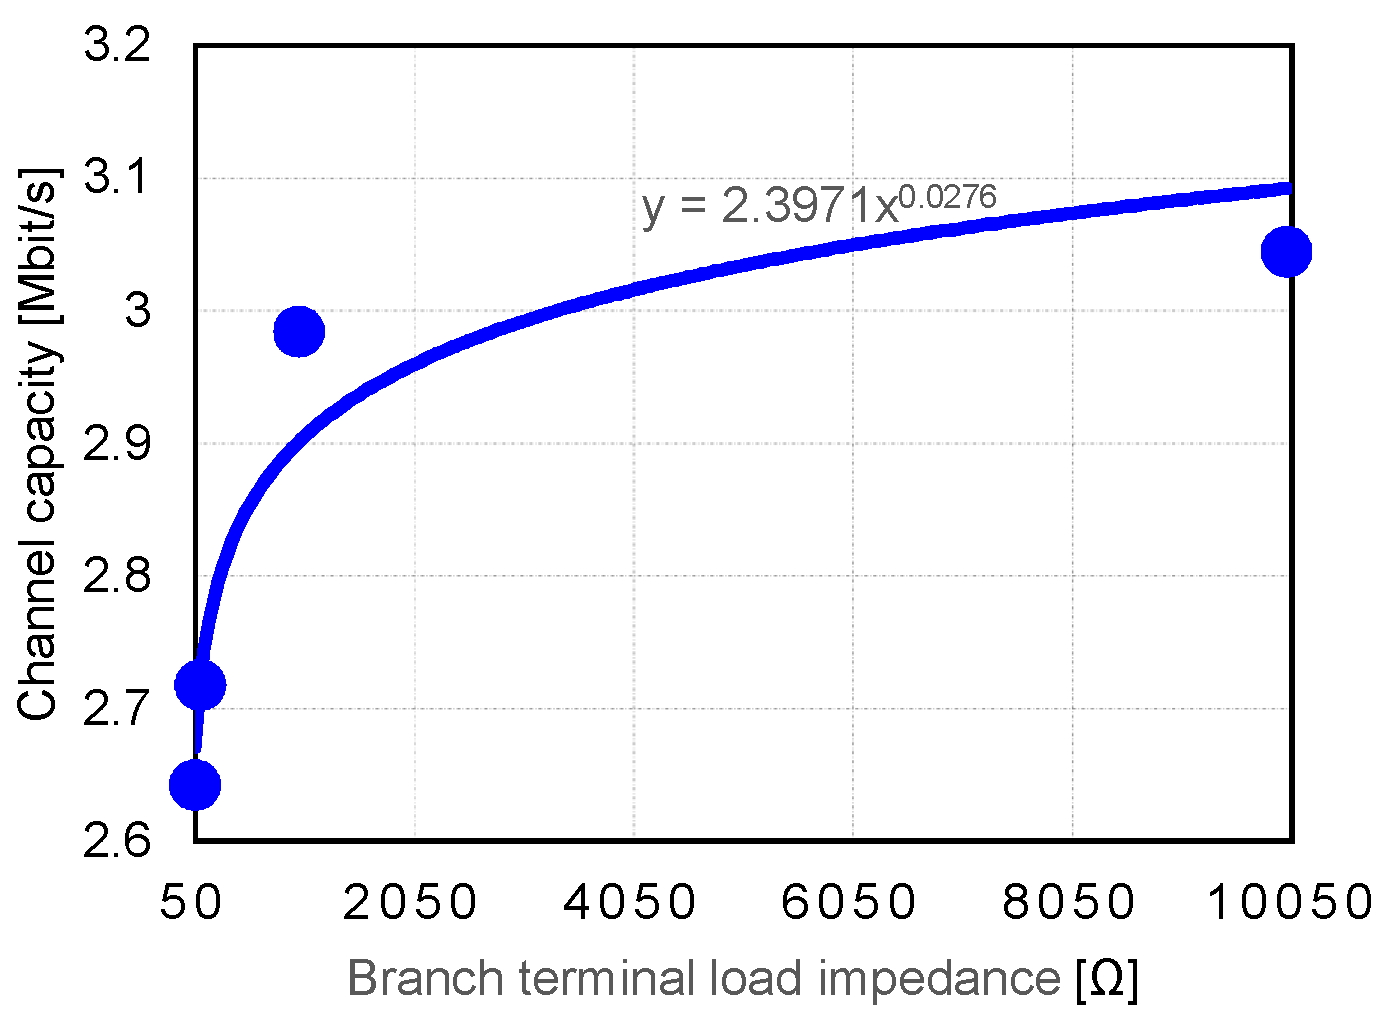
6.6. Influence of Terminal Load Branch Impedance on Throughput

To see the impact of the branch terminal load impedance on the throughput, the following scenario was considered: constant length between transmitter and receiver of 1200 m, constant branch length of 20 m in the middle of transmitter and receiver, and varying branch terminal load impedance (50, 100, 1000, and 10,000 Ω).
Figure 8 shows the influence of terminal load impedance on throughput. When increasing the terminal branch load impedance, the capacity increased evenly if at the same time the increasing impedance leads to deep notches in CTF [31,51]. At the same time the increasing impedance reduces the attenuation at certain frequencies, thus increasing the transfer capacity. Particularly from 2.65 Mbps at 50 Ω impedance to 3.05 Mbps at 10,000 Ω impedance.

6.7. Influence of Position of the Branch (Tap) on Throughput

To see the impact of the position of the branch (tap) on the throughput, the following scenario was considered: constant length between transmitter and receiver of 1200 m, constant branch length of 20 m, and the position of branch varied at 200, 400, 800, and 1000 m from the transmitter.
CTF is slightly rippled with small notches, therefore the impact of the position of the branch (tap) on the throughput is not significant.

6.8. Summary—Influence of Individual Parameters on Throughput

According to simulation results in the previous section, the following parameters influence the throughput significantly:
  • Background noise: The most significant source of throughout degradation caused by the different types of noise in LV networks.
  • Direct line length: The capacity of the cable channel decreases almost logarithmically with increasing length of the cable between transmitter and receiver. The capacity decreases approximately by 4 Mbps from 22 Mbps to 18 Mbps for 150 m of cable between transmitter and receiver. This capacity drop is less significant for longer distance between transmitter and receiver. For example, some simulation results [61] show capacity decrease with increasing length of the cable between transmitter and receiver.
  • Number of branches: The capacity decreases approximately by 2 Mbps with an increase in the number of branches (two and three).
  • Branch (tap) length: The increasing length of a branch caused decreasing channel capacity, but for a large distance between transmitter and receiver it is not significant. The drop of 0.23 Mbps from 3.15 to 2.92 Mbps is caused by increasing length of a branch from 15 m to 45 m.
  • Terminal load branch impedance: The changes of terminal load impedance lead to deep notches in CTF, therefore the throughput changes slightly.

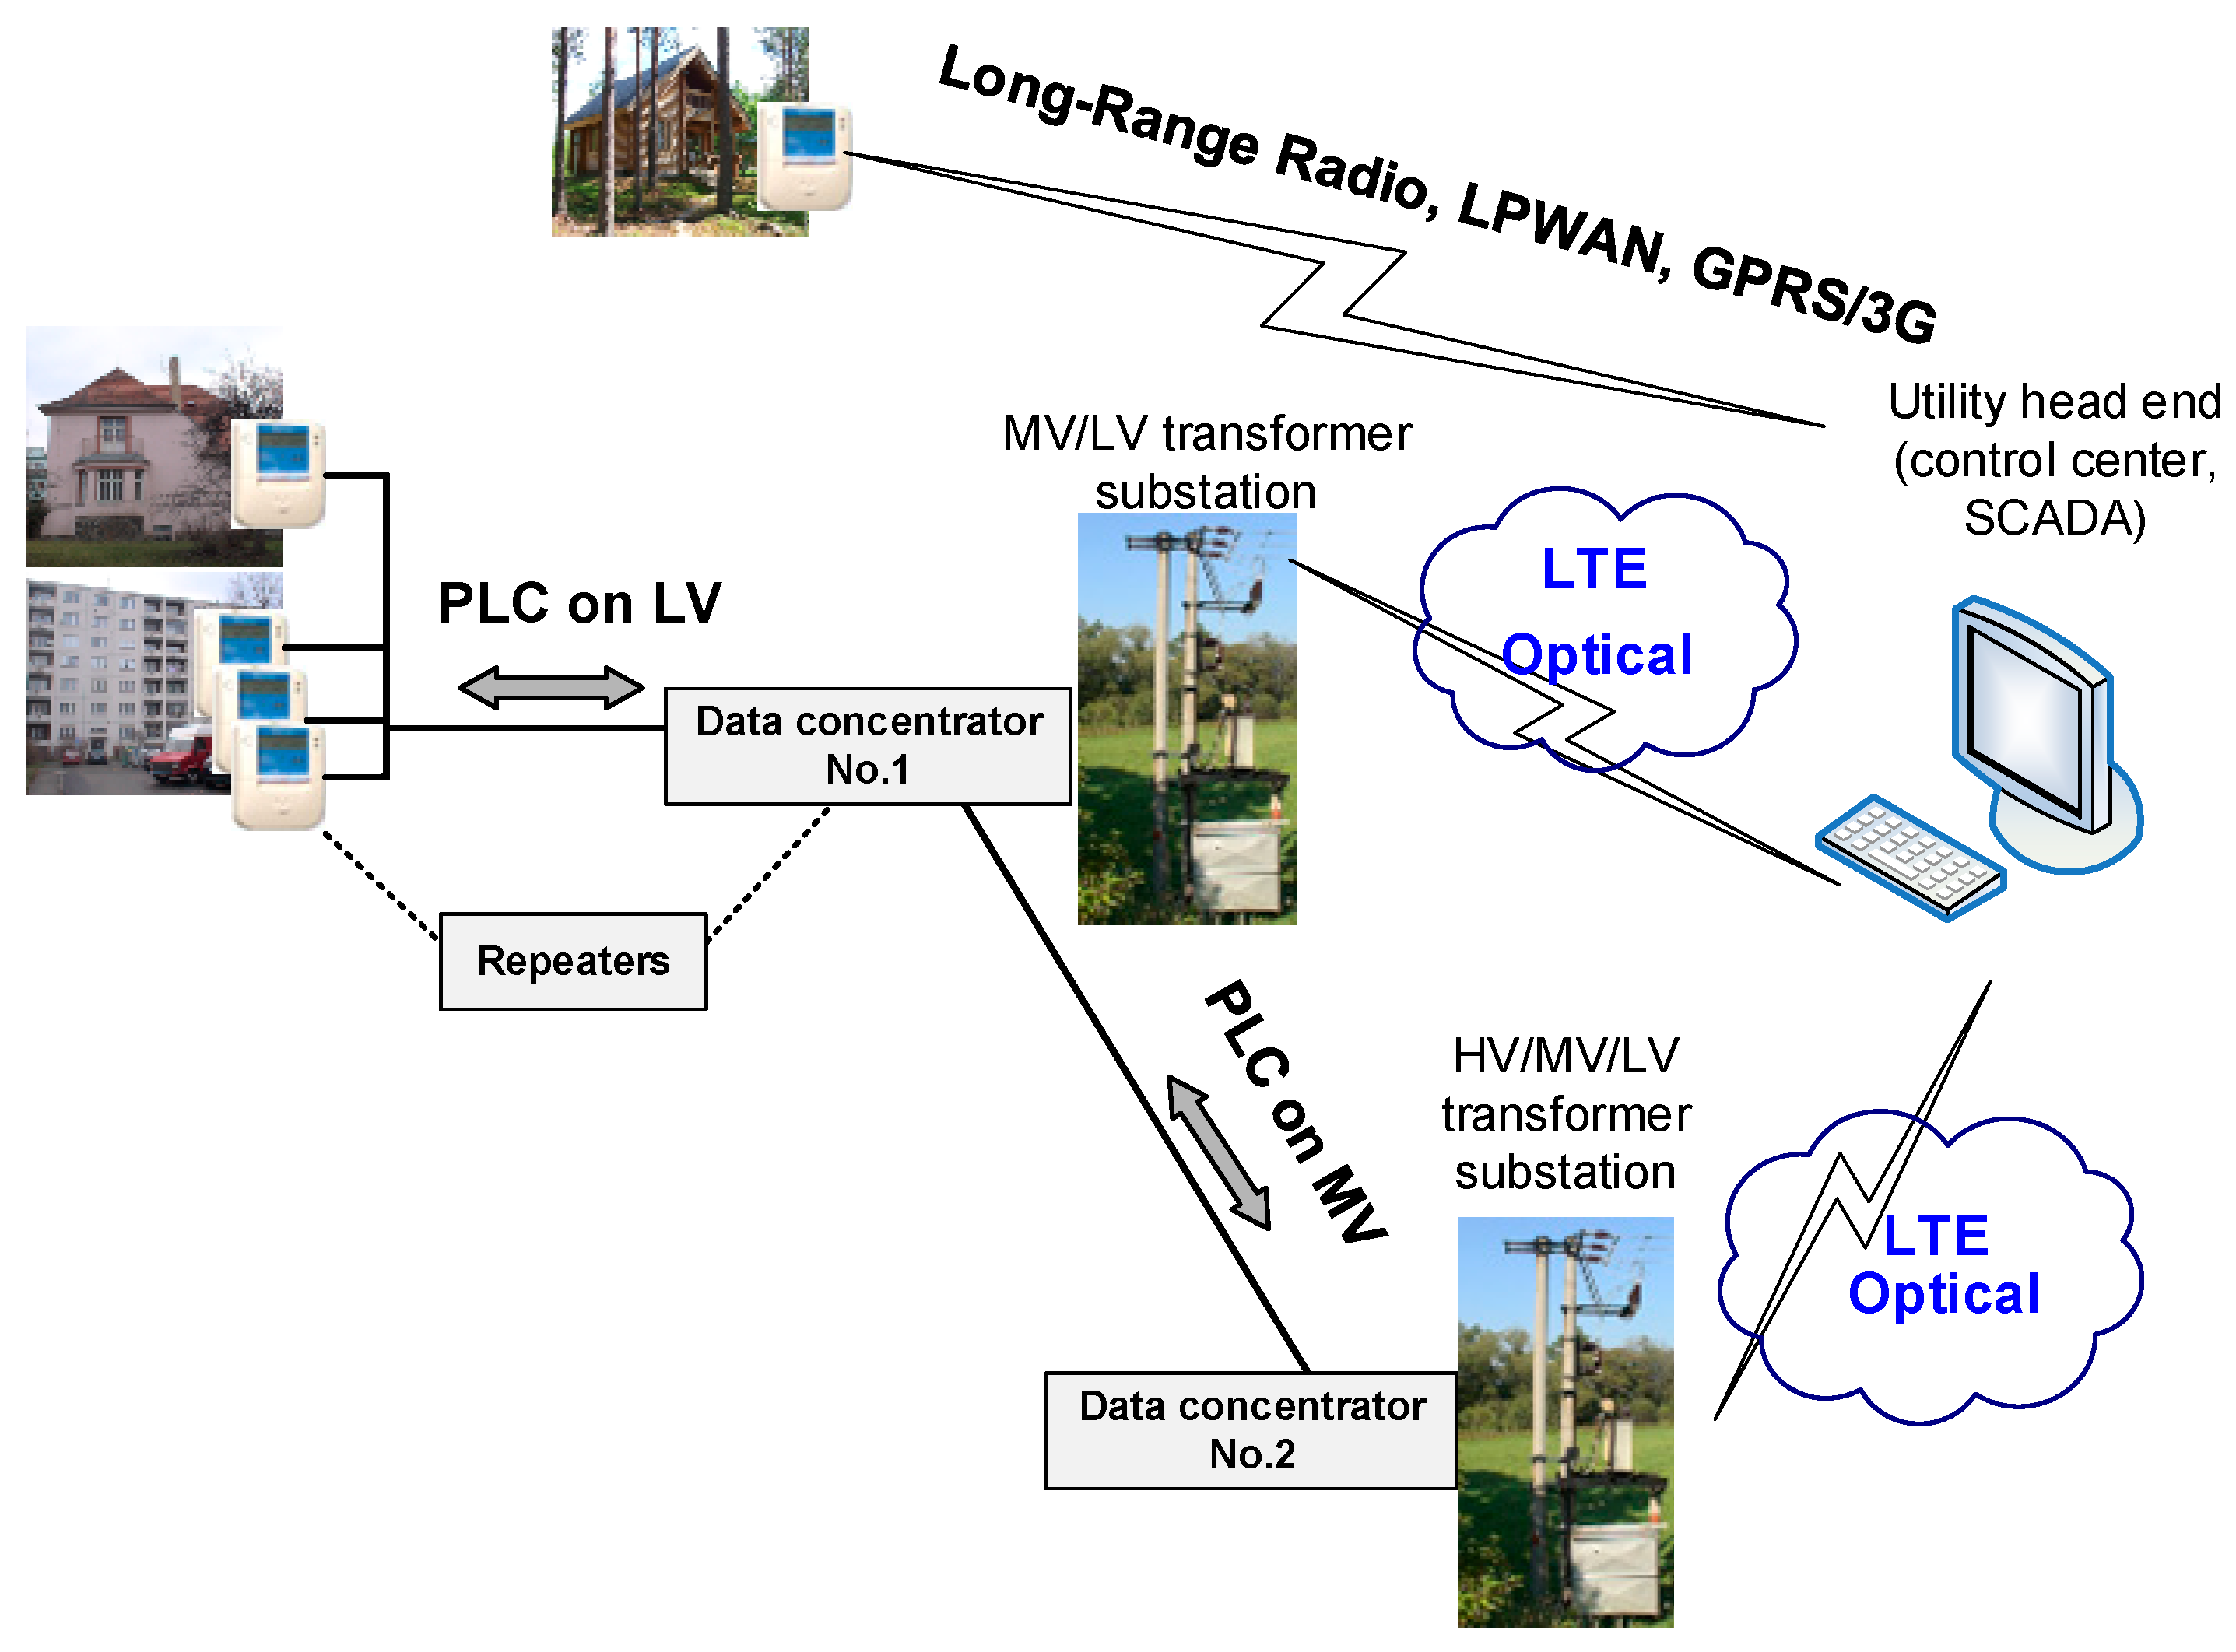
7. Simulation—Real Topology

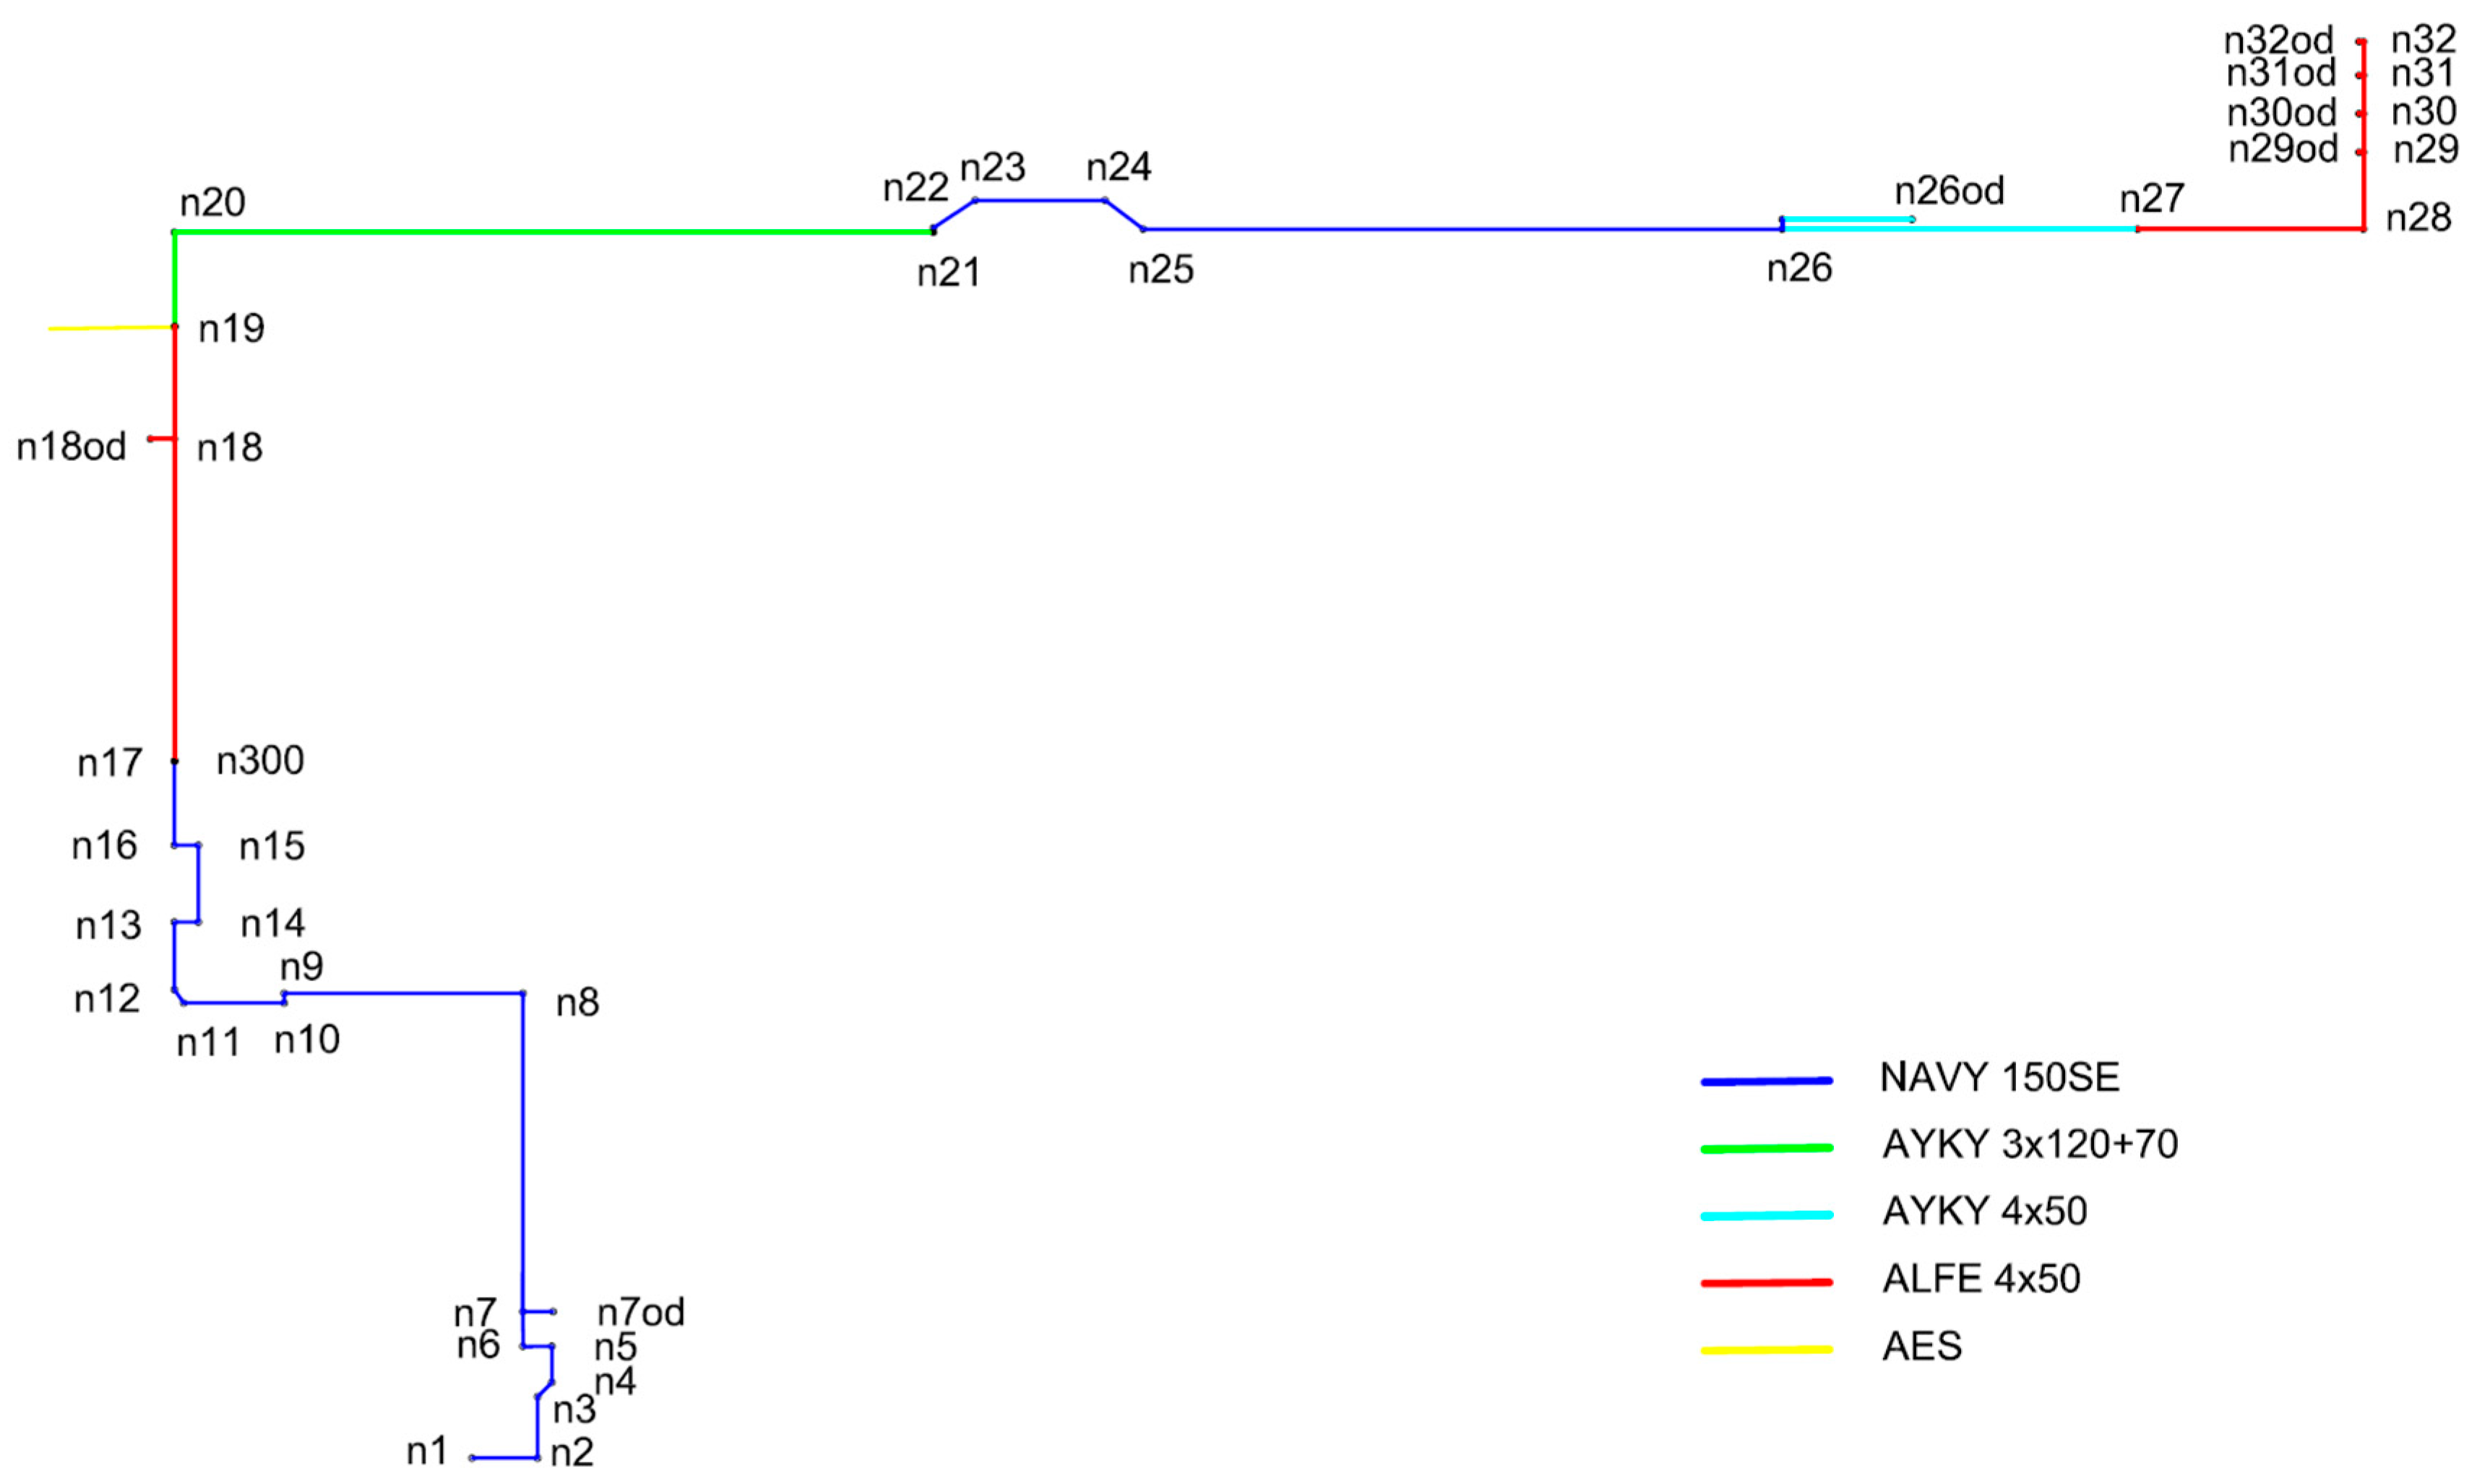
7.1. Topology Description

Figure 9 shows the real topology with the position of Smart Meters in supply points. The node n1 is a data concentrator located in MV/LV transformer substations with LTE network for connection to the data center. The node n1 is a PLC HeadEnd modem and the other nodes are Smart Meters in supply points, fuse boxes, and the transition between underground and overhead power lines.
The real topology is located in a rural area (small village) with only family houses. The no. 21, 22, 23, 24, 25, and 28 points are fuse boxes, other points are Smart Meters with BPL modems in supply points. The points from no. 2 to no. 17 are terraced houses.
Five types of power line cables were considered: underground cables NAYY 150SE, AYKY 3 × 120 + 70, and AYKY 4 × 50, and overhead cables AlFe 4 × 50 and AES 4 × 120.
The distance between n1 (HeadEnd) and the farthest node n32 is 835 m.

7.2. Simulation Set-Up

To evaluate the capacity of BB-PLC channels for worst-case noise scenario, these parameters for real topology simulation are considered:
  • The frequency band 1.8–30 MHz for broadband PLC.
  • QAM64 modulation.
  • According to IEEE 1901 standard and FFT OFDM PHY specifications, 917 active carriers were considered.
  • Transmitting power was 13.8 nW according to a previous study [53].
  • Background noise was set up according to real measurements [54] at the value of −70 dBm/Hz. This value represents very noisy conditions in the real power line networks.
  • The throughput on physical layer of 1 Mbps at the minimum was considered for simulation.

7.3. Methodology for Finding Repeaters Position

The methodology for finding repeater position is based on methods used in the real grid with BPL.
There are three kinds of BPL nodes in the network hierarchy:
  • Head End node, also called the Master. The position of the Head End node is always in the transfer station (node n1).
  • Repeater node, which behaves as a slave for the Master and a Master (Time Division Repeater (TDR)) for the slaves.
  • Customer Premise Equipment (CPE), also called the slave node.
General description according to real grid network hierarchy with BPL:
  • The HE master sends continuous invitation. When a CPE detects an access network, it will start the Access Protocol in order to obtain access to the network (to find master). The master will select the best CPE according to certain criteria (throughput and SNR).
  • Once a CPE is connected to a master, it can re-evaluate its status to the TDR, and can establish a new connection to a new CPE (which is not visible thanks to the distance to the HE master), according to certain criteria (throughput and SNR). TDR units have the main function of extending the coverage over a longer distance.
  • TDR sends continuous invitation and CPE starts the Access Protocol in order to obtain access to the network (to find master or TDR).
  • Repeated for the whole topology to build network hierarchy.
  • The second step takes place after the auto-configuration process and every period (e.g., three hours).
The proposed methodology in our approach for finding repeaters according to the General description above:
  • The throughput and SNR are evaluated between the HE node (n1) and the following nodes in the topology (nx) until the throughput does not drop below 1 Mbps or SNR below 3.
  • The nx node is set-up as a new repeater (TDR).
  • The throughput and SNR are evaluated between the TDR node (nx) and the following nodes in the topology (nxx) until the throughput does not drop below 1 Mbps or SNR below 3.
  • Repeated for whole topology after the CPE is found.
  • Optimization of positions of repeaters according to knowledge of throughput and SNR of all possible communication paths.

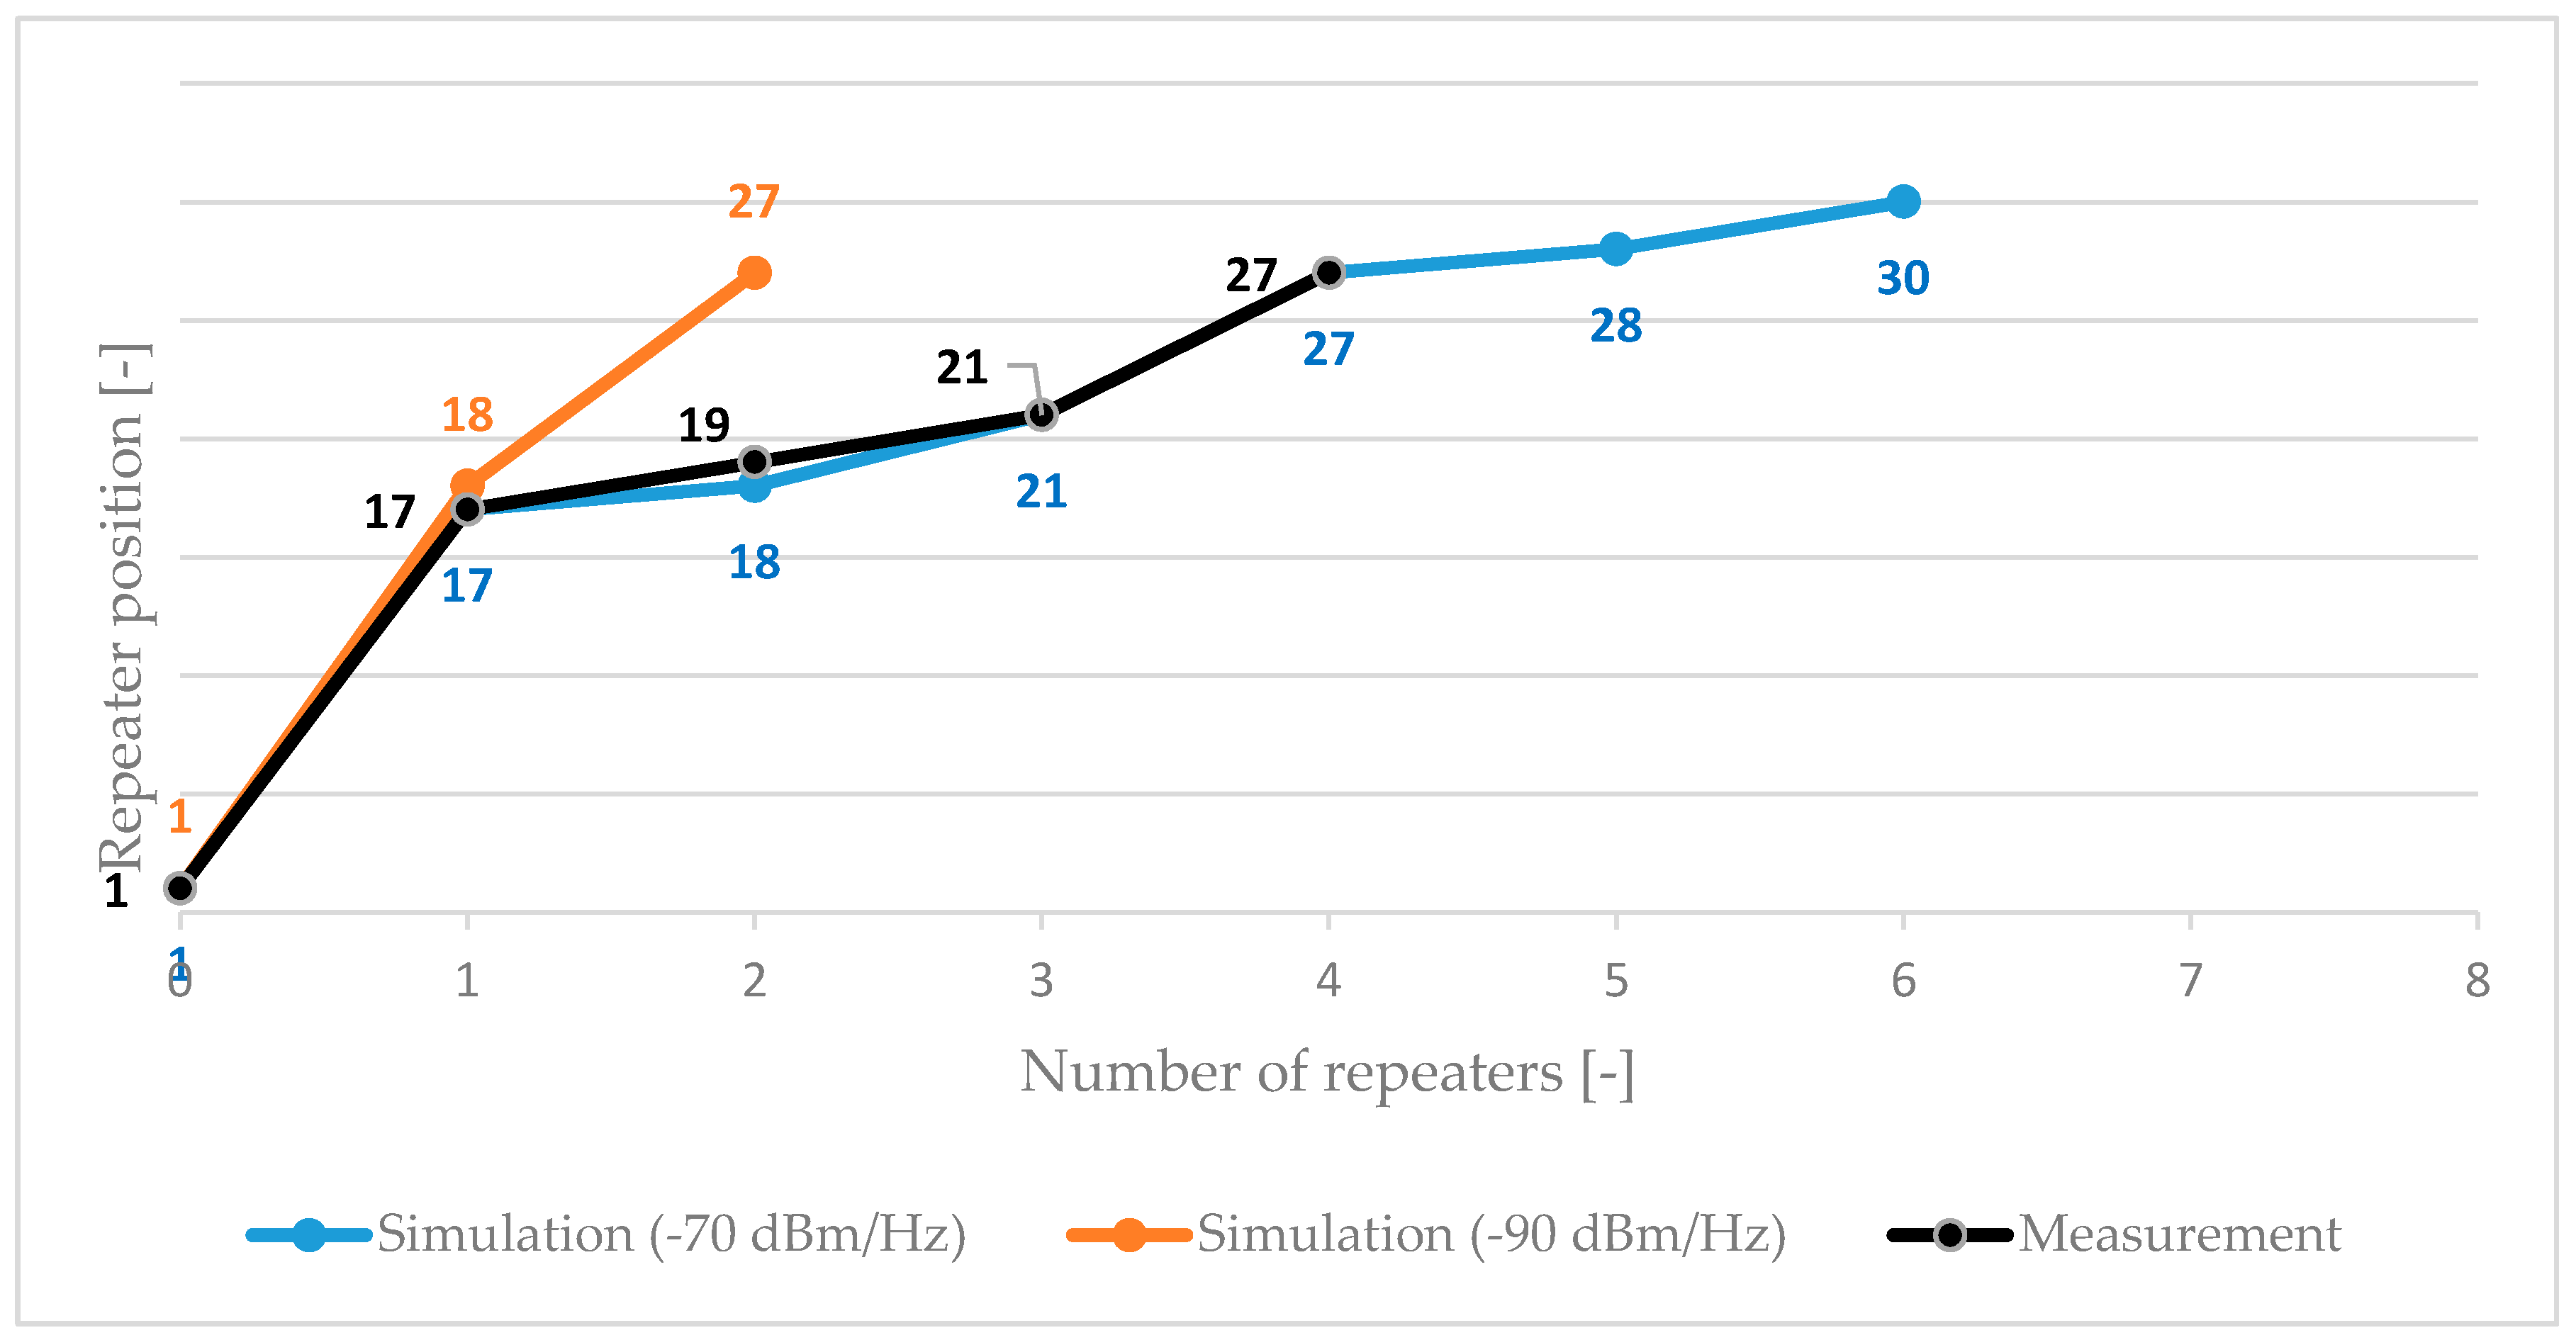
7.4. Results—Real Topology

The aim of the simulation was to find the number and positions of repeaters for a particular throughput level for communication between transfer station (HeadEnd modem) and Smart Meters.
The topology between transfer station (n1) and Smart Meters (n32) was described in a previous chapter and the distance was 836 m.
Table 1 shows throughputs for each route section from n1 to n32 according to the defined methodology. From these results it is obvious that the throughput on the physical layer of 1 Mbps can be achieved with six repeaters.
According to simulation results shown in the Table 1, the 6 repeaters are necessary to overcome the bottleneck throughput of 1.68 Mbps in the route section n17 → n18.
The bottlenecks are route sections n17 → n18 and n27 → n28. These bottlenecks are caused by the overhead power line AlFe 4 × 50 and the transition between underground and overhead power lines.
The cable type is not the only one reason for the bottleneck in the route section n17 → n18. The branches (taps) in nodes n18 and n19 also cause the throughput decrease (see Section 6.4 Influence of number of branches).
The other decrease of throughput is caused by the technical solution of the repeating signal, because the BB-PLC modems and repeaters use the same medium, and so their transmissions have to be multiplexed. This issue was not yet considered in simulations, but considering the worst-case noise scenario, this decrease could be neglected.

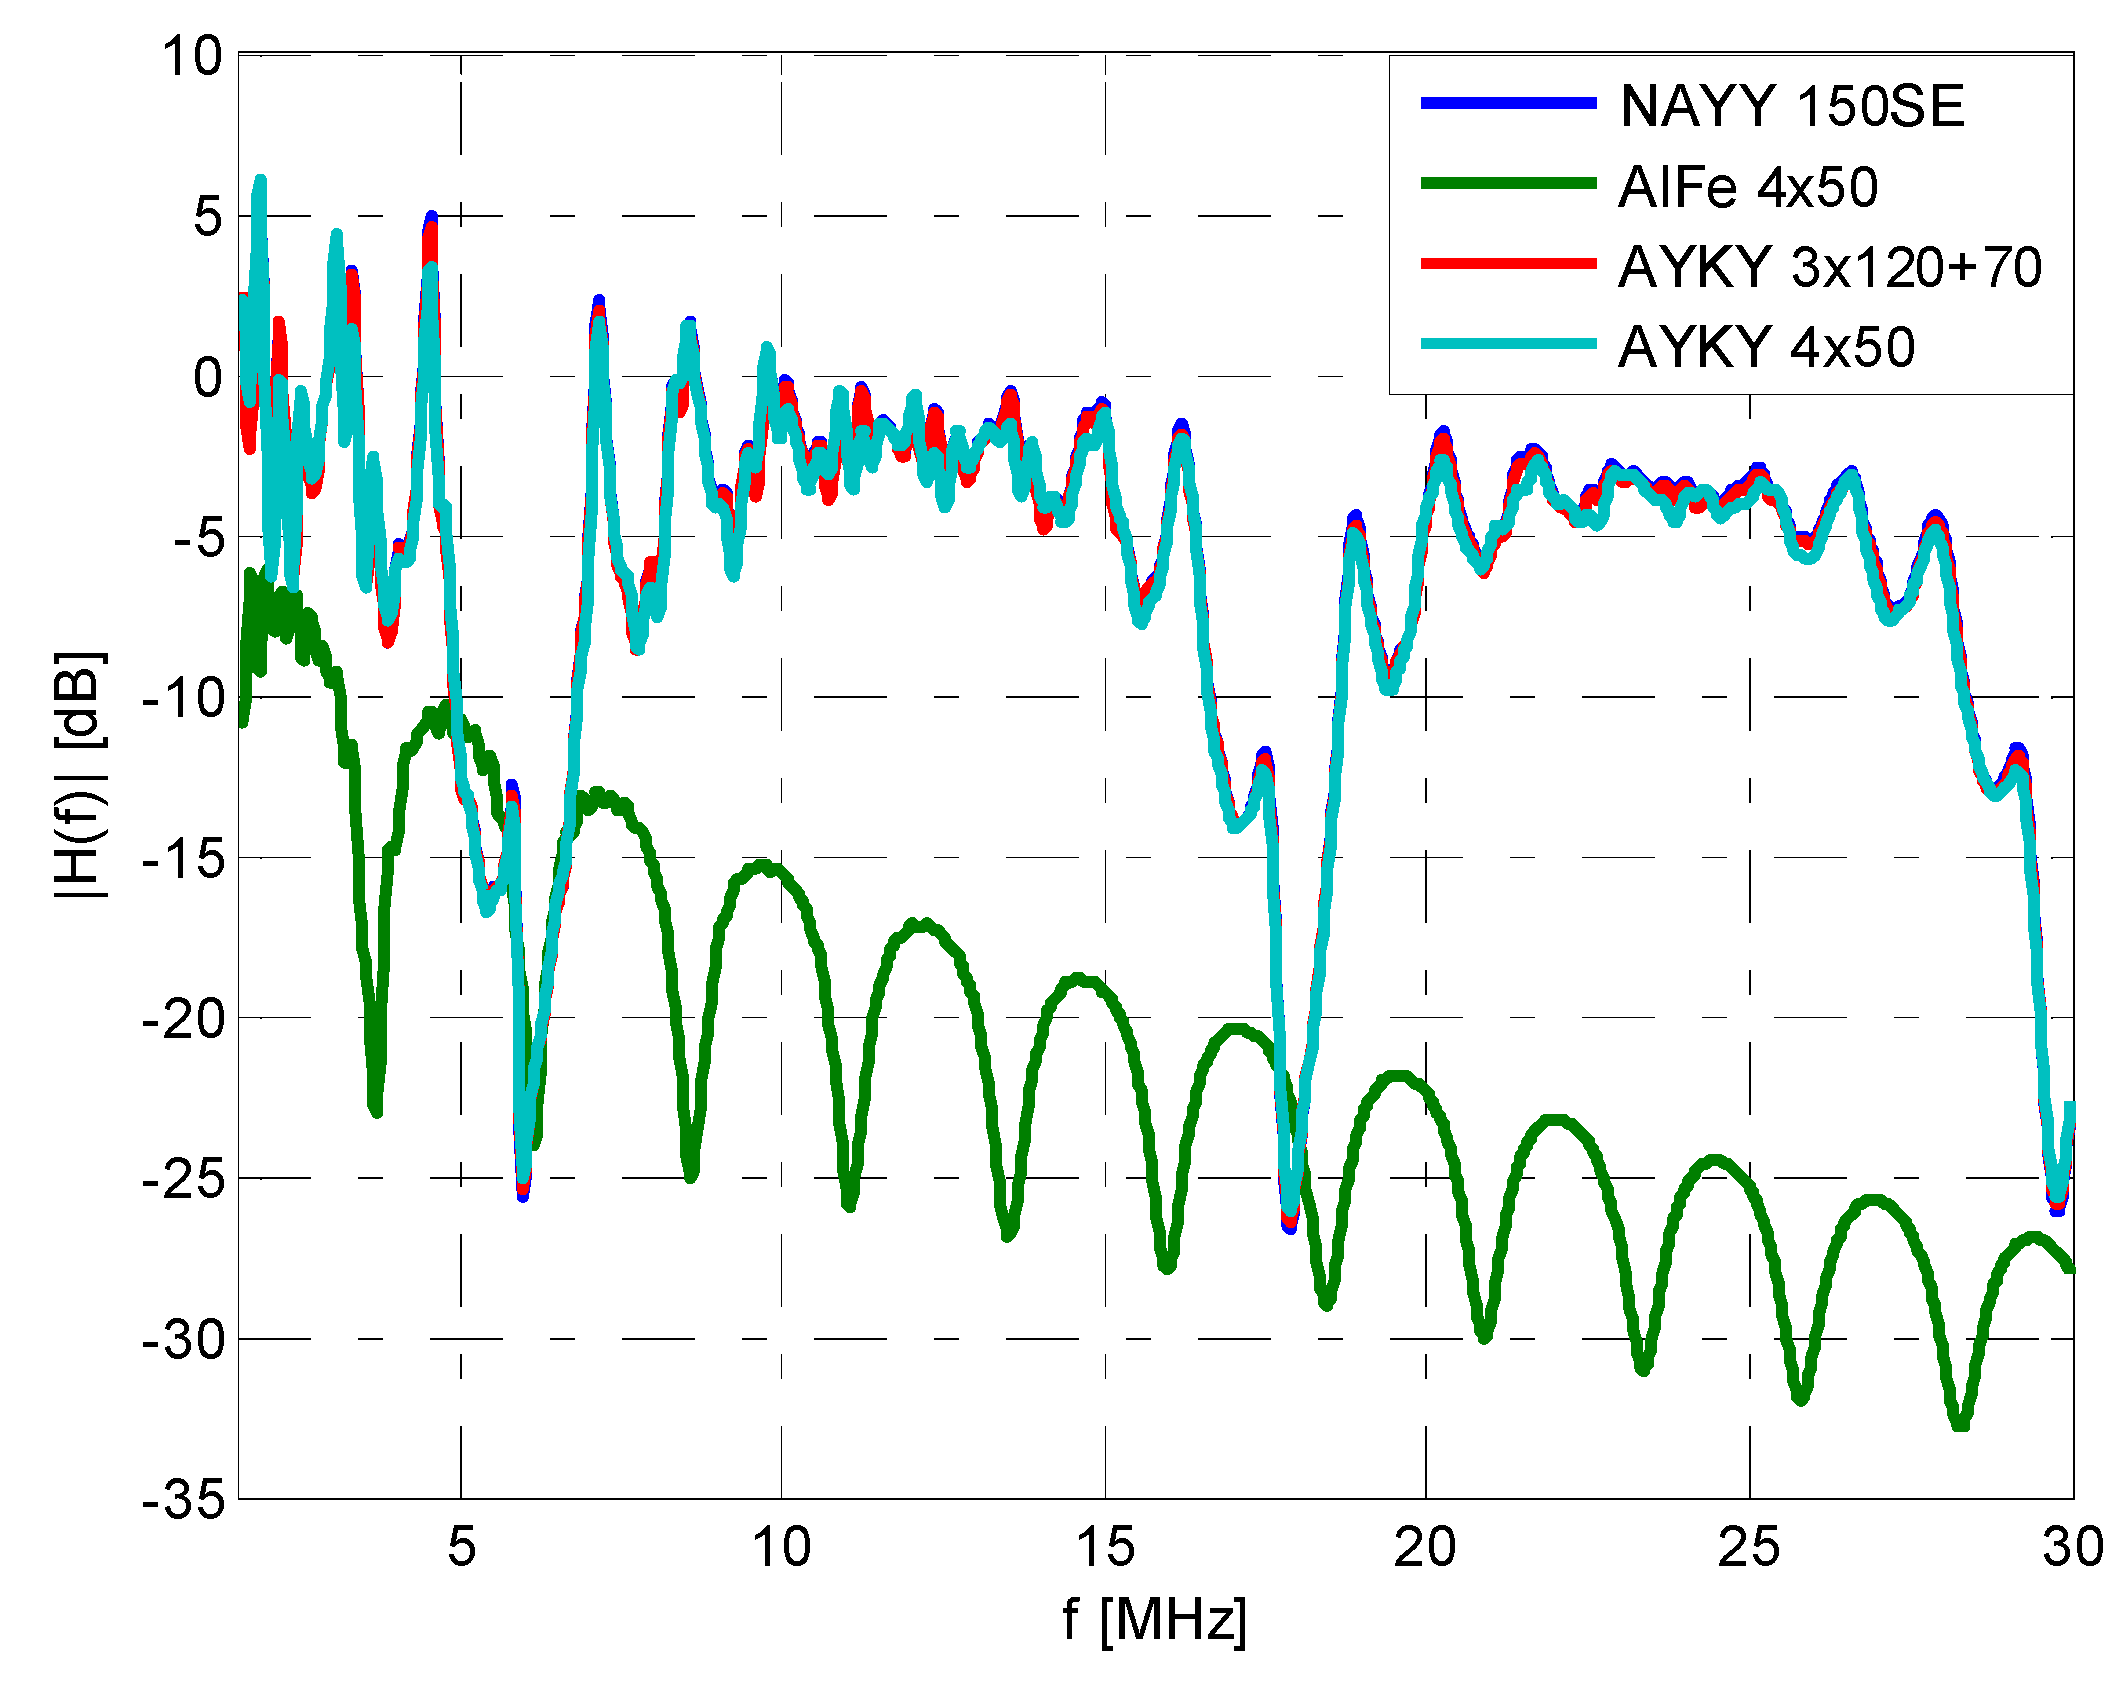
7.5. The Influence of Cable Type on Transfer Function and Throughput

According to simulation results from the previous chapter, the different cable types achieve very different results of throughputs. Therefore, the simulation of influence of cable types on transfer function and throughput was conducted. The route from n1 to n7 (31 m) was chosen due to a power line without branches and a line with a short distance, to achieve ideal conditions.
The transfer functions of different cables are shown in Figure 10. The overhead power line AlFe shows the highest attenuation. The AlFe cable is considered as an old type of cable with isolation in the form of air. This environment is not good for signal transmission on a frequency of 50/60 Hz. The successor of this cable is the AES cable with isolation in the form of polyethylene.
The underground power lines NAVY and AYKY have the same attenuation, and this attenuation is significantly lower than overhead power lines.
Table 2 shows throughout for different cables. Similarly, as a transfer function, the throughput of the underground power line is significantly higher than overhead power lines. The throughputs for different underground power lines are similar.
The results of transfer functions (attenuation and notches) of underground power lines from our simulation are in agreement with the results in a previous study [62].
The reason for significantly lower values of throughput and higher values of attenuation for overhead power lines are caused by multipath signal propagation, higher interferences and attenuation (higher background noise), lower power transmission, higher influence of branches and distance, and the issue of isolation [63].

8. Measurement in Real Topology—Evaluation of Simulation

According to topology and cable specification in Figure 9, the measurements were conducted between node n1 (HeadEnd modem located in the transformer substation (TS)) and two measurement points (Smart Meters), no. 26 and no. 32. The distance between TS and point no. 32 was 836 m, and from TS to point no. 26od it was 705 m.
The AV200 broadband power line technology with physical layer data rates of 200 Mbps based on the OFDM technology and NB-PLC based on single carrier solution with BPSK modulation were used for measurements. The aims of real measurements were:
  • Verification of the simulation results of BPL, especially these parameters:
    Reliability of communication;
    Number of repeaters;
    Communication distances without repeaters.
  • Comparison of simulation and measurement result of BPL with NB-PLC with single carrier.
The measurements of BPL were performed via GUI of the HE modem, where the network topology with TDR and CPE were available. The measurements of NB-PLC were performed via GUI of the NB-PLC modems and also with tools for serial communication.
Table 3 shows the results of the possibility of communication without repeaters for BPL and NB-PLC. Smart Meters no. 32 and no. 26 did not communicate with BPL without repeaters due to long distances and many transitions between underground and overhead power lines. For the distance of 367 m between n20 and n27 it was not possible to establish BPL communication due to distance limitation of this technology. Therefore, for this critical path, an additional repeater was installed in the fuse box in point no. 21.
To find the reason why point no. 32 did not communicate with NB-PLC, the impedance of the nearest fuse box no. 28 was measured. The connection was not established due to the section of overhead line of 43 m length between fuse boxes no. 28 and Smart Meter no. 32. The impedance of the power line between these fuse boxes was measured and the impedance between these two ends of the line was very different (possible reason for failure of PLC communication in point no. 32 with NB-PLC and also reason for BPL repeater in no. 28).
Table 4 shows the results of the possibility of communication with repeaters for BPL Smart metering infrastructure. The repeaters are considered in Smart Meters and one additional repeater in the fuse box for point no. 21 (see Figure 9).

Comparison with Simulation Results

For the simulations, the background noise was set up to very noisy conditions, and therefore according to the results of simulation the 6 repeaters are necessary to achieve BPL communication. According to real on-field measurements, four repeaters are necessary (see Table 5 and Figure 11). The difference of the numbers of repeaters is caused by the set-up parameters for simulation (e.g., background noise −70 dBm/Hz), which could be different in the real power grid and also the minimum throughout or minimum SNR level could be different for establishing BPL communication in noisy environments. Therefore, the simulation for the background noise PSD of −90 dBm/Hz (on-field good condition) was performed with the result of 2 repeaters.
The key parameters for the evaluation of Smart Metering network behaviour and performance are the availability and stability [6]. The simulation results for very noisy conditions with results of 6 repeaters provide a proposal for high availability and stability, also in the time with high noise or short-time noise conditions.

9. Conclusions

The best PLC technology must be identified and carefully selected for Smart Metering. Not all PLC technologies are created equal and not all PLC technologies should be judged by the poor performance of some of them.
The key parameters for evaluation of the communication performance of a Smart Metering network are data rate (throughput), robustness (availability and stability), noise immunity, achievable communication distances, and adaptation of the communication paths to network topology changes.
The framework for PLC communication simulations in NS-3 was chosen because it was freely available, a new extension in the form of implementation of G.hn standard was provided among the PLC research community, and also libraries for a large number of communication technologies are implemented in NS-3. Thanks to implementation of multiple technologies in NS-3, for example, the simulation of PLC for the access part and LTE for the transport part of Smart Grid networks could be provided.
This article shows an evaluation of the throughput and influence of particular parameters on the throughput via simulation in NS-3. The achievable communication distance for the real topology scenario was evaluated via simulation and measurements. The on-field measurements of BB-PLC show a maximum distance for successful BPL communication without a repeater of 339 m in on-field very noisy conditions (worst-case noise scenario).
In the simulation of basic topologies, it was shown that the attenuation of the power line is proportional to the length of the power line, and noise sources will have the largest impact on the capacity. The simulation also shows the significant influence of the overhead power line and the transition between underground and overhead power lines on the throughput.
The main contribution of the article is the proposal of the number and position of the repeaters for a real topology thanks to the simulation, also supported by the verification of simulation results with real on-file measurements. According to results (the number and position of repeaters), the necessity of repeaters in the transition between underground and overhead power lines is significant.
The future work will be focused on implementation of the open-source G.hn model in the NS-3 simulator [64]. This G.hn model includes the repeating function, therefore simulations of long line network topologies (e.g., network for electricity metering purpose) will be provided.

Author Contributions

Conceptualization, P.M.; formal analysis, P.S.; investigation, P.M.; methodology, P.M., R.F., and J.S.; validation, P.S.; writing—original draft, P.M.; writing—review and editing, J.M., P.S., and Z.H.

Acknowledgments

The research described in this paper was financed by the National Sustainability Program under grant LO1401. For the research, infrastructure of the SIX center was used.

Conflicts of Interest

The authors declare no conflict of interest.

References

  1. Andreadou, N.; Guardiola, M.O.; Fulli, G. Telecommunication Technologies for Smart Grid Projects with Focus on Smart Metering Applications. Energies 2016, 9, 375. [Google Scholar] [CrossRef]
  2. Mlynek, P.; Misurec, J.; Fujdiak, R.; Kolka, Z.; Pospichal, L. Heterogeneous Networks for Smart Metering—Power Line and Radio Communication. Elektron. Elektrotech. 2015, 21, 85–91. [Google Scholar] [CrossRef]
  3. Galli, S.; Scaglione, A.; Wang, Z. For the Grid and Through the Grid: The Role of Power Line Communications in the Smart Grid. Proc. IEEE 2011, 99, 998–1027. [Google Scholar] [CrossRef]
  4. Fang, X.; Misra, S.; Xue, G.; Yang, D. Smart Grid—The New and Improved Power Grid: A Survey. IEEE Commun. Surv. Tutor. 2012, 14, 944–980. [Google Scholar] [CrossRef]
  5. Sendin, A.; Pena, I.; Angueira, P. Strategies for Power Line Communications Smart Metering Network Deployment. Energies 2014, 7, 2377–2420. [Google Scholar] [CrossRef]
  6. Sendin, A.; Berganza, I.; Arzuaga, A.; Osorio, X.; Urrutia, I.; Angueira, P. Enhanced operation of electricity distribution grids through smart metering plc network monitoring, analysis and grid conditioning. Energies 2013, 6, 539–556. [Google Scholar] [CrossRef]
  7. Chren, S.; Rossi, B.; Pitner, T. Smart grids deployments within EU projects: The role of smart meters. In Proceedings of the Smart Cities Symposium Prague (SCSP), Prague, Czech Republic, 26–27 May 2016; pp. 1–5. [Google Scholar] [CrossRef]
  8. Ikpehai, A.; Adebisi, B.; Rabie, K.M. Broadband PLC for Clustered Advanced Metering Infrastructure (AMI) Architecture. Energies 2016, 9, 569. [Google Scholar] [CrossRef]
  9. Sarafi, A.M.; Tsiropoulos, G.I.; Cottis, P.G. Hybrid wireless-broadband over power lines: A promising broadband solution in rural areas. IEEE Commun. Mag. 2009, 47, 140–147. [Google Scholar] [CrossRef]
  10. Open Smart Grid Protocol (OSGP). ETSI GS OSG 001 V1.1.1 (2012-01). Available online: http://www.etsi.org (accessed on 12 February 2019).
  11. Sharma, K.; Saini, L.M. Power-line communications for smart grid: Progress, challenges, opportunities and status. Renew. Sustain. Energy Rev. 2017, 67, 704–751. [Google Scholar] [CrossRef]
  12. Artale, G.; Cataliotti, A.; Cosentino, V.; di Cara, D.; Fiorelli, R.; Guaiana, S.; Panzavecchia, N.; Tinè, G. A new PLC-based smart metering architecture for medium/low voltage grids: Feasibility and experimental characterization. Meas. J. Int. Meas. Confed. 2018, 129, 479–488. [Google Scholar] [CrossRef]
  13. Kabalci, Y. A survey on smart metering and smart grid communication. Renew. Sustain. Energy Rev. 2016, 57, 302–318. [Google Scholar] [CrossRef]
  14. Sendin, A.; Arzuaga, T.; Urrutia, I.; Berganza, I.; Fernandez, A.; Marron, L.; Llano, A.; Arzuaga, A. Adaptation of Powerline Communications-Based Smart Metering Deployments to the Requirements of Smart Grids. Energies 2015, 8, 13481–13507. [Google Scholar] [CrossRef]
  15. Kuzlu, M.; Pipattanasomporn, M.; Rahman, S. Communication network requirements for major smart grid applications in HAN, NAN and WAN. Comput. Netw. 2014, 67, 74–88. [Google Scholar] [CrossRef]
  16. Lee, M.K.; Newman, R.E.; Latchman, H.A.; Katar, S.; Yonge, L. HomePlug 1.0 powerline communication LANs—Protocol description and performance results. Int. J. Commun. Syst. 2003, 16, 447–473. [Google Scholar] [CrossRef]
  17. Afkhamie, K.; Katar, S.; Yonge, L.; Newman, R. An overview of the upcoming HomePlug AV standard. In Proceedings of the IEEE International Symposium on Power Line Communications and Its Applications (ISPLC), Vancouver, BC, Canada, 6–8 April 2005. [Google Scholar]
  18. Yonge, L.; Abad, J.; Afkhamie, K.; Guerrieri, L.; Katar, S.; Lioe, H.; Pagani, P.; Riva, R.; Schneider, D.M.; Schwager, A. An overview of the HomePlug AV2 technology. J. Electr. Comput. Eng. 2013, 892628. [Google Scholar] [CrossRef]
  19. Galli, S.; Logvinov, O. Recent Developments in the Standardization of Power Line Communications within the IEEE. IEEE Commun. Mag. 2008, 46, 64–71. [Google Scholar] [CrossRef]
  20. Galli, S.; Koga, H.; Kodama, N. Advanced signal processing for PLCs: Wavelet-OFDM. In Proceedings of the 2008 IEEE International Symposium on Power Line Communications and Its Applications, Jeju City, South Korea, 2–4 April 2008; pp. 187–192. [Google Scholar] [CrossRef]
  21. Oksman, V.; Galli, S. G.hn: The new ITU-T home networking standard. IEEE Commun. Mag. 2009, 47, 138–145. [Google Scholar] [CrossRef]
  22. International Telecommunications Union (ITU). ITU-T Recommendation G.9972, Coexistence Mechanism for Wireline Home Networking Transceivers. June 2010. Available online: http://www.itu.int/rec/T-REC-G.9972 (accessed on 12 February 2019).
  23. Galli, S.; Koch, M.; Latchman, H.A.; Lee, S.; Oksman, V. Industrial and international standards on PLC base networking technologies. In Power Line Communications, 1st ed.; Ferreira, H., Lampe, L., Newbury, J., Swart, T., Eds.; Wiley: New York, NY, USA, 2010. [Google Scholar]
  24. Cano, C.; Pittolo, A.; Malone, D.; Lampe, L.; Tonello, A.M.; Dabak, A.G. State of the Art in Power Line Communications: From the Applications to the Medium. IEEE J. Sel. Areas Commun. 2016, 34, 1935–1952. [Google Scholar] [CrossRef]
  25. Liu, H.; Song, J.; Zhao, B.; Li, X. Channel study for medium-voltage power network. In Proceedings of the IEEE International Symposium on Power Line Communications and Its Applications, Orlando, FL, USA, 26–29 March 2006; pp. 245–250. [Google Scholar]
  26. Bruck, G.H.; Jung, P.; Kocks, C.; Sachsenhauser, B.; Waadt, A. Achievable Data Rates of Broadband Power Line Communications in an Underground Medium-Voltage Network. J. Green Eng. 2013, 3, 245–259. [Google Scholar]
  27. Lazaropoulos, A.; Cottis, P. Capacity of overhead medium voltage power line communication channels. IEEE Trans. Power Deliv. 2010, 25, 723–733. [Google Scholar] [CrossRef]
  28. Mlynek, P.; Misurec, J.; Toman, P.; Silhavy, P.; Fujdiak, R.; Slacik, J.; Hasirci, Z.; Samouylov, K. Performance Testing and Methodology for Evaluation of Power Line Communication. Elektron. Elektrotech. 2018, 24, 88–95. [Google Scholar] [CrossRef]
  29. Dominiak, S.; Andersson, L.; Maurer, M.; Sendin, A.; Berganza, I. Challenges of Broadband PLC for Medium Voltage Smart Grid Applications. In Proceedings of the 6th WorkShop on Power Line Communications, Rome, Italy, 20–21 September 2012; pp. 20–21. [Google Scholar]
  30. Solaz, M.; Simon, J.; Sendin, A.; Andersson, L.; Maurer, M. High Availability solution for medium voltage BPL communication networks. In Proceedings of the 2014 18th IEEE International Symposium on Power Line Communications and Its Applications (ISPLC), Glasgow, UK, 30 March–2 April 2014; pp. 162–167. [Google Scholar]
  31. Mlynek, P.; Hasirci, Z.; Misurec, J.; Fujdiak, R. Analysis of Channel Transfer Functions in Power Line Communication System for Smart Metering and Home Area Network. Adv. Electr. Comput. Eng. 2016, 16, 51–56. [Google Scholar] [CrossRef]
  32. Tao, Z.; Xiaoxian, Y.; Baohui, Z.; Xu, N.H.; Xiaoqun, F.; Changxin, L. Statistical analysis and modeling of noise on 10-kV medium-voltage power lines. IEEE Trans. Power Deliv. 2007, 22, 1433–1439. [Google Scholar] [CrossRef]
  33. Raghav, V.S.; Gowtham, V.; Jamadagni, H.S.; Prabhakar, T.V. Data throughput maximization for broadband over Power Line. In Proceedings of the 2014 Sixth International Conference on Communication Systems and Networks (COMSNETS), Bangalore, India, 6–10 January 2014; pp. 1–6. [Google Scholar] [CrossRef]
  34. Horvat, G.; Balkić, Z.; Žagar, D. Power Line Communication Throughput Analysis for Use in Last Mile Rural Broadband. In Proceedings of the 2012 20th Telecommunications Forum, TELFOR 2012, Belgrade, Serbia, 20–22 November 2012. [Google Scholar] [CrossRef]
  35. Pinto-Benel, F.A.; Blanco-Velasco, M.; Cruz-Roldán, F. Throughput Analysis for Wavelet OFDM in Broadband Power Line Communications. IEEE Access 2018, 6, 16727–16736. [Google Scholar] [CrossRef]
  36. IEEE Standard for Broadband over Power Line Networks: Medium Access Control and Physical Layer Specifications; IEEE Std 1901-2010; IEEE: Piscataway, NJ, USA, 2010; pp. 1–1586.
  37. Tonello, A.; D’Alessandro, S.; Lampe, L. Cyclic prefix design and allocation in bit-loaded OFDM over power line communication channels. IEEE Trans. Commun. 2010, 58, 3265–3276. [Google Scholar] [CrossRef]
  38. Vo, T.N.; Amis, K.; Chonavel, T.; Siohan, P. Achievable throughput optimization in OFDM systems in the presence of interference and its application to power line networks. Commun. IEEE Trans. 2014, 62, 1704–1715. [Google Scholar] [CrossRef]
  39. Lampe, L.; Han Vinck, A.J. On cooperative coding for narrow band PLC networks. Aeü Int. J. Electron. Commun. 2011, 65, 681–687. [Google Scholar] [CrossRef]
  40. Jee, G.; Edison, C.; Das Rao, R.; Cern, Y. Demonstration of the technical viability of PLC systems on medium- and low-voltage lines in the United States. IEEE Commun. Mag. 2003, 41, 108–112. [Google Scholar] [CrossRef]
  41. Kim, M.-S.; Son, D.-M.; Ko, Y.-B.; Kim, Y.-H. A simulation study of the PLC-MAC performance using network simulator-2. In Proceedings of the IEEE International Symposium on Power Line Communications and Its Applications, Jeju City, Korea, 2–4 April 2008; pp. 99–104. [Google Scholar] [CrossRef]
  42. Panchadcharam, S.; Taylor, G.A.; Ni, Q.; Pisica, I.; Fateri, S. Performance evaluation of smart metering infrastructure using simulation tool. In Proceedings of the 2012 47th International Universities Power Engineering Conference (UPEC), London, UK, 4–7 September 2012; pp. 1–6. [Google Scholar] [CrossRef]
  43. Di Bert, L.; D’Alessandro, S.; Tonello, A.M. A G3-PLC simulator for access networks. In Proceedings of the 2014 18th IEEE International Symposium on Power Line Communications and Its Applications (ISPLC), Glasgow, UK, 30 March–2 April 2014; pp. 99–104. [Google Scholar]
  44. Pinero, P.J.; Cortes, J.A.; Canete, F.J.; Díez, L.; Manzanares, P.; Malgosa, J. A Realistic HomePlug-AV Simulator for In-Home Network Services Planning. In Proceedings of the 2011 IEEE Global Telecommunications Conference (GLOBECOM 2011), Kathmandu, Nepal, 5–9 December 2011; pp. 1–5. [Google Scholar]
  45. Tlich, M.; Zeddam, A.; Gauthier, F.; Pagani, P. Wideband Indoor Transmission Channel Simulator for Power Line: WITS Software. IEEE Trans. Power Deliv. 2010, 25, 702–713. [Google Scholar] [CrossRef]
  46. Cañete, F.; Cortes, J.; Diez, L.; Entrambasaguas, J. A channel model proposal for indoor power line communications. IEEE Commun. Mag. 2011, 49, 166–174. [Google Scholar] [CrossRef]
  47. Marrocco, G.; Statovci, D.; Trautmann, S. A PLC broadband channel simulator for indoor communications. In Proceedings of the IEEE International Symposium on Power Line Communications and Its Applications (ISPLC), Johannesburg, South Africa, 24–27 March 2013. [Google Scholar]
  48. Aalamifar, F.; Schloegl, A.; Harris, D.; Lampe, L. Modelling Power Line Communication Using Network Simulator-3. In Proceedings of the IEEE Global Communications Conference (GLOBECOM), Atlanta, GA, USA, 9–13 December 2013. [Google Scholar] [CrossRef]
  49. Tsokalo, I.; Radeke, R.; Lehnert, R. G.hn network simulator, calibration and simulation results. In Proceedings of the 18th IEEE International Symposium on Power Line Communications and Its Applications (ISPLC), Glasgow, UK, 30 March–2 April 2014; pp. 93–98. [Google Scholar] [CrossRef]
  50. Tsokalo, I.; Lehnert, R. Modeling approach of broadband in-home PLC in network simulator 3. In Proceedings of the International Symposium on Power Line Communications and Its Applications (ISPLC), Austin, TX, USA, 29 March–1 April 2015; pp. 113–118. [Google Scholar] [CrossRef]
  51. Mlynek, P.; Misurec, J.; Koutny, M.; Silhavy, P. Two-port network transfer function for power line topology modelling. Radioengineering 2012, 21, 356–363. [Google Scholar]
  52. Dostert, K.D. Power Line Communications. Prentice Hall Communications Engineering and Emerging Technologies Series; Prentice Hall PTR: Upper Saddle River, NJ, USA, 2001; ISBN 9780130293428. [Google Scholar]
  53. Kuhn, M.; Wittneben, A. PLC enhanced wireless access networks: A link level capacity consideration. In Proceedings of the IEEE 55th Vehicular Technology Conference, VTC Spring 2002, Birmingham, AL, USA, 6–9 May 2002; Volume 1, pp. 125,129. [Google Scholar]
  54. Khach, E.; Jacobsen, K.; Skov, M.; Hojholt, N.; Sorensen, R.; Olsen, R. Investigation of QoS in PLC and Evaluation of a ns-3 PLC Simulator. 2014. Available online: http://kom.aau.dk/group/14gr631/Report.pdf (accessed on 12 February 2019).
  55. Guillet, V.; Lamarque, G. Unified background noise model for Power Line Communication. In Proceedings of the 2010 IEEE International Symposium on Power Line Communications and Its Applications (ISPLC), Rio de Janeiro, Brazil, 28–31 March 2010; pp. 131–136. [Google Scholar]
  56. Liu, E.; Gao, Y.; Samdani, G.; Mukhtar, O.; Korhonen, T. Broadband powerline channel and capacity analysis. In Proceedings of the 2005 IEEE International Symposium on Power Line Communications and Its Applications (ISPLC), Vancouver, BC, Canada, 6–8 April 2005; pp. 7–11. [Google Scholar]
  57. Lee, J.J.; Choi, S.J.; Oh, H.M.; Lee, W.T.; Kim, K.H.; Lee, D.Y. Measurements of the Communications Environment in Medium Voltage Power Distribution Lines for Wide-band Power Line Communications. In Proceedings of the 2004 Int’l Symposium on Power-line Communications and Its Applications, Zaragosa, Spain, 31 March–2 April 2004; pp. 69–74. [Google Scholar]
  58. Lazaropoulos, A.G.; Cottis, P.G. Broadband Transmission via Underground Medium-Voltage Power Lines—Part II: Capacity. Proc. IEEE 2008, 25, 2425–2434. [Google Scholar] [CrossRef]
  59. Amirshahi, P.; Kavehrad, M. High-frequency characteristics of overhead multiconductor power lines for broadband communications. IEEE J. Sel. Areas Commun. 2006, 24, 1292–1303. [Google Scholar] [CrossRef]
  60. Song, J.; Pan, C.; Wu, Q.; Yang, Z.; Liu, H.; Zhao, B.; Li, X. Field trial of digital video transmission over medium-voltage powerline with time-domain synchronous orthogonal frequency division multiplexing technology. In Proceedings of the2007 IEEE International Symposium on Power Line Communications and Its Applications, Pisa, Italy, 26–28 March 2007; p. 30. [Google Scholar] [CrossRef]
  61. Hasirci, Z.; Ozturk, M.; Cavdar, I.H.; Benveniste, R.; Kaya, H. Investigating the effects of line length & branch number on busbar broadband PLC systems. In Proceedings of the 2017 40th International Conference on Telecommunications and Signal Processing (TSP), Barcelona, Spain, 5–7 July 2017; pp. 247–250. [Google Scholar] [CrossRef]
  62. Anatory, J.; Theethayi, N.; Thottappillil, R.; Kissaka, M.; Mvungi, N.H. The Influence of Load Impedance, Line Length, and Branches on Underground Cable Power-Line Communications (PLC) Systems. Proc. IEEE 2008, 23, 180–187. [Google Scholar] [CrossRef]
  63. Amirshahi, P.; Kavehrad, M. Medium voltage overhead power-line broadband communications; transmission capacity and electromagnetic interference. In Proceedings of the IEEE Symposium on Power Line Communications and Its Applications, Vancouver, Canada, 6–8 April 2005. [Google Scholar]
  64. Tsokalo, I.; Prasad, G.; Mudriievskyi, S.; Lehnert, R. CSMA/CD in PLC: Test with full G.hn and IP/UDP protocol stack. In Proceedings of the 2017 IEEE International Symposium on Power Line Communications and Its Applications (ISPLC), Madrid, Spain, 3–5 April 2017; pp. 1–6. [Google Scholar] [CrossRef]
Figure 1. Smart Metering communication network architecture with several technologies.
Applsci 09 01527 g001
Figure 2. Smart Metering communication network architecture with major technologies used for pilots, future deployments, or roll-outs in Europe.
Applsci 09 01527 g002
Figure 3. Two-port network model.
Applsci 09 01527 g003
Figure 4. Channel capacity for NAYY150SE cable with varying length from transmitter to receiver.
Applsci 09 01527 g004
Figure 5. Channel capacity for NAYY150SE and CYKY 3 × 2.5 cable with varying length from transmitter to receiver.
Applsci 09 01527 g005
Figure 6. Channel capacity for a NAYY150SE cable with varying length from transmitter to receiver and a varying number of branches.
Applsci 09 01527 g006
Figure 7. Channel capacity for different branch lengths.
Applsci 09 01527 g007
Figure 8. Channel capacity for changing branch terminal load impedance.
Applsci 09 01527 g008
Figure 9. Real topology.
Applsci 09 01527 g009
Figure 10. Throughout for different types of cables.
Applsci 09 01527 g010
Figure 11. Comparison of simulation with measurement.
Applsci 09 01527 g011
Table 1. Possibility of communication—without repeaters.
Measuring Point/Route SectionDistance [m]Cable TypeThroughput on Physical Layer [Mbps]
n1 → n17231 (102 + 75 + 54)NAYY 150SE15.4
n17 → n1865ALFE 4 × 501.68
n18 → n21212 (43 + 169)ALFE 4 × 50; AYKY 3 × 120 + 704.9
n21 → n27197NAYY 150SE; AYKY 4 × 5082.6
n27 → n2888ALFE 4 × 502.2
n28 → n3022ALFE 4 × 506.2
n30 → n3221ALFE 4 × 506.2
Table 2. Possibility of communication—without repeaters.
Cable TypeThroughput on Physical Layer [Mbps]
NAYY 150SE47.94
ALFE 4 × 506.30
AYKY 3 × 120 + 7047.45
AYKY 4 × 5046.83
Table 3. Possibility of BPL and NB-PLC communication—without repeaters.
Measuring PointDistance from TS [m]Possibility of Communication
BPLNB-PLC Single Carrier
Smart Meter no. 32836NONO
(long distances, lack of repeaters, transition between underground, and overhead)(communication in the near fuse box (no. 28) was possible)
Smart Meter no. 26od705NOYES
(long distances, lack of repeaters)(BPSK, 5 kb/s)
Table 4. Possibility of BPL communication with repeaters.
Measuring PointDistance from TS [m]Possibility of Communication
BPL
Smart Meter no. 32835YES
(repeaters: n17, n19, n21, n27)
Smart Meter no. 26od705YES
(repeaters: n17, n19, n21)
Table 5. Comparison of simulation with measurement.
Simulation with Background Noise −70 dBm/HzSimulation with Background Noise −90 dBm/HzMeasurement
BPL Path/Route SectionDistance [m]BPL Path/Route SectionDistance [m]BPL Path/Route SectionDistance [m]
n1 → n17231 n1 → n18296 n1 → n17231
n17 → n1865n18 → n27409 n17 → n19108
n18 → n21212 n27 → n32131 n19 → n21169
n21 → n27197 n21 → n27197
n27 → n2888 n27 → n32131
n28 → n3022
n30 → n3221

