Experimental Study of Steel Reinforced Concrete (SRC) Joints


Abstract
:1. Introduction
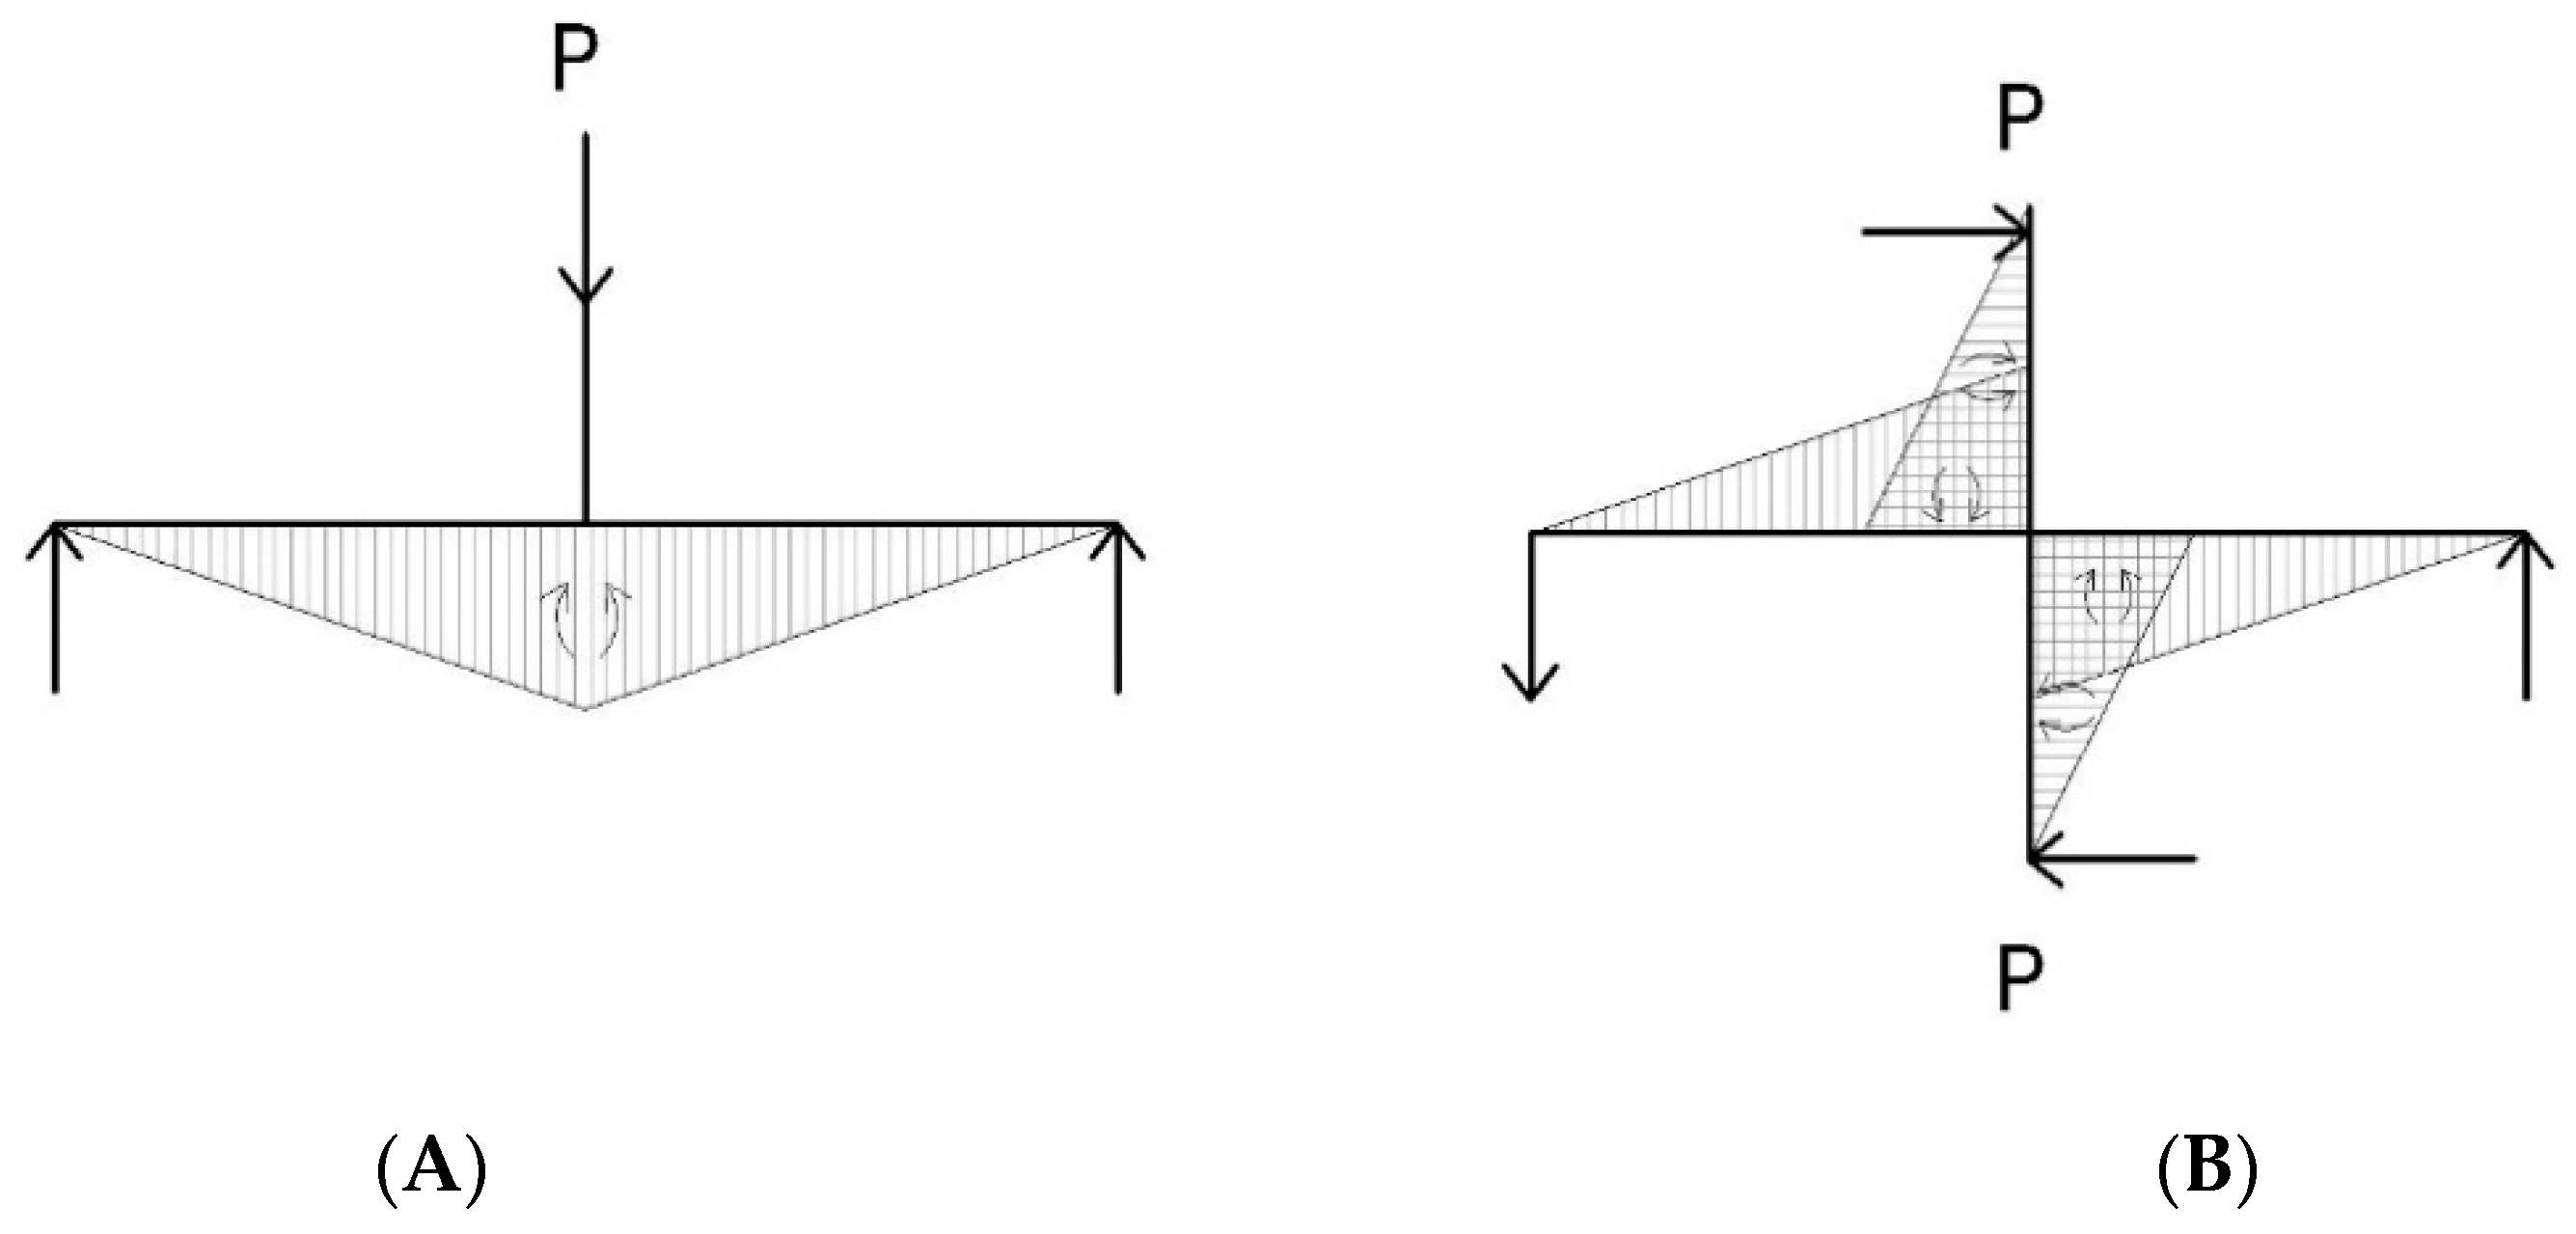
2. Methodology
- λ: elastic coefficient, λ = 1/2 in the elastic phase and λ = 1 in the perfect plastic phase.
- l: length.
- M(x): bending moment.
- χ(x): curvature.
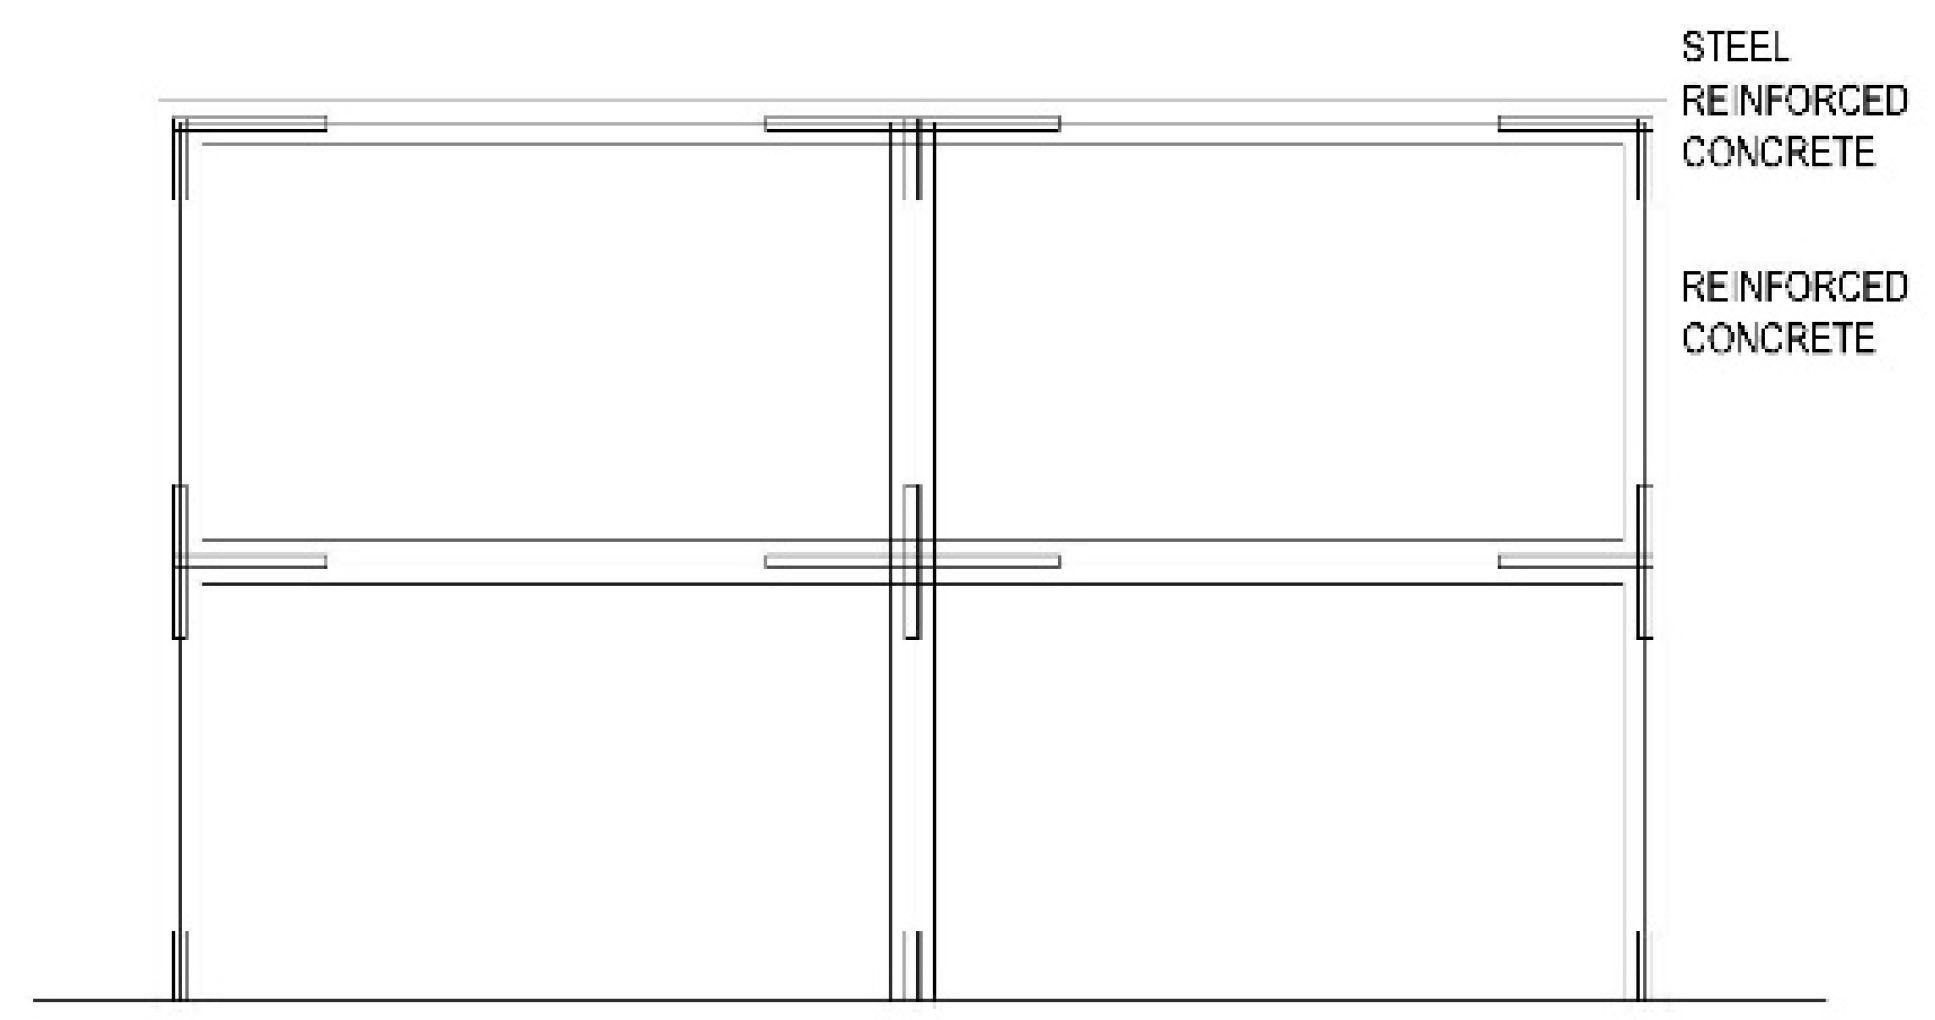
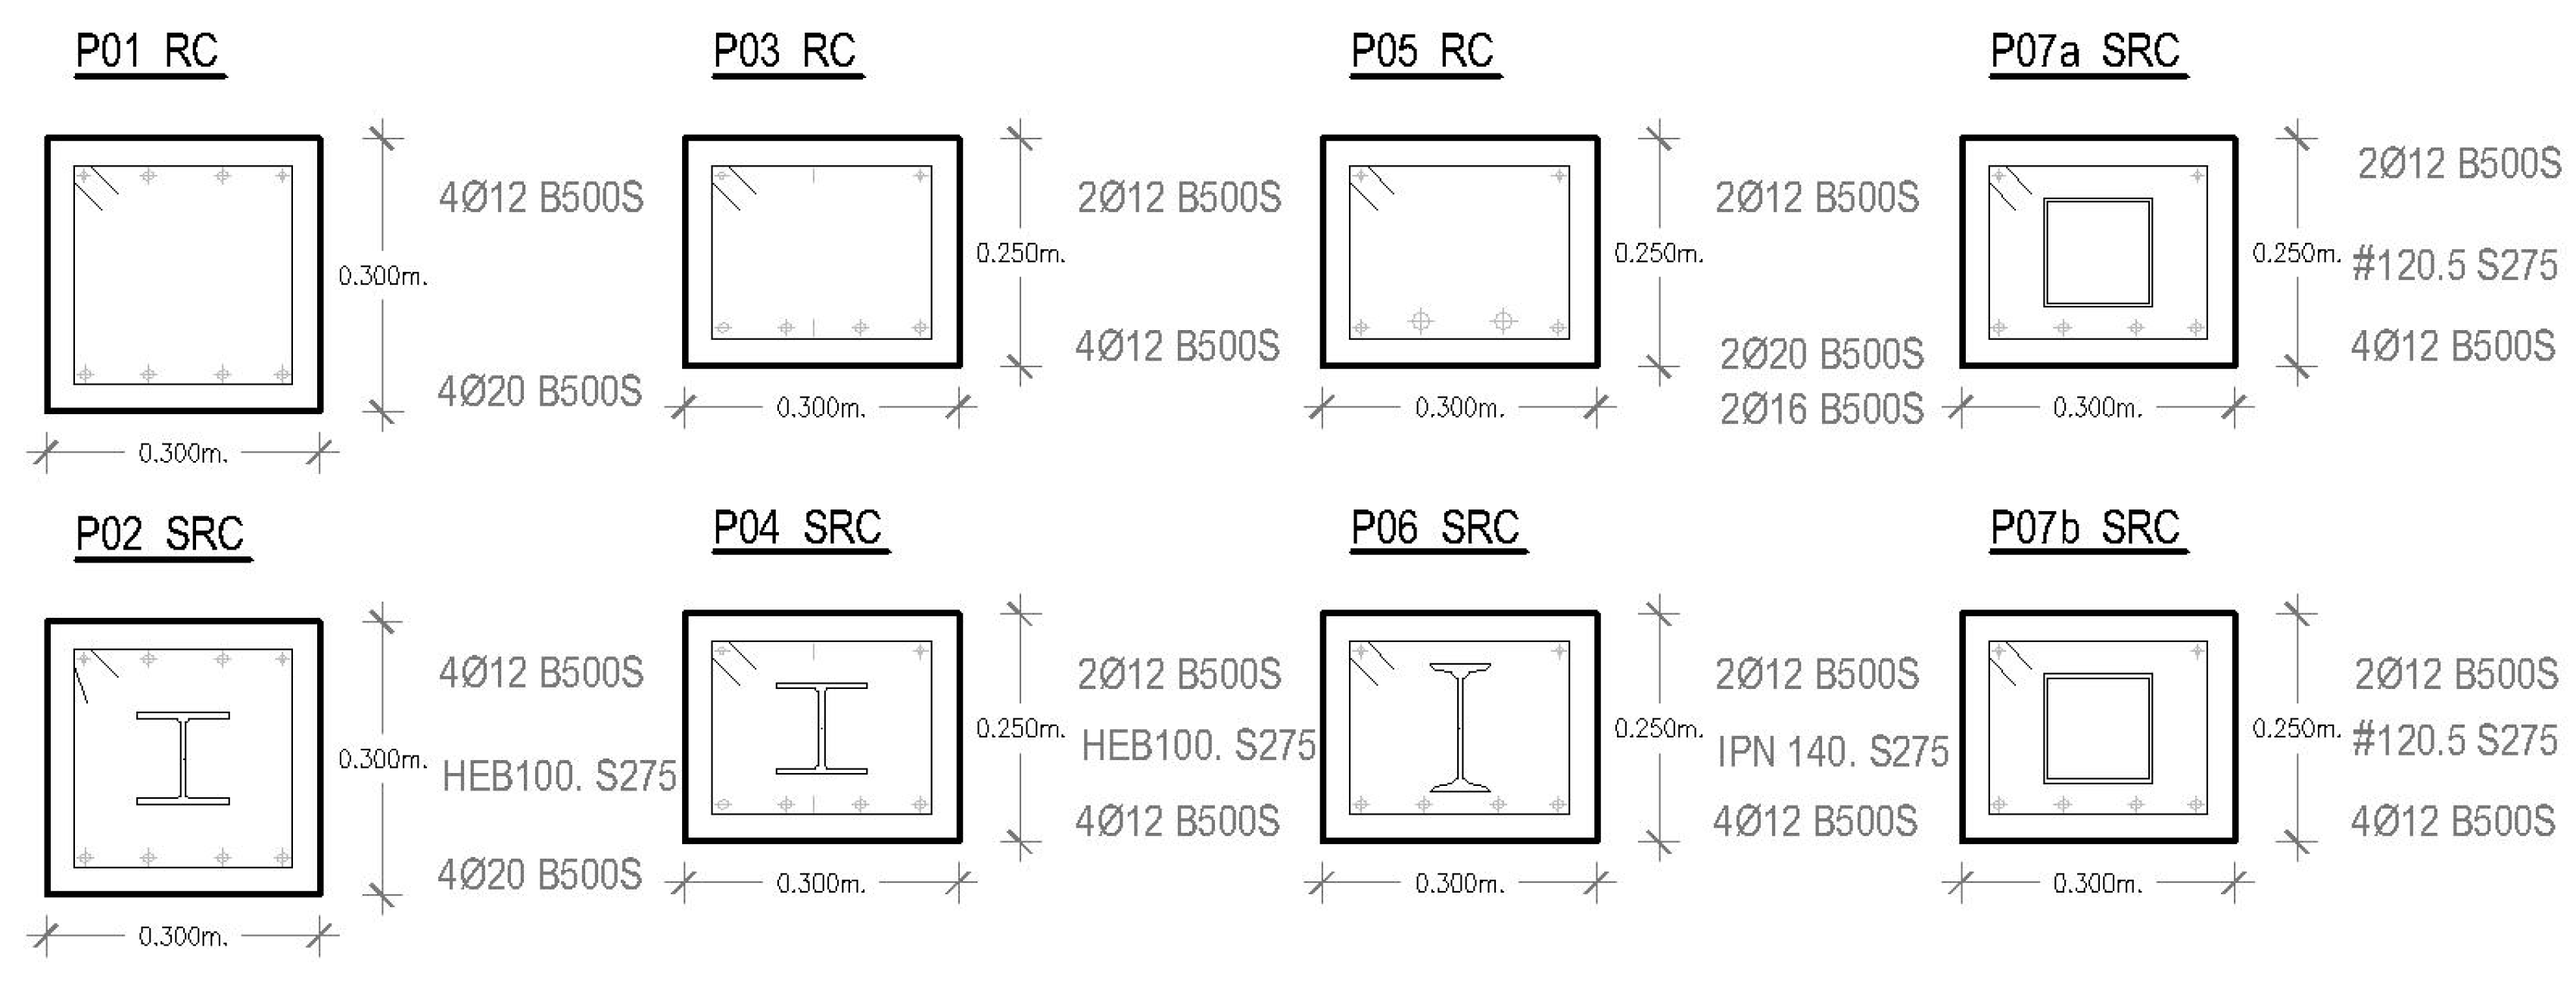
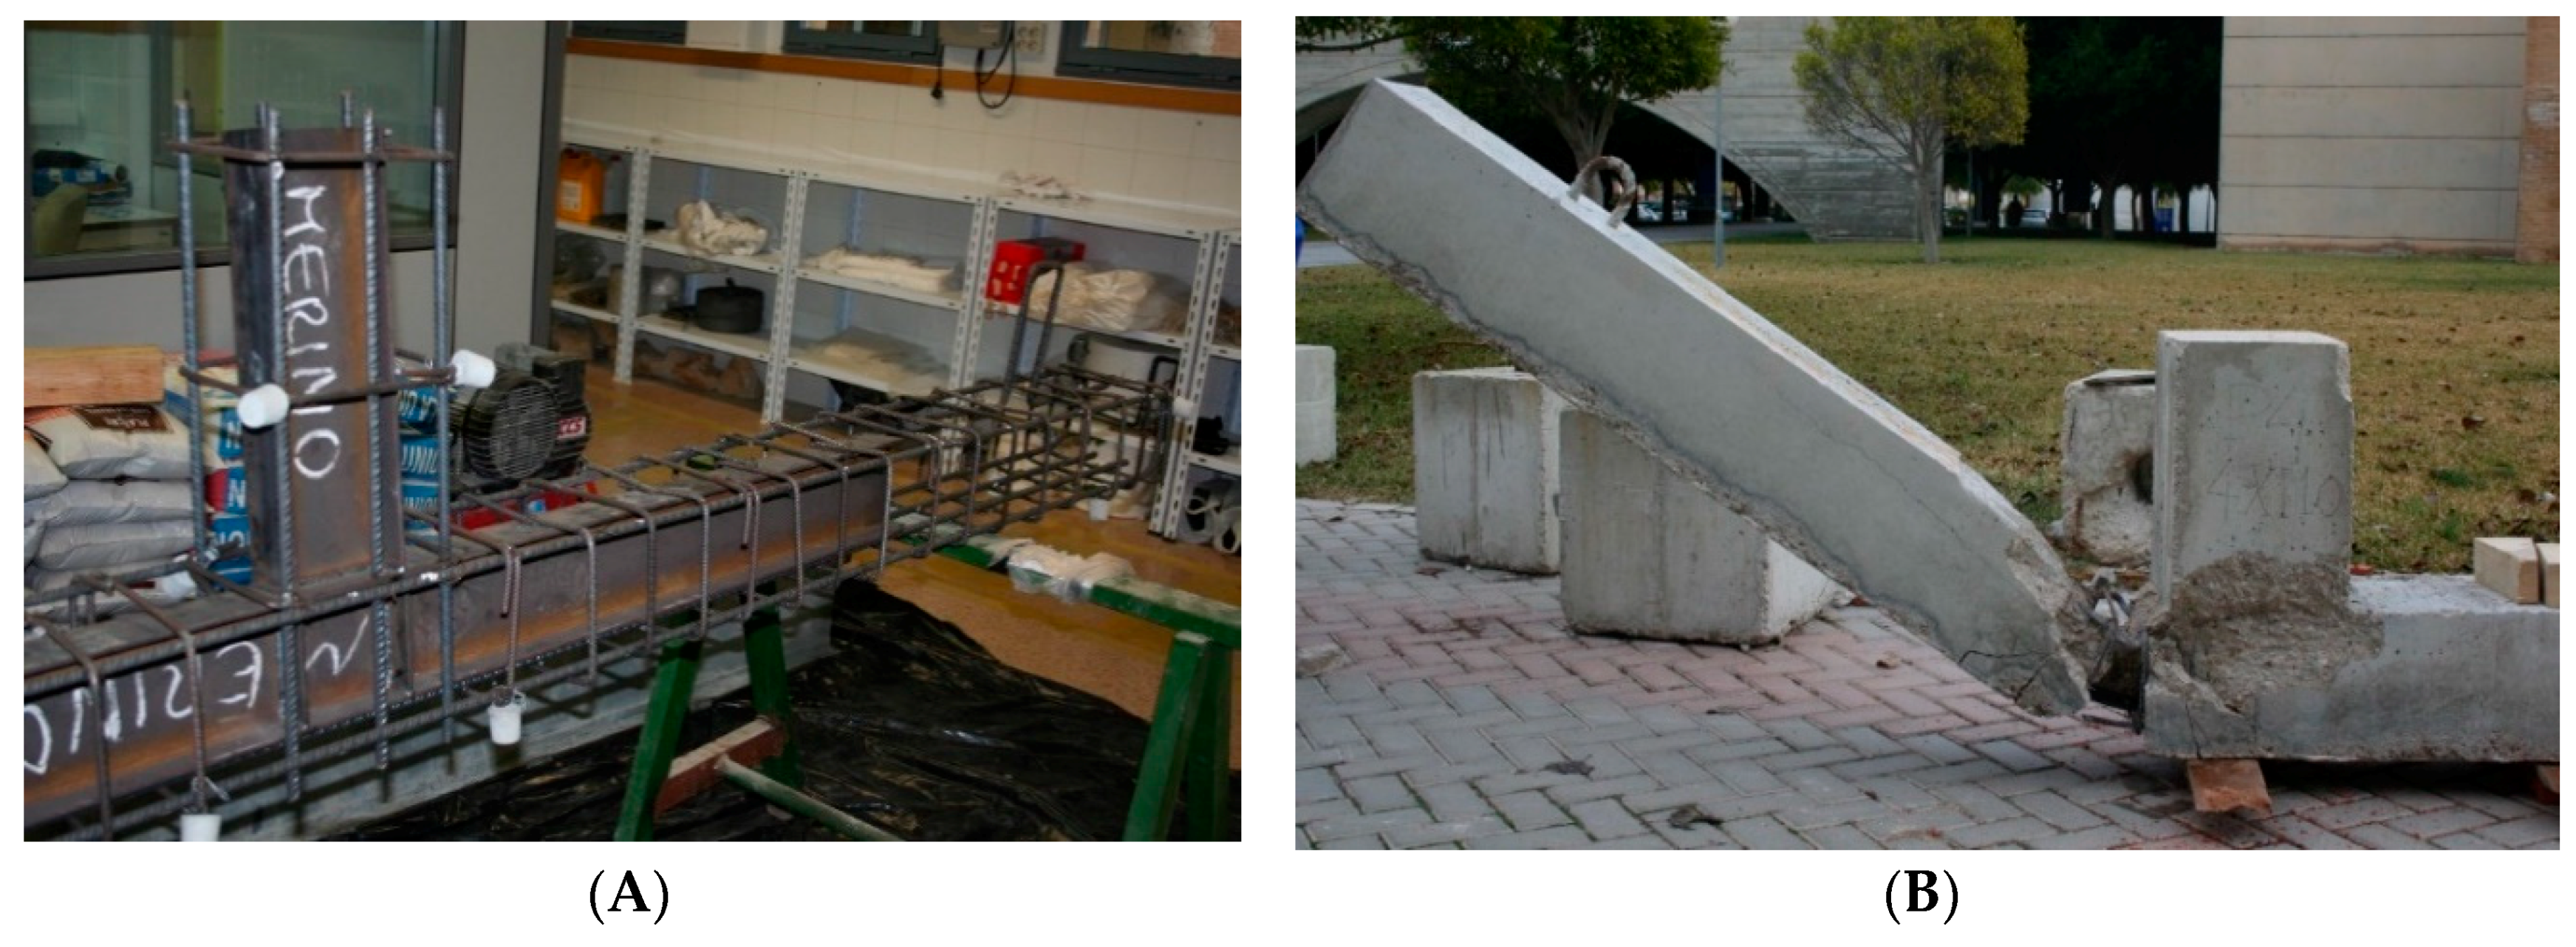
3. Experimental Program
3.1. General Behavior
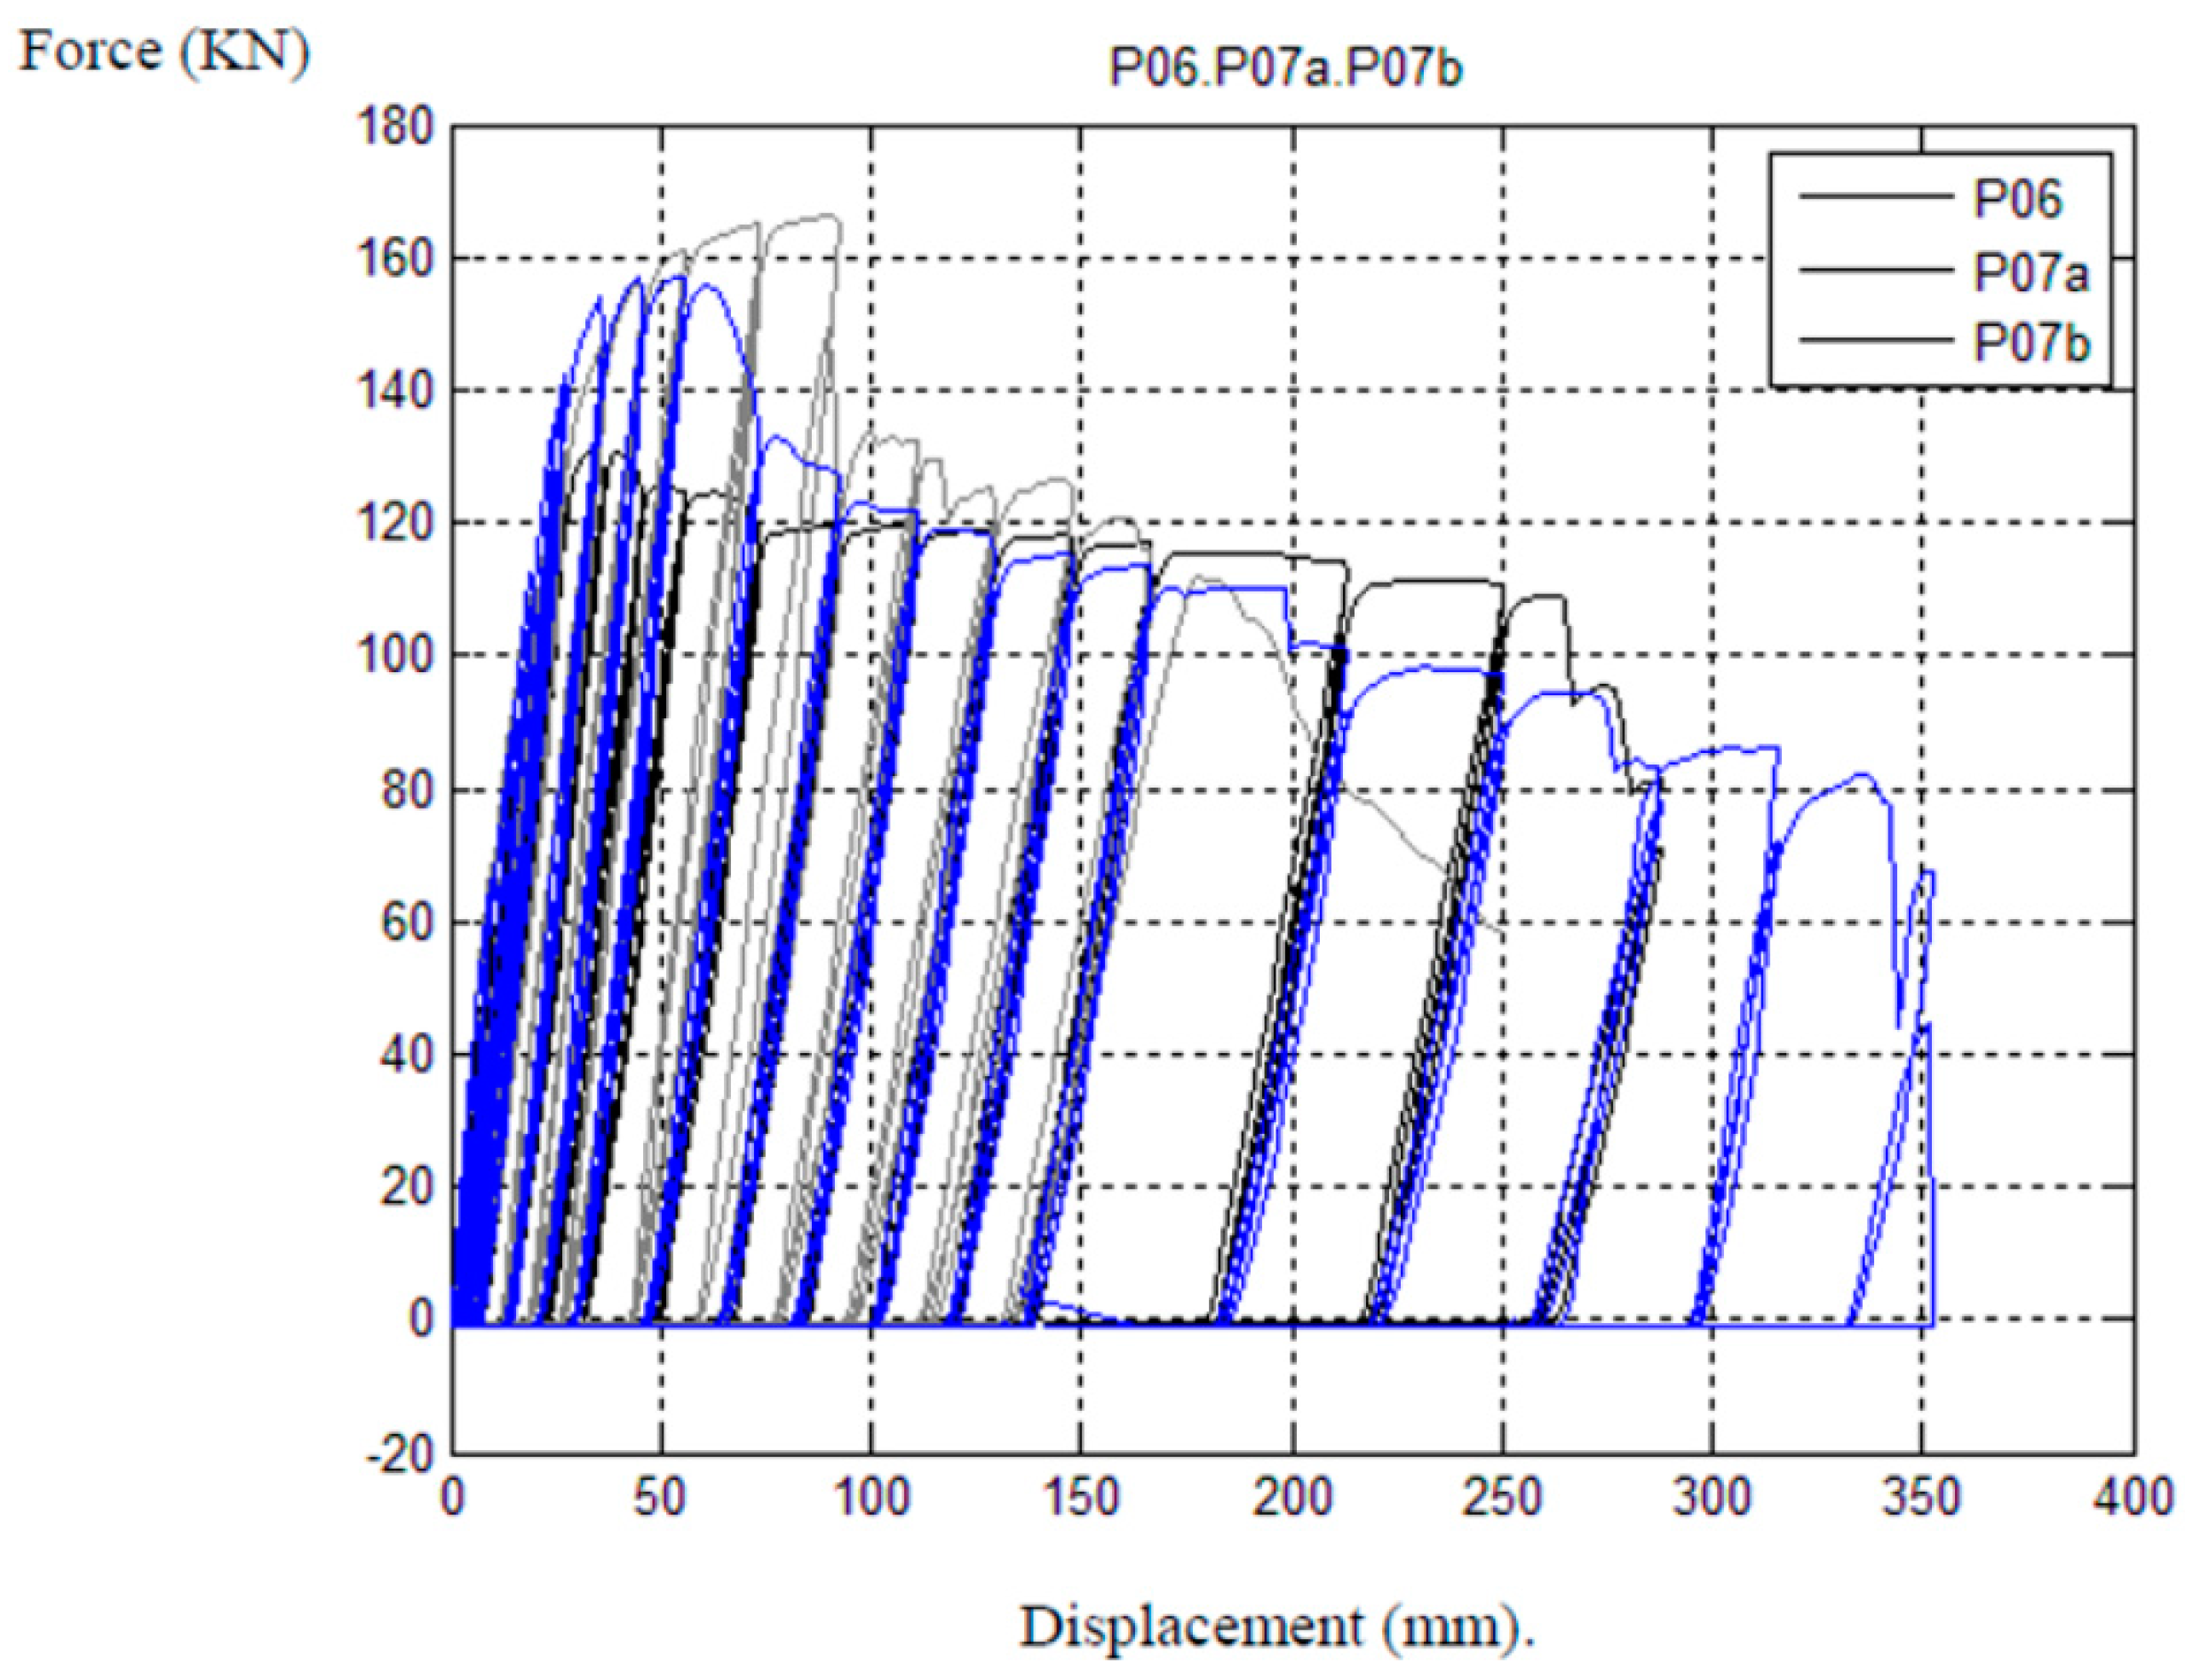
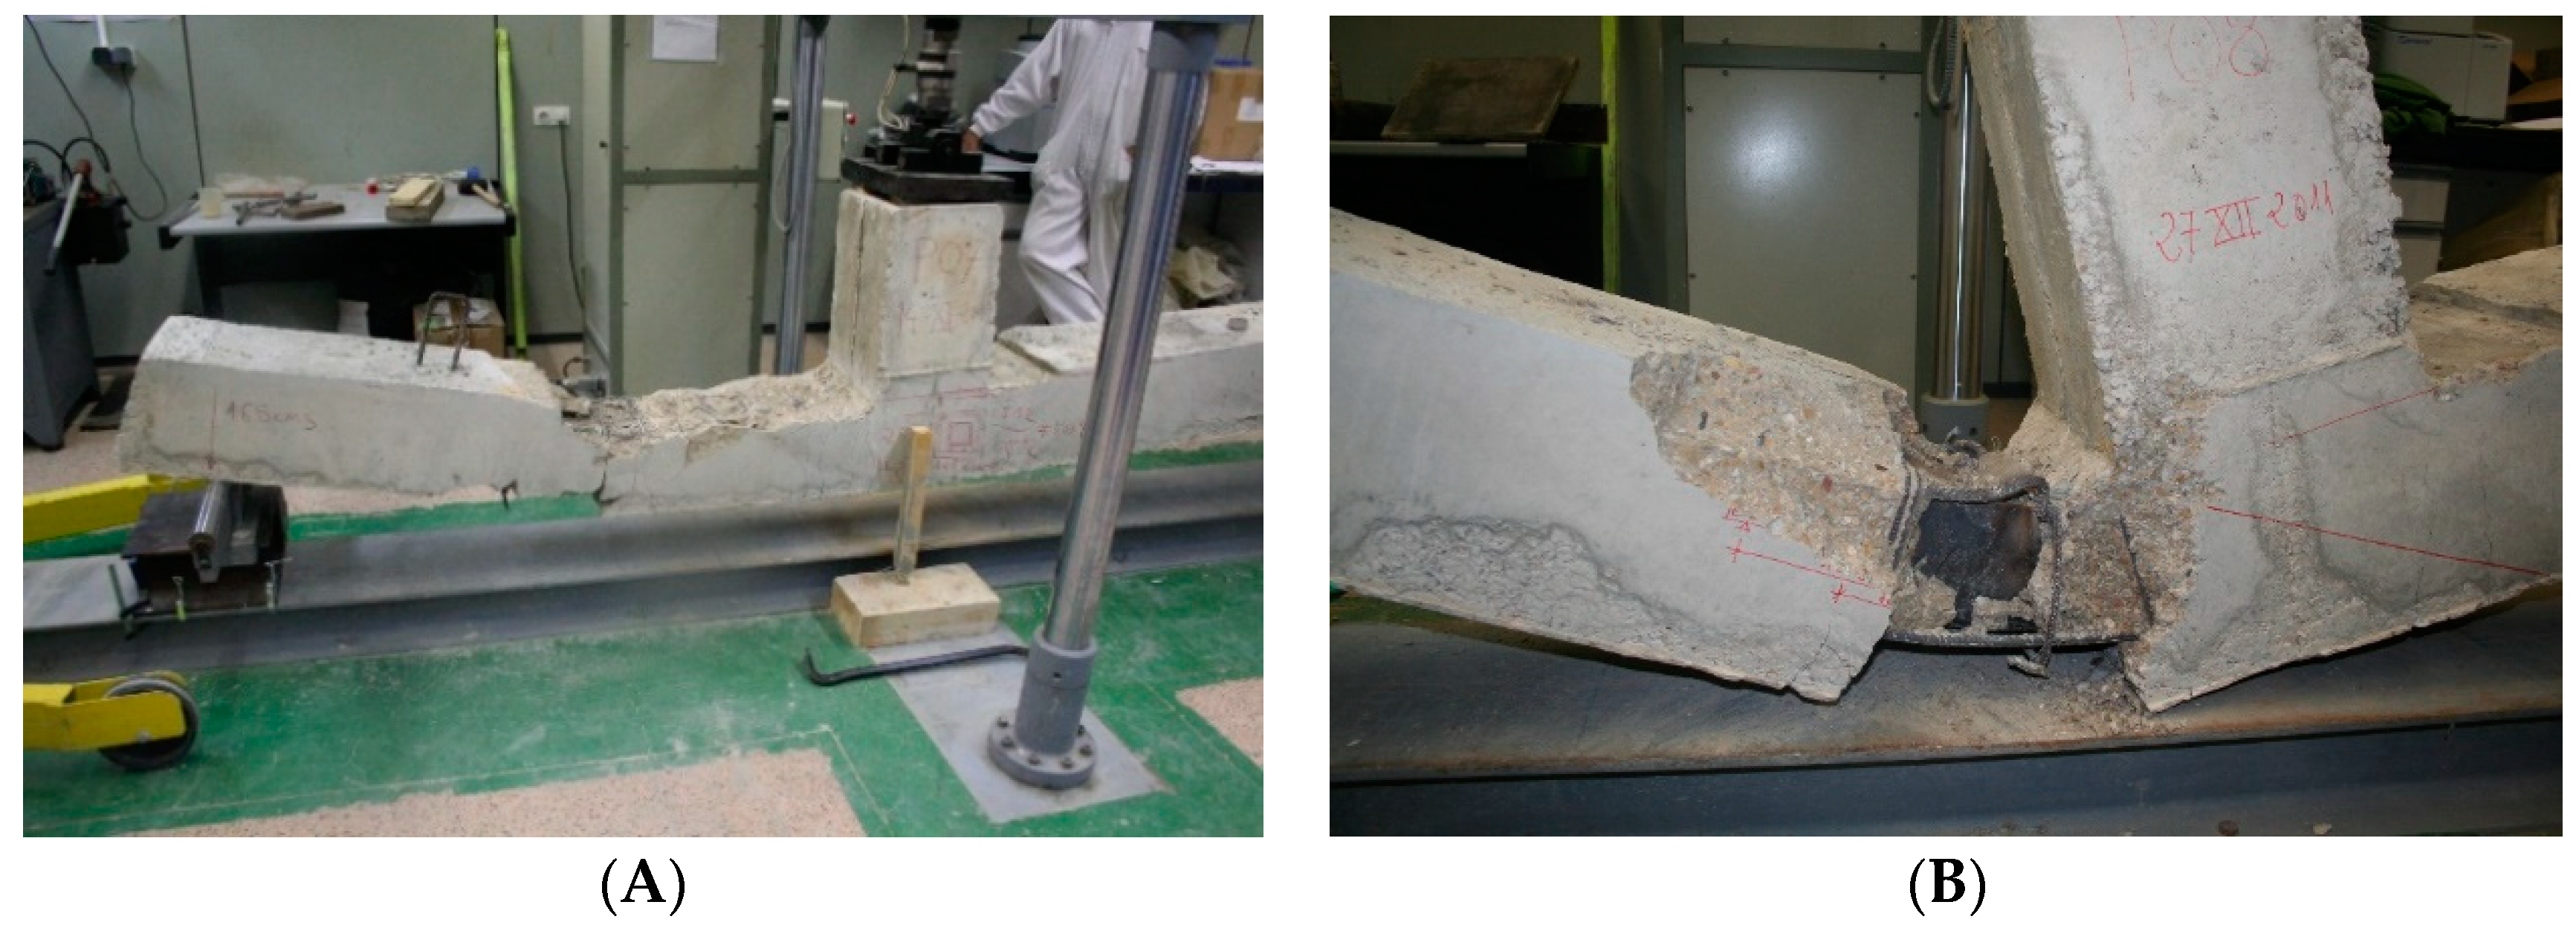
- P07a had a square hollow profile of 140 mm and 5 mm of thickness. This specimen cracked in the transition between the hollow profile and the reinforced concrete section. First the hollow profile was filled with concrete and after hardening, the rest of specimen was executed.
- P07b. This specimen was made by testing the previous one and checking that the plastic hinge appears in the transition between the hollow profile and the reinforced concrete section. This transition zone was reinforced with two 20 mm diameter bars on both sides to ensure the crack near to the joint.
3.2. Column Compression Strength Prediction of SRC Joints.
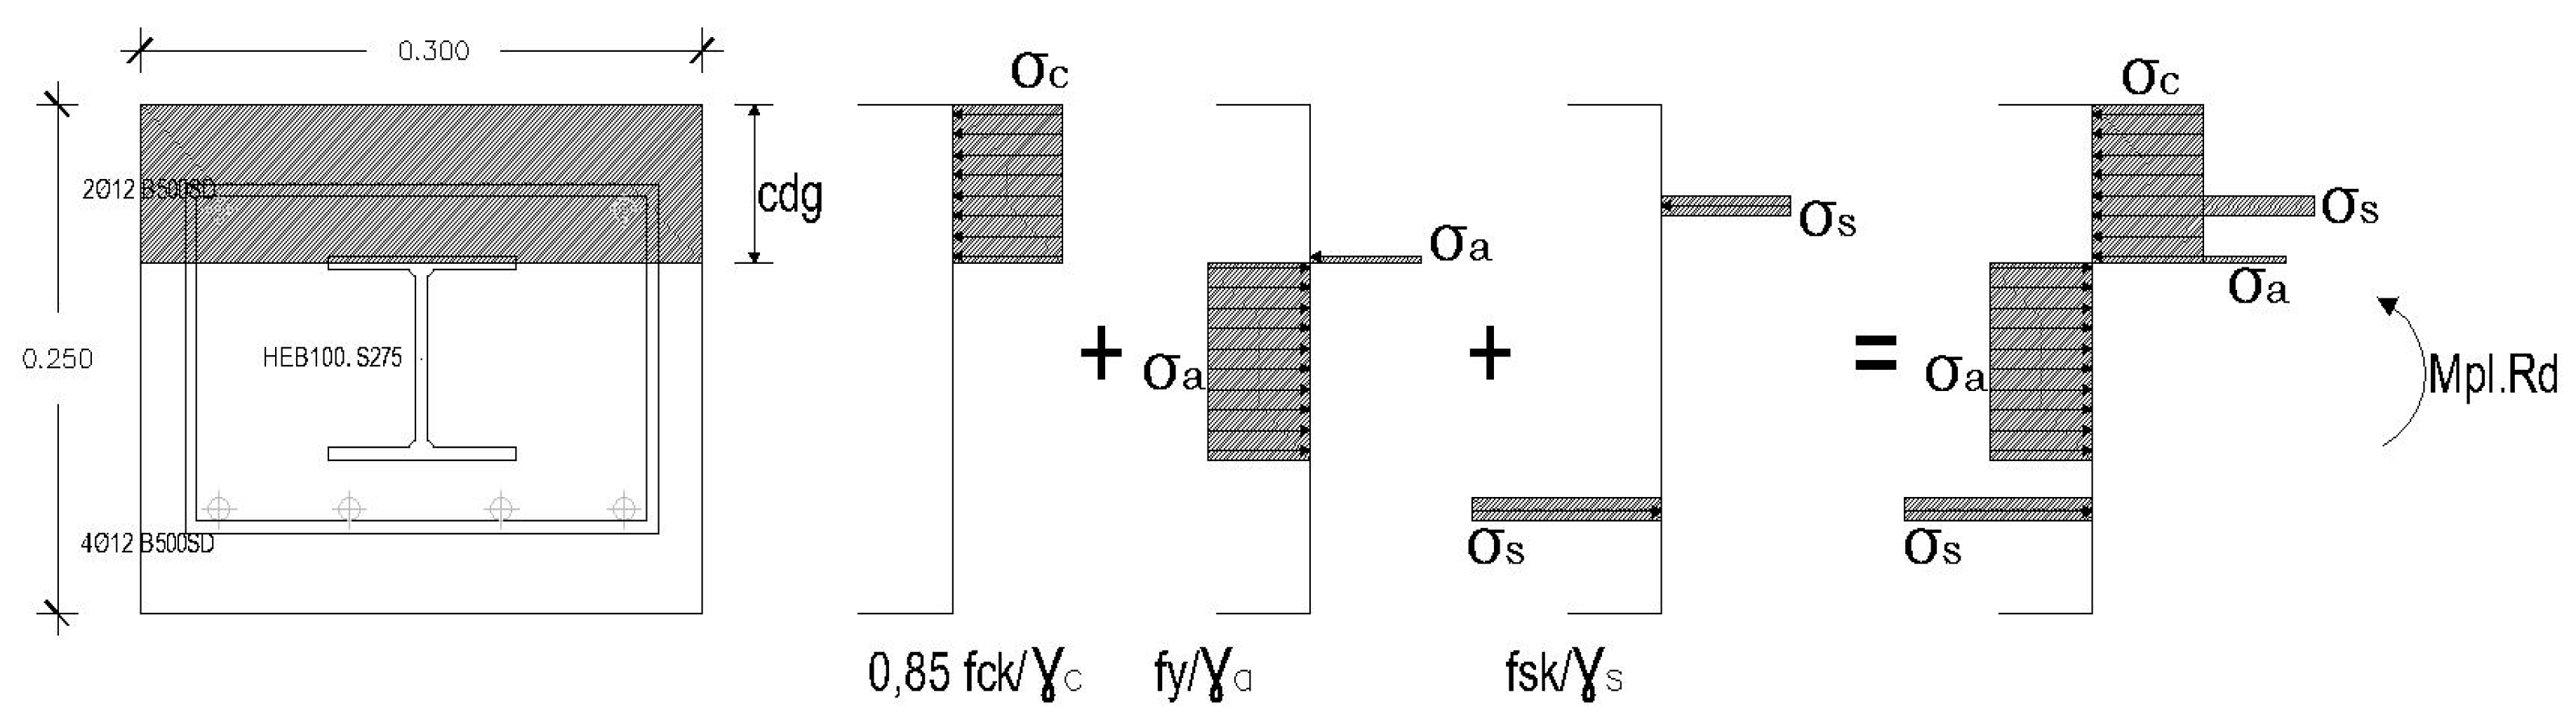
3.3. Bending Moment Strength Prediction of SRC Joints.
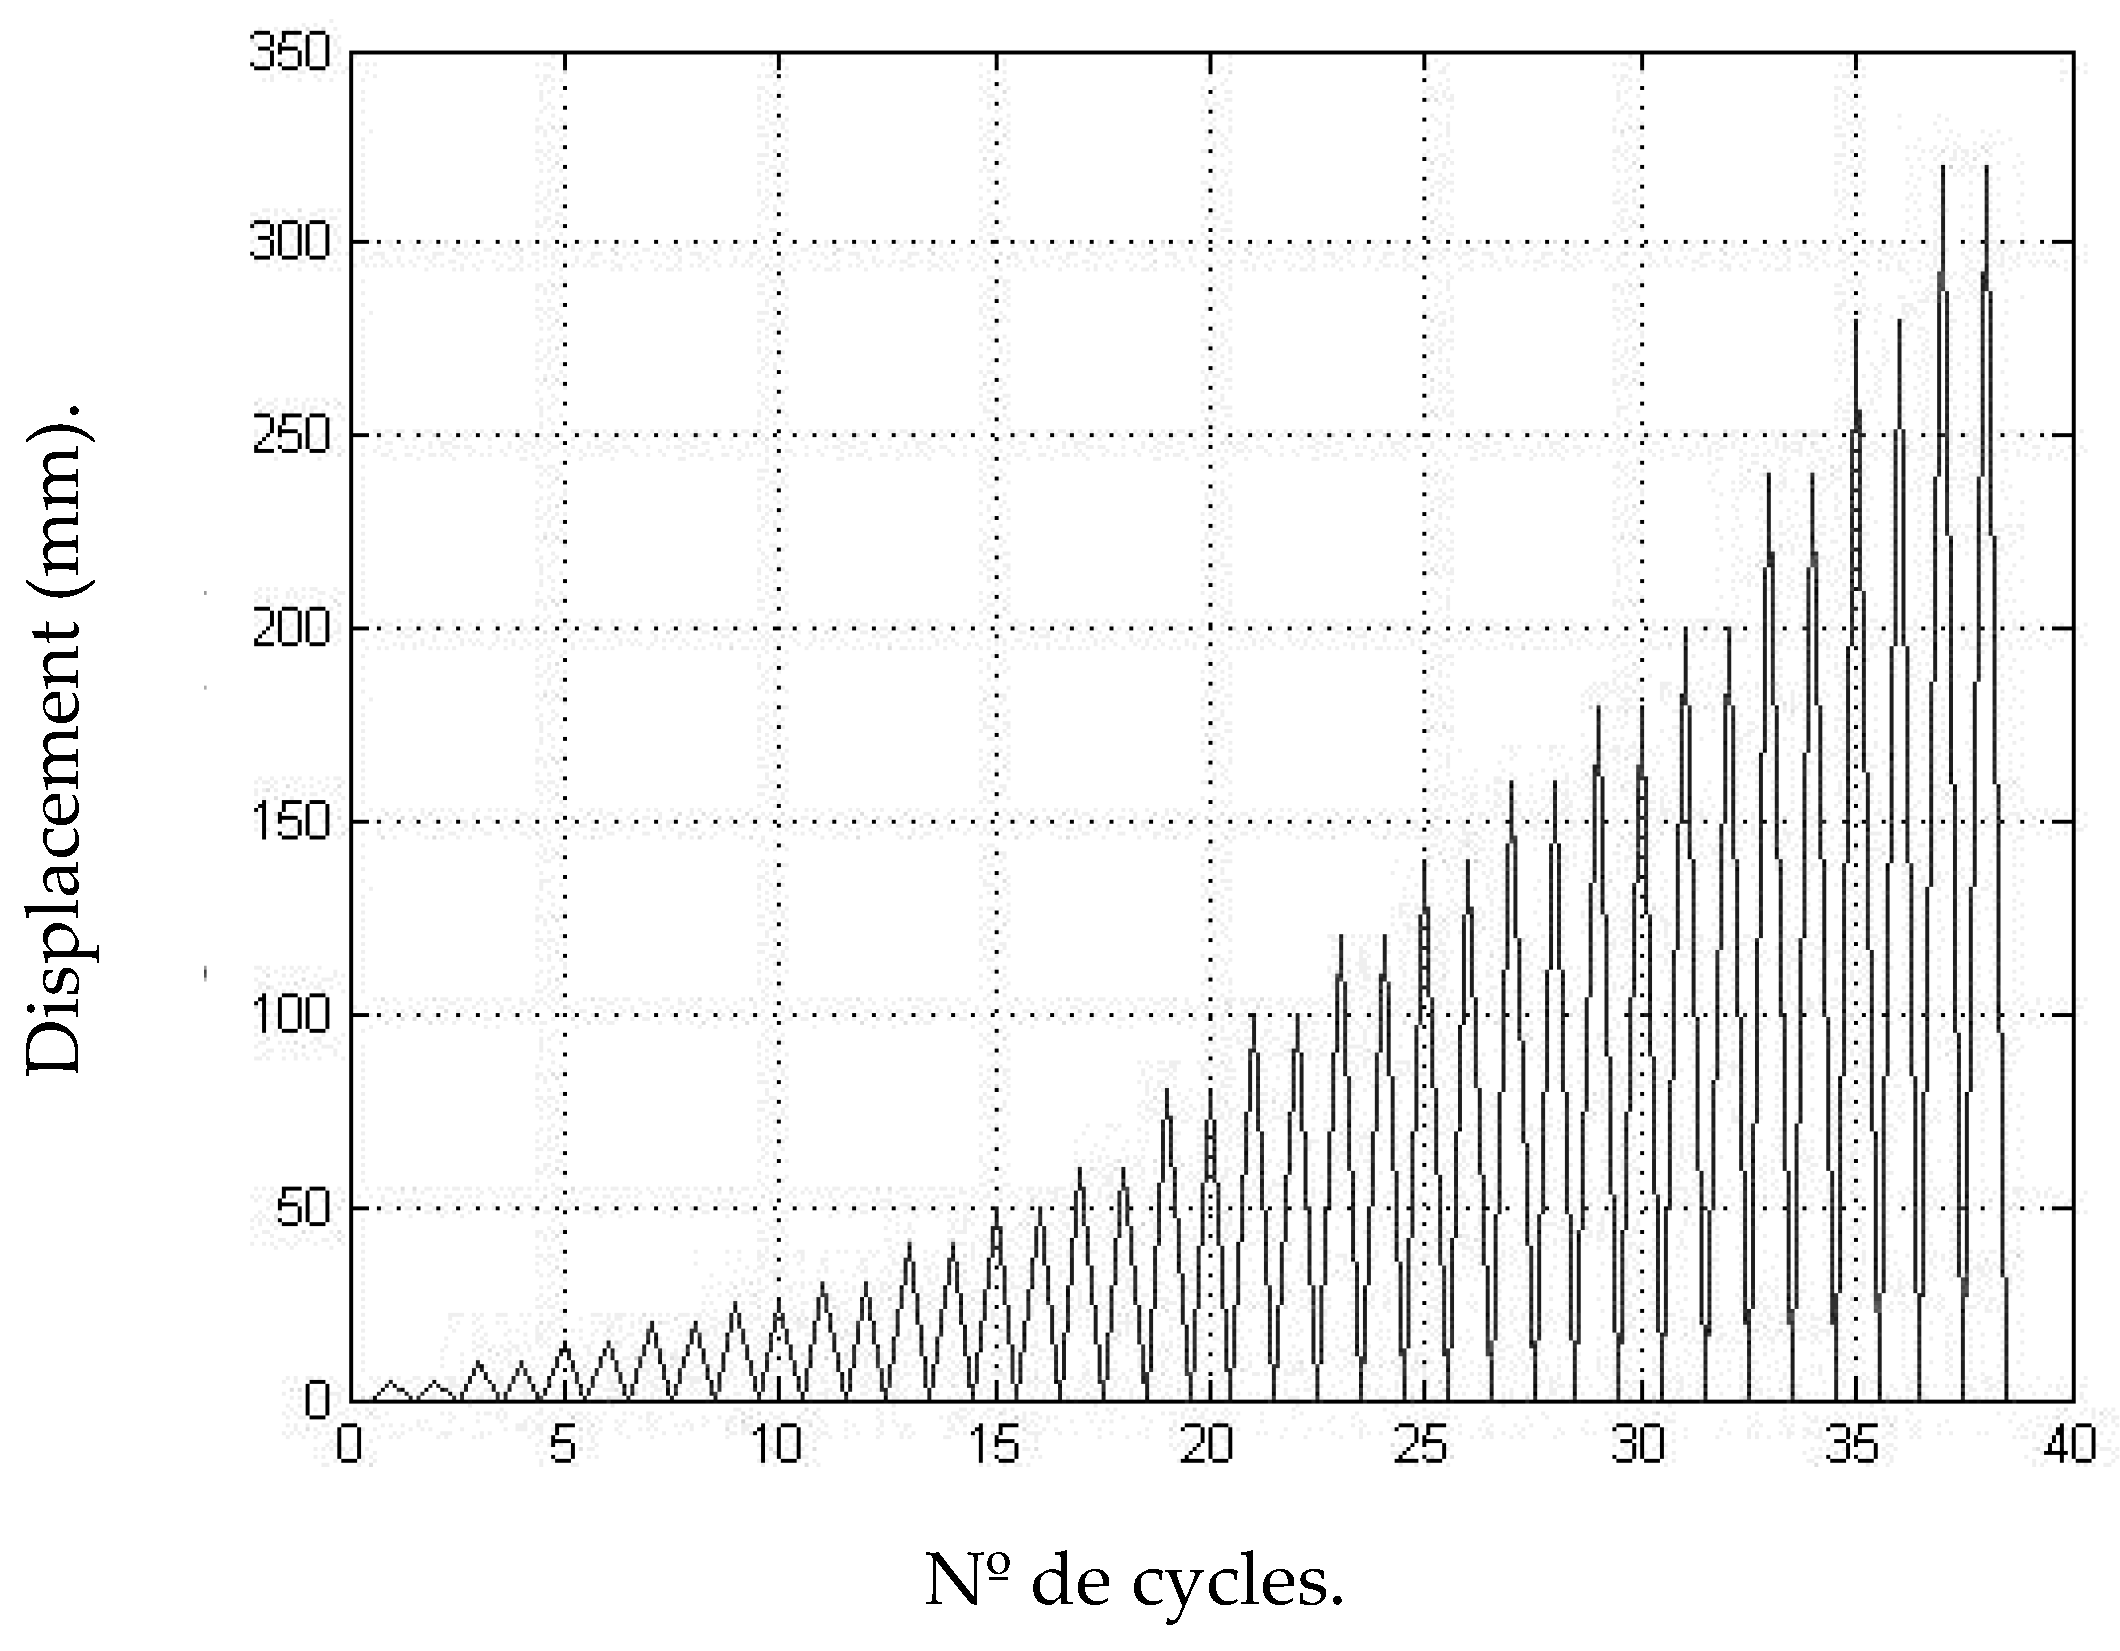
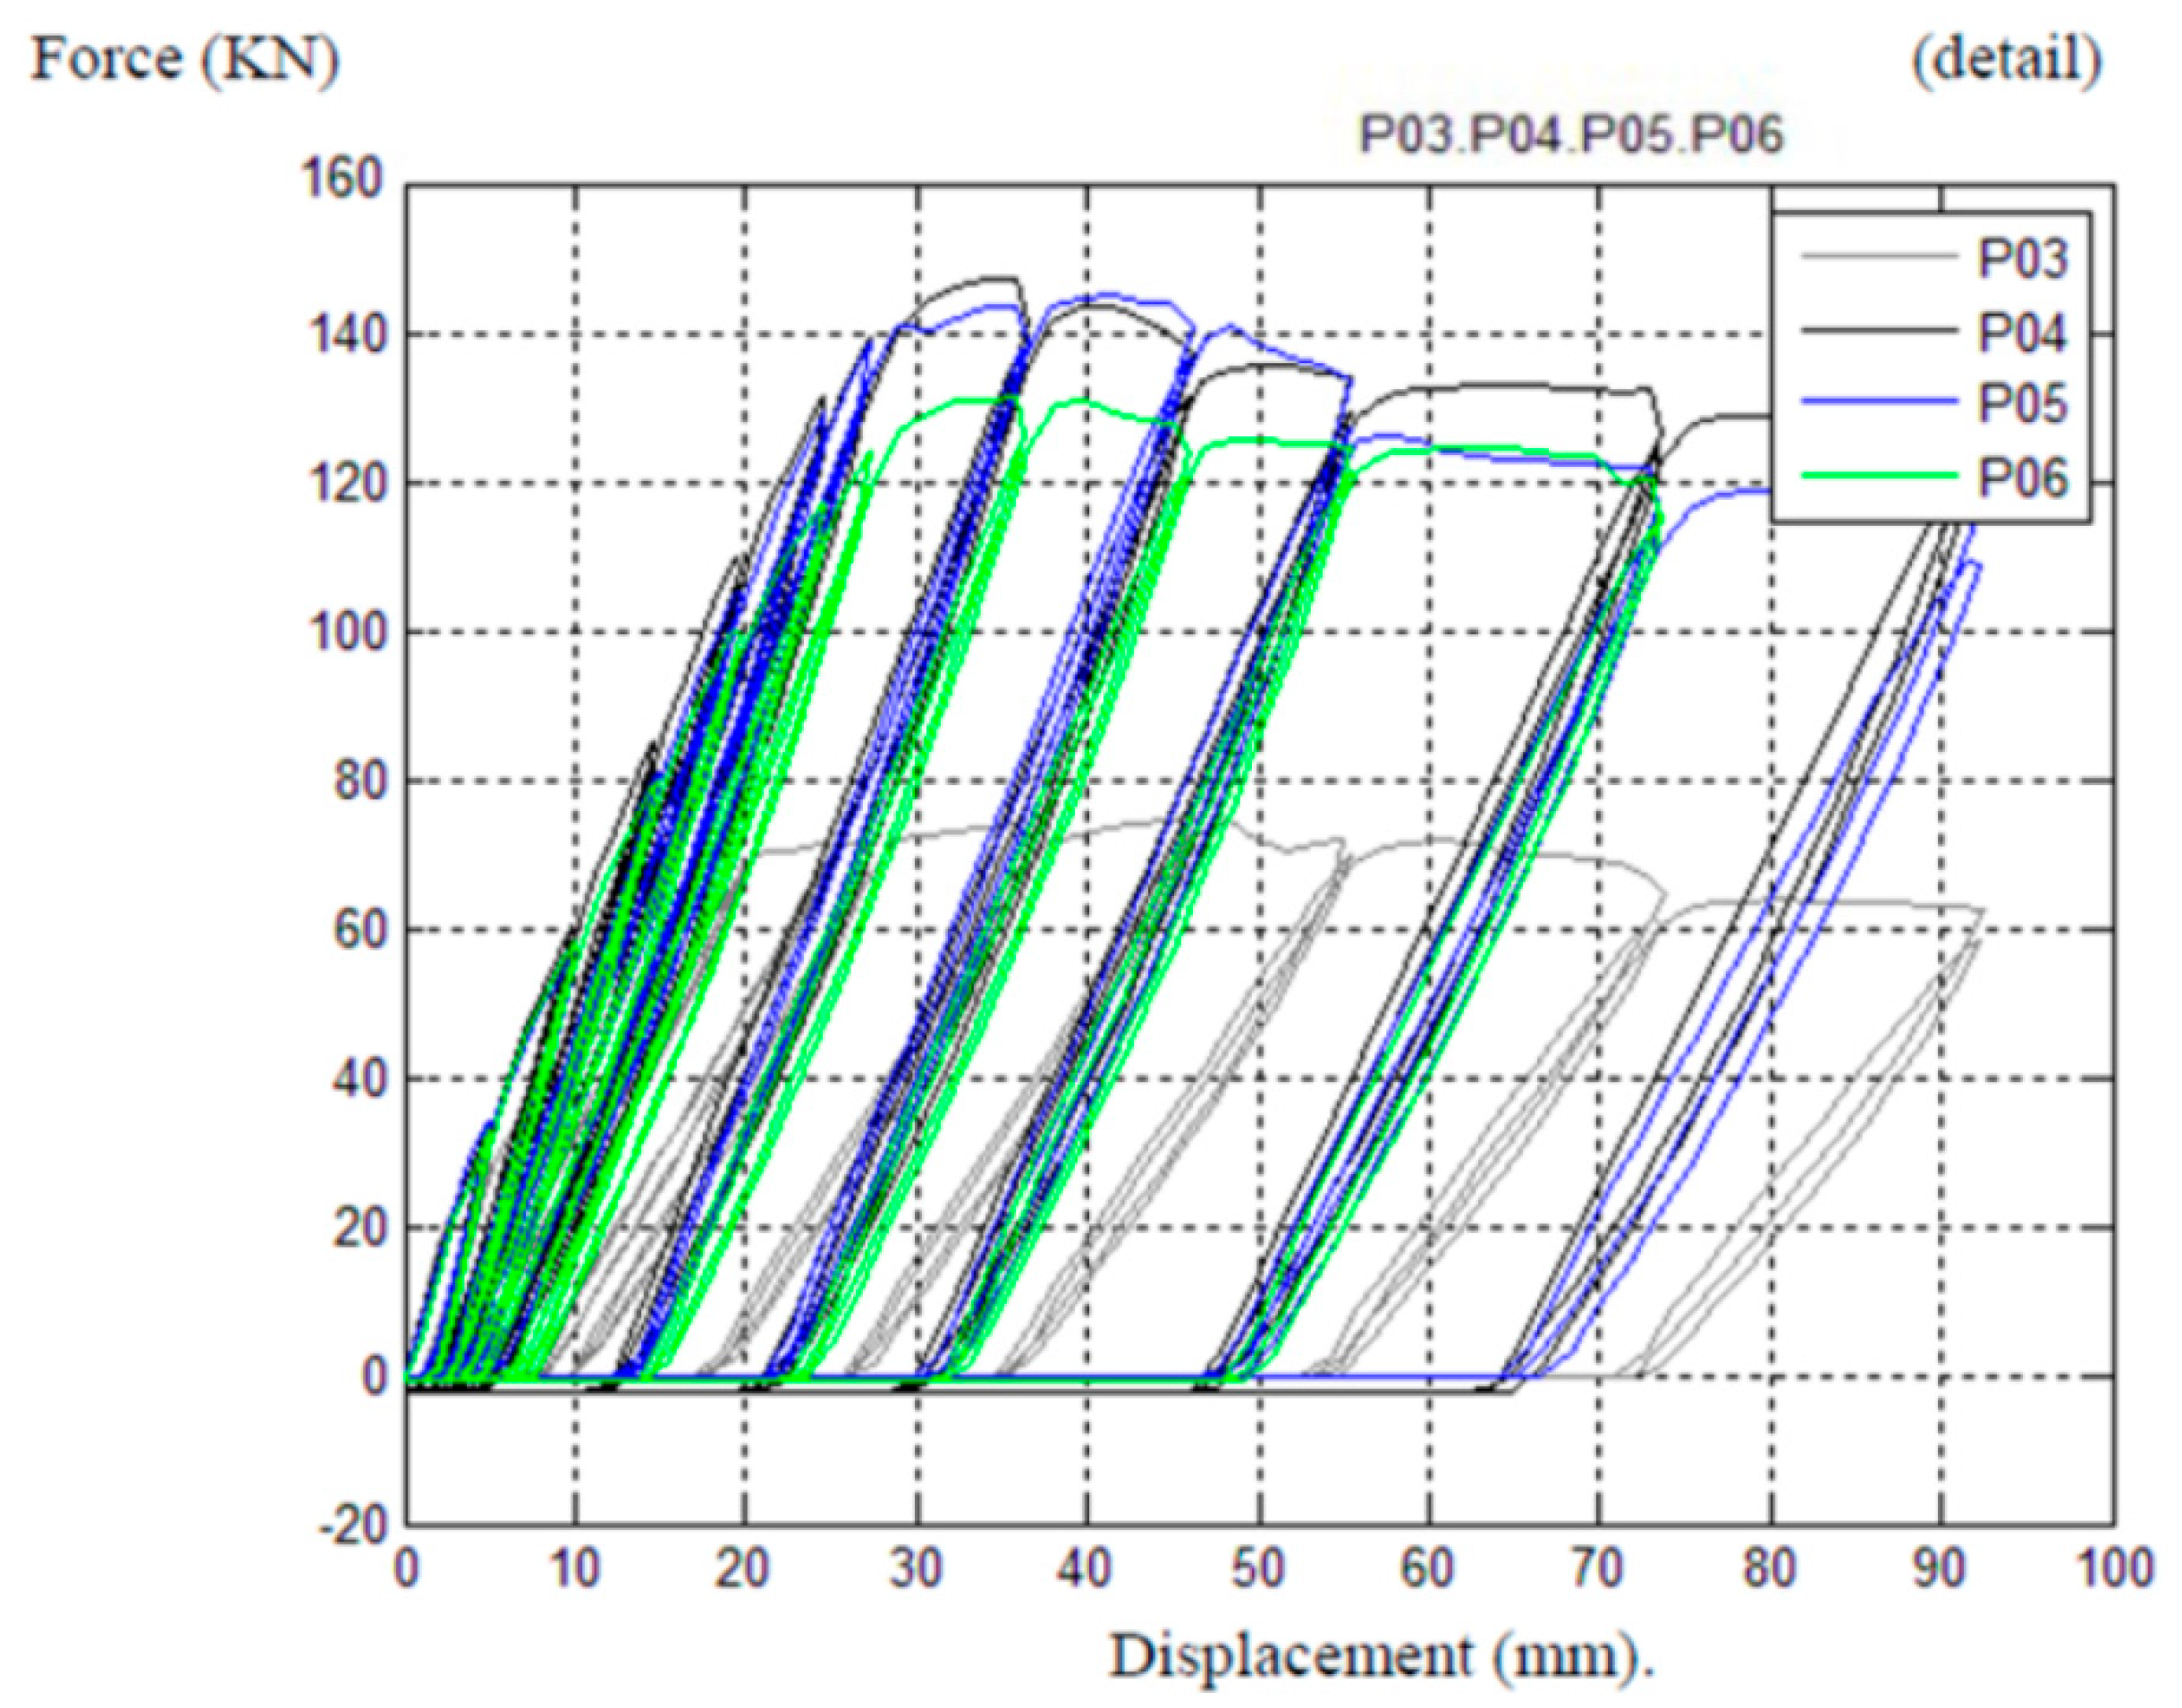
4. Experimental Results
5. Conclusions
- -
- The results of using the conventional test frame with a loading–unloading cycle are comparable to those conducted with more complex frames in which loads have been applied with the opposite direction.
- -
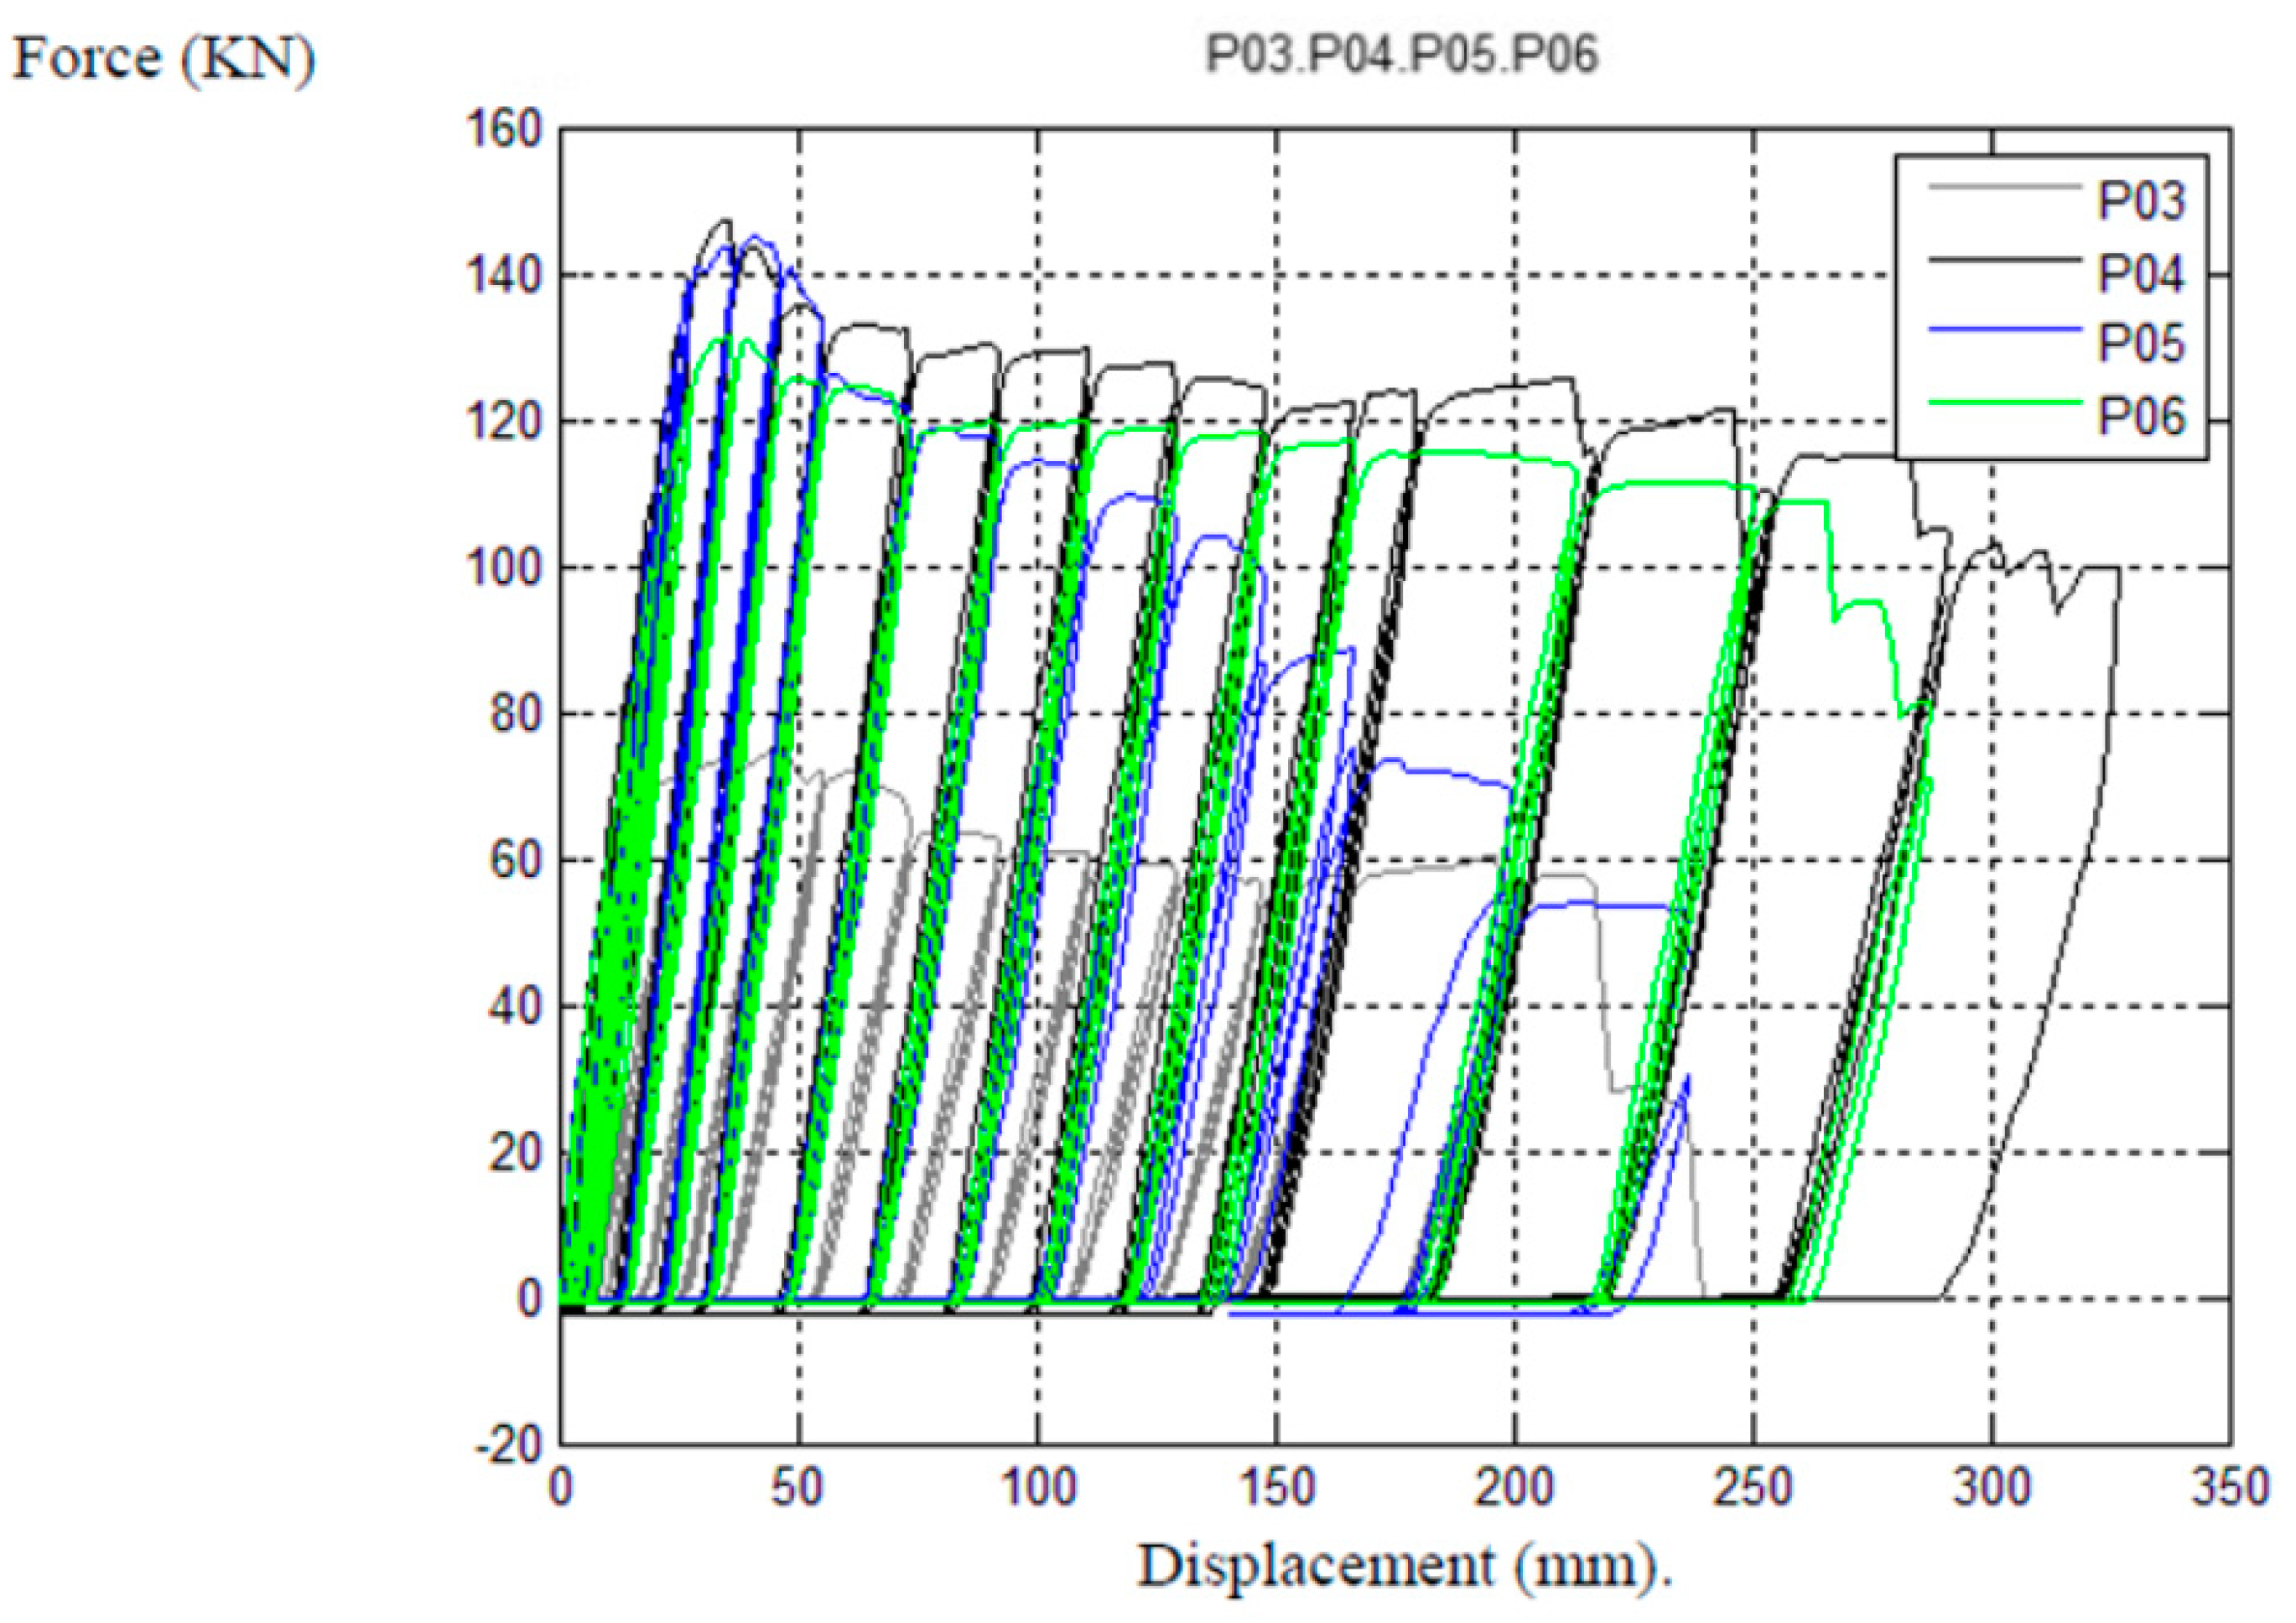
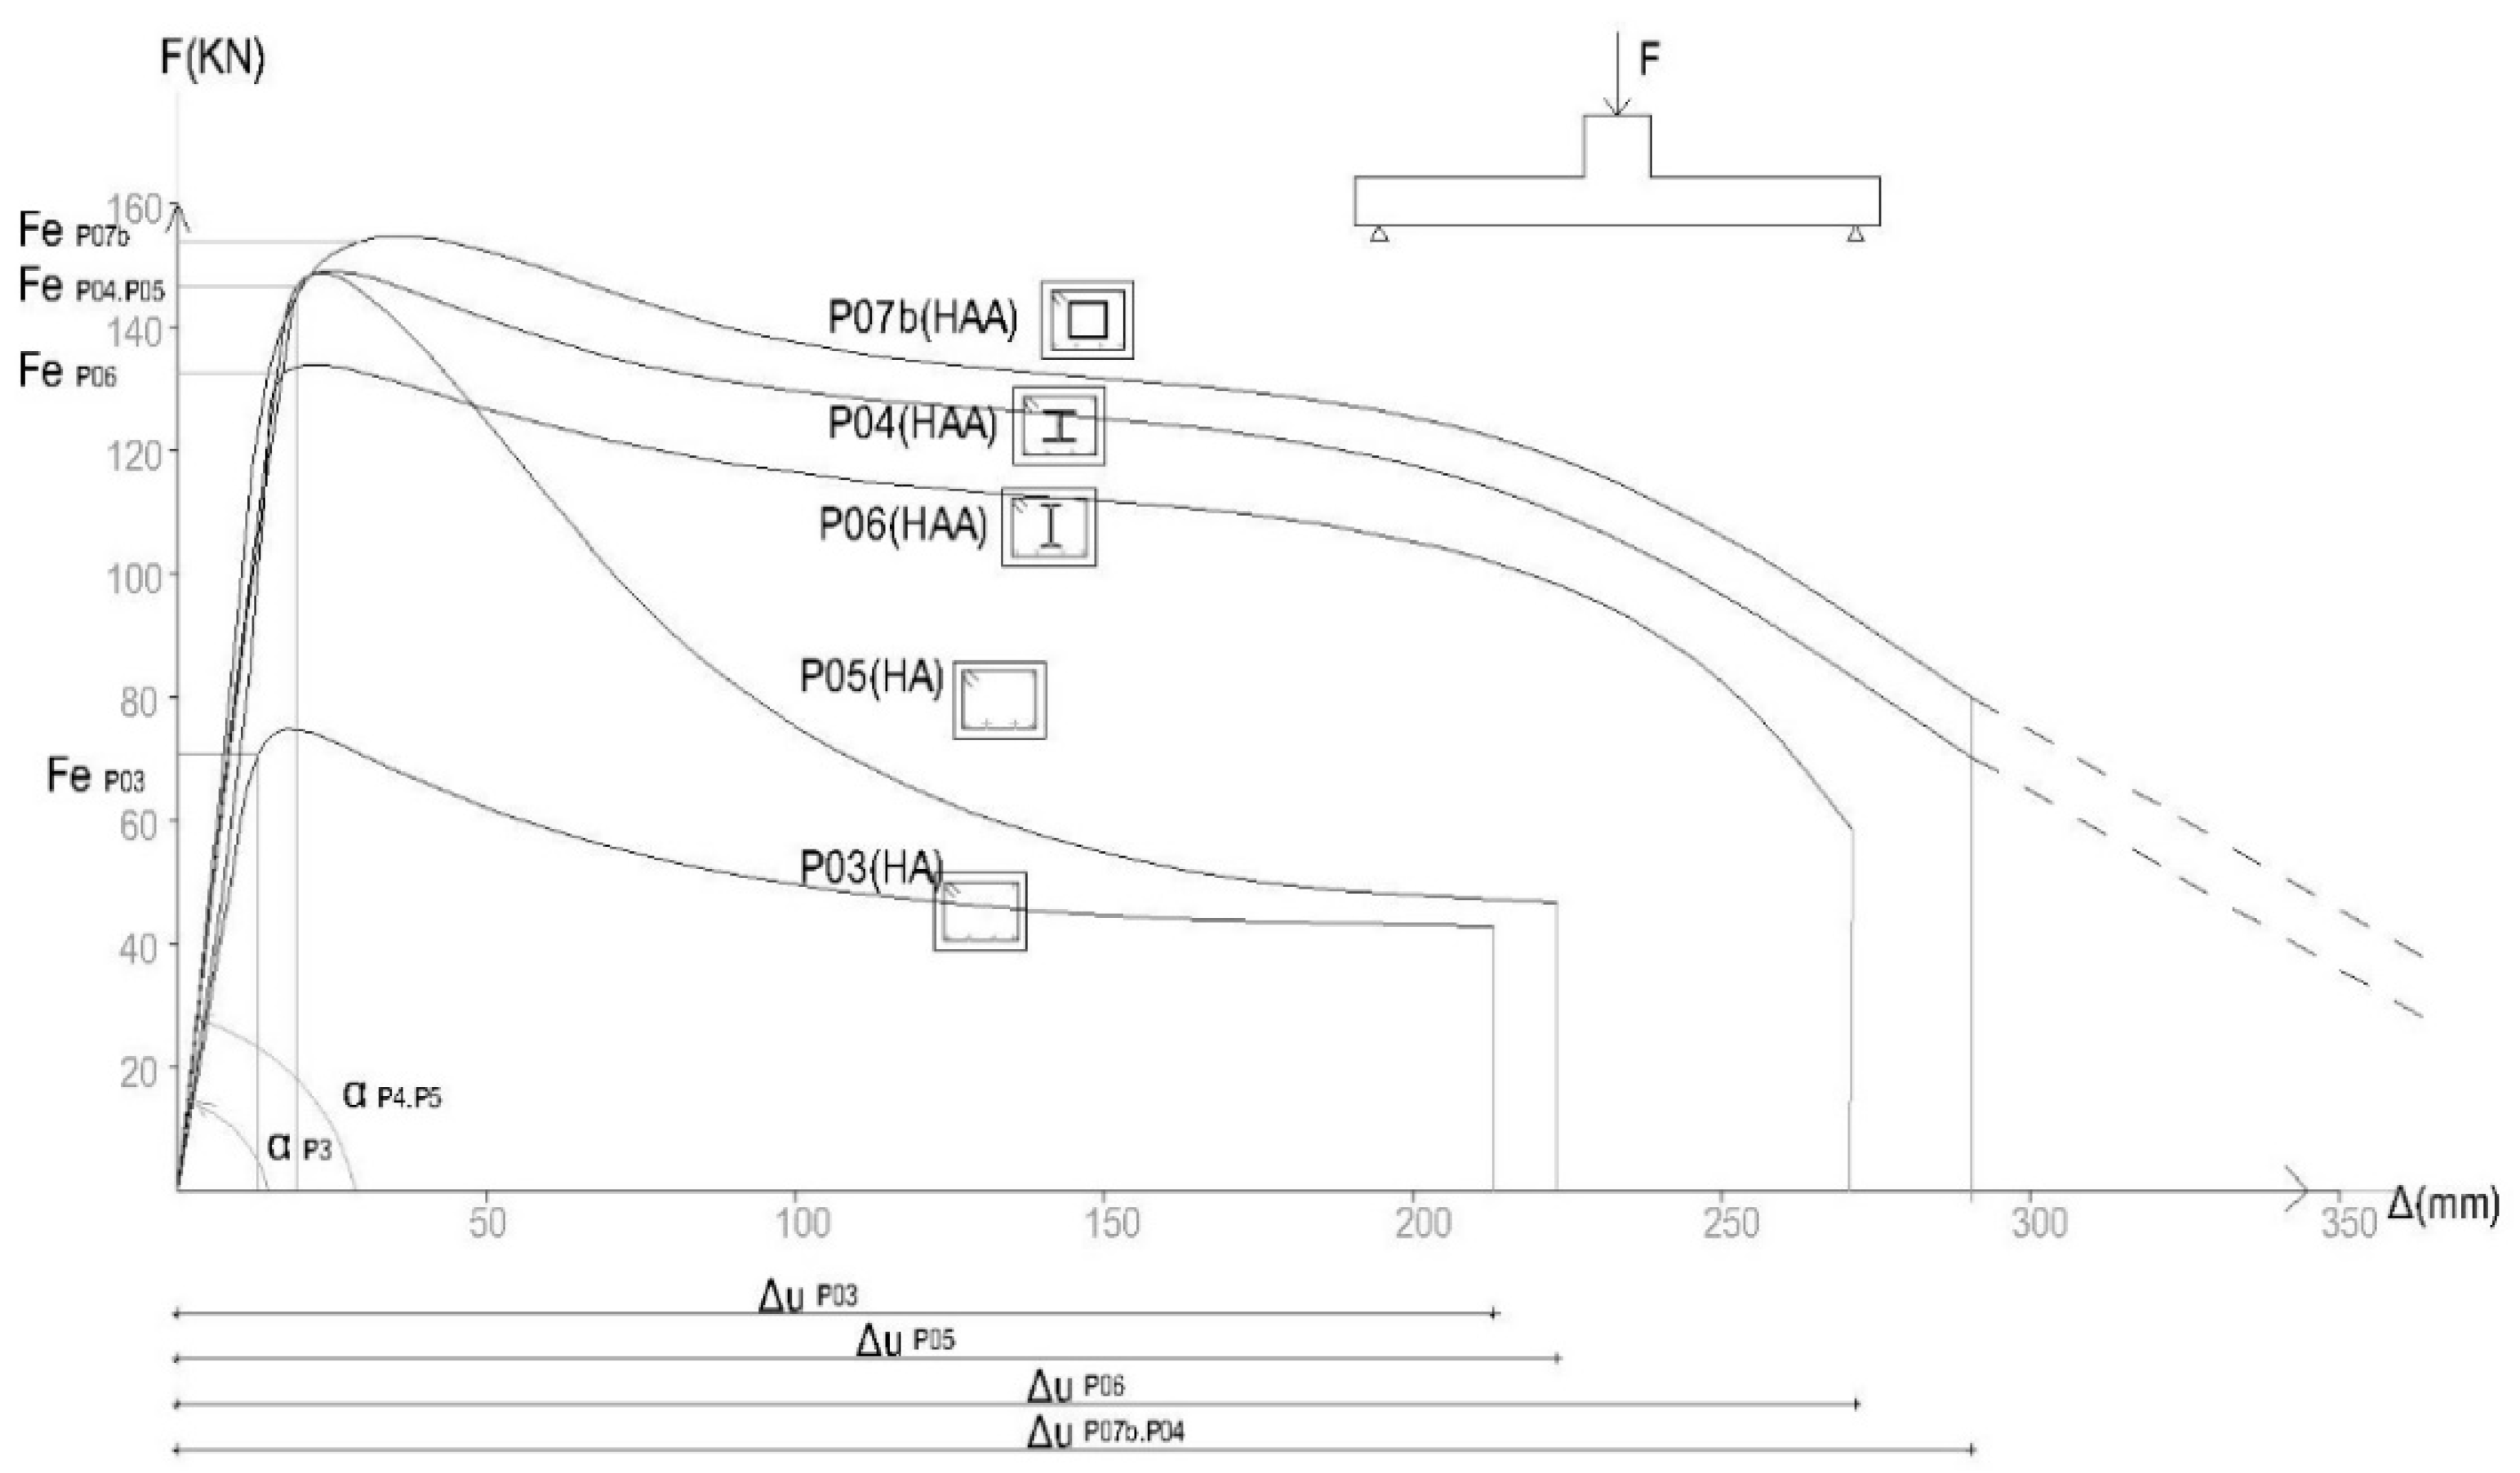
- The specimens of SRC showed improved resistance and ductility compared to specimens of reinforced concrete. The specimens of steel reinforced concrete can reach very high deflections before their collapse.
- -
- For high deformations, a specimen with a square tube cross-section has considerably less resistance compared to the HEB cross-section due to the greater flexural efficiency of the steel cross-section. The specimen of steel reinforced concrete with a tubular cross-section with greater thicknesses achieved the most efficient ratio. This would allow better appreciation of the advantage of confined concrete.
- -
- The studied typology with only partial steel cross-section reinforcement is a very interesting solution that can be incorporated to improve reinforced concrete structures’ mechanical behavior.
- -
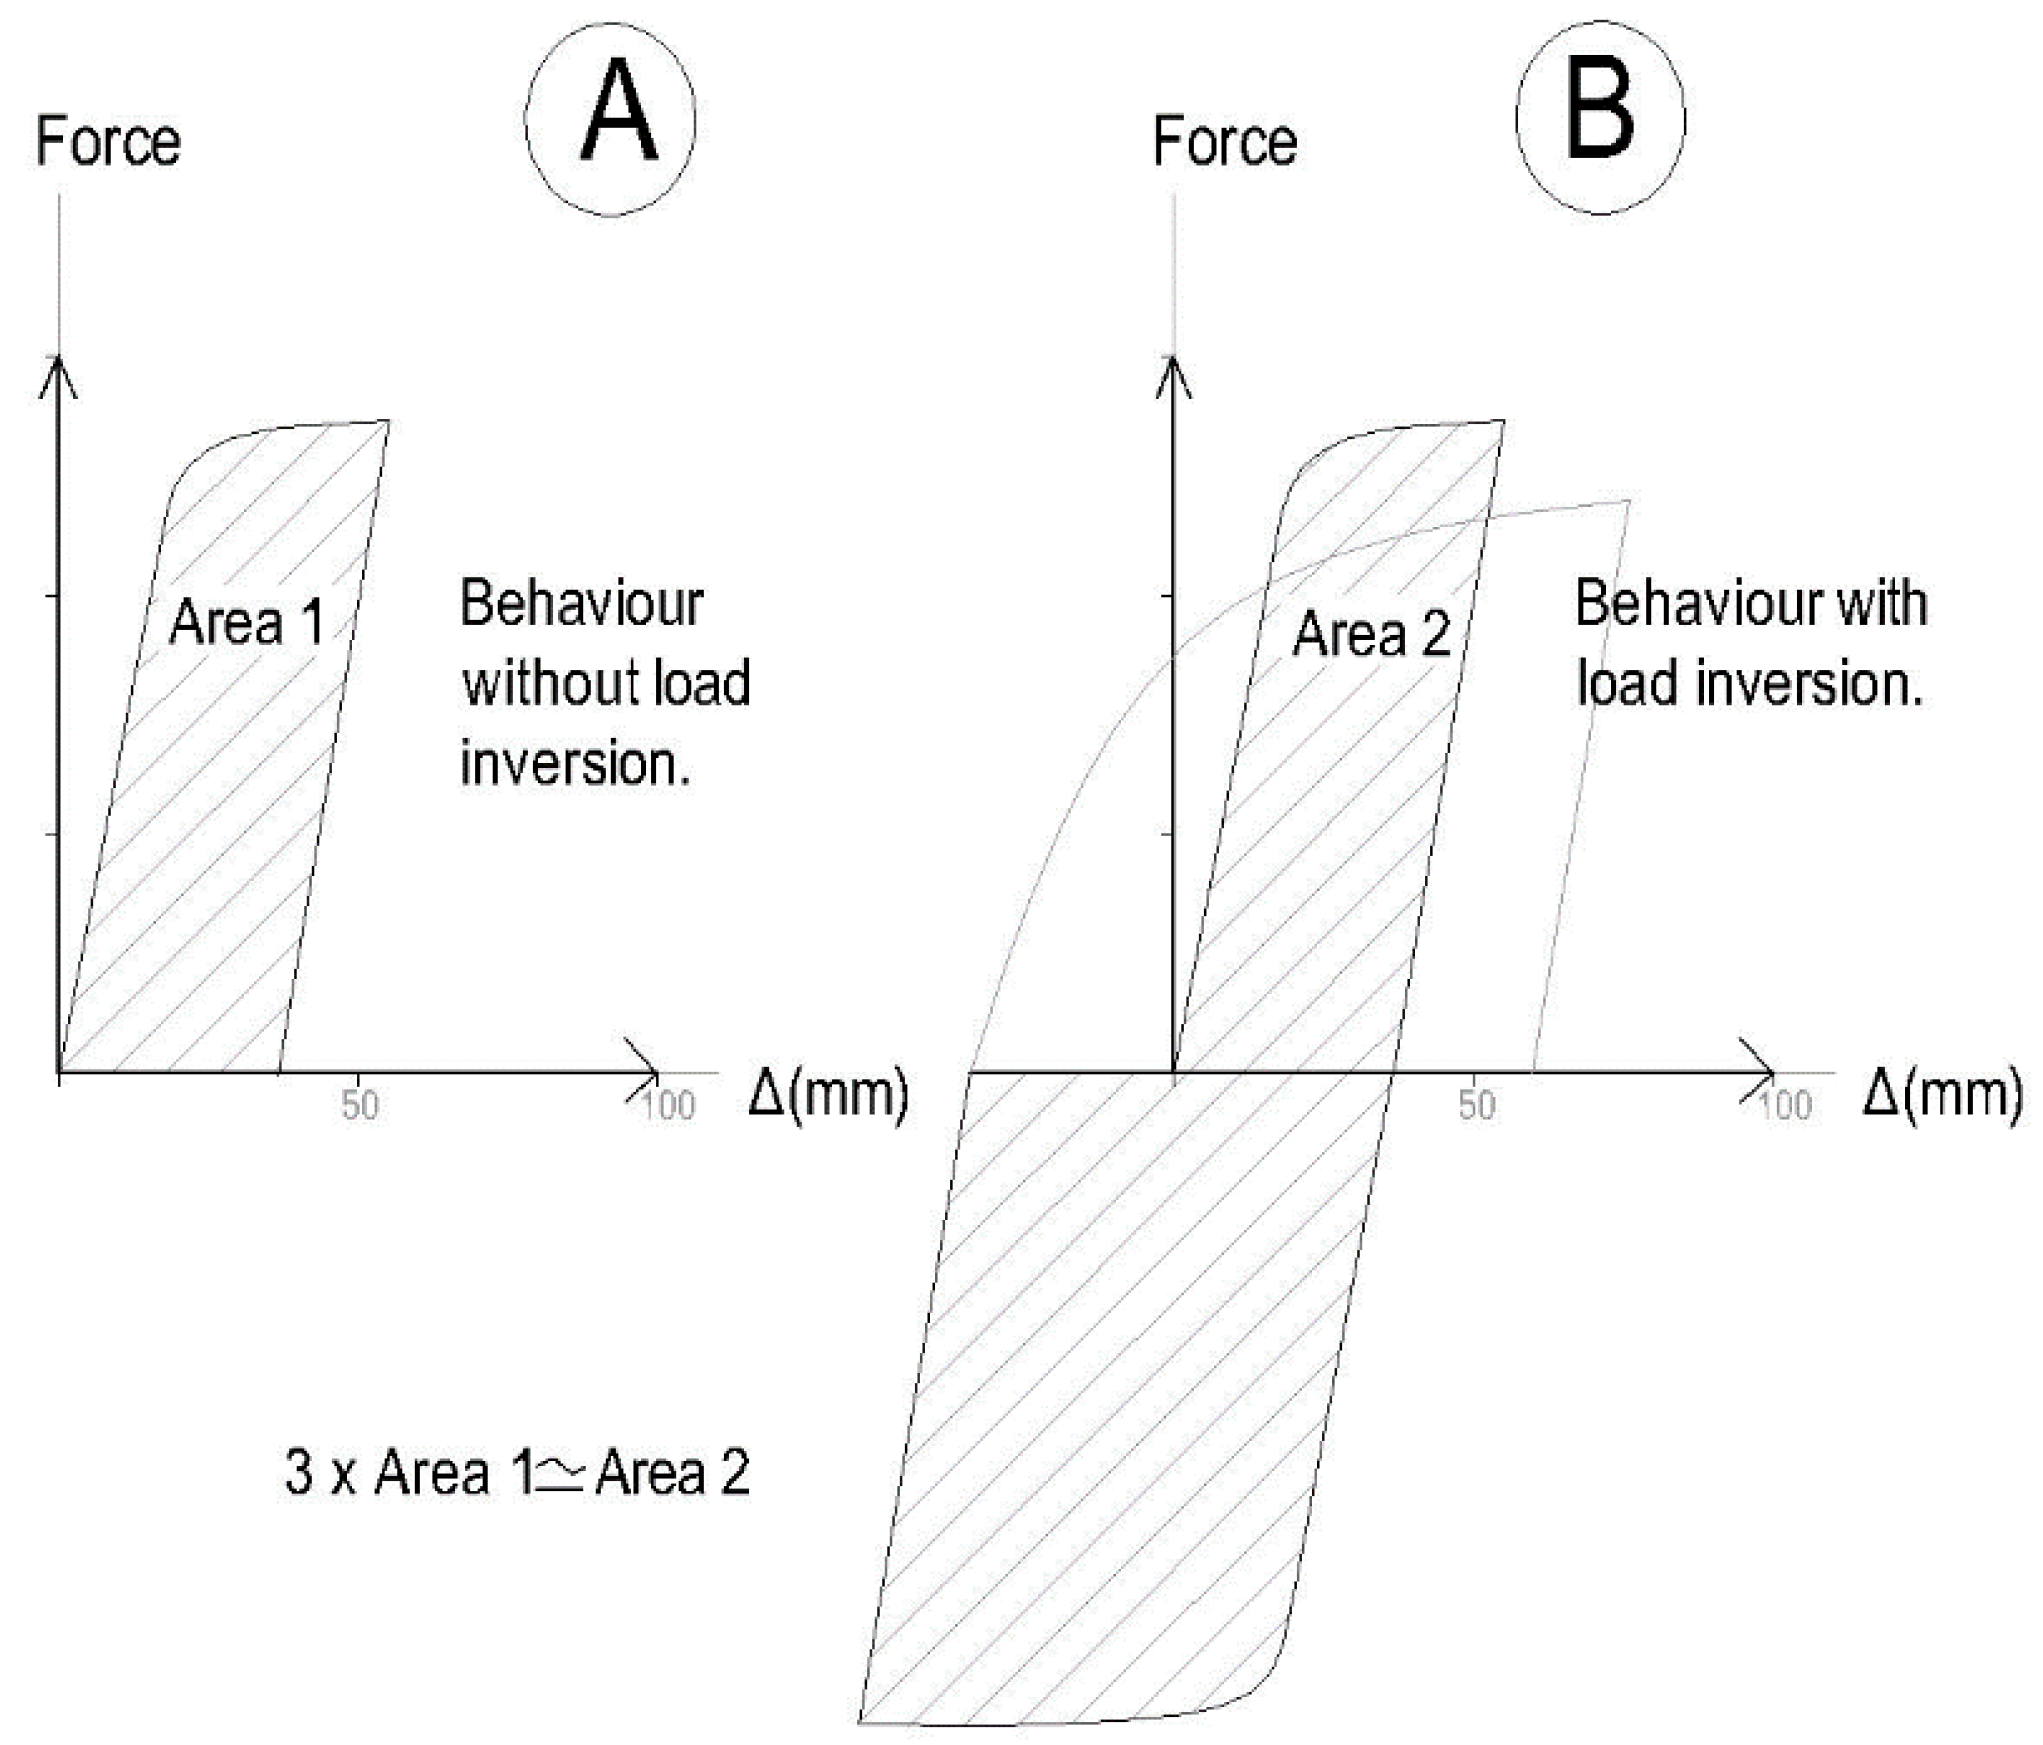
- The energy absorbed by the structure in the specimen with steel reinforced concrete is higher than that absorbed by the specimen with reinforced concrete.
- -
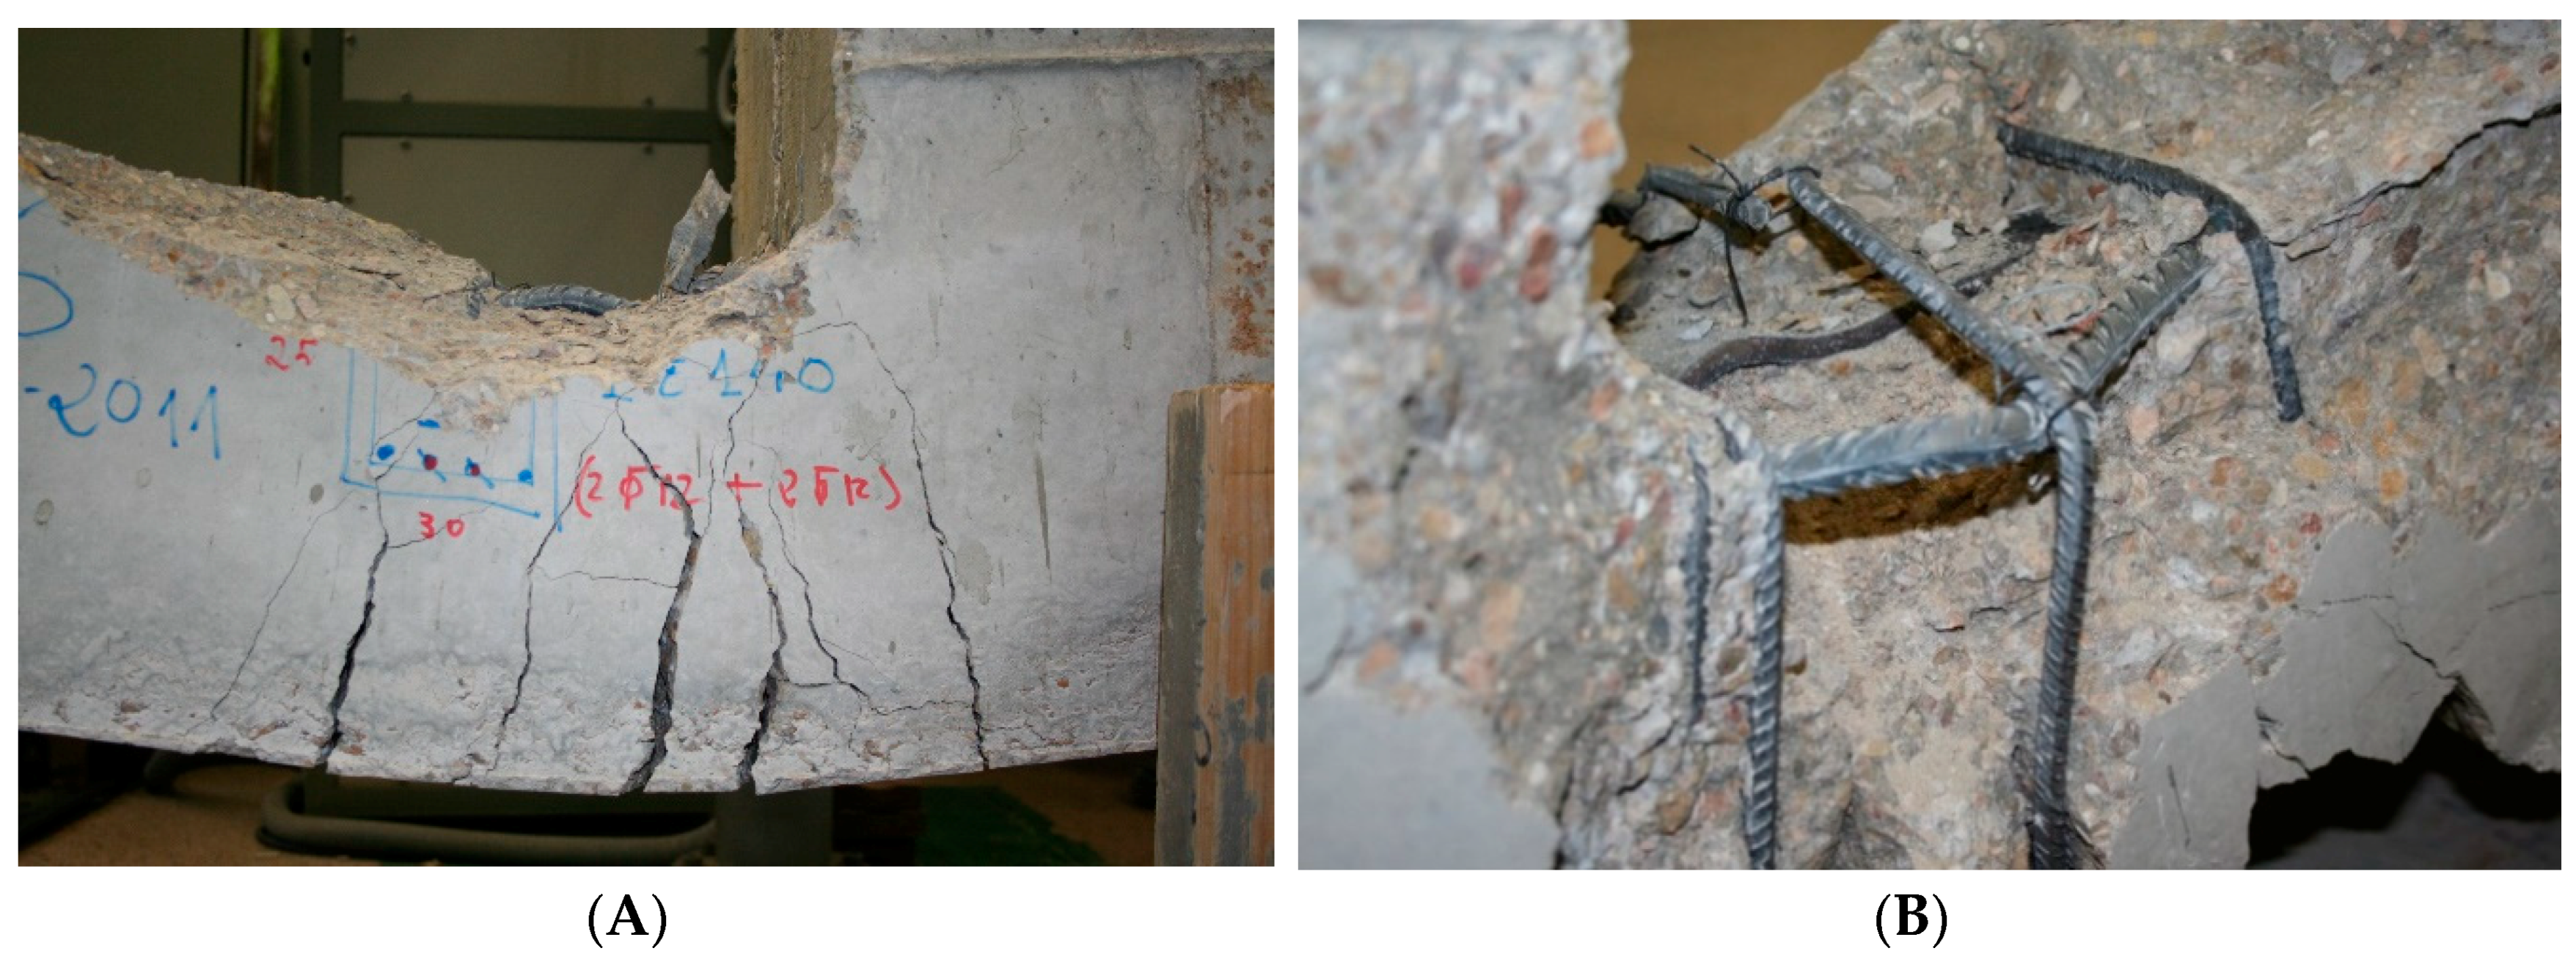
- The crack pattern of all the specimens of steel reinforced concrete joints is quite similar to that of reinforced concrete joints.
- -
- The tubular cross-section with the concrete inside used to create the steel reinforced concrete has better behavior in terms of bending strength. This is the normal situation against a seismic action.
Author Contributions
Funding
Conflicts of Interest
References
- Architectural Institute of Japan (AIJ). AIJ Standards for Structural Calculation of Steel Reinforced Concrete Structures; Architectural Institute of Japan (AIJ): Tokyo, Japan, 2001. [Google Scholar]
- Furlong, R.W. Strength of Steel-Encased Concrete Beam Columns. J. Struct. Div. 1967, 93, 113–124. [Google Scholar]
- Wakabayashi, M. Design of Earthquake-Resistant Buildings; CRC Press: Boca Raton, FL, USA, 1986. [Google Scholar]
- Mirmiran, A.; Shahawy, M. Behavior of concrete columns confined by fiber composites. J. Struct. Eng. 1997, 123, 583–590. [Google Scholar] [CrossRef]
- Gioncu, V.; Petcu, D. Available rotation capacity of wide-flange beams and beam-columns Part 1. Theoretical approaches. J. Constr. Steel Res. 1997, 43, 161–217. [Google Scholar] [CrossRef]
- Gioncu, V.; Petcu, D. Available rotation capacity of wide-flange beams and beam-columns Part 2. Experimental and numerical tests. J. Constr. Steel Res. 1997, 43, 219–244. [Google Scholar] [CrossRef]
- Chen, C.C.; Lin, K.T. Behavior and strength of steel reinforced concrete beam–column joints with two-side force inputs. J. Constr. Steel Res. 2009, 65, 641–649. [Google Scholar] [CrossRef]
- Tong, L.; Liu, B.; Xian, Q.; Zhao, X.-L. Experimental study on fatigue behavior of Steel reinforced concrete beams. Eng. Struct. 2016, 123, 247–262. [Google Scholar] [CrossRef]
- Giménez Carbó, E. Estudio experimental y numérico de soportes de hormigón armado reforzados con perfiles metálicos sometidos a esfuerzos de compresión simple. Ph.D. Thesis, Universidad Politécnica de Valencia, València, Spain, 26 June 2007. (In Spanish). [Google Scholar]
- Figueirido, D.H. Estudio experimental del pandeo de perfiles tubulares rectangulares de acero, rellenos de hormigón de alta resistencia, bajo carga axial y diagrama de momentos variables. Ph.D. Thesis, Universidad Politécnica de Valencia, València, Spain, 10 February 2012. (In Spanish). [Google Scholar]
- Chen, Z.; Xu, J.; Xue, J. Hysteretic behavior of special shaped columns composed of steel and reinforced concrete (SRC). Earthq. Eng. Eng. Vibr. 2015, 14, 329–345. [Google Scholar] [CrossRef]
- Yan, C.; Yang, D.; Ma, Z.J.; Jia, J. Hysteretic model of SRUHSC column and SRC beam joints considering damage effects. Earthq. Eng. Eng. Vibr. 2017, 50. [Google Scholar] [CrossRef]
- Chen, C.-C.; Suswanto, B.; Lin, Y.-J. Behavior and strength of steel reinforced concrete beam-column joints with single-side force inputs. J. Constr. Steel Res. 2009, 65, 1569–1581. [Google Scholar] [CrossRef]
- Chen, S.; Wu, P. Analytical model for predicting axial compressive behavior of steel reinforced concrete column. J. Constr. Steel Res. 2017, 128, 649–660. [Google Scholar] [CrossRef]
- Bossio, A.; Fabbrocino, F.; Lignola, G.P.; Prota, A.; Manfredi, G. Design Oriented Model for the Assessment of T-Shaped Beam-Column Joints in Reinforced Concrete Frames. Buildings 2017, 7, 118. [Google Scholar] [CrossRef]
- Santarsiero, G. FE Modelling of the Seismic Behavior of Wide Beam-Column Joints Strengthened with CFRP Systems. Buildings 2018, 8, 31. [Google Scholar] [CrossRef]
- Kabir, M.R.; Alam, M.S.; Said, A.M.; Ayad, A. Performance of Hybrid Reinforced Concrete Beam Column Joint: A Critical Review. Fibers 2016, 4, 13. [Google Scholar] [CrossRef]
- Gribniak, V.; Tamulenas, V.; Ng, P.-L.; Arnautov, A.K.; Gudonis, E.; Misiunaite, I. Mechanical Behavior of Steel Fiber-Reinforced Concrete Beams Bonded with External Carbon Fiber Sheets. Materials 2017, 10, 666. [Google Scholar] [CrossRef] [PubMed]
- Iqbal, S.; Ali, A.; Holschemacher, K.; Bier, T.A. Mechanical properties of steel fiber reinforced high strength lightweight self-compacting concrete (SHLSCC). Constr. Build. Mater. 2015, 98, 325–333. [Google Scholar] [CrossRef]
- Tran, M.-T.; Bui, Q.-B.; Sentosa, B.; Nguyen, N.-T.; Duong, T.-H.; Plé, O. Sustainable RC Beam-Column Connections with Headed Bars: A Formula for Shear Strength Evaluation. Sustainability 2018, 10, 401. [Google Scholar] [CrossRef]
- ACI Committee 318. Building Code Requirements for Structural Concrete (ACI318-05) and Commentary (ACI 318R-05); American Concrete Institute: Farmington Hills, MI, USA, 2005. [Google Scholar]
- EN 1994-1-1: Eurocode 4: Design of Composite Steel and Concrete Structures; The European Union: Brussels, Belgium, 2004.


| Material | Name | Elastic Limit | Limit of Break Tested |
|---|---|---|---|
| Concrete | HA-25/F/20/I | Fck = 25 N/mm2 | Fce = 3200 N/mm2 |
| Reinforcing bars | B-500-SD | Fsk = 500 N/mm2 | Fse = 619 N/mm2 |
| Steel section | HEB-100-S275 | Fak = 275 N/mm2 | Fae = 335 N/mm2 |
| Specimen | Typology | Beam Section (mm2) | Lower Bars | Cross-Section | Distance between Supports | Inertia Cross-Section × 104 (mm4) | Steel Weight (Kg/m) | Theoretical Maximum Moment Mpl,Rd (kN·m) | Maximum Load (kN) |
|---|---|---|---|---|---|---|---|---|---|
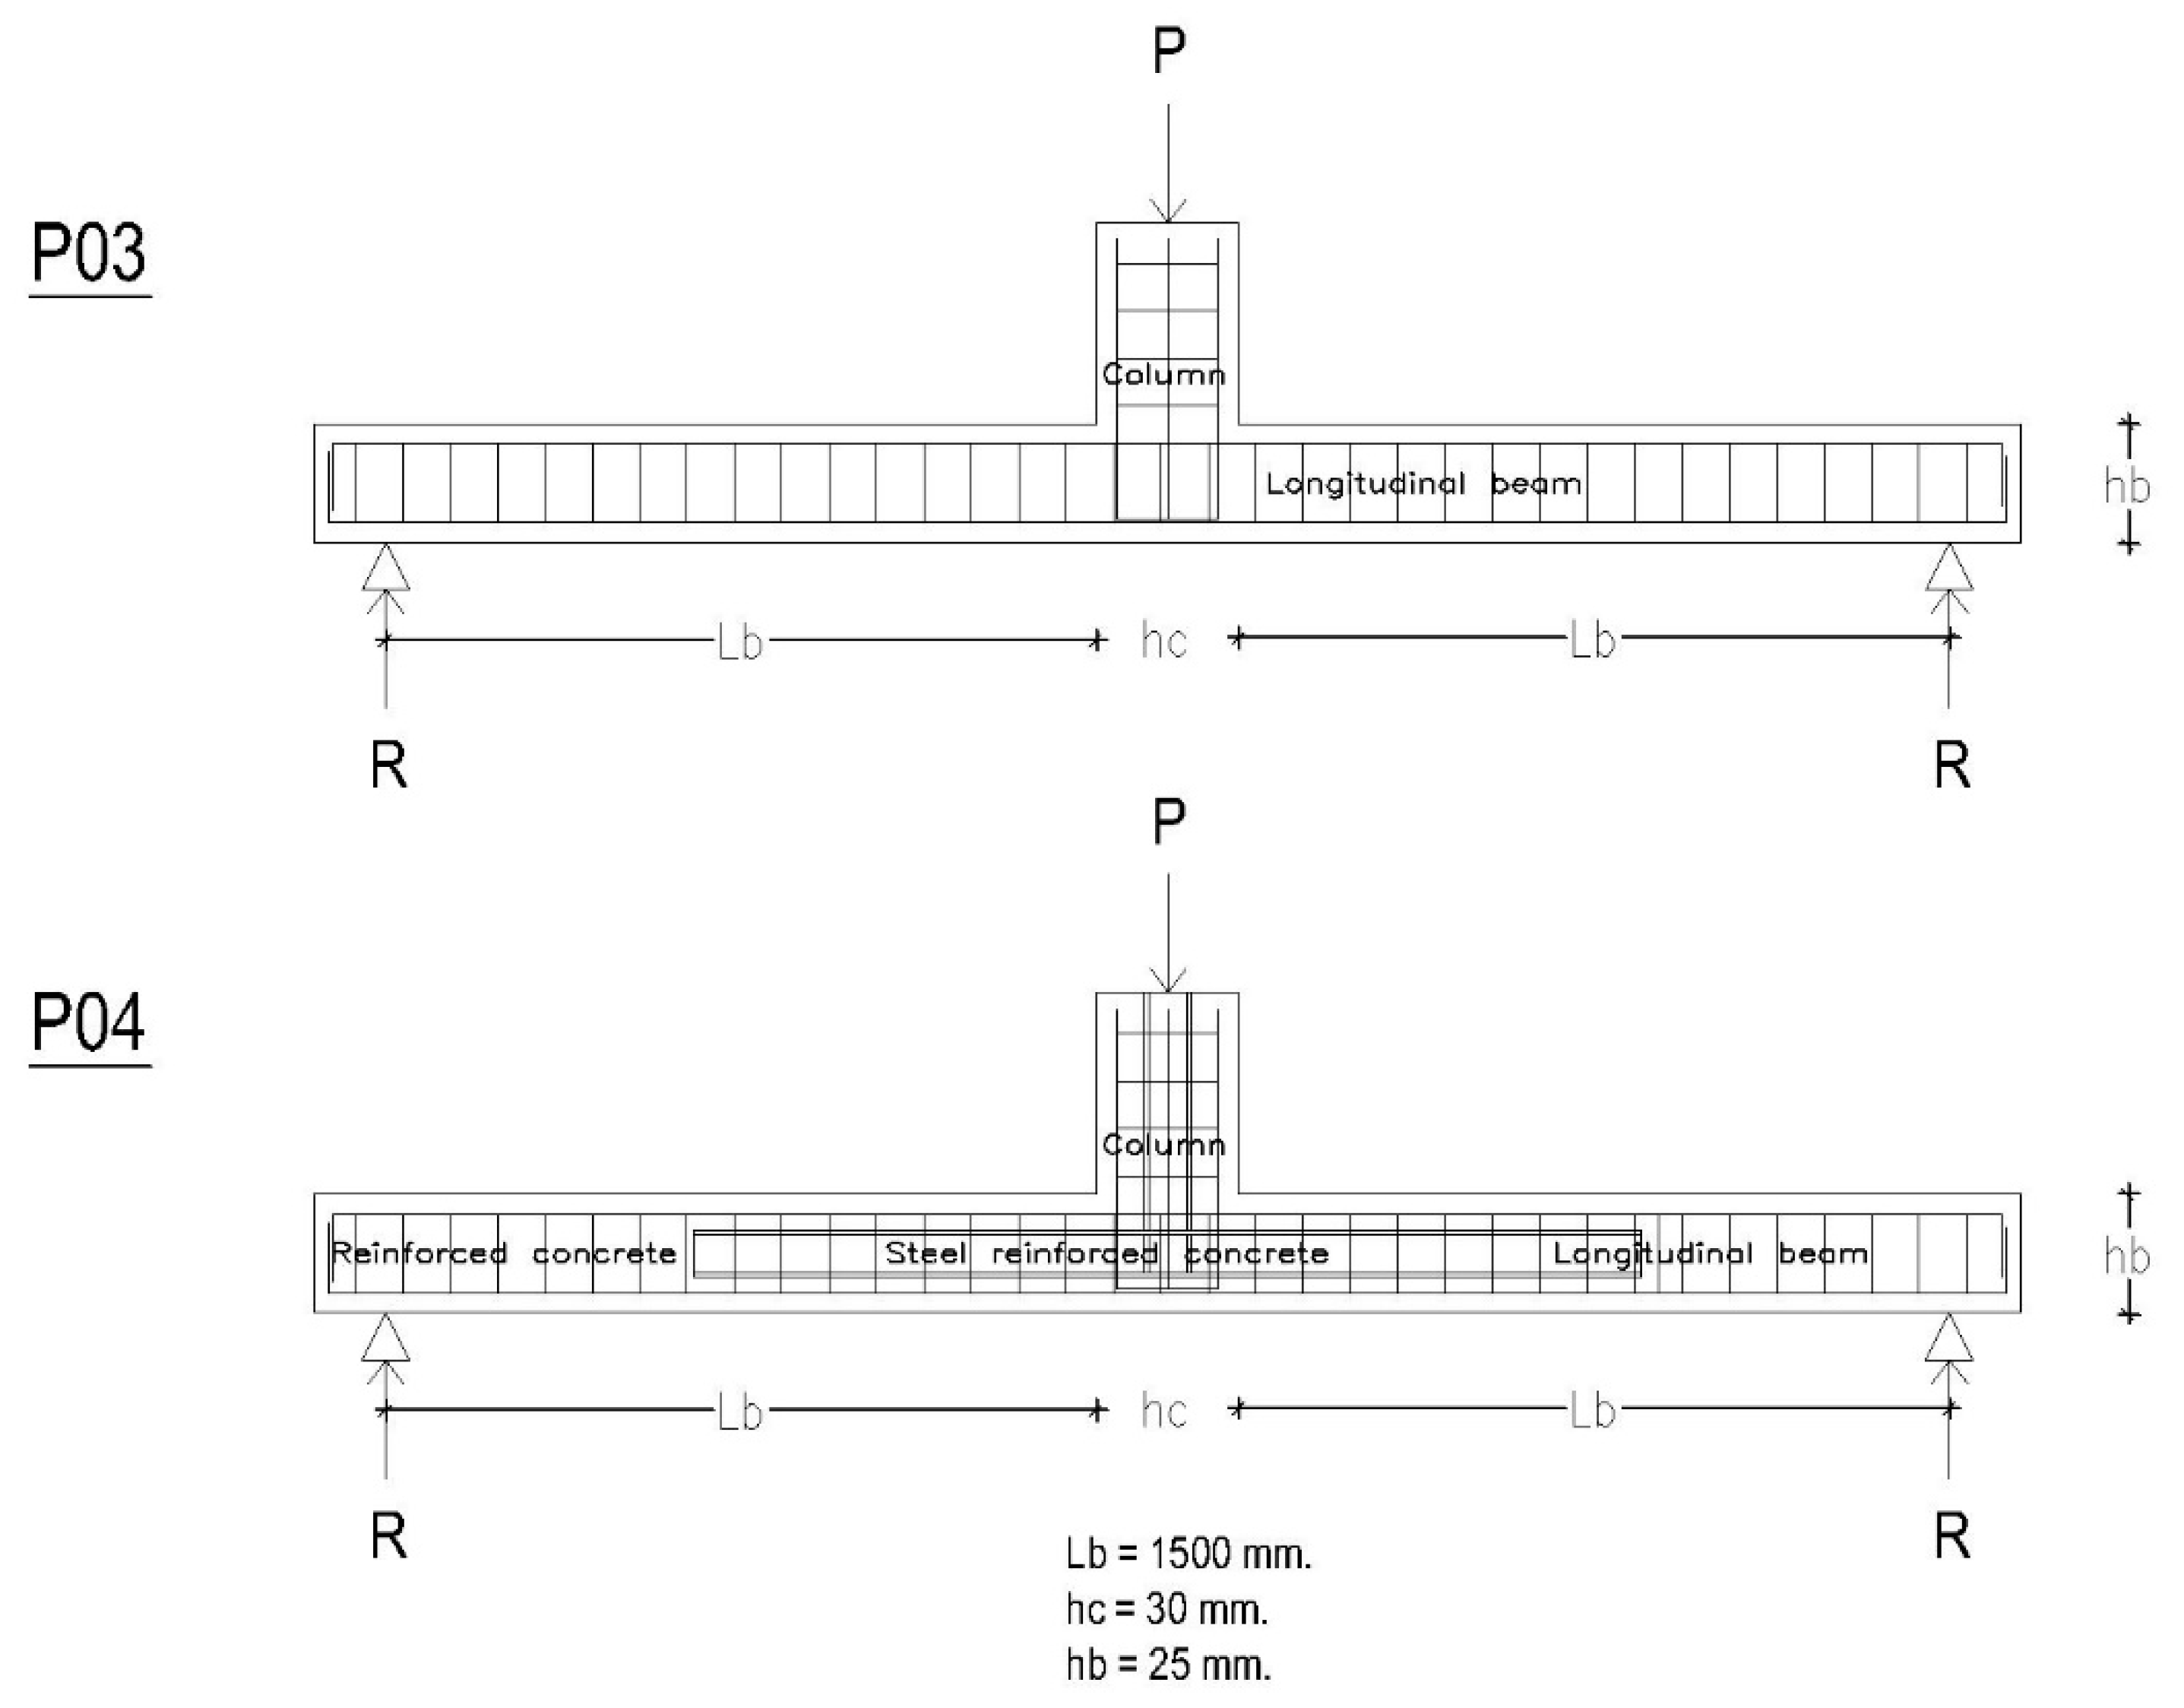
| P03 | RC | 300 × 250 | 4Φ12 | - | 3.30 m | - | - | 50.96 | 67.90 |
| P04 | SRC | 300 × 250 | 4Φ12 | HEB-100 | 3.30 m | 449.5 | 20.40 | 95.20 | 126.93 |
| P05 | RC | 300 × 250 | 2Φ16 + 2Φ20 | - | 3.30 m | - | - | 95.00 | 126.66 |
| P06 | SRC | 300 × 250 | 4Φ12 | IPN-140 | 3.30 m | 573 | 14.40 | 79.38 | 105.84 |
| P07a | SRC | 300 × 250 | 4Φ12 | 140 × 140 × 5 | 3.30 m | 780 | 20.50 | 95.29 | 127.05 |
| P07b | SRC | 300 × 250 | 4Φ12 | 140 × 140 × 5 | 3.30 m | 780 | 20.50 | 95.29 | 127.05 |
| Specimen | Maxim Deflection Δμ (mm) | μ Δμ/Δe | Moment at Break (kN·m) | Elastic Moment Last of the Cross-Section Theoretical (kN·m) | Plastic Moment Last of the Cross-Section (kN·m) | Maximum Moment (kN·m) | Absorbed Energy (kN·m) | Maximum Load (kN) |
|---|---|---|---|---|---|---|---|---|
| P03 | 220 | 7.8 | 41.25 | - | - | 55.00 | 14.65 | 73.33 |
| P04 | 330 | 11.7 | 75.00 | 24.75 | 28.65 | 109.50 | 44.88 | 146.55 |
| P05 | 220 | 7.8 | 41.25 | - | - | 108.75 | 23.11 | 145.10 |
| P06 | 280 | 10 | 75.00 | 22.52 | 26.23 | 97.50 | 38.84 | 130.72 |
| P07a | 170 | 6 | 82.50 | 30.52 | 36.28 | 123.75 | 35.10 | 165.15 |
| P07b | 350 | 12.5 | 82.50 | 30.52 | 36.28 | 116.25 | 47.99 | 155.20 |
© 2019 by the authors. Licensee MDPI, Basel, Switzerland. This article is an open access article distributed under the terms and conditions of the Creative Commons Attribution (CC BY) license (http://creativecommons.org/licenses/by/4.0/).
Share and Cite
Montava, I.; Irles, R.; Pomares, J.C.; Gonzalez, A. Experimental Study of Steel Reinforced Concrete (SRC) Joints. Appl. Sci. 2019, 9, 1528. https://doi.org/10.3390/app9081528
Montava I, Irles R, Pomares JC, Gonzalez A. Experimental Study of Steel Reinforced Concrete (SRC) Joints. Applied Sciences. 2019; 9(8):1528. https://doi.org/10.3390/app9081528
Chicago/Turabian StyleMontava, Isaac, Ramón Irles, Juan Carlos Pomares, and Antonio Gonzalez. 2019. "Experimental Study of Steel Reinforced Concrete (SRC) Joints" Applied Sciences 9, no. 8: 1528. https://doi.org/10.3390/app9081528
APA StyleMontava, I., Irles, R., Pomares, J. C., & Gonzalez, A. (2019). Experimental Study of Steel Reinforced Concrete (SRC) Joints. Applied Sciences, 9(8), 1528. https://doi.org/10.3390/app9081528