Abstract
Interoperability is a challenge for the realisation of smart grids. In this work, we apply the methodology for interoperability testing and the design of experiments developed at the Smart Grids Interoperability Laboratory of the Joint Research Centre of the European Commission on a simple use case. The methodology is based on the Smart Grid Architecture Model (SGAM) of CEN/CENELEC/ETSI and includes the concept of Basic Application Profiles (BAP) and Basic Application Interoperability Profiles (BAIOP). The relevant elements of the methodology are the design of experiments and the sensitivity/uncertainty analysis, which can reveal the limits of a system under test and give valuable feedback about the critical conditions which do not guarantee interoperability. The design and analysis of experiments employed in the Joint Research Centre (JRC) methodology supply information about the crucial parameters that either lead to an acceptable system performance or to a failure of interoperability. The use case on which the methodology is applied describes the interaction between a data concentrator and one or more smart meters. Experimental results are presented that show the applicability of the methodology and the design of experiments in practice. The system is tested under different conditions by varying two parameters: the rate at which meter data are requested by the data concentrator and the number of smart meters connected to the data concentrator. With this use case example the JRC methodology is illustrated at work, and its effectiveness for testing interoperability of a system under stress conditions is highlighted.
1. Introduction
The Energy Efficiency Directive (Directive 2012/27/EU of the European Parliament and of the Council of 25 October 2012 on energy efficiency, amending Directives 2009/125/EC and 2010/30/EU and repealing Directives 2004/8/EC and 2006/32/EC, OJ L 315, 14.11.2012, p. 1.), as well as recent communications and proposals from the European Commission in the electricity sector, encourages Member States to deploy Smart Grids. Such transformation which will allow electricity network management to accommodate the growing levels of renewable energy sources foreseen by the European Union energy policy targets in the next decades. Indeed, the growing presence of intrinsically variable—and difficult to predict, renewable energy sources in the electricity network, leads to unstable conditions in terms of frequency and voltage, making the management between power generation and load consumption difficult. A smarter grid supervises and controls this problem ensuring safe, flexible and optimal operation of the system.
A key challenge for the transition towards a digital energy is the interoperability between the components of the smart grid. In other words, the devices, systems and sub-systems of the electricity grid should be able to work together and exchange meaningful and understandable information to perform the functions they are supposed to accomplish. Interoperability is at stake for the fact that a single digital energy can be achieved from the convergence of many industrial actors, with different standards, culture and technical background (e.g., electricity, power electronics, home appliances, telecommunications, internet, etc.). A consequence of the multitude of players in the smart grids is that interoperability will not be achieved spontaneously, but it will have to be supported by dedicated policy, standards and technical instruments. Although interoperability has been recognised as a fundamental element for the modernisation of the electricity grid, testing interoperability of smart grids standards is still far from being commonly specified.
For this reason, the European Interoperability Centre for electric vehicles and smart grids at the Joint Research Centre (JRC) has developed a systematic approach towards a unified European framework for developing smart grid interoperability tests [1]. Its main goal is to methodically verify the ability of given equipment under test to communicate effectively with other components. The availability of a methodology offers a systematic means to analyse any interoperation flaw against business and user requirements. Further analysis could then be performed to assess the reasons and impact of any flaws and propose potential solutions.
The most critical enabler components of a smart grid are the smart meters, which are simple electronic devices that register real-time consumption and generation of electricity, in a household or an industry, and send the data to the electricity retailer for monitoring and billing. The rollout of smart meters in the European Union is massive, with the aim to rollout 200 million smart meters by 2020. The adoption of smart meters will allow consumers to benefit from the progressive digitalisation of the electricity market via a number of different functions including the access to dynamic electricity price contracts, opening up the possibility for consumers who produce their own energy to respond to change in prices and sell in an optimised way to the grid. Smart meters (SM) from the same neighbourhood are connected to a data concentrator, another popular component of the smart grids. The data concentrator (DC) is an electronic device providing communication capability with a large number of smart meters. The data concentrator can be configured to request periodic electricity information (power consumption, voltage, frequency, etc.) from each smart meter.
There has been significant work done in the field of smart meters testing. In [2] the authors describe the network architecture tested and used for smart grid deployment, whereas acceptance and analysis tests have also been performed. In [3] interoperability tests are performed, and results are presented from small-scale PRIME field deployments. AMI systems have also been tested for other purposes, such as IP applications [4]. The main features of smart metering systems are described in [5] along with the most employed technologies and standards.
Data transferring is also an important element for the smart grid. In [6] real-time communication is examined, and in particular, the standards IEEE 802.22 and IEC 61850 are studied for transferring big data in real-time. The importance of a reliable network for data transfer is shown in [7], where a technique to improve the reliability of smart grids by using ZibBee as the Local Area Network (LAN) communication protocol is studied.
Smart meter data play a significant role in the smart grid. For instance, they can be used for (Low Voltage) LV network monitoring and can give feedback for the LV grid condition, as is done in [8] along with secondary substation measurements. In [9] smart meter measurements are used for low voltage grid state estimation; the authors proposed a cloud-based smart metering architecture, which allows scalability and interoperability for the meters. Smart meter data prioritisation is studied in [10], where QoS issues are examined to ensure that high priority data is delivered successfully. Smart metering data and their secure delivery are also examined in [11], where an algorithm is proposed to study the optimal data concentrator location; parameters, such as the maximum throughput and the average delay, are taken into account to make sure that data is delivered efficiently. It can be concluded that smart meter data transferring is an important aspect for the smart grid. Different applications can define different parameters for the acceptable smart meter data transferring. For instance, real-time applications are more demanding in terms of delay and throughput of such data. In [12] an overview of several applications is given along with the required smart meter data frequency to guarantee the successful outcome of the application.
In this paper, we apply the methodology and design of experiments on a simple use case, which describes the interaction between smart meters and a data concentrator. As a first step, we form the use case to be examined; we provide the description of tests, and we present the equivalent Basic Application Profiles (BAP(s)) and Basic Application Interoperability Profiles (BAIOP(s)). For their extraction, it is important to define the standards that can be used for every link of interaction. To do this, the European Committee for Standardization/ European Committee for Electrotechnical Standardization (CEN/CENELEC) Smart Grid Set of Standards has been used [13] as well as the CEN/CENELEC Functional reference architecture for communications in smart metering systems [14] and the CEN/CENELEC Sustainable Processes [15]. These documents are very useful when working with smart grid interoperability; they give guidelines for forming smart grid interoperability use cases, the actors to be involved and the standards that can be followed. In addition, specific guidelines with respect to Advanced Metering Infrastructure (AMI) applications are given in [14], which help in identifying the issues related to smart metering themes. In Section 2, we show the standards to be used for the chosen use case. Further on, the design of experiments is presented and the parameters to be altered are defined. For this work, we follow the methodology for interoperability testing for smart grids [1], which defines the way the experiments should be executed. The experiments are executed with a given testbed available in the lab and conclusions are drawn with respect to whether or not the test parameter alteration affects the overall system performance and interoperability. We focus on smart meter readings received; the parameters to be altered are the number of smart meters and the sampling period with which the readings are requested.
Smart meter readings are necessary for several use cases, which can be divided into 5 categories, namely the awareness, the market, the scheduling and control, the network services and the diagnostics category, as indicated in [12]. Each use case has different requirements for the smart meter readings. For example, the market category use cases, such as dynamic pricing forecasts, pre-paid contracts and multi-contract customer use case, that require smart meter data every 15 min. The same goes for the awareness use cases, such as the dashboard for consumption and production awareness, the consumption awareness and cost estimation use case, as well as for the scheduling and control use case, namely the monitoring for elderly people use case. On the other hand, there are many use cases that require frequent smart meter data reception. Such examples are: the real-time power curve visualization (awareness category), which requires data every second; the PV self-consumption with appliances and storage systems (scheduling and control category—requiring data every second); the peak shaving with appliances and storage systems (scheduling and control category—requiring data every second); the scheduling for appliances (scheduling and control category—requiring data every 5 s). To complete the picture, there are many use cases that require smart meter data with a frequency of 30 s up to 3 min, such as the warning for exceeding available power thresholds, load shifting with storage systems, load shifting with appliances, active demand for network issues, tertiary and secondary reserves, and the supply service anomalies monitoring [12].
It should be mentioned at this point, that smart metering applications entail many challenges apart from the communication perspective and the frequency with which data is acquired from them. Such challenges are cybersecurity [16] and big data volume [17] that need to be taken care of. In this paper, such issues are out of the scope of our research.
With this work, we give an example of an interoperability use case on which the design of experiments is applied. Laboratory tests are also provided to give insight on how different parameters can affect system performance. In this example, the effect on smart meter message exchange by altering crucial parameters, such as the number of smart meters and the frequency with which the messages are requested, is examined. For this reason, lab experiments are run, and the limitations of a small-scale AMI system are examined. Interoperability is maintained in case the system works in the same way even if the parameters defining the message exchange are altered. By testing the limitations of the AMI system, interoperability is examined.
The rest of the paper is organized as follows: Section 2 gives the use case description and the description of the interoperability testing methodology, while Section 3 gives the statistical design of experiments description. Section 4 presents the experiments executed, and Section 5 concludes the paper.
2. Use Case (UC) Description, IOP Methodology and Concept Applied
2.1. Methodology
The methodology [1] indicates that one of the first steps is to define the use case that will be examined, so as to move on with determining the link of interaction between the Equipment Under Test (EUT) and the system under test. Each link of interaction among the devices is characterized by a Basic Application Profile (BAP), which specifies the standard/option of a standard that is used in that particular link of interaction. Afterwards, the Basic Application Interoperability Profile (BAIOP) is specified, which shows the test steps for interoperability testing. Figure 1 summarizes the methodology, as is indicated in [1]. After the BAIOP creation, the design of experiments, presented in the following section, determines how to alter the parameters to evaluate interoperability. Altering important parameters can compromise the system interoperability. The statistical analysis that follows can give important information on how the parameters affect the overall system. The methodology can be applied in all use cases that entail this specific interaction.
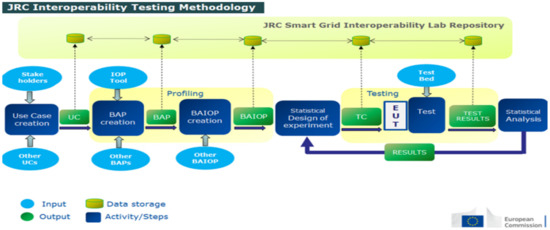
Figure 1.
Interoperability Testing Methodology [1]. UC: Use Case, BAP: Basic Application Profile, BAIOP: Basic Application Interoperability Profile, TC: Test Case, EUT: Equipment Under Test.
The Use Case described in this work can be considered as a sub-category of the use case described in [18], where the integration of a new smart meter is examined under the concept of a Demand Side Management DSM exercise. Whereas the use case described here is simpler and it only involves a small number of actors, the main difference is that here focus is given on the design of experiments and the effect of basic parameters in the overall system performance. In addition, an example of experimental results is presented, which follows the use case description and the design of experiments, thus, giving a concrete example of the theoretical part and proving the effectiveness of the whole methodology.
2.2. Use Case Description
In this case, we examine the interaction between the data concentrator and the smart meters, and the data messages sent by the smart meters to the data concentrator. Therefore, the configuration of interest is the connection between the smart meters and the data concentrator. The objective is to study the system performance in case fundamental parameters are altered and the effect of such parameters on the system interoperability. For this reason, the role of Design of Experiments in the interoperability methodology is important along with the statistical analysis of the results.
In [19] the concept of a scoring scheme for interoperability testing in the context of AMI is introduced. This scoring scheme is accompanied by a test verdict tracing scheme that can be used for pointing the tangible interoperability layer of the Smart Grid Architecture Model (SGAM) framework [13] that is responsible for lack of interoperability when such a case occurs. In this work, the “quality of interoperability” between the relevant components of interest is investigated. To clarify what is meant by the phrase “quality of interoperability”, the reader has to take into account the following: the dynamics of interactions between two (or more) components of interest are characterised by a hierarchy of interactions. This hierarchy is defined in relevant communication protocol specification documents, e.g., [20]. Normally, two types of entities exist, a “requesting” and a “responding” one. The “requesting” entity is on the higher-level of the hierarchy, and the “responding” entity is on the lower-level of the hierarchy. In Figure 2, a generic form of interactions between relevant components is presented.
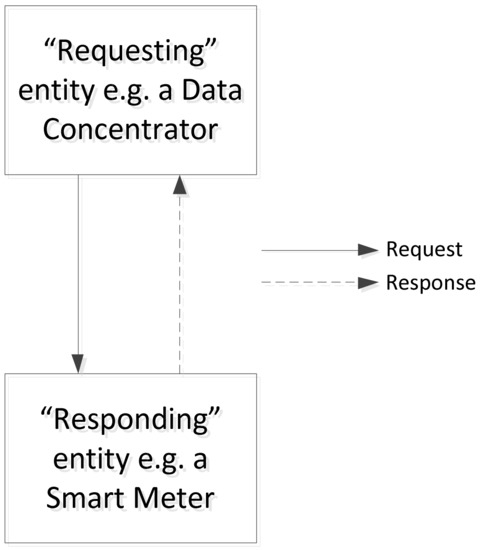
Figure 2.
Dynamics of interaction between two components of interest.
With respect to the framework within which the components of interest perform the functionalities that they are assigned to perform, different metrics can be used for assessing their performance. For example, the metric used can be the “sampling period of requests” asked by the “requesting entity”. This metric can take different values, and the quantity that is assessed is the “response rate” of the “responding entity”.
At this point, there is a need to clarify some issues relevant to the “pass” or “fail” test verdict. As introduced in [19] a “fail” test verdict can take place on any of the tangible interoperability layers of the SGAM, i.e., component, communication and information layers. To link this work with the definition for lack of interoperability introduced by the authors of [19], the following has to be considered: An indisputable “fail” test verdict means that the “response rate” of the “responding entity” is 0%. For any value greater than 0% an investigation for the sufficiency of interoperability has to take place. This is done because if the response rate is greater than 0%, it means that the system under test is capable of interoperating on the tangible interoperability layers and, thus, the system as a whole can be considered as interoperable. The “quality of interoperability” is then linked with the observed, through experimentation, “response rate”. The higher the value of the “response rate”, the more significant the value offered by the interoperable system turns to be.
In this case, the actors involved are the smart meter(s) and data concentrator. The mapping of this use case on the SGAM component, communication and information layers can be represented as shown in Figure 3 and Figure 4.
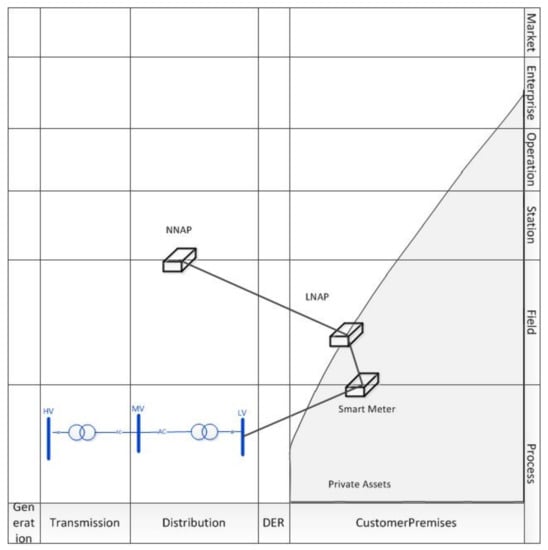
Figure 3.
Use Case representation on the component layer.
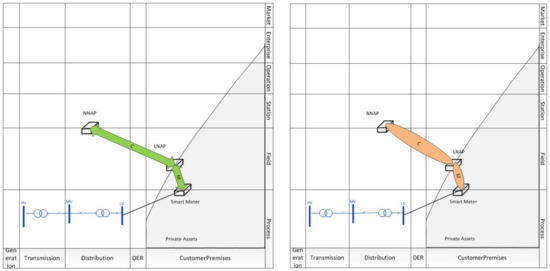
Figure 4.
Use Case representation of the communication and information layer.
It is considered that the Local Network Access Point (LNAP) is within the smart meter, whereas the Neighbourhood Network Access Point (NNAP) is actually the data concentrator. The interfaces C and M define the standards that can be used for each link of communication. The reader is redirected to [14] to understand better which standards can be used for them.
2.3. BAP and BAIOP Creation
The profiling has two steps, the Basic Application Profile(s), BAP, and the Basic Application Interoperability Profile(s), BAIOP, creation. The former one(s) are based on the information flows between the different actors. Therefore, it is crucial to determine the standards and protocols that can be used for each link of interaction for the information exchange. Another important factor is that the BAPS cannot have multiple options; thus, each BAP means that only one protocol/standard/option of a standard can be used. For the BAIOP(s), one BAP is considered for each interaction link between actors.
When dealing with the profiling, only one equipment is considered to be the equipment under test, whereas the rest are considered to be part of the testbed; thus, their interactions and the standards used in each interaction are fixed. The BAP and BAIOP profiling procedure is explained in detail in [18]. Here we only list the features necessary for our use case. For the described use case, we consider that the equipment under test is a smart meter and its integration to the rest of the system needs to be tested under stress conditions or not. It is also assumed that the LNAP is integrated within the smart meter and that the functions over interface M and H2 (Figure 4) remain the same. Therefore, the interaction link of interest is interface C between the LNAP and NNAP. In this section, non-stress conditions are considered. The interoperability layers of interest are the component, the communication and the information since we are interested in the technical part of the interoperability test. The business layer is mostly linked to market issues, which is outside the scope of this work.
In this simple use case, the only interaction link of interest is between the smart meter and the data concentrator (between the LNAP and NNAP). Thus, BAP and BAIOP creation becomes simpler. Table 1 shows the possible BAPs for the equipment under test (smart meter). For the extraction of the possible standards, [13,14,15] have been used.

Table 1.
Possible Basic Application Profiles (BAPs) for the equipment under test, based on [18].
The BAIOP(s) determine how the tests should be carried out and defines the test case(s), which can be more than one. For this use case, we will have two BAIOPs, one for the communication and one for the information layer. Each of them will depend on the smart meter’s specifications. At this stage, it should be determined whether or not the equipment is interoperable or not under non-stress working conditions. Given the smart meters that are available in our lab, it is defined that the I1a and the C1b BAPs are used for the two layers of interest since the smart meters work with the PoweRline Intelligent Metering Evolution (PRIME) specification. We consider that the physical connection of the smart meter is accomplished without problems, in other words, that there are no compatibility problems with respect to the cabling and voltage/current limits between the smart meter and the grid. Table 2 and Table 3 describe the interoperability tests for the communication and information layer under non-stress conditions, based on [18].

Table 2.
Basic Application Interoperability Profiles (BAIOPs) for the communication layer, based on [18].

Table 3.
BAIOP for the information layer, based on [18].
It is considered that all smart meters can communicate efficiently with the data concentrator and that the latter can control and supervise the smart meters. Therefore, the interoperability tests under non-stress conditions: one smart meter communicating with one data concentrator, give a PASS as an outcome. This allows us to move on with the Interoperability Testing Methodology steps to the design of experiments, where the effect on the system performance is examined with the alteration of two parameters.
In this work, apart from the theoretical explanation, an example of experimental results is given with a small-scale AMI system. The impact of the smart meter message exchange parameters on the overall system performance is examined. Our testbed consists of one data concentrator and 12 residential smart meters. The technology used for communication is the PRIME specification. The design of experiments, presented in the following section, determines how to alter the parameters to evaluate interoperability, namely the number of smart meters and the sampling period of requests to evaluate the limitations of our system.
3. Statistical Design of Experiments
A design of experiments is a systematic method of laying out an experimental plan for subsequently carrying out the interoperability tests in different conditions. In the interoperability tests, one deliberately changes the system’s parameters to observe the effect that these changes have on the response variable, namely the response rate. The scope of the design of experiments is to identify the parameters to be assessed and to set out a given number of combinations of their values for which the system will undergo subsequent interoperability tests.
In this study, two parameters are considered, the number of smart meters and the sampling period of requests. Tests with one, up to 12 smart meters, have been conducted in the laboratory. As for the sampling period of requests (SPR), a first trial test with SPR = 15′ and one smart meter has been conducted to have a first glance of the level of response rate. A response rate of 100% was obtained. Further, with the objective to test the system under stress conditions (i.e., to explore the response rate for extreme values of the parameters), other combinations of the two parameters were tested.
The design for the present investigation is very simple because only two parameters are considered. Hence, the design is represented by a regular 2D grid of values. Other settings may consider a larger number of parameters, hence a high-dimensional space to be explored. This implies a more general approach to the design of experiments to cover the whole high-dimensional space of parameters while, at the same time, maintaining the number of experiments at a reasonable and realistic level. This approach is based on Monte Carlo sampling and is comprehensively described in Chapter 4 of the JRC methodology report [1].
4. Experiments
In this section, we give an experimental example of the use case described in Section 2 following the design of experiments in Section 3. The scope is to provide a clear example of the design of experiments that can take place in an interoperability test and highlight its importance for the subsequent identification of the parameters’ values for which the system performance is acceptable or not. In this case, we change two parameters, namely the number of smart meters and the sampling period of requests. The objective is to perform real tests to obtain measurement values from the smart meters. The measurement values of interest are power, current, voltage values, as well as the power factor. The results can be applied in all use cases that entail this specific interaction. With the experimental part, we show how changing important parameters can affect the overall system performance. The lab experiments may not be representative of all systems that exist in reality, but they prove the applicability of the Design of Experiments, and they give an idea of systems’ limitations by changing crucial parameters.
4.1. Testbed-Architectures Used
The testbed used is a small-scale first generation AMI system, and the experiments are conducted in the lab environment. One data concentrator is used, and 12 single-phase smart meters were chosen from the available ones for the experiments. Figure 5 shows the testbed used for this work. The test bed includes 18 meters including 2 triphase ones. For this experiment, only twelve residential smart meters were used, which communicate with the data concentrator using Power Line Communication technology (PLC). They communicate with the PRIME protocol which is a popular option in some Member States of the European Union for power line communication. The data concentrator software allows the interrogation of the smart meters to request measured values, such as power, current and voltage values at a predefined periodicity.
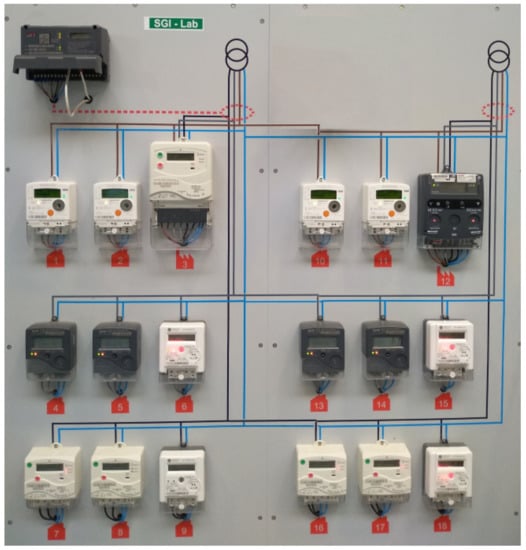
Figure 5.
Testbed used for evaluating the data concentrator-smart meters interaction.
In this experiment, we test the ability of the data concentrator to acquire the aforementioned measurement values as a function of the number of smart meters connected to the data concentrator, and with different sampling periods of requests of measured values.
More specifically, the two parameters changed in the experiments are the number of meters working together (1, 2, 4, 8 and 12) and the periodicity of request for information from the data concentrator to the meters (15, 10, 5, 4, 3, 2 and 1 min). All combinations of these two parameters’ values were tested. Hence, a total of 35 experiments was executed. Each experiment was conducted over 180 min to guarantee representative statistics of counts.
The stress tests have the scope to identify the critical parameters’ values where data acquisition would not be 100% successful, namely where the system would miss the acquisition of some of the requested data.
4.2. Experimental Results
In this section, we present the experimental results with respect to the data acquired for each combination of parameters’ values. The data acquisition was performed by programming the data concentrator to request specific values with a predefined sampling period from a specific set of smart meters. The procedure is named ‘task scheduler’, where the smart meter(s) ID is declared, from which data are requested, the periodicity of the requested data is defined along with the kind of information needed (voltage, current, etc). For each request, a file is created and uploaded to the computer that controls the data concentrator. So, if data is requested every minute, 60 files are expected to be uploaded in an hour. Each file contains information for all of the smart meters defined in the task scheduler. Specifically, the file contains each meter’s ID followed by the exact time the information has been retrieved and the values requested. Figure 6 shows an example of the values retrieved. As it can be noticed from Figure 6, at the top of the file, information about the report itself is given, along with the identifiers for each smart meter. Here, we have replaced the data concentrator and the smart meters identifiers with “xxxxxxxxxxxxxx”, “yyyyyyyyyyyyy” and “zzzzzzzzzzzzz”, respectively, for reasons of confidentiality. Information about the time at which the recording takes place is also available. In the next lines of the file, the ID of each variable is shown, followed by the measured value of the variable itself. The variables questioned here are: voltage, current, imported power (active Pimp and reactive Qimp), power factor, meter phase and, finally, active import (total energy consumed by the smart meter until that time moment). The setting of the values to be retrieved is straightforward; fewer or more values can be set to be recorded depending on the purposes of the experiment. Figure 6 shows the values, while no actual load is connected. In this experiment, we chose to record some of the most important electrical values for a smart meter.
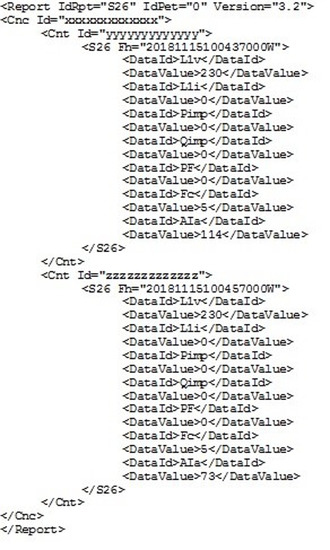
Figure 6.
Values retrieved for two smart meters according to our program.
For the evaluation of the experiments, two response variables were considered: the number of files created during the experiment and the number of smart meters for which valid information was included in each file. For an experiment to be considered as 100% successful, it is required that all expected files are created and that each file has readings for all listed smart meters. In the following, Table 4 and Table 5 show the results obtained during the experiments in terms of the percentage of files received and the percentage of readings received (100% is considered when all files/readings are received). As it can be observed, up to 12 smart meters were used for the experiments, namely, 12, 8, 6, 4, 2 and 1 smart meter(s) are used each time.

Table 4.
Results summary-variable: number of files received.

Table 5.
Results summary-variable: number of readings received.
It should be noted at this point that the number of files expected is:
where Td is the total duration of the experiment and Ts is the sampling time with which data are requested. On the other hand, the number of lines in the file in order to be considered that it includes 100% of the information is given in Equation (2). The number of lines depends on the values that are set to be retrieved, the number of smart meters that are monitored and on the extra information the recording procedure adds (i.e., time of the recording, identifiers for the smart meters, etc.).
where Nl is the total number of lines; lr stands for the additional lines of the report, lr = 4, i.e., 2 lines for report opening and 2 lines for the data concentrator ID; NSM is the total number of smart meters examined; lSMr is the number of additional lines added by the report creation, lSMr = 4, 2 lines for the smart meter ID and 2 lines for the type of variables reporting (here: instantaneous values); Nv is the number of variables recorded for each smart meter.
Nf = Td/Ts + 1
Nl = lr + NSM (lSMr + 2 Nv)
For 12 smart meters, the general trend is that the more frequent the requests for information, the more the performance deteriorates, meaning that the percentage of files and readings received declines. However, the amount of information obtained does not follow a clear linear pattern.
For similar sampling periods (3, 4, 5 min) the ratios obtained are not linear. For a sampling rate of 4 min the files received seem to be more than those for a sampling rate of 5 min. In our opinion, this unexpected behaviour is due to uncontrollable factors that affect the system under test, essentially driven by the environmental conditions in which the experiments are carried out. One such factor could well be the presence of statistical noise in the grid.
For eight smart meters, a similar trend is observed, meaning that the amount of information recorded declines as the sampling rate increases. It is noticed that there is 100% success for a sampling ratio of 15 min. In addition, for certain sampling rates, the performance is not better than that corresponding to the equivalent values for 12 smart meters.
When six smart meters are used, the general trend observed for the 12 and 8 smart meters case is also valid. In this case, the performance is improved, meaning that the information is received with a better percentage of success. Actually, there is 100% of success in the received files up to a sampling rate of 4 min.
For four smart meters, it is observed that the files are received with a 100% success ratio up to the sampling rate of 5 min. It is also noticed that the performance is in some cases (i.e., 1 min sampling rate) equivalent to that of the six smart meters.
For two smart meters, as well as for one smart meter, it is shown that the performance is better than the cases when more smart meters are used. The information is received with a success rate of 100% up to the sampling rate of 2 min.
Figure 7 and Figure 8 show graphically the trend that the experiments follow for the two parameters examined.
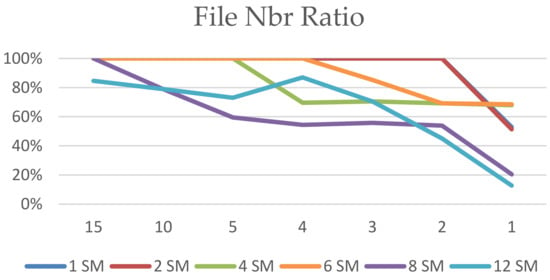
Figure 7.
Success ratio in terms of the number of files received by the data concentrator as a function of the two analysed parameters.
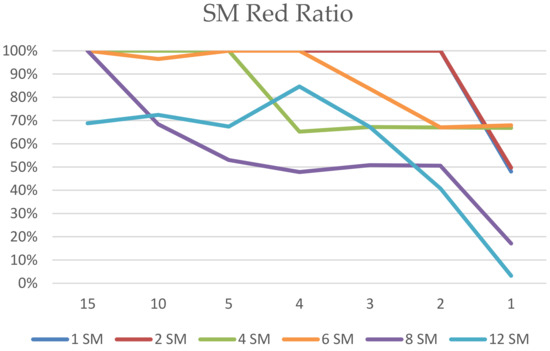
Figure 8.
Success ratio in terms of smart meters’ readings received by the data concentrator as a function of the two analysed parameters.
In general, the performance of the system deteriorates by increasing the number of smart meters in the test. However, some non-monotonic behaviour is observed which, in our opinion is due to the presence of stochastic and unpredictable factors that influence the system under analysis (that may cause connectivity problems). The success ratio was, in many cases, lower than 100% because not all files were received with respect to what was expected and, even when all the files were received, many times they did not contain all the information that the smart meters are supposed to send to the data concentrator. To depict better the situation, graphs are displayed with the number of files recorded during the experiment execution for each parameter’s configuration where a disruption in the files recording is initiated. Figure 9, Figure 10, Figure 11, Figure 12, Figure 13 and Figure 14 depict this situation for 12, 8, 6, 4, 2 and 1 smart meter, respectively.
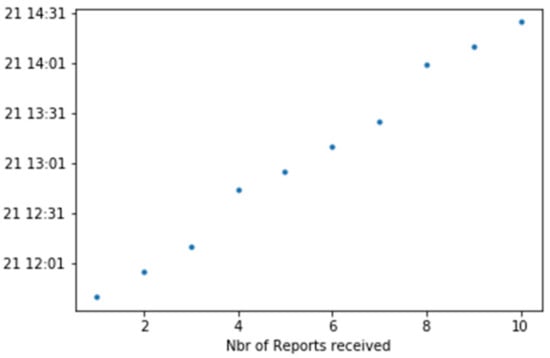
Figure 9.
Number of files actually received as a function of time–12 smart meters.
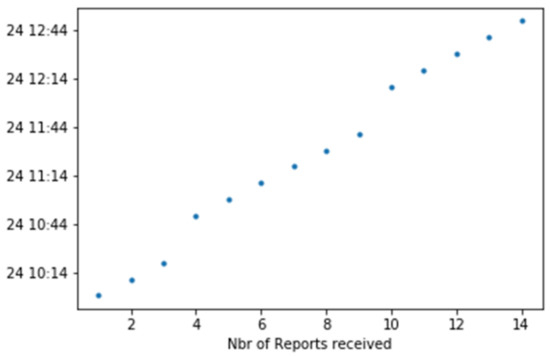
Figure 10.
Number of files actually received as a function of time–8 smart meters.
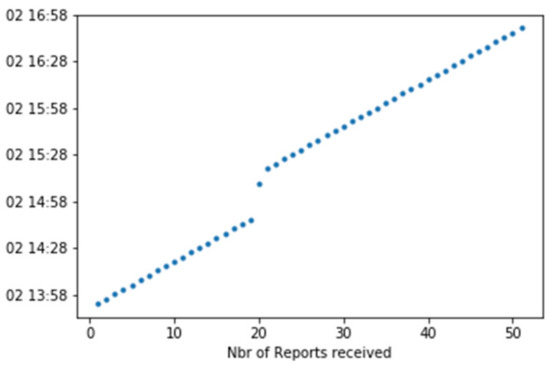
Figure 11.
Number of files actually received as a function of time–6 smart meters.
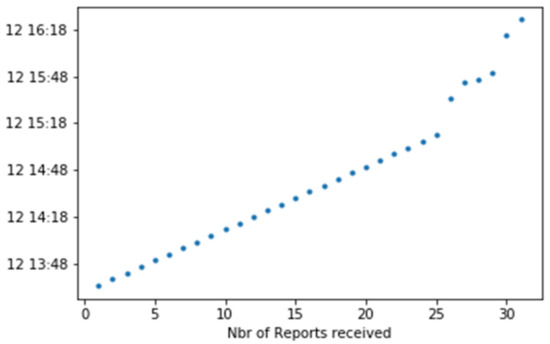
Figure 12.
Number of files actually received as a function of time–4 smart meters.
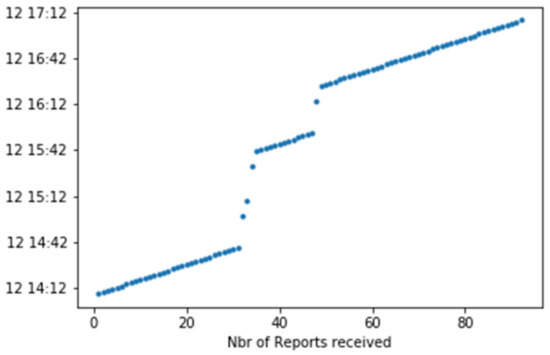
Figure 13.
Number of files actually received as a function of time–2 smart meters.
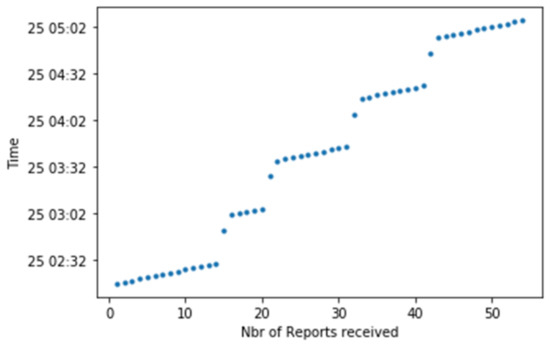
Figure 14.
Number of files actually received as a function of time–1 smart meter.
The graphs follow no linear pattern because there are gaps in recording. For example, the system records for one hour, then there is a gap of 20 min, then recording starts again. Connectivity problems may explain this issue. When connectivity is lost, no recording is made.
The experiments show that when the system is placed under different stress conditions (for different combinations of parameters’ levels) its overall performance can be affected, meaning that the desired amount of information is not obtained. Real situations could be different from the experimental setting tested in the SGILab, but the stress tests give an idea of the possible limitations that may occur in the performance of a system when operational conditions change.
The graphs given in Figure 15 and Figure 16 can be seen as visual representations of Table 4 and Table 5. The figures show the two output variables (number of readings received, and number of files received) as a function of the two parameters’ values. The green area corresponds to the case in which the success rate in terms of file/readings received is 100%, whereas the red area identifies the critical region of the parameters’ space where the success ratio is very low. For example, 100% of success rate is obtained for “number of files received” when less than 8 smart meters are connected to the data concentrator and, at the same time, the sampling rate is above 4 min. The non-straight and non-monotonic 3D surface emphasises the intrinsic non-linearities, which are due to uncontrollable factors affecting the system under test. With the increase in the number of smart meters used it is anticipated that the surface area (orange and red in Figure 15 and Figure 16) that represents low success ratios will increase too. The real value of the information provided in Graphs 15 and 16 depends on the considered use case (UC). For use cases that are real-time relevant this would lead to a non-interoperable system. For most of the use cases that are not real-time relevant even low success ratios would be enough for the realisation of the use case with guaranteed interoperability. The user decides which value of success rate is acceptable for the function that the system is supposed to provide. Hence, values of success rate less than 100% could be considered acceptable.
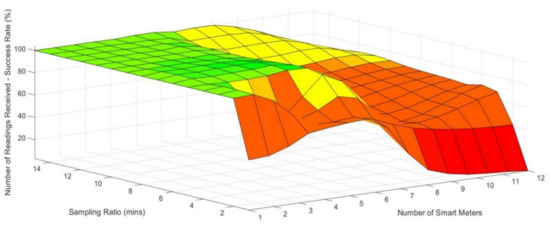
Figure 15.
Visual representation of the success ratio of the number of readings received as a function of the number of smart meters connected to the data concentrator and the smart meters’ sampling rate.
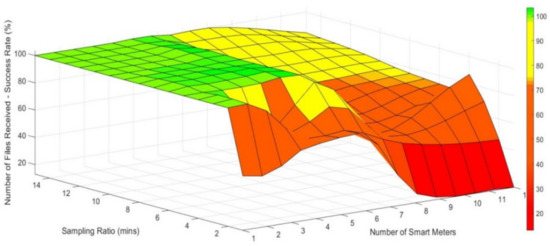
Figure 16.
Visual representation of the success ratio of the number of files received as a function of the number of smart meters connected to the data concentrator and the smart meters’ sampling rate.
5. Discussion
In this work, an application of the interoperability testing methodology and all its steps to evaluate the proper functionality of a system with other components of the smart grid is described. When testing interoperability, one equipment is considered as equipment under test whereas the rest of the devices comprise the test bed. As a first step, it should be tested and confirmed that the equipment can exchange information in the correct way with the rest of the test bed. For this to be verified the BAP(s) and BAIOP(s) need to be specified, and the test(s) should be executed. The next step is the design of experiments, which indicates how certain system’s parameters can be changed to verify whether the system’s interoperability holds under different operational conditions. The tests are repeated for all the selected values of the system’s parameters, and it is decided whether or not the system performance remains the same and interoperability is maintained.
The methodology shows which combination of parameters’ values corresponds to a successful test, and to what extent. As a consequence, it can reveal important information about whether or not a system can remain interoperable or not under certain stress conditions. It should be noted here that it depends on the desired application to determine if the performance of a system is acceptable or not. For example, in case an application can tolerate a loss of data at the extent of 10%, then even if the performance is 90% successful, it can be considered sufficient. The design of experiments can provide with such information about the limits of a system and the extent at which certain performances can be reached.
We have applied all the steps of the interoperability testing methodology to a simple AMI use case, where the interaction between a data concentrator and a smart meter is evaluated. Initially, it was verified that the devices can operate together correctly as a system and information can be exchanged effectively. Subsequently, two parameters of the system were deliberately varied, namely the sampling rate with which information is acquired and the number of smart meters that communicate with the data concentrator. The design of experiments was applied, and the regions in the space of parameters where the system maintains a certain performance were identified. The design of experiments determines not only the parameters for which interoperability is lost (it is considered that interoperability is lost if there is less than 100% success in the experiments) but also gives a hint on the performance that can be reached defining if this could be acceptable or not when realising an application. Phasor Measurement Units (PMUs) sample voltage and current, at a given location in the electricity distribution, many times a second. They are mainly used in use cases where the real-time control of the state of the power system is the goal. The focus of this work is on SMs and DCs; PMUs and any relevant communication architectures have not been studied here. Hence, no conclusions regarding their interoperability with any other potential EUT can take place.
Experimental results are given as an example of this simple use case which prove the importance of the system parameters in the overall performance. It is shown that the rate with which the smart meters are interrogated plays an important role as well as the number of smart meters that are connected to the system. The infrastructure available may not represent a real robust AMI system, but it gives an idea of the issues that can come up when smart meter data is requested with a higher rate. The latter fact is a tendency in modern systems since several smart grid applications (i.e., demand response programs) require smart meter readings even in real-time.
The paper highlights the importance of the methodology, and the experimental results complement the theoretical part to stress the usefulness of the design of experiments and the methodology as a whole. Indeed, the methodology of performing tests under stress conditions can provide valuable conclusions with respect to the extent at which a system can be used and the applications that it can support. Therefore, it is important that smart grid systems are tested thoroughly to detect potential interoperability issues and to define whether or not altering vital parameters can result in a compromise on the system’s performance.
6. Conclusions
In this paper, we presented the application of the Interoperability Testing Methodology on a simple AMI use case, including the design of experiments, the alteration of vital parameters and the evaluation of the resulting system’s performance. As a first step, the use case was described, which defines the interaction between a smart meter and a data concentrator. The use case was depicted on the three bottom interoperability layers of the SGAM, namely the component, the communication and the information layer. The BAP and BAIOPs were defined for this use case. As a further step, the design of experiments was explained. Experimental results are given for this simple use case, which prove the applicability of the interoperability testing methodology and the effectiveness of the design of experiments. The parameters that were altered were the frequency with which data was acquired from the smart meter and the actual number of smart meters that were monitored by the data concentrator. The results showed that the parameters play a fundamental role in the overall performance. For the available system in the lab, it was observed that the number of smart meters that were interrogated by the data concentrator has an effect on the total amount of data gathered. In addition, as a general trend, it was observed that the more frequently the data is requested, the worse the performance gets, leading to a decreased amount of data with respect to what would be expected. The experimental results showed an indication that there may be constraints in the system performance when it is requested to perform under stress conditions.
The paper proved the usefulness of applying the interoperability testing methodology in smart grid interoperability tests and showed that the design of experiments can reveal crucial information with respect to the acceptance of certain parameters of the system depending on the application in question. The experimental results were used to highlight the importance of the design of experiments under stress conditions and prove the effectiveness of the testing methodology for interoperability purposes. An advantage of applying the methodology and design of experiments can be information obtained with respect to the system’s limits.
Author Contributions
N.A. and I.P. had the idea of the paper. I.P performed the experiments for one smart meter. N.A and A.L. performed the rest of the experiments. A.L. analysed the experimental data and derived graphs (7–14). S.T. wrote part of the Introduction, Section 3 and derived graphs 15, 16. I.P wrote part of Section 2.2. N.A. wrote the rest of the document. A.L., I.P and S.T provided comments and helped finalizing the paper.
Funding
The work of this paper has been supported by the Joint Research Center, European Commission.
Conflicts of Interest
The authors declare no conflict of interest.
Nomenclature
| AMI | Advanced Metering Infrastructure |
| BAP | Basic Application Profile |
| BAIOP | Basis Application Interoperability Profile |
| CEN/CENELEC | European Committee for Standardization/ European Committee for Electrotechnical Standardization |
| DC | Data Concentrator |
| DSM | Demand Side Management |
| EUT | Equipment Under Test |
| IOP Methodology | Interoperability Methodology |
| IP | Internet Protocol |
| JRC | Joint Research Centre |
| LAN | Local Area Network |
| LNAP | Local Network Access Point |
| LV | Low Voltage |
| NNAP | Neighborhood Network Access Point |
| PLC | Power Line Communication |
| PRIME | PoweRline Intelligent Metering Evolution |
| QoS | Quality of Service |
| SGAM | Smart Grid Architecture Model |
| SPR | Sampling Period of Requests |
| UC | Use Case |
References
- Papaioannou, I.; Tarantola, S.; Lucas, A.; Kotsakis, E.; Marinopoulos, A.; Ginocchi, M.; Olariaga-Guardiola, M.; Masera, M. Smart Grid Interoperability TestingMethodology; EUR 29416 EN; Publications Office of the European Union: Luxembourg, 2018; ISBN 978-92-79-96855-6.
- Sendin, A.; Berganza, I.; Arzuaga, A.; Pulkkinen, A.; Kim, I.H. Performance results from 100,000+ PRIME smart meters deployment in Spain. In Proceedings of the IEEE Third International Conference on Smart Grid Communications (SmartGridComm), Tainan, Taiwan, 5–8 November 2012. [Google Scholar]
- Aruzuaga, A.; Berganza, I.; Sendin, A.; Sharma, M.; Varadarajan, B. PRIME Interoperability Tests and Results from Field. In Proceedings of the First IEEE International Conference on Smart Grid Communications, Gaithersburg, MD, USA, 4–6 October 2010. [Google Scholar]
- Uribe-Pérez, N.; Angulo, I.; De la Vega, D.; Arzuaga, T.; Fernández, I.; Arrinda, A. Smart Grid Applications for a Practical Implementation of IP over Narrowband Power Line Communications. Energies 2017, 10, 1782. [Google Scholar] [CrossRef]
- Uribe-Pérez, N.; Hernández, L.; De la Vega, D.; Angulo, I. State of the Art and Trends Review of Smart Metering in Electricity Grids. Appl. Sci. 2016, 6, 68. [Google Scholar] [CrossRef]
- Dehalwar, V.; Kalam, A.; Lal Kolhe, M.; Zayegh, A. Review of IEEE 802.22 and IEC 61850 for real-time communication in Smart Grid. In Proceedings of the International Conference on Computing and Network Communications (CoCoNet), Trivandrum, India, 16–19 December 2015. [Google Scholar]
- Ke, C.H.; Hsieh, S.Y.; Lin, T.C.; Ho, T.H. Efficiency network construction of advanced metering infrastructure using Zigbee. IEEE Trans. Mob. Comput. 2018. [Google Scholar] [CrossRef]
- Lu, S.; Repo, S.; della Giustina, D.; Figuerola, F.A.; Löf, A.; Pikkarainen, M. Real-Time Low Voltage Network Monitoring—ICT Architecture and Field Test Experience. IEEE Trans. Smart Grid 2015, 6, 2002–2012. [Google Scholar] [CrossRef]
- Pau, M.; Patti, E.; Barbierato, L.; Estebsari, A.; Pons, E.; Ponci, F.; Monti, A. Low voltage system state estimation based on smart metering infrastructure. In Proceedings of the IEEE International Workshop on Applied Measurements for Power Systems (AMPS), Aachen, Germany, 28–30 September 2016. [Google Scholar]
- Jayashree, L.; Sandanalakshmi, R. Priority based routing framework for neighborhood area network in smart grid communication. In Proceedings of the International Conference on Wireless Communications, Signal Processing and Networking (WiSPNET), Chennai, India, 22–24 March 2017. [Google Scholar]
- Tanakornpintong, S.; Tangsunantham, N.; Sangsuwan, T.; Pirak, C. Location optimization for data concentrator unit in IEEE 802.15.4 smart grid networks. In Proceedings of the 17th International Symposium on Communications and Information Technologies (ISCIT), Cairns, QLD, Australia, 25–27 September 2017. [Google Scholar]
- Pitì, A.; Verticale, G.; Rottondi, C.; Capone, A.; Lo Schiavo, L. The Role of Smart Meters in Enabling Real-Time Energy Services for Households: The Italian Case. Energies 2017, 10, 199. [Google Scholar] [CrossRef]
- CEN/CENELEC-ETSI Smart Grid Set of Standards version 4.0 Final Oct 2016. Available online: https://www.cencenelec.eu/standards/Sectors/SustainableEnergy/SmartGrids/Pages/default.aspx (accessed on 13 March 2019).
- CEN/CENELEC-ETSI Functional Reference Architecture for Communications in Smart Metering Systems. Available online: ftp://ftp.cen.eu/cen/Sectors/List/Measurement/Smartmeters/CENCLCETSI_TR50572.pdf (accessed on 13 March 2019).
- Sustainable Processes, CEN-CENELEC-ETSI Smart Grid Coordination Group. November 2012. Available online: ftp://ftp.cen.eu/EN/EuropeanStandardization/HotTopics/SmartGrids/Sustainable%20Processes.pdf (accessed on 13 March 2019).
- Konstantinou, C.; Maniatakos, M. Security analysis of Smart Grid. In Communication Control Security Challenges for the Smart Grid; ebooks IET: London, UK, 2017. [Google Scholar]
- Bhattarai, B.P.; Paudyal, S.; Luo, Y.; Mohanpurkar, M.; Cheung, K.; Tonkoski, R.; Hovsapian, R.; Myers, K.S.; Zhang, R.; Zhao, P.; et al. Big data analytics in smart grids: State-of-the-art, challenges, opportunities, and future directions. IET Smart Grid 2019. [Google Scholar] [CrossRef]
- Andreadou, N.; Papaioannou, I.; Masera, M. Interoperability Testing Methodology for Smart Grids and Its Application on a DSM Use Case—A Tutorial. Energies 2019, 12, 8. [Google Scholar] [CrossRef]
- Poursanidis, I.; Kotsakis, E.; Andreadou, N.; Masera, M. Evaluation of Interoperability in the Context of Advanced Metering Infrastructure. In Proceedings of the IEEE International Conference on Smart Energy Grid Engineering (SEGE), Oshawa, ON, Canada, 12–15 August 2018. [Google Scholar]
- Draft Standard for PoweRline Intelligent Metering Evolution (PRIME); PRIME Alliance Technical Working Group: Brussels, Belgium, 2010.
© 2019 by the authors. Licensee MDPI, Basel, Switzerland. This article is an open access article distributed under the terms and conditions of the Creative Commons Attribution (CC BY) license (http://creativecommons.org/licenses/by/4.0/).