Article

Comparison of Lipid and Water Contents by Time-domain Diffuse Optical Spectroscopy and Dual-energy Computed Tomography in Breast Cancer Patients

1
Central Research Laboratory, Hamamatsu Photonics K.K., Hamamatsu 434-8601, Japan
2
Department of Diagnostic Radiology & Nuclear Medicine, Hamamatsu University School of Medicine, Hamamatsu 431-3192, Japan
3
Department of Breast Surgery, Hamamatsu University School of Medicine, Hamamatsu 431-3192, Japan
*
Author to whom correspondence should be addressed.
Both of these authors contributed equally to this work.
Appl. Sci. 2019, 9(7), 1482; https://doi.org/10.3390/app9071482
Submission received: 31 January 2019 / Revised: 3 April 2019 / Accepted: 4 April 2019 / Published: 9 April 2019
(This article belongs to the Special Issue New Horizons in Time-Domain Diffuse Optical Spectroscopy and Imaging)

Abstract

:
We previously compared time-domain diffuse optical spectroscopy (TD-DOS) with magnetic resonance imaging (MRI) using various water/lipid phantoms. However, it is difficult to conduct similar comparisons in the breast, because of measurement differences due to modality-dependent differences in posture. Dual-energy computed tomography (DECT) examination is performed in the same supine position as a TD-DOS measurement. Therefore, we first verified the accuracy of the measured fat fraction of fibroglandular tissue in the normal breast on DECT by comparing it with MRI in breast cancer patients (n = 28). Then, we compared lipid and water signals obtained in TD-DOS and DECT from normal and tumor-tissue regions (n = 16). The TD-DOS breast measurements were carried out using reflectance geometry with a source–detector separation of 3 cm. A semicircular region of interest (ROI), with a transverse diameter of 3 cm and a depth of 2 cm that included the breast surface, was set on the DECT image. Although the measurement area differed between the modalities, the correlation coefficients of lipid and water signals between TD-DOS and DECT were rs = 0.58 (p < 0.01) and rs = 0.90 (p < 0.01), respectively. These results indicate that TD-DOS captures the characteristics of the lipid and water contents of the breast.

1. Introduction

Near-infrared spectroscopy (NIRS), in the range of 650–1000 nm, is widely used to noninvasively measure the concentration of light absorbing substances such as hemoglobin, water, and lipids in living tissues. In breast cancer studies, NIRS has been used to monitor tumor response to neoadjuvant chemotherapy (NAC), as hemoglobin, water, and lipid proportions reflect microvasculature, cellular metabolism, angiogenesis, edema, hypoxia, and necrosis [1,2,3,4,5,6,7]. These parameters are significantly altered in tumor growth and regression.
The validity of NIRS systems has generally been verified using tissue simulating phantoms such as intralipid-based aqueous phantoms [8,9] and resin-based hard phantoms [10], while phantoms with various lipid and water contents have been proposed in previous studies [11,12,13,14]. Merrit et al. and Ohmae et al. used such phantoms to compare lipid and water measurements between a diffuse optical spectroscopy (DOS) system and magnetic resonance imaging (MRI), which was defined as the “gold standard” technique [11,14]. In those studies, the authors confirmed that MRI and DOS measurements of water/lipid ratios in phantoms were almost identical. Studies using breast phantoms [13] and simulations [15] have also been conducted, but the structure of the living body is more complicated. Several studies have reported on the relationship between DOS parameters and breast density on MRI and their link with breast cancer risk [3,16,17]. Although previous studies have compared DOS with other modalities such as MRI, there have been no reports comparing DOS with other modalities in the direct measurement of lipid and water signals in the human breast. Although we previously compared lipid and water measurements of the contents of a phantom between MRI and time-domain diffuse optical spectroscopy (TD-DOS) [14], comparison of these parameters in living humans is difficult, because the measurement postures required in the two modalities differ: MRI measurement is conducted with the subject in a prone (downward facing) position, while the subject is generally in a supine (upward facing) or standing position for the DOS measurement.
Computed tomography (CT) is a cross-sectional, high-resolution, three-dimensional diagnostic imaging modality that generally uses single-energy polychromatic X-rays. Its recently increased clinical utility is primarily attributed to significantly increased scan speed as a synergic effect of increased gantry rotation speed and increased longitudinal detector coverage, as well as the development of various radiation-lowering techniques to improve patient risk/benefit ratios [18]. In many cases, chest CT scans are performed as the first choice of investigation to stage breast cancers in our hospital. Although CT has an inherent limitation in terms of soft tissue differentiation because the pixel value or CT number depends entirely on the linear attenuation coefficient, which has considerable overlap between different body materials, dual-energy CT (DECT) can improve material differentiation by using two different X-ray energy spectra.
Applications of DECT can largely be divided into exploration of material-nonspecific and material-specific energy-dependent information. Both types of evaluations can be qualitative or quantitative. The former includes virtual monoenergetic imaging, effective atomic mapping, and electron density mapping. The latter includes material decomposition, material labeling, and material highlighting [18].
In this study, we evaluated the quantitative correlations between in vivo TD-DOS and DECT signals to examine the validity of TD-DOS. The CT examination was performed in the same supine position as the TD-DOS measurement was to facilitate comparisons between the two modalities. Lipid and water contents were measured on TD-DOS by assessing tissue absorption due to the vibrational overtones of the lipid C–H bonds (930 nm) and the water O–H bond (978 nm) [11]. With a three-material decomposition algorithm, DECT can quantify the fat fraction according to the attenuation differences of tissues at varying energy levels [19]. We applied the Liver Virtual Non-contrast (VNC) application program (Siemens Healthcare, Forchheim, Germany) to measure the fat fraction in the breast. The MRI-based proton density fat fraction (PDFF) technique has been shown to provide accurate quantification of the hepatic fat fraction [20], and can also be applied to breast density measurement [21]. In the first part of this study, we confirm the accuracy of DECT by comparing the MRI-measured fat fraction of fibroglandular tissue in the normal breast with that measured using DECT, with the subjects in different postures for MRI and DECT. In the second part of this study, the lipid and water contents of normal and tumor tissues of patients with breast cancer were measured by TD-DOS, and compared with the fat and fat-free fractions measured by DECT in the supine position. The fat-free fraction of the breast is predominantly water [22].

2. Materials and Methods

2.1. Patients

DECT was used to measure the fat fraction of breast cancer and the contralateral normal breasts of 71 patients between August 2017 and August 2018.
In the first part of this study, the DECT-measured fat fraction of the normal breasts was compared with our MRI measurements. We excluded 35 patients who had not undergone an MRI examination in our hospital, five patients in whom a part of the breasts was out of the field of view on the CT, one patient whose fibroglandular tissue had a massive calcification, one patient whose MRI images were of poor quality, and one other patient who had bilateral cancer. Finally, 28 patients were included in this study. Their median age was 66 years (age range: 42–78 years).
In the second part of this study, we compared TD-DOS with DECT for a measurement of the fat and water contents of breast cancer and the contralateral normal breast. Twenty-six patients underwent both DECT and TD-DOS. We excluded four patients in whom a part of the breasts was out of the field of view on CT, one patient with small breasts that prevented the region of interest (ROI) from being placed solely on the breast, four patients who had undergone chemotherapy or hormonal therapy, and one patient for whom the optical probe could not be placed in a proper position. Finally, 16 patients with a median age of 65.5 years (with an age range of: 41–78 years), were included in the second part of the study. Twelve patients had invasive ductal carcinoma, two had ductal carcinoma in situ, one had invasive lobular carcinoma, and another had mucinous carcinoma. The mean tumor thickness measured using an ultrasonography system (US; EUB-7500, Hitachi Medical Corporation, Tokyo, Japan) with a linear probe (EUP-L65, Hitachi Medical Corporation) attached to the spectroscopic probe was 9.8 mm (range: 2–19 mm). Ten patients were included in both the first and second parts of the study.
The study protocol was approved by the Ethical Review Committee of Hamamatsu University School of Medicine. All patients signed a written informed consent form.

2.2. Magnetic Resonance Imaging (MRI) Measurement

All breast MRI examinations were performed on a 3-T magnet (Discovery 750w, GE Healthcare, Waukesha, WI, USA) using an 8-channel dedicated phased-array breast coil. The patients were examined in the prone position with both breasts symmetrically positioned in the coil. The PDFF [23,24] pulse sequence used for this study was provided by the manufacturer of the MR unit (IDEAL IQ, GE Healthcare). The pulse sequence used the multipoint Dixon technique, which uses a low flip angle to limit T1 bias, acquires six echoes to correct for T2* effects, and uses a multipeak fat model. The parameters of this sequence included: Repetition time, 8.3 ms; shortest echo time, 3.2 ms; field of view, 35 × 35 cm; matrix, 160 × 160; bandwidth, 111.1 kHz; flip angle, 4°; section thickness, 7 mm; and a single dimensional image with 24 sections. The images were processed using the software provided by the manufacturer (IDEAL IQ, GE Healthcare) to instantaneously create water, fat, R2*, and fat fraction maps.
To measure the fat fraction of fibroglandular tissue in a normal breast, a ROI was placed over the entire fibroglandular tissue shown as an intermediate intensity region at the level of the nipple on a transverse image of the fat fraction maps (Figure 1a). The fat fraction was calculated using a medical imaging system (SYNAPSE version 4.1, Fujifilm Medical, Tokyo, Japan).

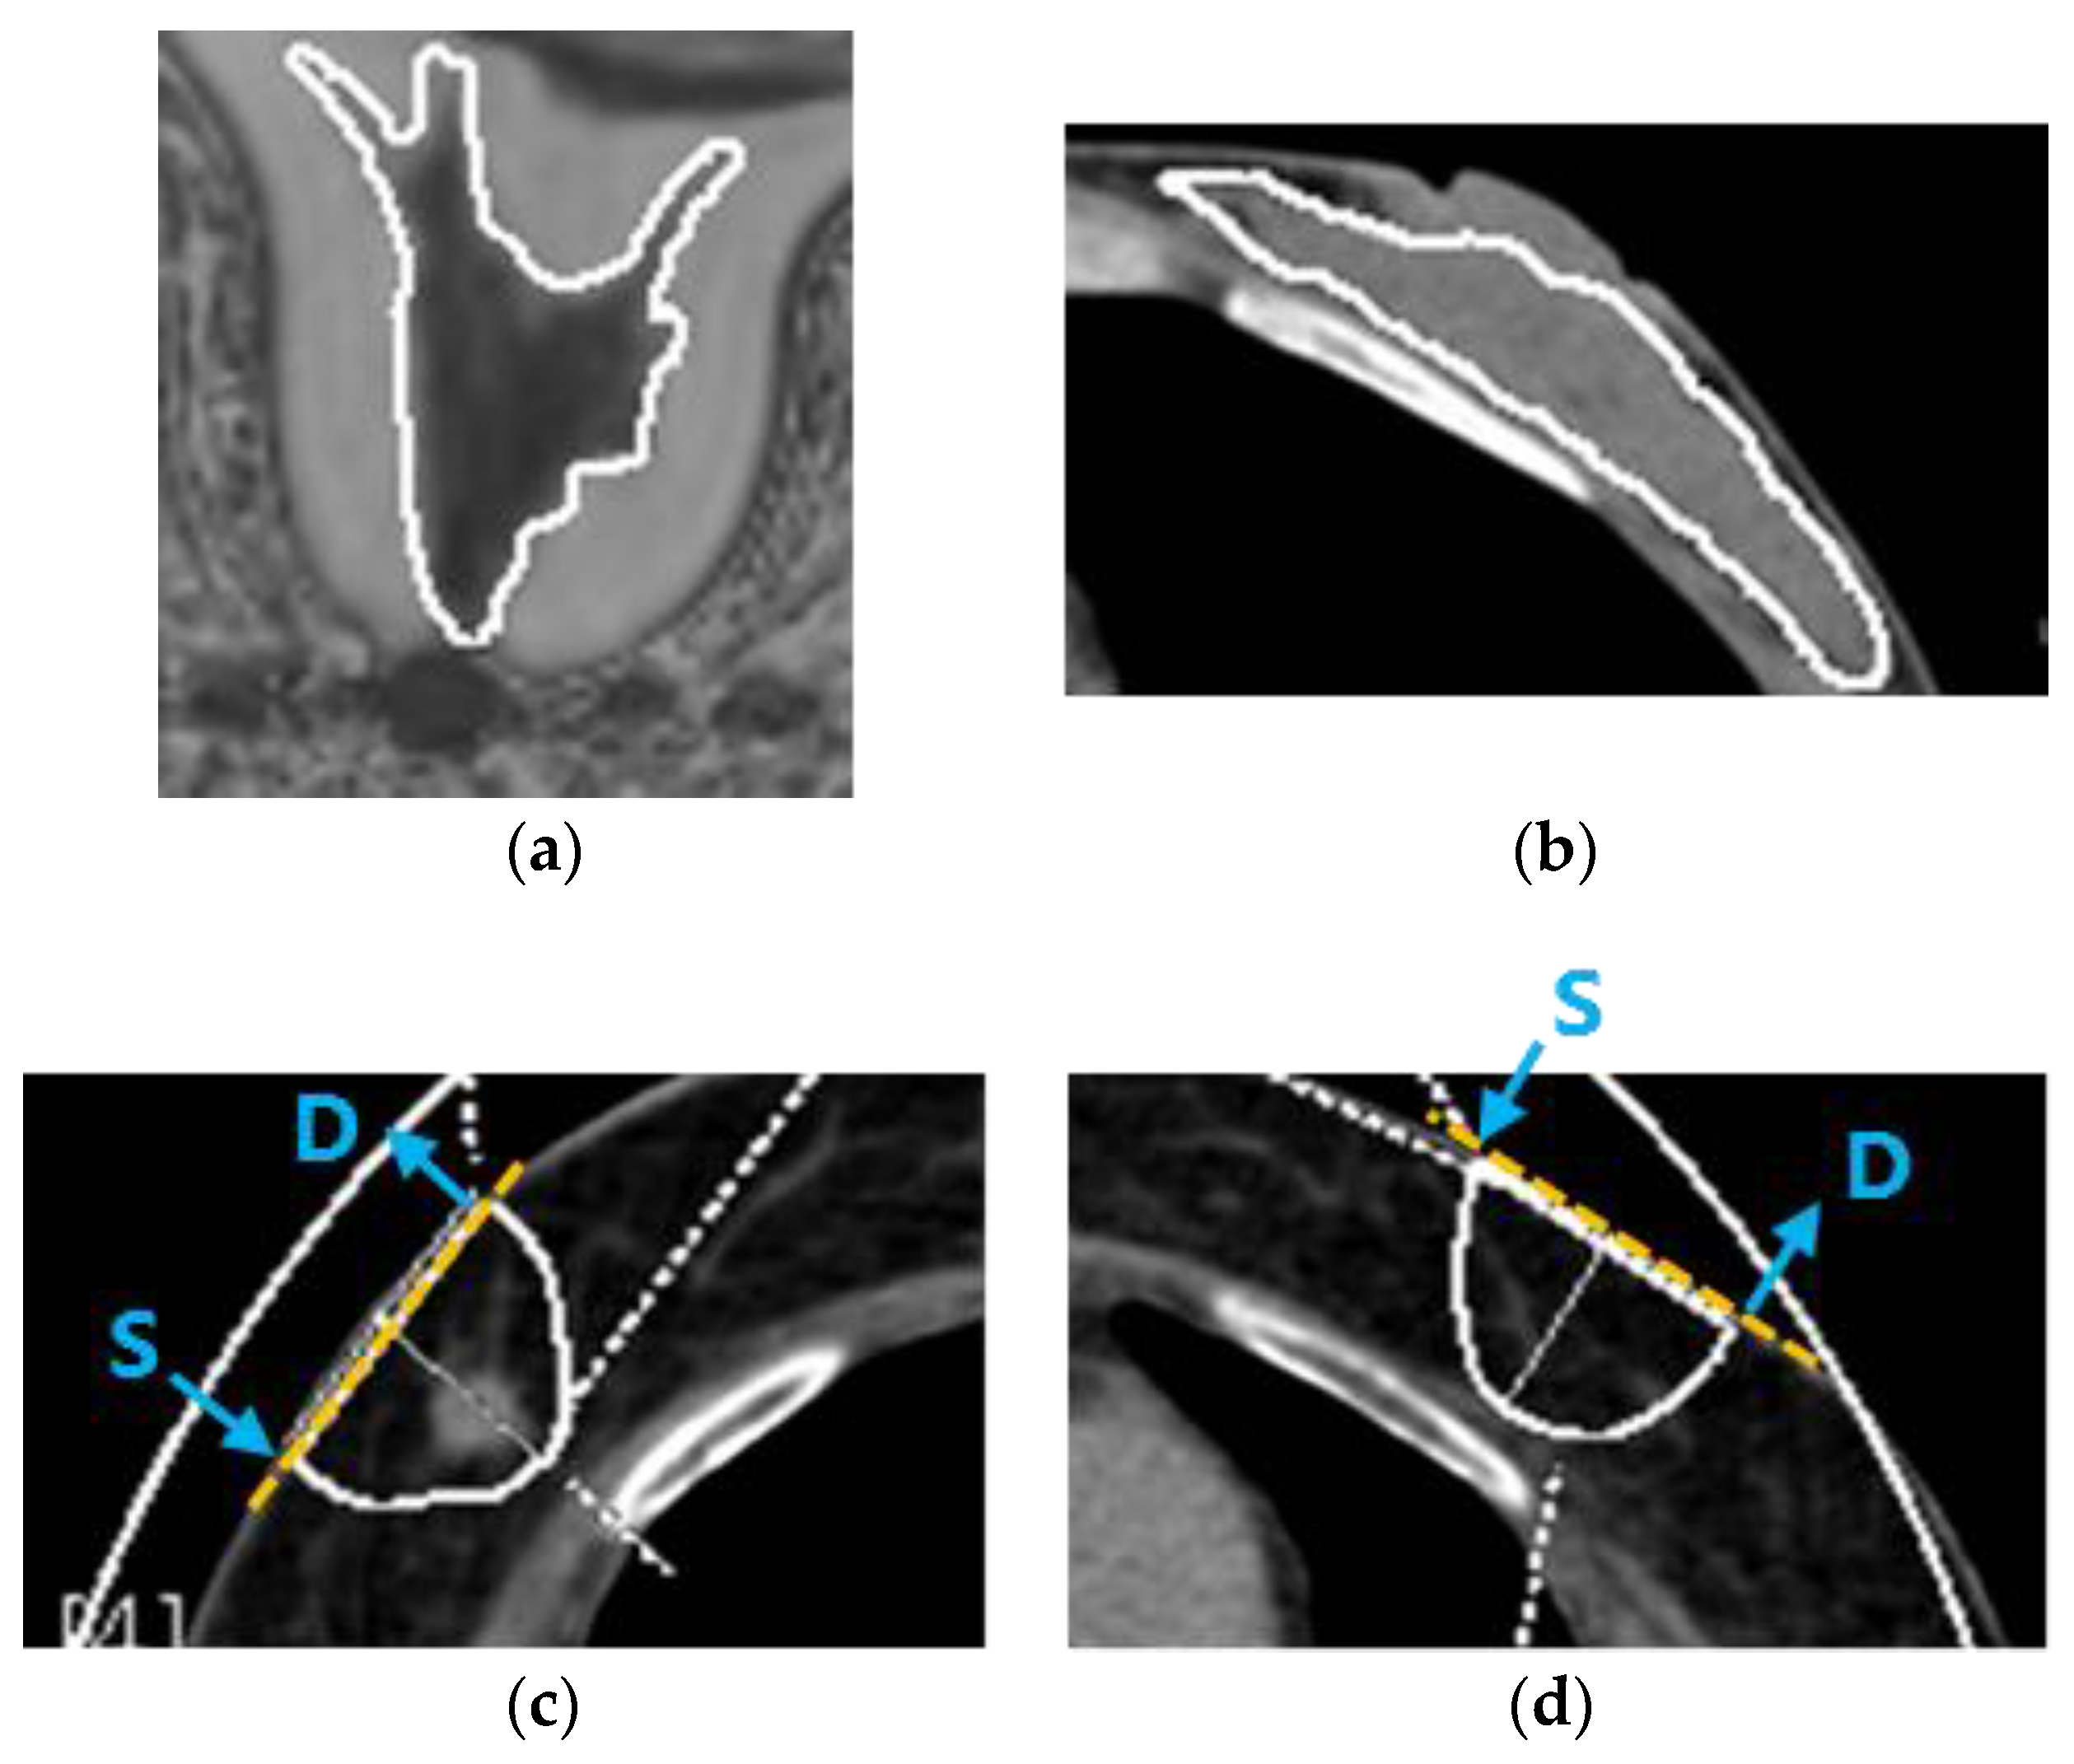
2.3. Dual-Energy Computed Tomography (DECT) Measurement

All CT examinations were performed on a dual-source multidetector-row scanner (SOMATOM Definition FLASH system, Siemens Healthcare). All patients lay in the supine position with hands raised on the scanner table. After the acquisition of lateral and anteroposterior topograms, each patient was scanned in the craniocaudal direction with their breath held after deep inspiration. Dual-energy images were acquired with an automatic exposure control system (Care dose 4D; Siemens Healthcare; Table 1).
Image data with two different tube potentials (100 kVp and 140 kVp) were processed with dual-energy software (Syngovia version VB10B; Siemens Healthcare) running on a workstation. The Liver VNC application program (Siemens Healthcare) consists of a three-material decomposition algorithm analyzing soft tissue, fat, and iodine, and their relative changes of attenuation at different peak voltages [19]. This application normally uses the CT number of the liver as the CT number of soft tissue. In this study, the CT number of breast cancer was used instead of that of the liver, with this being determined in a previous study [25]. Assuming that every voxel in the field is composed of fat, soft tissue, and iodine, this spectral algorithm generates a map that encodes not only the iodine distribution, but also the fat distribution.
In the first part of the study, a ROI was placed over the entire fibroglandular tissue, shown as an intermediate density region at the level of the nipple on a transverse image, to measure the fat fraction of fibroglandular tissue in normal breast by DECT (Figure 1b).
To measure the fat content of breast cancer by DECT in the second part of the study, an image showing the largest diameter of the tumor was selected. In general, the measurement depth of the NIRS is stated as half of the source–detector separation distance. However, Yoshizawa et al. reported that the influence of the chest wall was small, and that the tHb concentration was constant, when the skin-to-chest wall distance was 2 cm or more for the TD-DOS source–detector separation of 3 cm [26]. According to the relationship between the skin-to-chest wall distance and tHb, a semicircular ROI with a transverse diameter of 3 cm and a depth of 2 cm was placed over the tumor (Figure 1c). In the second part of the study, the fat fraction of normal breast was measured by placing the same ROI in a symmetrical area in the contralateral breast (Figure 1d). The remaining components of the fat-free fraction were calculated by subtracting the fat fraction from 100%. Ding et al. measured twenty pairs of postmortem breast samples using chemical analysis as a gold standard [22]. They reported that the breast consisted mainly of water, lipid, and protein, whose measured values were about 10–70%, 25–90%, and 0–10%, respectively. In this study, the fat-free fraction of the breast is considered to be a parameter related to water content, as the breast is low in protein.

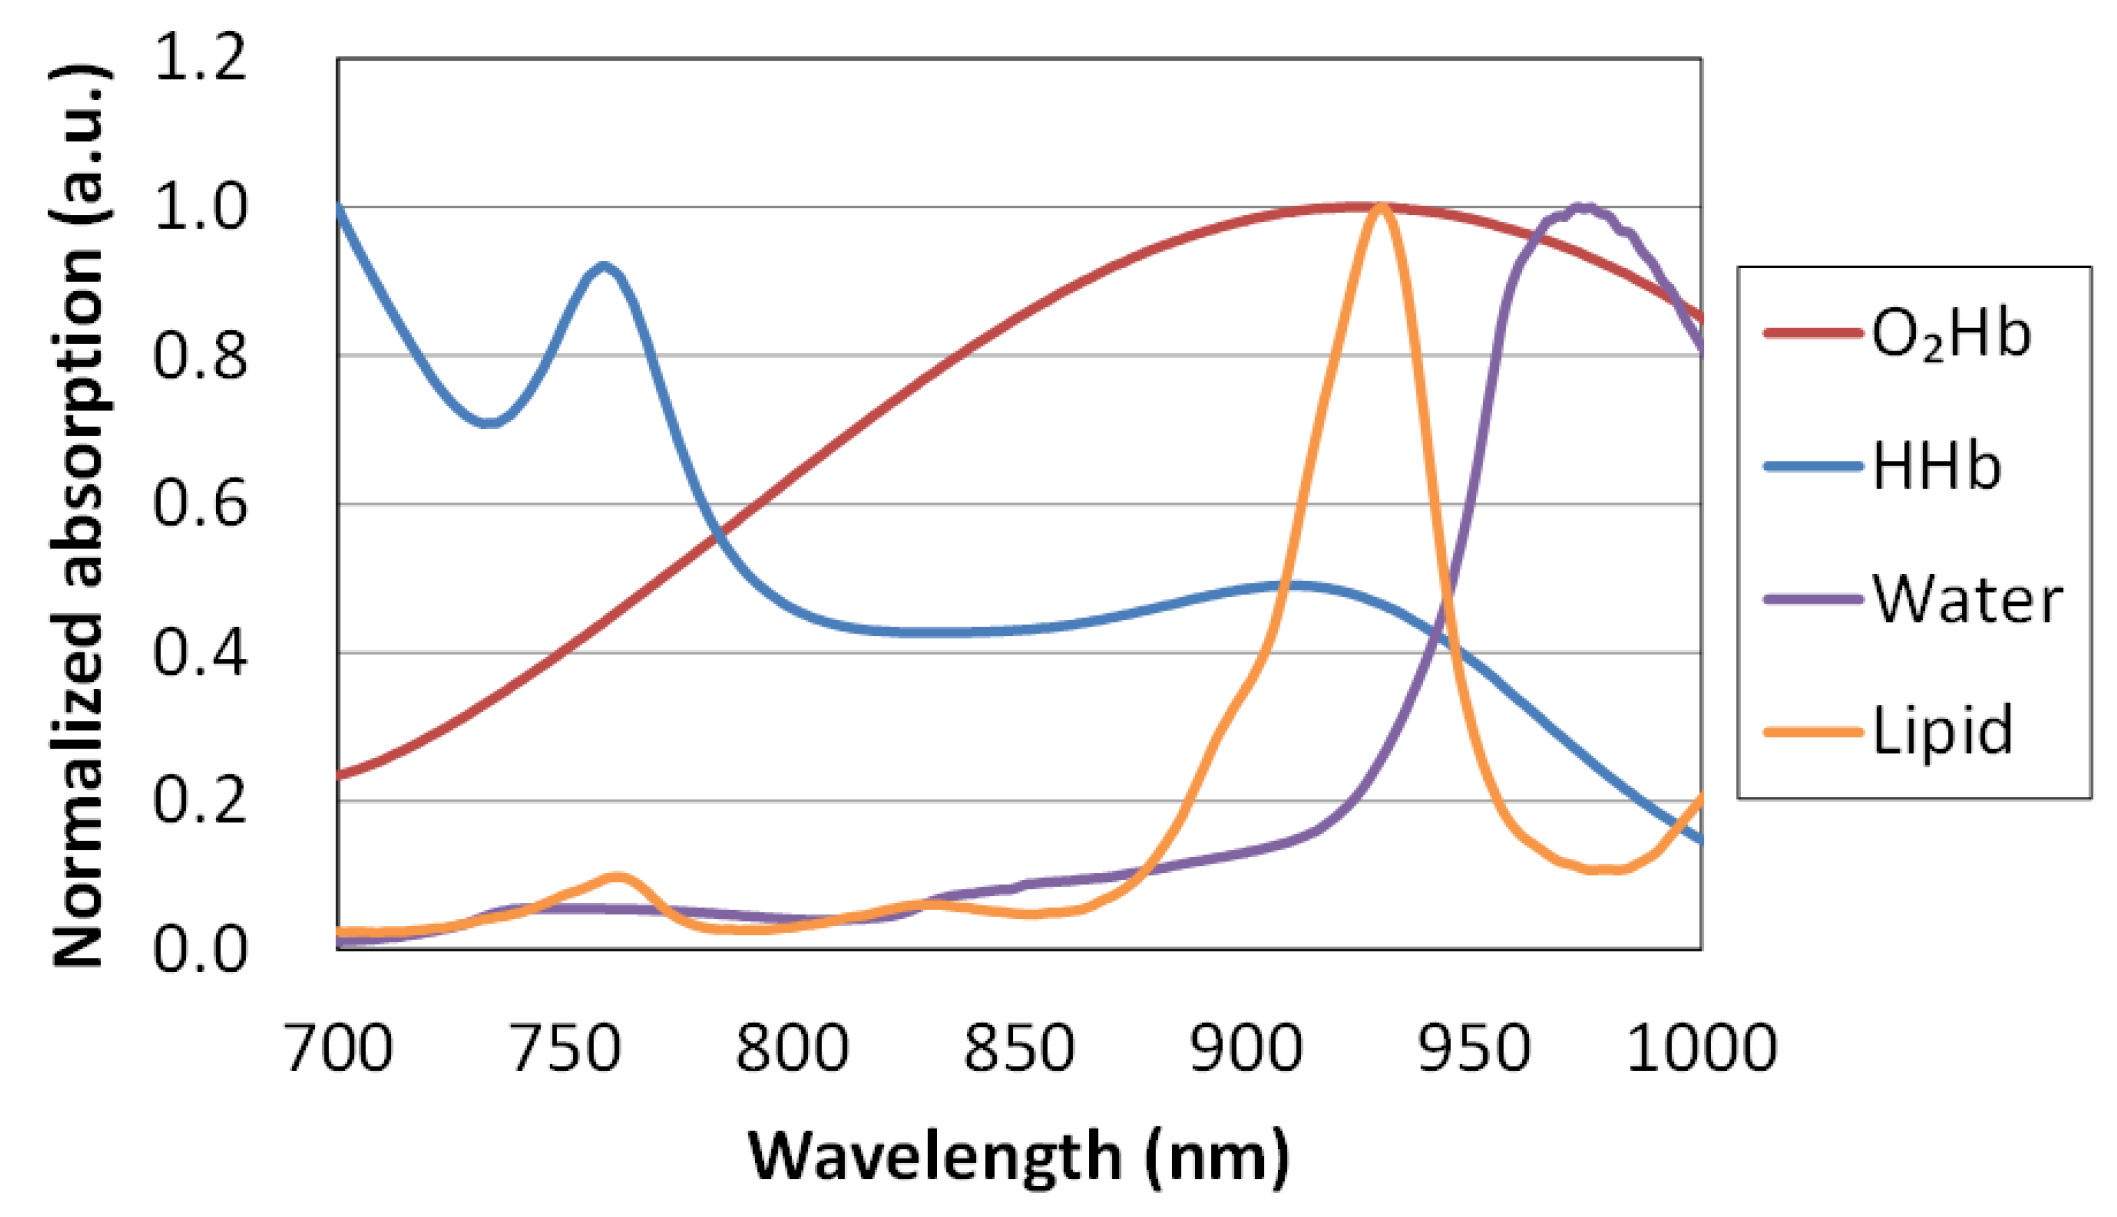
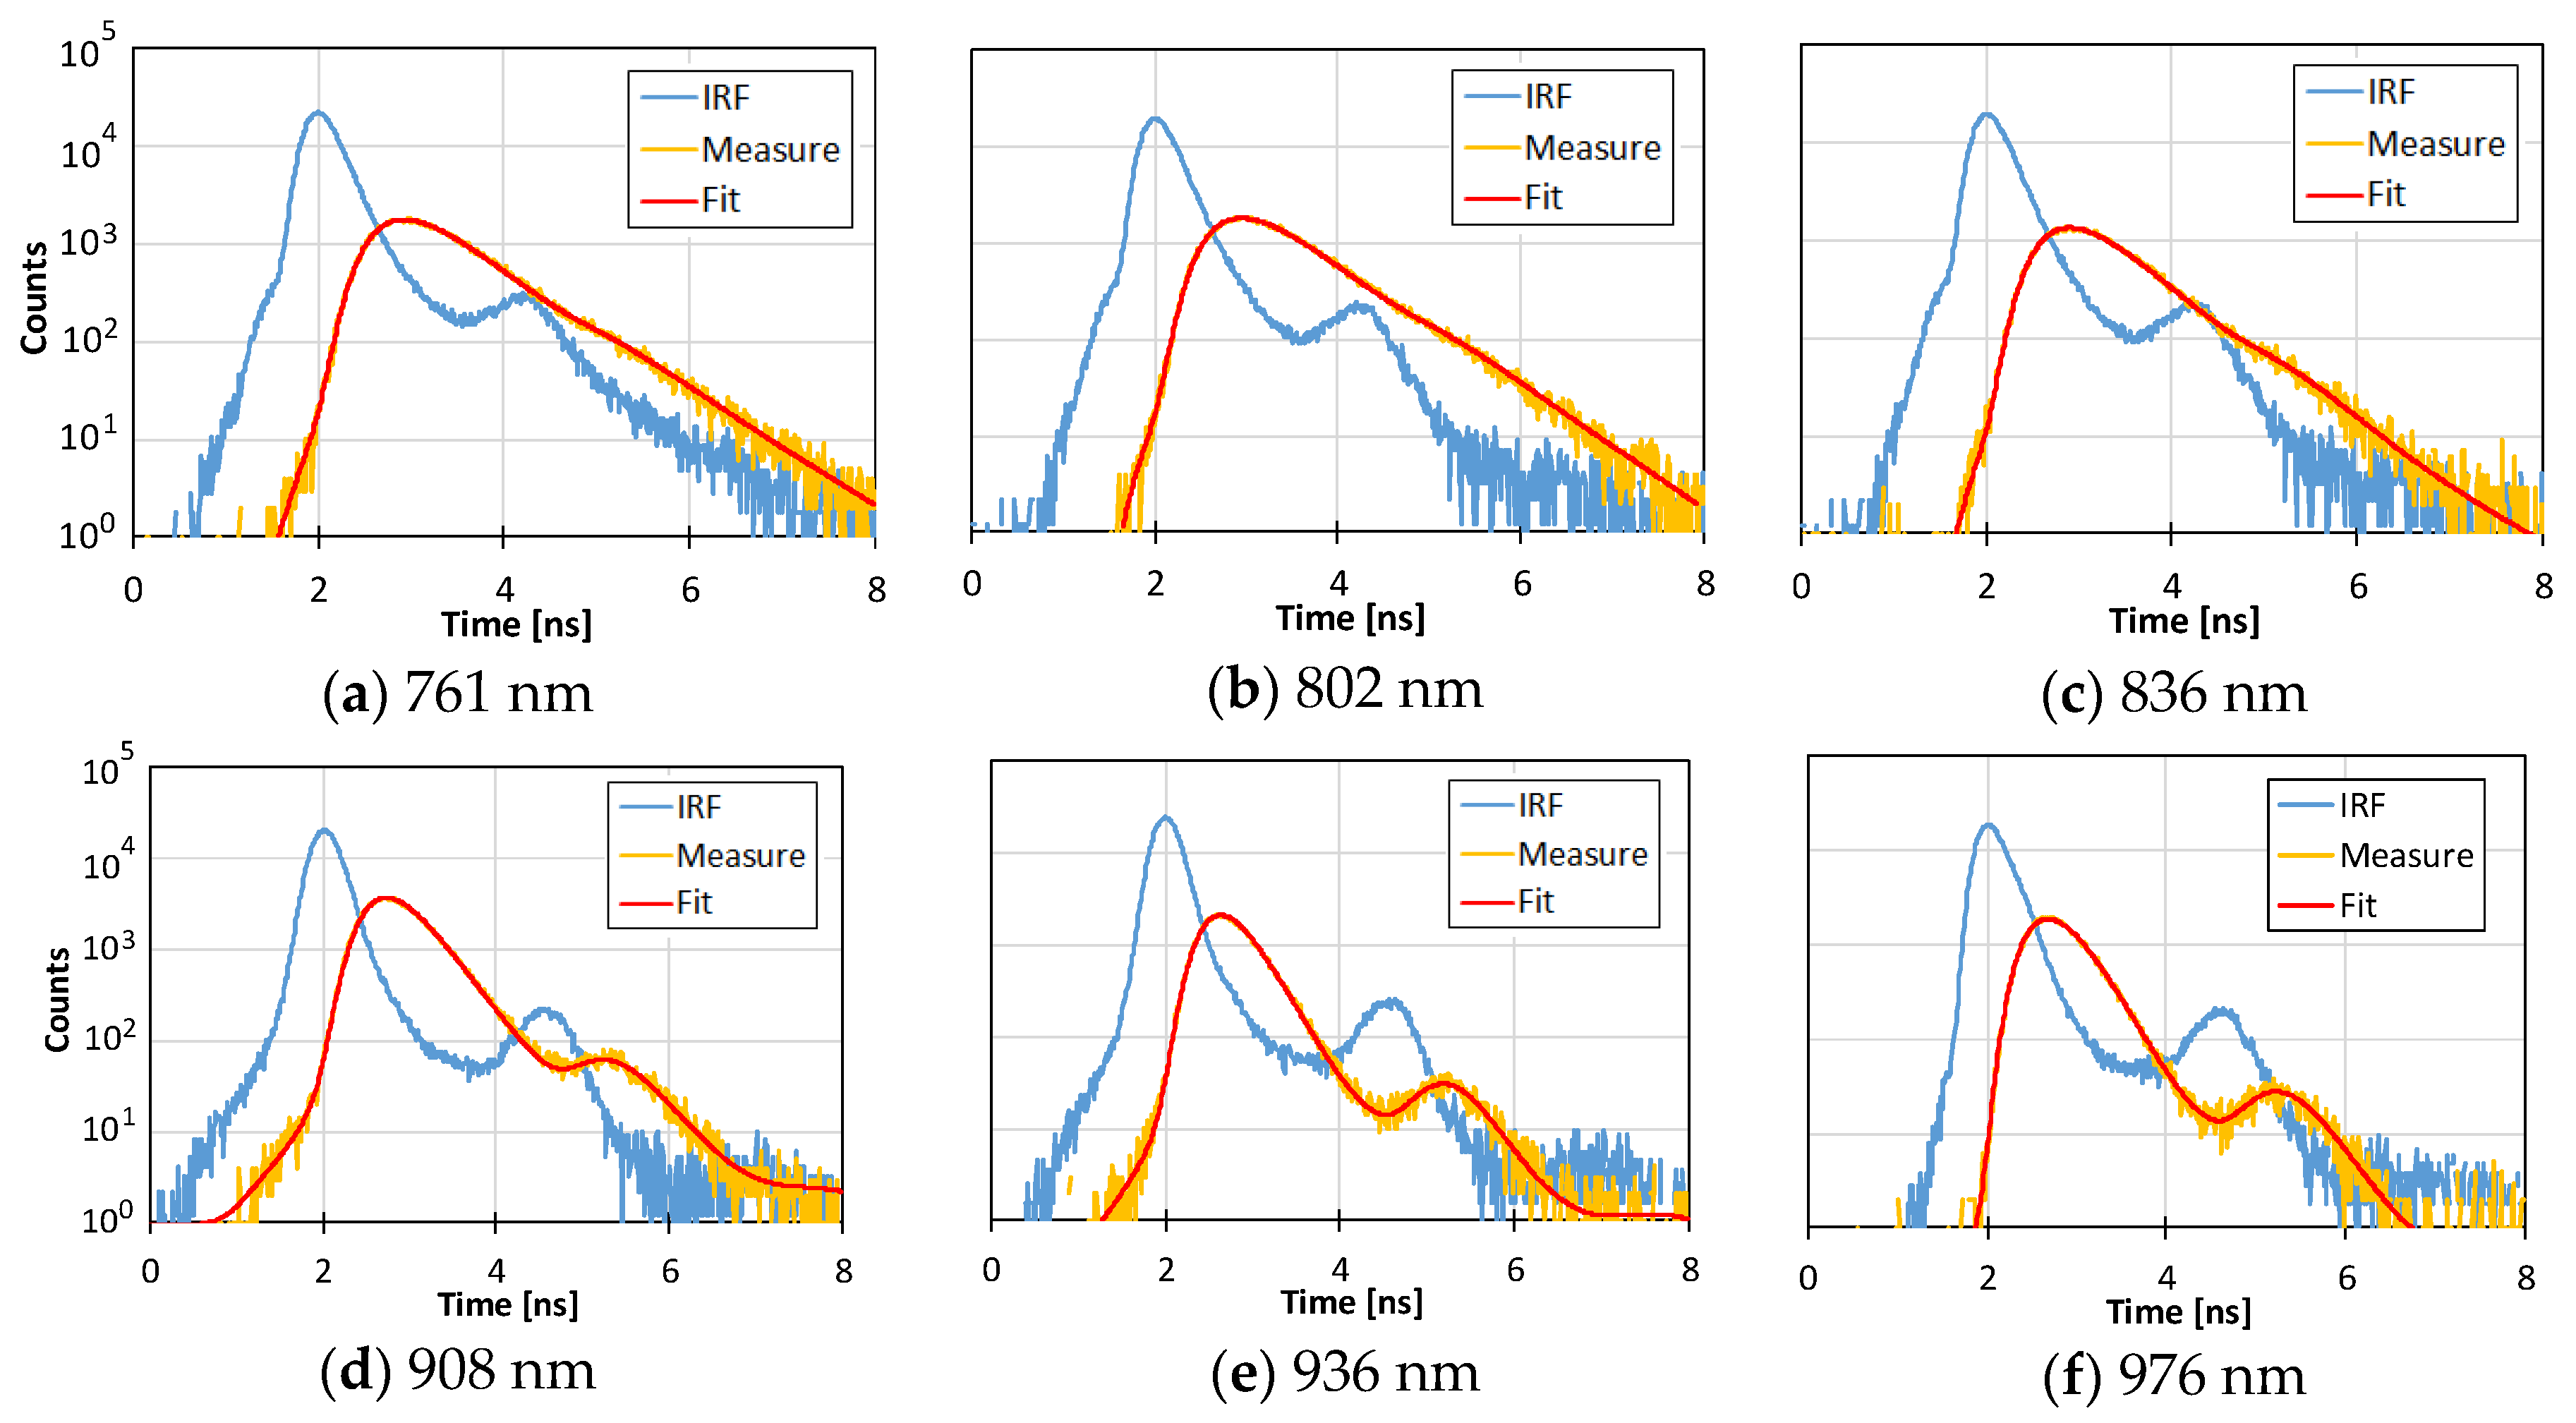
2.4. Time-Domain Diffuse Optical Spectroscopy (TD-DOS) Measurement

Our TD-DOS system (TRS-21-6W) uses the time-correlated single photon counting (TCSPC) method to measure the temporal profile of the detected light. The TRS-21-6W consists of two light source units, two photodetector units, a single photon counting (SPC) circuit, and optical fiber bundles. The light source units (custom-designed, Hamamatsu Photonics K.K., Hamamatsu, Japan) contain three laser diodes per unit (762 nm, 802 nm, and 838 nm for unit 1; 908 nm, 936 nm, and 976 nm for unit 2). Each laser diode emits a pulse 100 ps to 200 ps wide (full width at half maximum) at a repetition rate of 5 MHz. The specimen is irradiated with the pulsed laser through a 1-mm diameter source optical fiber bundle with a numerical aperture (NA) of 0.29 (Sumita Optical Glass, Inc., Saitama, Japan). The light propagating through the specimen is collected by a 3-mm diameter detection fiber bundle with an NA of 0.29 (Sumita Optical Glass, Inc.), and is guided to two photodetector units containing different photomultiplier tubes (GaAs and InGaAs PMT, Hamamatsu Photonics K.K.). The detected light is converted into an electrical signal by the photodetector units, and processed with a custom-designed SPC circuit consisting of a constant fraction discriminator, time-to-amplitude converter, an analog-to-digital converter, and histogram memory. The processed signal is acquired as a temporal profile of detected light.
The TRS-21-6W can quantify the optical properties of a specimen measured in the reflectance and transmittance geometry by analyzing the temporal profile according to photon diffusion theory. An estimated profile is calculated by convolving the instrument response function (IRF) with an analytical solution of the photon diffusion equation for a homogeneous medium, and then the μ s and μ a of the specimen are determined by fitting the estimated profile to the measured profile with a non-linear least squares method based on the Levenberg-Marquardt algorithm. The details of analyzing the temporal profiles have been described previously [14].
The major chromophores in breast tissue at near-infrared wavelengths are oxy-hemoglobin (O2Hb), deoxy-hemoglobin (HHb), water, and lipid [27], and the absorption coefficient at the wavelength λ is expressed as follows:
μ a ( λ ) = ε O 2 H b ( λ ) C O 2 H b + ε H H b ( λ ) C H H b + μ a , w a t e r 100 % ( λ ) V w a t e r + μ a , l i p i d 100 % ( λ ) V l i p i d ,
where ε m ( λ ) and C m are the molar extinction coefficient at the wavelength λ , and the concentration of the substance m , respectively, and μ a , n 100 % ( λ ) and V n are the absorption coefficient of the pure solution at the wavelength λ and the volume fraction of the substance n , respectively. Since ε m ( λ ) and μ a , n 100 % ( λ ) can be measured with a spectrophotometer, the concentrations and volume fractions are determined from μ a ( λ ) by solving the system of linear equations in Equation (1). Total hemoglobin (tHb) is derived as the sum of O2Hb and HHb. Tissue oxygen saturation (StO2) is defined as the ratio of O2Hb to tHb.
The molar extinction coefficients of O2Hb and HHb were taken from the literature by Matcher et al. [28]. The absorption spectrum of lipid that we used was reported by van Veen et al. [29]. They measured the absorption spectrum of clear purified oil obtained from lard above 36 °C. Differences in absorption spectrum have been reported according to the type of oil (e.g., lard, soybean oil, mineral oil, or cod liver oil), and this affects the estimation of its lipid content. We used the absorption spectrum of oil from mammals close to humans. The absorption spectrum of free water was measured with a spectrophotometer (U-3500, Hitachi High-Technologies Corporation, Tokyo, Japan). The spectrum of water in vivo depends on its bonding state (i.e., free water vs. bound water) [30]. Chung et al. used this slight spectral difference to show the degree of in vivo water binding as the bound water index (BWI), and reported a positive correlation between this BWI and tumor histopathological grade. Therefore, the volume fractions of water and lipid measured by TRS-21-6W are relative values compared with those of pure solutions, and not exact values [31]. Figure 2 shows the normalized absorption spectra of O2Hb, HHb, pure water and purified lard in the wavelength range of 700–1000 nm.
The breast measurements were carried out using reflectance geometry with a source–detector separation of 3 cm. To obtain the optical properties and ultrasound image of the breast simultaneously, we attached the optical fiber bundles to the ultrasound probe, as the resulting optical path is orthogonal to the ultrasound image. The optical properties along the transverse axis, and the ultrasound image in the sagittal plane, were obtained using the combined probe (Figure 1c,d). The measurements were performed at a position just above the tumor and in the symmetrical position on the healthy breast.

2.5. Statistical Analysis

All statistical tests were performed using the Statistical Package for the Social Sciences (SPSS) for Microsoft Windows version 19 (IBM Corp., Armonk, NY, USA). Data normality was tested with the Shapiro-Wilk test. The relationship between the lipid content values of fibroglandular tissue in the normal breast obtained by MRI and DECT was evaluated using Pearson’s correlation coefficients. Correlations of lipid and water contents between the DECT and TD-DOS parameters were evaluated using Spearman’s correlation coefficients. Correlation coefficients between the lipid and water contents were compared using the Fisher z-transformation. The Wilcoxon signed rank test was used to compare quantitative data between normal and tumor tissue. A value of p < 0.05 was considered statistically significant.

3. Results

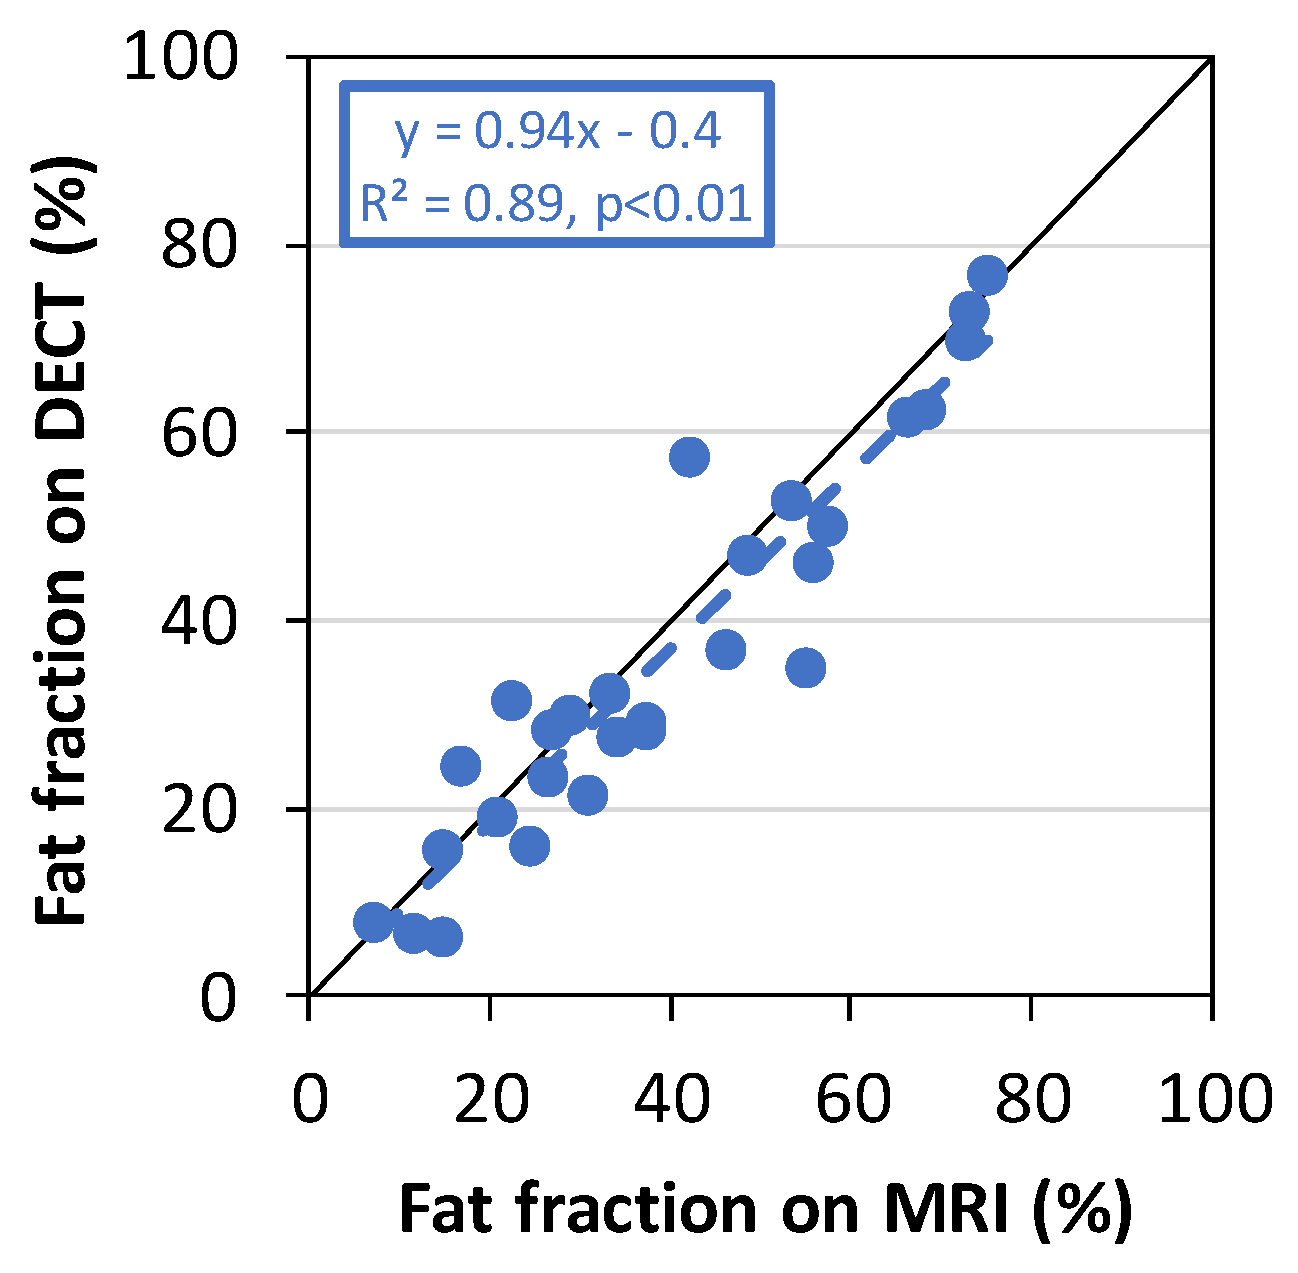
3.1. Comparison of the Fat Fraction of Fibroglandular Tissue in the Normal Breast between MRI and DECT in Different Positions

A positive correlation was found between the fat fraction measured by DECT and the fat fraction measured by MRI in the fibroglandular tissue of the normal breast. The slope and intercept of the regression line were 0.94 and 0.4, respectively (n = 28, R2 = 0.89, p < 0.01; Figure 3).

3.2. Measurement by TD-DOS and DECT in the Supine Position

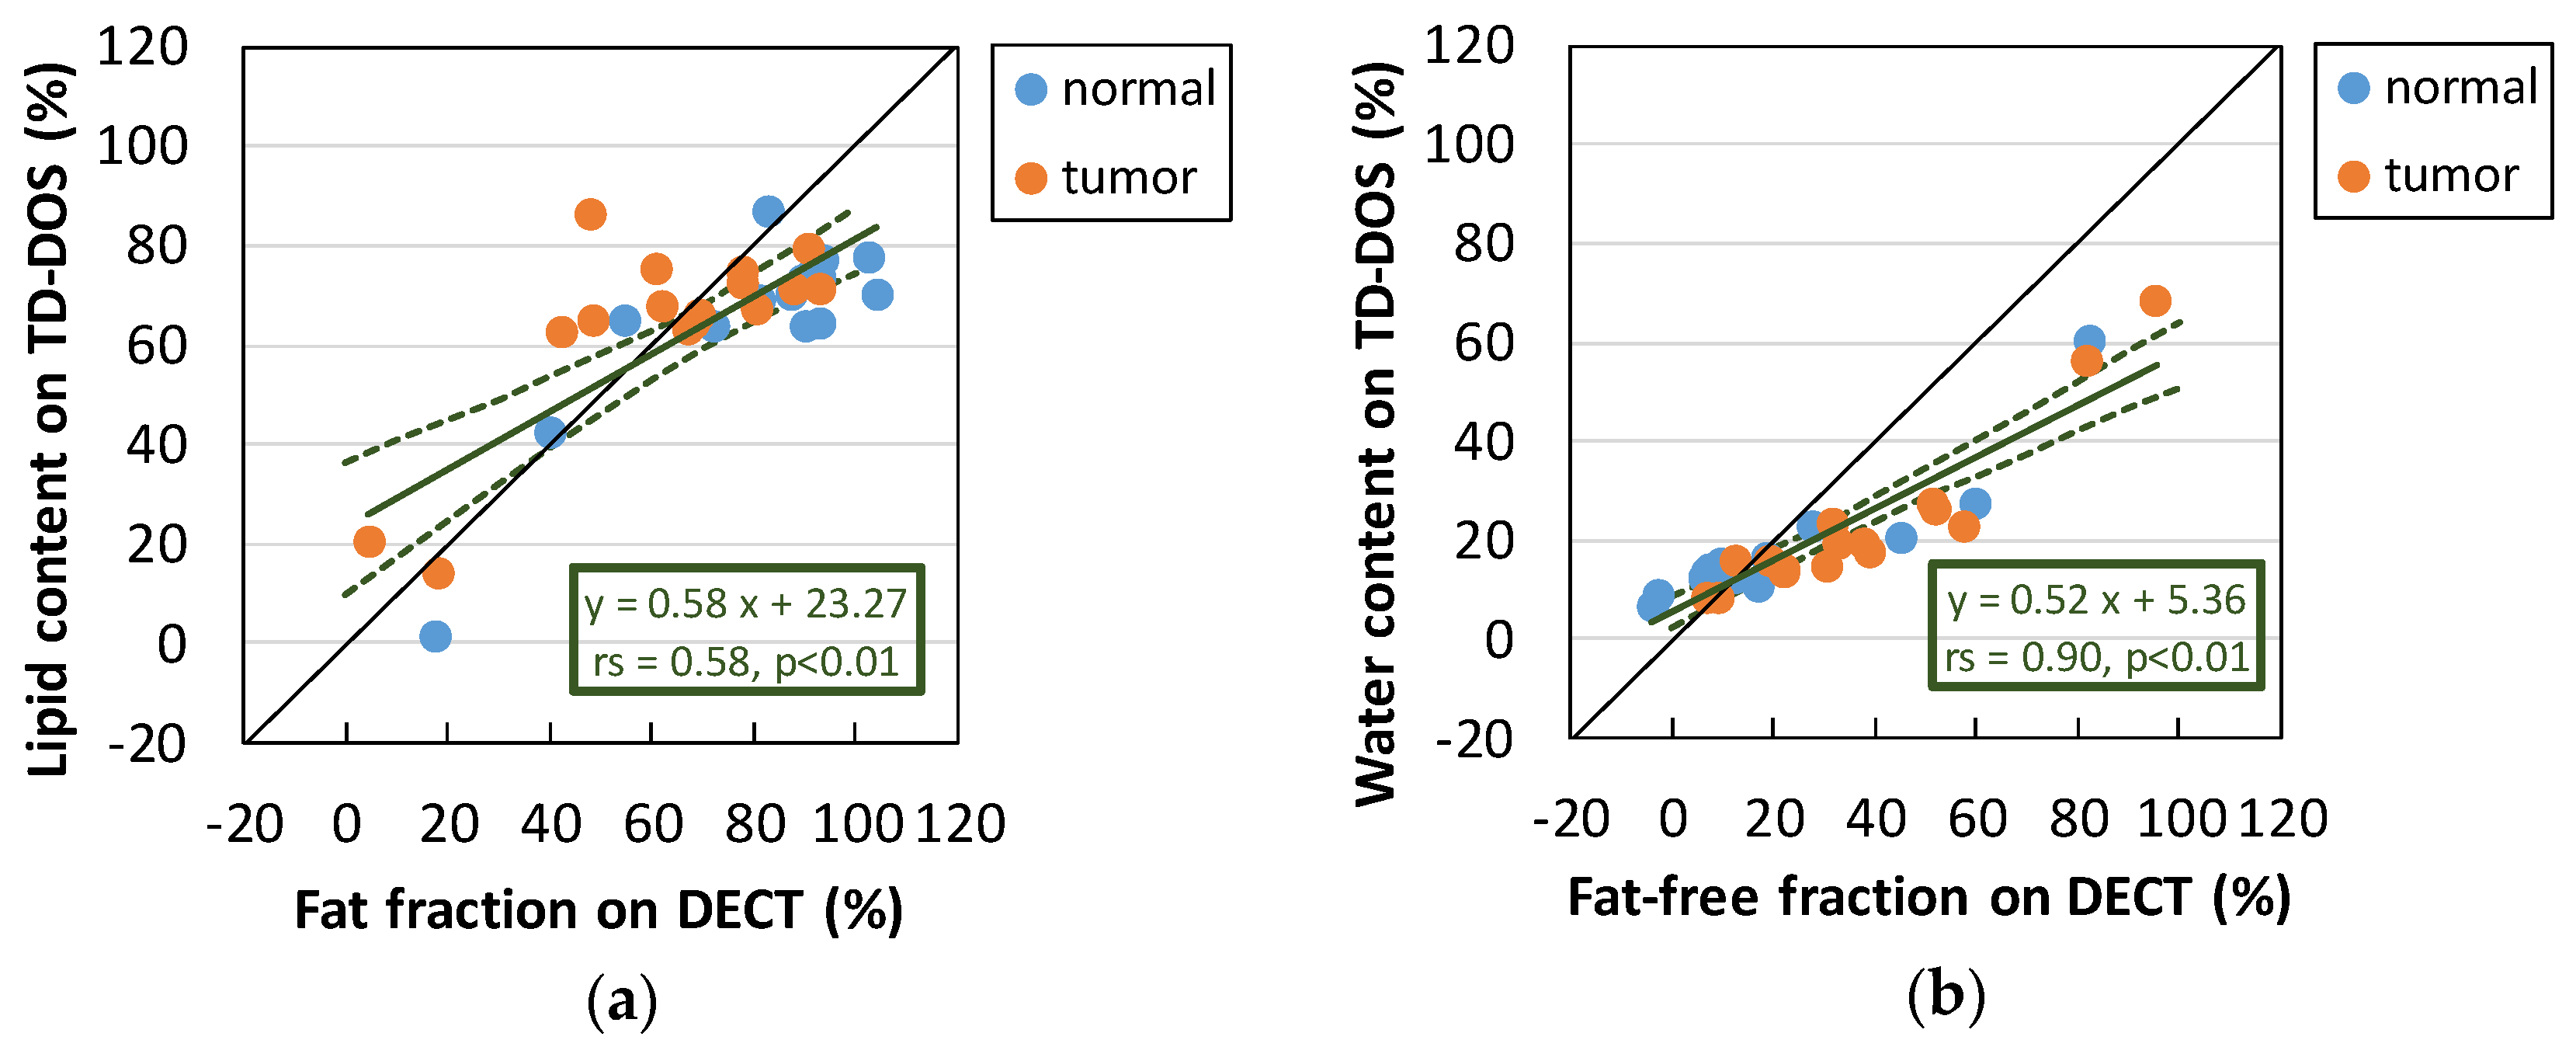
3.2.1. Comparison of Lipid and Water Contents between TD-DOS and DECT

Figure 4 shows an example of IRFs, measured temporal profiles, and the estimated profiles at 6 wavelengths obtained from TD-DOS measurement of the normal breast in a 41-year-old patient. The estimated profiles fit well with the measured temporal profiles. In this measurement, the concentration of O2Hb was 14.6 μM, that of HHb was 3.9 μM, the water content was 15.4%, and the lipid content was 63.9%.
The relationship between the lipid content estimated by TD-DOS and the fat fraction estimated by DECT measured at ROIs in normal and tumor tissue is shown in Figure 5a. A positive correlation between the lipid contents obtained by the two methods was observed, with a slope of 0.58 (95% Confidence interval (CI) = 0.40–0.76) and an intercept of 23.27 (95% CI = 9.9–36.6) (n = 16, rs = 0.58, p < 0.01). The correlation between the water and fat-free content (Figure 5b) has a slope of 0.52 (95% CI = 0.43–0.61), an intercept of 5.36 (95% CI = 2.0–8.7) (n = 16, rs = 0.90, p < 0.01), and a higher correlation coefficient than that for lipid content (p < 0.05).

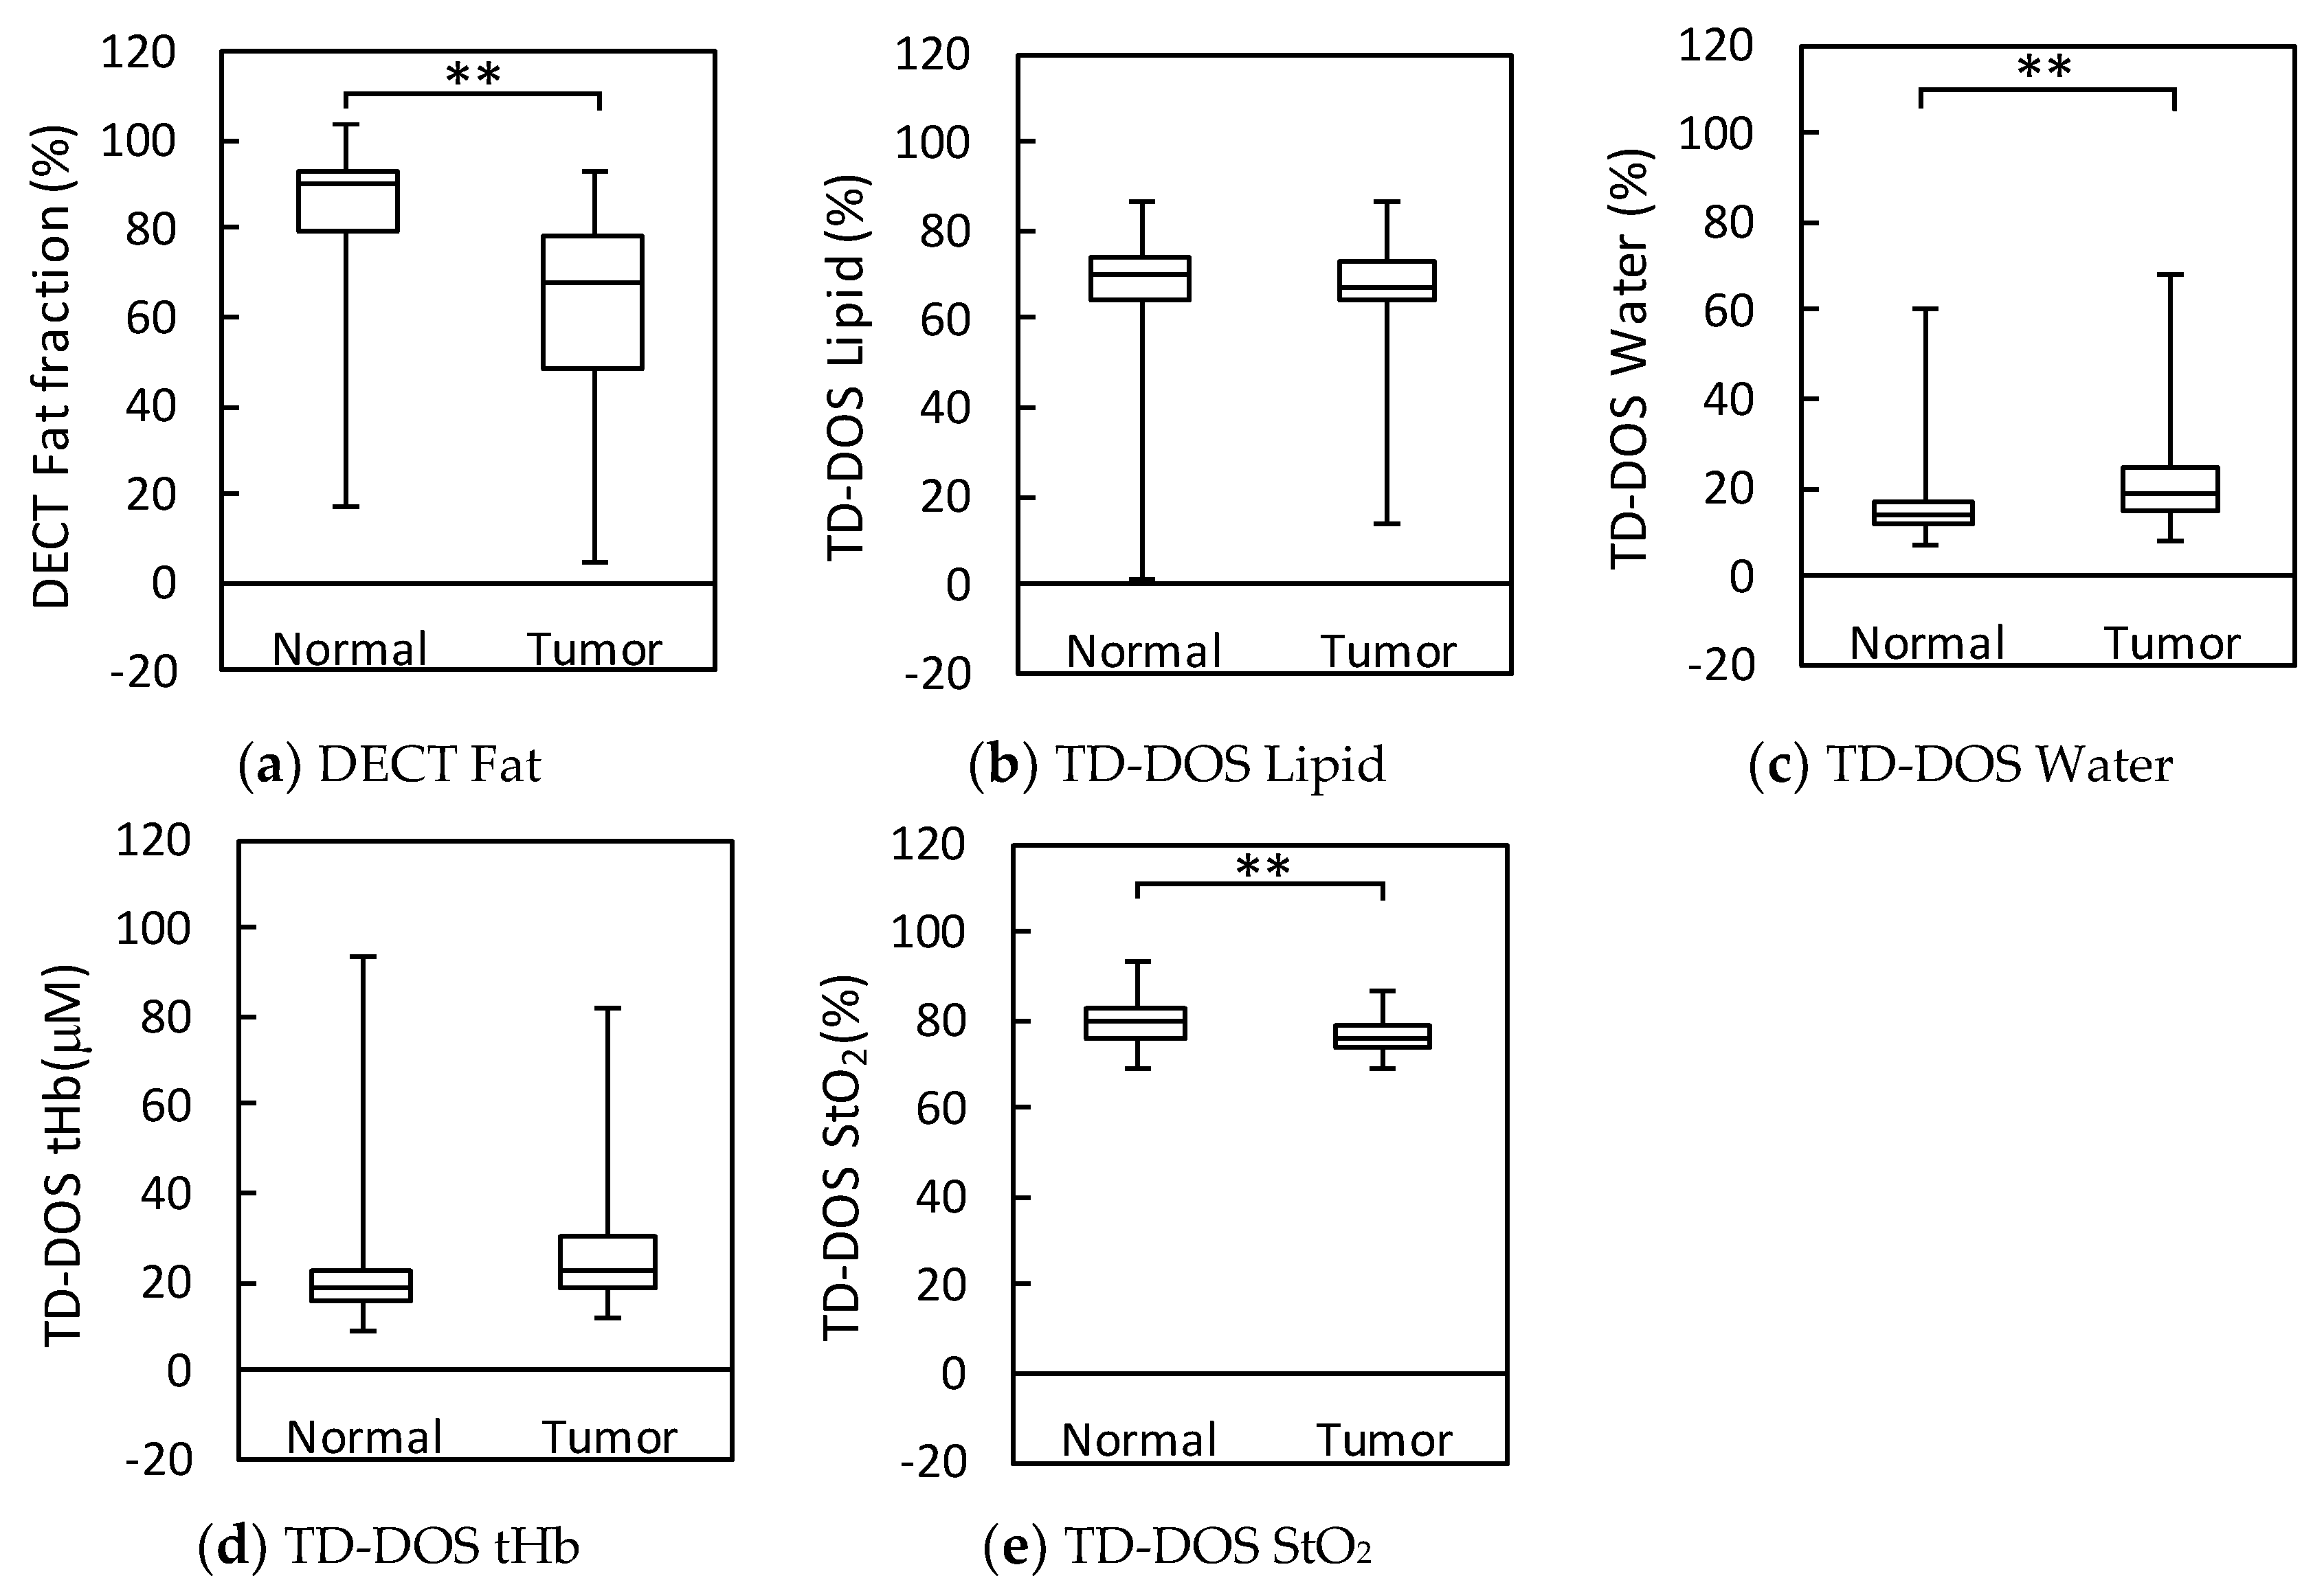
3.2.2. Normal Breast Tissue vs. Tumor Tissue

Figure 6 shows box plots of the various parameters obtained by TD-DOS and DECT for normal and tumor tissue. DECT fat measurements were significantly different between normal and tumor tissue (p < 0.01). However, TD-DOS showed a significant difference in water content and StO2, but no difference in lipid content and tHb between normal and tumor tissue.

4. Discussion

The fat fractions of fibroglandular tissue in the normal breast measured by DECT and MRI in the first part of the study were comparable (Figure 3). The differences between the two measurements could be caused by differences in the body position: DECT was acquired with the subject in a supine position, whereas MRI was acquired with the subject in the prone position. Unlike MRI, DECT can be measured in the same supine position as that used in TD-DOS. Therefore, DECT was adopted as the method for comparison with TD-DOS in the second part of the study. The tumors of patients with breast cancer and the contralateral normal breasts were measured by both methods, to assess the validity of the in vivo TD-DOS lipid and water content measurements. There were two patients whose fat fractions measured by DECT were slightly over 100%. The fat fraction can show values under 0% or over 100% due to the limitation of the calculation algorithm when the CT number measurement by DECT is close to the that in pure soft tissue or in pure fat.
Our TD-DOS system measures hemoglobin, lipid, and water contents, while the DECT measures fat fraction and the remaining components as fat-free content. The fat-free fraction of living tissue is composed of water, protein, carbohydrates, and minerals, but in this breast study, the fat-free fraction was regarded as a parameter related to water content [22]. The correlation between TD-DOS and DECT was moderate for lipid content and very strong for water content (Figure 5). These results show that TD-DOS captures the characteristics of the lipid and water contents of the breast. Although the correlation for lipid was lower than that for water content, a moderate correlation was still found for the lipid. However, the 95% CI of the slope and the intercept for the lipid were wider than those for water due to the small number of patients with very low lipid levels (n = 3). The absorption peaks of lipid and water are around 936 and 976 nm, respectively. The accuracy for lipid may be lower than that for water because the absorption coefficient at 936 nm is affected by water absorption, which is also high at this wavelength. A similar trend was also shown in the absorption coefficient results from phantoms with various proportions of water and lipid in our previous study [14]. The absorption coefficient at 976 nm reflected the relative amount of water in the phantom, whereas the absorption coefficient at 936 nm did not necessarily reflect the relative amount of lipid in the phantom. Taroni et al. used seven wavelengths from 635 to 1060 nm to measure collagen as an important biomarker in a pathological classification [32]. They stated that 635 and 1060 nm were very effective wavelengths for collagen identification. They also reported that the presence or absence of collagen affects the calculation of other parameters [33]. The level of collagen varies with age, body mass index (BMI), and breast density [17,34], and is reported to be involved in tumor development and progression [32]. It is difficult to measure collagen with the wavelengths of 760–1000 nm used in this study, as the absorption of collagen is lower than that of water and lipid at those wavelengths, and the spectral peak positions of lipid and collagen are similar within this wavelength range [33]. In future study, we need to investigate whether or not individual differences in collagen affect the lipid results calculated from similar spectra using water/lipid phantoms with added collagen.
There was much less dynamic range in TD-DOS than DECT for both lipid and water. The regression slope between the TD-DOS and DECT measurements of the breast tissues was 0.5–0.6, lower than that of a water/lipid phantom [14]. There are several possible reasons for this. For DECT measurement, a semicircular ROI with depth 2 cm, including the breast surface, was set on a 1-mm-thick DECT image. In contrast, the optical path of TD-DOS is spatial and banana-shaped [35], and the measurement region differs from the ROI used on the DECT images. Furthermore, the TD-DOS method is less affected by the superficial layer, but more sensitive to deeper regions than other DOS methods [36,37,38]. In this study, the depth of ROI was determined as 2 cm based on the relationship between the skin-to-chest wall distance and the tHb [26]. In the case of breast measurement, the absorption in the 900 nm region, which reflects the characteristics of water and lipid, is fairly high compared with the absorption at 750–850 nm reflecting the characteristics of hemoglobin. It causes difficulty in detection of the photons which have passed through the deeper region in the 900 nm range. Therefore, it is expected that the water and lipid contents obtained by TD-DOS reflect the information within the region shallower than 2 cm. In addition, the fat and fat-free fractions obtained by DECT change according to the size of ROI due to the heterogeneity of the breast tissue. For that reason, the regression slope in Figure 5 will be improved by employing a ROI that has more appropriate depth.
Several reports have compared DOS-measured physiological parameters between normal and tumor breast tissue [4,27,39,40,41]. In tumor tissue, tHb and water are higher than those in normal tissue, while lipid is lower. A significant reduction in StO2 in tumor caused by tissue hypoxia due to metabolically active tumor cells has been reported [39,41], but results showing no significant differences have also been reported [27]. High tHb reflects angiogenesis as a tumor grows, and Ueda et al. described the association between tHb level estimated by TD-DOS and mitotic count score evaluated as a proliferation marker, or SUVmax on FDG PET/CT [4]. High water content and low lipid content of tumors compared with normal tissue has also been reported using magnetic resonance spectroscopy (MRS) [42]. The high water content indicates edema and increased cellularity [43]. As breast tumors grow, adipose tissue is extruded, so a decrease in lipid content is predicted. Our results showed a significant difference in water and StO2 between tumor and normal tissue. Although tHb and lipid did not show a significant difference, tHb tended to be higher in the tumor (p = 0.063). In this study, differences in these parameters may not have been observed because the tumors were smaller in size than those in the previous report or because the number of cases was small. When all 32 patients, including ones only measured by TD-DOS (untreated patients, excluding one case with the probe resting on the nipple, and 2 cases with a hematoma near the tumor) were analyzed using the Wilcoxon signed rank test, and significant differences in the parameters became clear as the number of cases increased. We confirmed a significant decrease in lipid (p = 0.0043) and an increase in tHb (p = 0.0032) in tumor, as described in previous reports [27,41].
The present study has some limitations. Since the number of patients was small, especially the number of patients with very low lipid content, the regression line between TD-DOS and DECT for lipid might be affected by this scarcity of lipid data. Furthermore, due to the small tumor size, some parameters (tHb and lipid) showed no significant difference between normal and tumor, unlike other cases reported in the literature.
It has been reported that skin-to-chest wall distance, depth of the tumor, and thickness of the tumor, all affect the measurement values of breast cancer [26,44]. Yoshizawa et al. proposed tHbnet as an index of tHb for tumors in order to improve the evaluation of tumors by reducing the effect of the skin-to-chest wall distance, which differs among individuals. This measurement used a standard curve of tHb and skin-to-chest wall distance for a normal breast [44]. In addition, a tissue optical index (TOI) combining water, lipid, and HHb has also been proposed as a contrast function for cancer and normal tissue [27]. It has been reported that a TOI used during the intermediate period of treatment is an effective predictor of clinical response to NAC [5]. In this study, we used DECT to confirm that TD-DOS reflects the characteristics of lipid and water contents in breasts in vivo. We plan to conduct a further study monitoring the effects of chemotherapy on breast cancer patients. This evaluation was conducted using single-point measurements, but it is expected that the contrast between tumor and normal tissue will be clearer using two- or three-dimensional images and multipoint measurements [4,45].

Author Contributions

Conceptualization, N.Y. and E.O.; software, K.Y., H.W., and T.M.; formal analysis, E.O., N.Y., K.Y., and M.H.; investigation, N.Y., H.W., and T.M.; resources, Y.A. and H.O.; writing—original draft preparation, E.O. and N.Y.; writing—review and editing, H.W. and K.Y.; supervision, Y.Y., H.S., and Y.U.; All authors discussed the results and contributed to the final manuscript.

Funding

This research was partially funded by Japan Society for the Promotion of Science (JSPS) KAKENHI Grant Numbers (JP15K19781 and JP17H03591).

Acknowledgments

We are grateful to Toshiaki Saeki and Shigeto Ueda, Department of Breast Oncology, International medical Center, Saitama Medical University, for useful discussions. We would like to thank Yuki Hirai and Naoko Hyodo, Department of Diagnostic Radiology & Nuclear Medicine, Hamamatsu University School of Medicine, for acquiring the consent forms from the patients for DECT and MRI.

Conflicts of Interest

The authors declare no conflict of interest.

References

  1. Roblyer, D.; Ueda, S.; Cerussi, A.; Tanamai, W.; Durkin, A.; Mehta, R.; Hsiang, D.; Butler, J.A.; McLaren, C.; Chen, W.-P.; et al. Optical imaging of breast cancer oxyhemoglobin flare correlates with neoadjuvant chemotherapy response one day after starting treatment. Proc. Natl. Acad. Sci. USA 2011, 108, 14626–14631. [Google Scholar] [CrossRef] [PubMed] [Green Version]
  2. Ueda, S.; Roblyer, D.; Cerussi, A.; Durkin, A.; Leproux, A.; Santoro, Y.; Xu, S.; O’Sullivan, T.D.; Hsiang, D.; Mehta, R.; et al. Baseline Tumor Oxygen Saturation Correlates with a Pathologic Complete Response in Breast Cancer Patients Undergoing Neoadjuvant Chemotherapy. Cancer Res. 2012, 72, 4318–4328. [Google Scholar] [CrossRef]
  3. O’Sullivan, T.D.; Leproux, A.; Chen, J.-H.; Bahri, S.; Matlock, A.; Roblyer, D.; McLaren, C.E.; Chen, W.-P.; Cerussi, A.E.; Su, M.-Y.; et al. Optical imaging correlates with magnetic resonance imaging breast density and revealscomposition changes during neoadjuvant chemotherapy. Breast Cancer Res. 2013, 15, R14. [Google Scholar] [CrossRef]
  4. Ueda, S.; Nakamiya, N.; Matsuura, K.; Shigekawa, T.; Sano, H.; Hirokawa, E.; Shimada, H.; Suzuki, H.; Oda, M.; Yamashita, Y.; et al. Optical imaging of tumor vascularity associated with proliferation and glucose metabolism in early breast cancer: Clinical application of total hemoglobin measurements in the breast. BMC Cancer 2013, 13, 514. [Google Scholar] [CrossRef]
  5. Tromberg, B.J.; Zhang, Z.; Leproux, A.; O’Sullivan, T.D.; Cerussi, A.E.; Carpenter, P.M.; Mehta, R.S.; Roblyer, D.; Yang, W.; Paulsen, K.D.; et al. Predicting Responses to Neoadjuvant Chemotherapy in Breast Cancer: ACRIN 6691 Trial of Diffuse Optical Spectroscopic Imaging. Cancer Res. 2016, 76, 5933–5944. [Google Scholar] [CrossRef]
  6. Ueda, S.; Saeki, T.; Takeuchi, H.; Shigekawa, T.; Yamane, T.; Kuji, I.; Osaki, A. In vivo imaging of eribulin-induced reoxygenation in advanced breast cancer patients: A comparison to bevacizumab. Br. J. Cancer 2016, 114, 1212–1218. [Google Scholar] [CrossRef] [PubMed]
  7. Xu, C.; Vavadi, H.; Merkulov, A.; Li, H.; Erfanzadeh, M.; Mostafa, A.; Gong, Y.; Salehi, H.; Tannenbaum, S.; Zhu, Q. Ultrasound-Guided Diffuse Optical Tomography for Predicting and Monitoring Neoadjuvant Chemotherapy of Breast Cancers: Recent Progress. Ultrason. Imaging 2016, 38, 5–18. [Google Scholar] [CrossRef]
  8. Spinelli, L.; Martelli, F.; Farina, A.; Pifferi, A.; Torricelli, A.; Cubeddu, R.; Zaccanti, G. Calibration of scattering and absorption properties of a liquid diffusive medium at NIR wavelengths. Time-resolved method. Opt. Express 2007, 15, 6589. [Google Scholar] [CrossRef] [PubMed]
  9. Spinelli, L.; Botwicz, M.; Zolek, N.; Kacprzak, M.; Milej, D.; Sawosz, P.; Liebert, A.; Weigel, U.; Durduran, T.; Foschum, F.; et al. Determination of reference values for optical properties of liquid phantoms based on Intralipid and India ink. Biomed. Opt. Express 2014, 5, 2037. [Google Scholar] [CrossRef]
  10. Pogue, B.W.; Patterson, M.S. Review of tissue simulating phantoms for optical spectroscopy, imaging and dosimetry. J. Biomed. Opt. 2006, 11, 041102. [Google Scholar] [CrossRef] [PubMed]
  11. Merritt, S.; Gulsen, G.; Chiou, G.; Chu, Y.; Deng, C.; Cerussi, A.E.; Durkin, A.J.; Tromberg, B.J.; Nalcioglu, O. Comparison of Water and Lipid Content Measurements Using Diffuse Optical Spectroscopy and MRI in Emulsion Phantoms. Technol. Cancer Res. Treat. 2003, 2, 563–569. [Google Scholar] [CrossRef] [PubMed] [Green Version]
  12. Nachabé, R.; Hendriks, B.H.W.; Desjardins, A.E.; van der Voort, M.; van der Mark, M.B.; Sterenborg, H.J.C.M. Estimation of lipid and water concentrations in scattering media with diffuse optical spectroscopy from 900 to 1600 nm. J. Biomed. Opt. 2010, 15, 037015. [Google Scholar] [CrossRef] [PubMed] [Green Version]
  13. Michaelsen, K.E.; Krishnaswamy, V.; Shenoy, A.; Jordan, E.; Pogue, B.W.; Paulsen, K.D. Anthropomorphic breast phantoms with physiological water, lipid, and hemoglobin content for near-infrared spectral tomography. J. Biomed. Opt. 2014, 19, 026012. [Google Scholar] [CrossRef] [Green Version]
  14. Ohmae, E.; Yoshizawa, N.; Yoshimoto, K.; Hayashi, M.; Wada, H.; Mimura, T.; Suzuki, H.; Homma, S.; Suzuki, N.; Ogura, H.; et al. Stable tissue-simulating phantoms with various water and lipid contents for diffuse optical spectroscopy. Biomed. Opt. Express 2018, 9, 5792. [Google Scholar] [CrossRef] [PubMed]
  15. Prince, S.; Malarvizhi, S. Monte Carlo simulation of NIR diffuse reflectance in the normal and diseased human breast tissues. BioFactors 2007, 30, 255–263. [Google Scholar] [CrossRef] [PubMed]
  16. Brooksby, B.; Pogue, B.W.; Jiang, S.; Dehghani, H.; Srinivasan, S.; Kogel, C.; Tosteson, T.D.; Weaver, J.; Poplack, S.P.; Paulsen, K.D. Imaging breast adipose and fibroglandular tissue molecular signatures by using hybrid MRI-guided near-infrared spectral tomography. Proc. Natl. Acad. Sci. USA 2006, 103, 8828–8833. [Google Scholar] [CrossRef] [Green Version]
  17. Taroni, P.; Pifferi, A.; Quarto, G.; Spinelli, L.; Torricelli, A.; Abbate, F.; Villa, A.; Balestreri, N.; Menna, S.; Cassano, E.; et al. Noninvasive assessment of breast cancer risk using time-resolved diffuse optical spectroscopy. J. Biomed. Opt. 2010, 15, 060501. [Google Scholar] [CrossRef] [PubMed]
  18. Goo, H.W.; Goo, J.M. Dual-Energy CT: New Horizon in Medical Imaging. Korean J. Radiol. 2017, 18, 555–569. [Google Scholar] [CrossRef] [Green Version]
  19. Ascenti, G.; Mazziotti, S.; Lamberto, S.; Bottari, A.; Caloggero, S.; Racchiusa, S.; Mileto, A.; Scribano, E. Dual-Energy CT for Detection of Endoleaks After Endovascular Abdominal Aneurysm Repair: Usefulness of Colored Iodine Overlay. Am. J. Roentgenol. 2011, 196, 1408–1414. [Google Scholar] [CrossRef]
  20. Idilman, I.S.; Aniktar, H.; Idilman, R.; Kabacam, G.; Savas, B.; Elhan, A.; Celik, A.; Bahar, K.; Karcaaltincaba, M. Hepatic Steatosis: Quantification by Proton Density Fat Fraction with MR Imaging versus Liver Biopsy. Radiology 2013, 267, 767–775. [Google Scholar] [CrossRef]
  21. Ding, J.; Stopeck, A.T.; Gao, Y.; Marron, M.T.; Wertheim, B.C.; Altbach, M.I.; Galons, J.-P.; Roe, D.J.; Wang, F.; Maskarinec, G.; et al. Reproducible automated breast density measure with no ionizing radiation using fat-water decomposition MRI. J. Magn. Reson. Imaging JMRI 2018, 48, 971–981. [Google Scholar] [CrossRef]
  22. Ding, H.; Ducote, J.L.; Molloi, S. Measurement of breast tissue composition with dual energy cone-beam computed tomography: A postmortem study: Breast composition measurement with dual energy CBCT. Med. Phys. 2013, 40, 061902. [Google Scholar] [CrossRef]
  23. Serai, S.D.; Dillman, J.R.; Trout, A.T. Proton Density Fat Fraction Measurements at 1.5- and 3-T Hepatic MR Imaging: Same-Day Agreement among Readers and across Two Imager Manufacturers. Radiology 2017, 284, 244–254. [Google Scholar] [CrossRef]
  24. Hernando, D.; Sharma, S.D.; Aliyari Ghasabeh, M.; Alvis, B.D.; Arora, S.S.; Hamilton, G.; Pan, L.; Shaffer, J.M.; Sofue, K.; Szeverenyi, N.M.; et al. Multisite, multivendor validation of the accuracy and reproducibility of proton-density fat-fraction quantification at 1.5T and 3T using a fat-water phantom: Proton-Density Fat-Fraction Quantification at 1.5T and 3T. Magn. Reson. Med. 2017, 77, 1516–1524. [Google Scholar] [CrossRef]
  25. Okamura, Y.; Yoshizawa, N.; Yamaguchi, M.; Kashiwakura, I. Application of Dual-Energy Computed Tomography for Breast Cancer Diagnosis. Int. J. Med. Phys. Clin. Eng. Radiat. Oncol. 2016, 05, 288–297. [Google Scholar] [CrossRef]
  26. Yoshizawa, N.; Ueda, Y.; Nasu, H.; Ogura, H.; Ohmae, E.; Yoshimoto, K.; Takehara, Y.; Yamashita, Y.; Sakahara, H. Effect of the chest wall on the measurement of hemoglobin concentrations by near-infrared time-resolved spectroscopy in normal breast and cancer. Breast Cancer 2016, 23, 844–850. [Google Scholar] [CrossRef]
  27. Cerussi, A.; Shah, N.; Hsiang, D.; Durkin, A.; Butler, J.; Tromberg, B.J. In vivo absorption, scattering, and physiologic properties of 58 malignant breast tumors determined by broadband diffuse optical spectroscopy. J. Biomed. Opt. 2006, 11, 044005. [Google Scholar] [CrossRef]
  28. Matcher, S.J.; Elwell, C.E.; Cooper, C.E.; Cope, M.; Delpy, D.T. Performance comparison of several published tissue near-infrared spectroscopy algorithms. Anal. Biochem. 1995, 227, 54–68. [Google Scholar] [CrossRef]
  29. van Veen, R.L.P.; Sterenborg, H.J.C.M.; Pifferi, A.; Torricelli, A.; Chikoidze, E.; Cubeddu, R. Determination of visible near-IR absorption coefficients of mammalian fat using time- and spatially resolved diffuse reflectance and transmission spectroscopy. J. Biomed. Opt. 2005, 10, 054004. [Google Scholar] [CrossRef]
  30. Chung, S.H.; Cerussi, A.E.; Klifa, C.; Baek, H.M.; Birgul, O.; Gulsen, G.; Merritt, S.I.; Hsiang, D.; Tromberg, B.J. In vivo water state measurements in breast cancer using broadband diffuse optical spectroscopy. Phys. Med. Biol. 2008, 53, 6713–6727. [Google Scholar] [CrossRef]
  31. Cerussi, A.E.; Tanamai, V.W.; Hsiang, D.; Butler, J.; Mehta, R.S.; Tromberg, B.J. Diffuse optical spectroscopic imaging correlates with final pathological response in breast cancer neoadjuvant chemotherapy. Philos. Trans. R. Soc. Math. Phys. Eng. Sci. 2011, 369, 4512–4530. [Google Scholar] [CrossRef] [Green Version]
  32. Taroni, P.; Paganoni, A.M.; Ieva, F.; Pifferi, A.; Quarto, G.; Abbate, F.; Cassano, E.; Cubeddu, R. Non-invasive optical estimate of tissue composition to differentiate malignant from benign breast lesions: A pilot study. Sci. Rep. 2017, 7, 40683. [Google Scholar] [CrossRef] [Green Version]
  33. Taroni, P.; Comelli, D.; Pifferi, A.; Torricelli, A.; Cubeddu, R. Absorption of collagen: Effects on the estimate of breast composition and related diagnostic implications. J. Biomed. Opt. 2007, 12, 014021. [Google Scholar] [CrossRef]
  34. Taroni, P.; Quarto, G.; Pifferi, A.; Abbate, F.; Balestreri, N.; Menna, S.; Cassano, E.; Cubeddu, R. Breast Tissue Composition and Its Dependence on Demographic Risk Factors for Breast Cancer: Non-Invasive Assessment by Time Domain Diffuse Optical Spectroscopy. PLoS ONE 2015, 10, e0128941. [Google Scholar] [CrossRef]
  35. Gratton, G.; Maier, J.S.; Fabiani, M.; Mantulin, W.W.; Gratton, E. Feasibility of intracranial near-infrared optical scanning. Psychophysiology 1994, 31, 211–215. [Google Scholar] [CrossRef] [Green Version]
  36. Sato, C.; Yamaguchi, T.; Seida, M.; Ota, Y.; Yu, I.; Iguchi, Y.; Nemoto, M.; Hoshi, Y. Intraoperative monitoring of depth-dependent hemoglobin concentration changes during carotid endarterectomy by time-resolved spectroscopy. Appl. Opt. 2007, 46, 2785–2792. [Google Scholar] [CrossRef]
  37. Gunadi, S.; Leung, T.S.; Elwell, C.E.; Tachtsidis, I. Spatial sensitivity and penetration depth of three cerebral oxygenation monitors. Biomed. Opt. Express 2014, 5, 2896. [Google Scholar] [CrossRef]
  38. Koga, S.; Poole, D.C.; Kondo, N.; Oue, A.; Ohmae, E.; Barstow, T.J. Effects of increased skin blood flow on muscle oxygenation/deoxygenation: Comparison of time-resolved and continuous-wave near-infrared spectroscopy signals. Eur. J. Appl. Physiol. 2015, 115, 335–343. [Google Scholar] [CrossRef]
  39. Ntziachristos, V.; Yodh, A.G.; Schnall, M.D.; Chance, B. MRI-Guided Diffuse Optical Spectroscopy of Malignant and Benign Breast Lesions. Neoplasia 2002, 4, 347–354. [Google Scholar] [CrossRef]
  40. Grosenick, D.; Wabnitz, H.; Moesta, K.T.; Mucke, J.; Schlag, P.M.; Rinneberg, H. Time-domain scanning optical mammography: II. Optical properties and tissue parameters of 87 carcinomas. Phys. Med. Biol. 2005, 50, 2451–2468. [Google Scholar] [CrossRef]
  41. Wang, J.; Pogue, B.W.; Jiang, S.; Paulsen, K.D. Near-infrared tomography of breast cancer hemoglobin, water, lipid, and scattering using combined frequency domain and cw measurement. Opt. Lett. 2010, 35, 82. [Google Scholar] [CrossRef]
  42. Thakur, S.B.; Brennan, S.B.; Ishill, N.M.; Morris, E.A.; Liberman, L.; Dershaw, D.D.; Bartella, L.; Koutcher, J.A.; Huang, W. Diagnostic usefulness of water-to-fat ratio and choline concentration in malignant and benign breast lesions and normal breast parenchyma: An in vivo 1H MRS study. J. Magn. Reson. Imaging 2011, 33, 855–863. [Google Scholar] [CrossRef] [Green Version]
  43. Chung, S.H.; Yu, H.; Su, M.-Y.; Cerussi, A.E.; Tromberg, B.J. Molecular imaging of water binding state and diffusion in breast cancer using diffuse optical spectroscopy and diffusion weighted MRI. J. Biomed. Opt. 2012, 17, 071304. [Google Scholar] [CrossRef] [Green Version]
  44. Yoshizawa, N.; Ueda, Y.; Mimura, T.; Ohmae, E.; Yoshimoto, K.; Wada, H.; Ogura, H.; Sakahara, H. Factors affecting measurement of optic parameters by time-resolved near-infrared spectroscopy in breast cancer. J. Biomed. Opt. 2018, 23, 1–6. [Google Scholar]
  45. Yoshimoto, K.; Ohmae, E.; Yamashita, D.; Suzuki, H.; Homma, S.; Mimura, T.; Wada, H.; Suzuki, T.; Yoshizawa, N.; Nasu, H.; et al. Development of time-resolved reflectance diffuse optical tomography for breast cancer monitoring. In Proceedings of the Optical Tomography and Spectroscopy of Tissue XII; International Society for Optics and Photonics: San Diego, CA, USA, 2017; Volume 10059, p. 100590M. [Google Scholar]
Figure 1. ROIs on MRI and DECT. (a) ROI on an MRI image of fibroglandular tissue in a normal breast in the first part of the study. (b) ROI on a DECT image of fibroglandular tissue in a normal breast in the first part of the study. (c) ROI on a DECT image of breast cancer in the second part of the study. (d) ROI on a DECT image in a symmetrical area of the contralateral breast in the second part of the study. Yellow dashed lines show the measurement axes for TD-DOS. Blue arrows indicate the position of the source (S) and detector (D) fiber bundles.
Applsci 09 01482 g001
Figure 2. Absorption spectra of oxy-hemoglobin (O2Hb), deoxy-hemoglobin (HHb), pure water, and purified lard.
Applsci 09 01482 g002
Figure 3. The fat fraction measured by DECT plotted against the fat fraction measured by MRI in the fibroglandular tissue of the normal-side breast.
Applsci 09 01482 g003
Figure 4. Examples of IRFs (blue lines), measured temporal profiles (yellow lines), and the fitting results (red lines) at 6 wavelengths (761 nm (a), 802 nm (b), 836nm (c), 908 nm (d), 936 nm (e), and 976 nm (f)) obtained from TD-DOS measurement of normal breast tissue with O2Hb = 14.6 μM, HHb = 3.9 μM, water content = 15.4%, and lipid content = 63.9%.
Applsci 09 01482 g004
Figure 5. Measurement of normal breast tissue and breast tumor tissue in the supine position. (a) Relationship between lipid content estimated by TD-DOS and fat fraction estimated by DECT. (b) Relationship between the water content obtained by TD-DOS and the fat-free fraction obtained by DECT. The solid line on the inset is a regression line; the dashed lines represent the 95% confidence limits. (n = 16)
Applsci 09 01482 g005
Figure 6. Box plots of parameter measurements by DECT and TD-DOS in normal and tumor tissues. (n = 16) (a) Fat fraction by DECT. (b) Lipid content by TD-DOS. (c) Water content by TD-DOS. (d) tHb by TD-DOS. (e) StO2 by TD-DOS, ** p < 0.01 by the Wilcoxon signed rank test. Boxplots show the median (horizontal lines within the boxes), 75th and 25th percentiles (upper and lower edges of the boxes, respectively), and maximum and minimum values (upper and lower bars, respectively).
Applsci 09 01482 g006
Table 1. DECT examination protocol.
Plain Dual-Energy-CT
Tube voltage (kV)100/Sn140
Tube currentCT-auto exposure control
Quality ref. (mAs)250/193
Rotation time (s)0.5
Detector configuration (mm)32 × 0.6 = 19.2
Pitch factor0.8
Recon kernelD30f medium smooth
Slice (mm)1
Increment (mm)1
Field of view (mm)332

