Article

Seismic Damage Model of Bridge Piers Subjected to Biaxial Loading Considering the Impact of Energy Dissipation

1
School of Civil Engineering, Fujian University of Technology, Fuzhou 350108, China
2
School of Civil Engineering, Fuzhou University, Fuzhou 350108, China
*
Author to whom correspondence should be addressed.
Appl. Sci. 2019, 9(7), 1481; https://doi.org/10.3390/app9071481
Submission received: 15 February 2019 / Revised: 18 March 2019 / Accepted: 27 March 2019 / Published: 9 April 2019
(This article belongs to the Section Civil Engineering)

Abstract

:
The large degradation of the mechanical performance of hollow reinforced concrete (RC) bridge piers subjected to multi-dimensional earthquakes has not been thoroughly assessed. This paper aims to improve the existing seismic damage model to assess the seismic properties of tall, hollow RC piers subjected to pseudo-static, biaxial loading. Cyclic bilateral loading tests on fourteen 1/14-scale pier specimens with different slenderness ratios, axial load ratios, and transverse reinforcement ratios were carried out to investigate the damage propagation and the cumulative dissipated energy with displacement loads. By considering the influence of energy dissipation on structural damage, a new damage model (M-Usami model) was developed to assess the damage characteristics of hollow RC piers. The results present four consecutive damage stages during the loading process: (a) cracking on concrete surface, (b) yielding of longitudinal reinforcements; (c) spalling of concrete, and (d) collapsing of pier after the concrete crushed and the longitudinal bars ruptured due to the flexural failure. The damage level caused by the seismic waves can be reduced by designing specimens with a good seismic energy dissipation capacity. The theoretical damage index values calculated by the M-Usami model agreed well with the experimental observations. The developed M-Usami model can provide insights into the approaches to assessing the seismic damage of hollow RC piers subjected to bilateral seismic excitations.

1. Introduction

Recently, a large number of bridges with tall reinforced concrete (RC) piers have been constructed and used in bridges that commonly cross ocean bays and deep canyons with a pier height surpassing 50 m. These bridges have hollow sections that significantly reduce the volume and weight of concrete piers. The diminution of a structure’s self-weight provides several advantages. For example, excessive hydration heat produced by cement hydration can be reduced to mitigate the thermal cracking of massive concrete piers and thus may increase the durability of concrete [1,2].
In countries like China, most bridges with hollow sections are located in seismic areas. For example, more than 40% of bridges in southwest China have high RC hollow piers with a height of more than 40 m [3,4]. The damage or failure of hollow RC bridge piers has been reported in several earthquakes, such as the devastating magnitude 7.9 (Wenchuan) earthquake in 2008 [5]. However, current seismic design codes provide guidelines for short to medium-height piers instead of hollow tall bridge piers [4,6]. The high slenderness ratio and axial load ratio of hollow, large mass RC piers could produce different seismic performance compared with normal concrete piers. For example, considerable seismic inertial forces could be produced given the mass of piers is larger than that of its superstructure [7]. Many experimental studies were thus conducted to understand the seismic properties of hollow RC tall piers in the world. For example, seismic studies for hollow RC bridge piers began in the 2000s in Korea [8]. Since then, the research interest in the study of the seismic performance of hollow RC bridge piers has only increased.
In the past decades, many quasi-static tests in studies, such as Calvi et al. [9], Pinto et al. [10], Yoshikazu et al. [11], and Yeh et al. [12], have been performed to understand the seismic behaviors (e.g., failure, ductility capacity) of bridge piers subjected to the combined unilateral and axial loads. The results have shown that the seismic performance of RC box piers varies according to different aspects such as the aspect ratio, amount of transverse reinforcement, and the shape of cross-ties. In practical applications, the actual seismic waves consist of three directional components in orthogonal directions. This fact indicates that the seismic performance of a structure, including the ultimate load-bearing capacity, the stiffness degeneration, and the strength degradation could be influenced by more than one directional seismic excitation. Several studies have shown that the failure characteristics of structures under multi-direction loadings are more complicated due to the multi-axial coupling effect [13,14,15,16,17,18]. The crack resistance, energy absorption capacity, damage propagation, and ductility of the RC bridge columns under biaxial horizontal cyclic loading usually differs markedly from that under uniaxial loading [14,15,16,17,19]. Note that most of these studies focus on the bridge piers with solid sections.
To understand the seismic performance of hollow RC box piers, few studies have been performed on the multi-dimensional seismic performance. A number of related topics, such as the seismic performance degradation induced by coupling effect from multi-dimensional loads, have been investigated [5,20]. The reinforced concrete box pier was certified to have good bending properties in multi-dimensional seismic loads. However, there have been no detailed studies on the multi-dimensional seismic damage index or the corresponding seismic design methods. Consequently, there is no effective method for the multi-dimensional seismic design of bridges with reinforced concrete box piers.
The displacement at the top of a bridge pier is currently used as the seismic performance evaluation index in the Chinese Seismic Design Code for Highway Bridge JTG/B 02-01 (JTG/T B02-01-2008). This method fails to consider a number of impacts, such as the impact of the degradation of stiffness and strength, as well as the impact of structural energy dissipation due to cyclic loading. Therefore, several double-parameter damages models—such as the model of displacement and energy dissipation—have been used to characterize the seismic damage evolution of bridge piers [21,22,23,24,25]. However, the influence of bidirectional loading on the degradation of the seismic performance was not studied in detail in these models as these models were established based on unidirectional quasi-static testing. Also, these models do not consider the fact that the same effective energy dissipation using different displacement loads could result in different amounts of seismic damage.
In this study, a comprehensive biaxial pseudo static testing, including 14 specimens with different configurations, was conducted for the first time to investigate a two-dimensional seismic performance. The characteristics of the hysteresis energy and damage evolution caused by biaxial cyclic loading were examined. The corresponding seismic damage model for reinforced concrete box piers was then developed considering the impact of energy dissipated of the hollow RC bridge pier. The model parameters were calibrated by our experimental data, and the damage index results of this damage model were compared with the existing damage models. This research project aims to develop a suitable damage model for assessing seismic damage in bilateral earthquake excitations.

2. Experimental

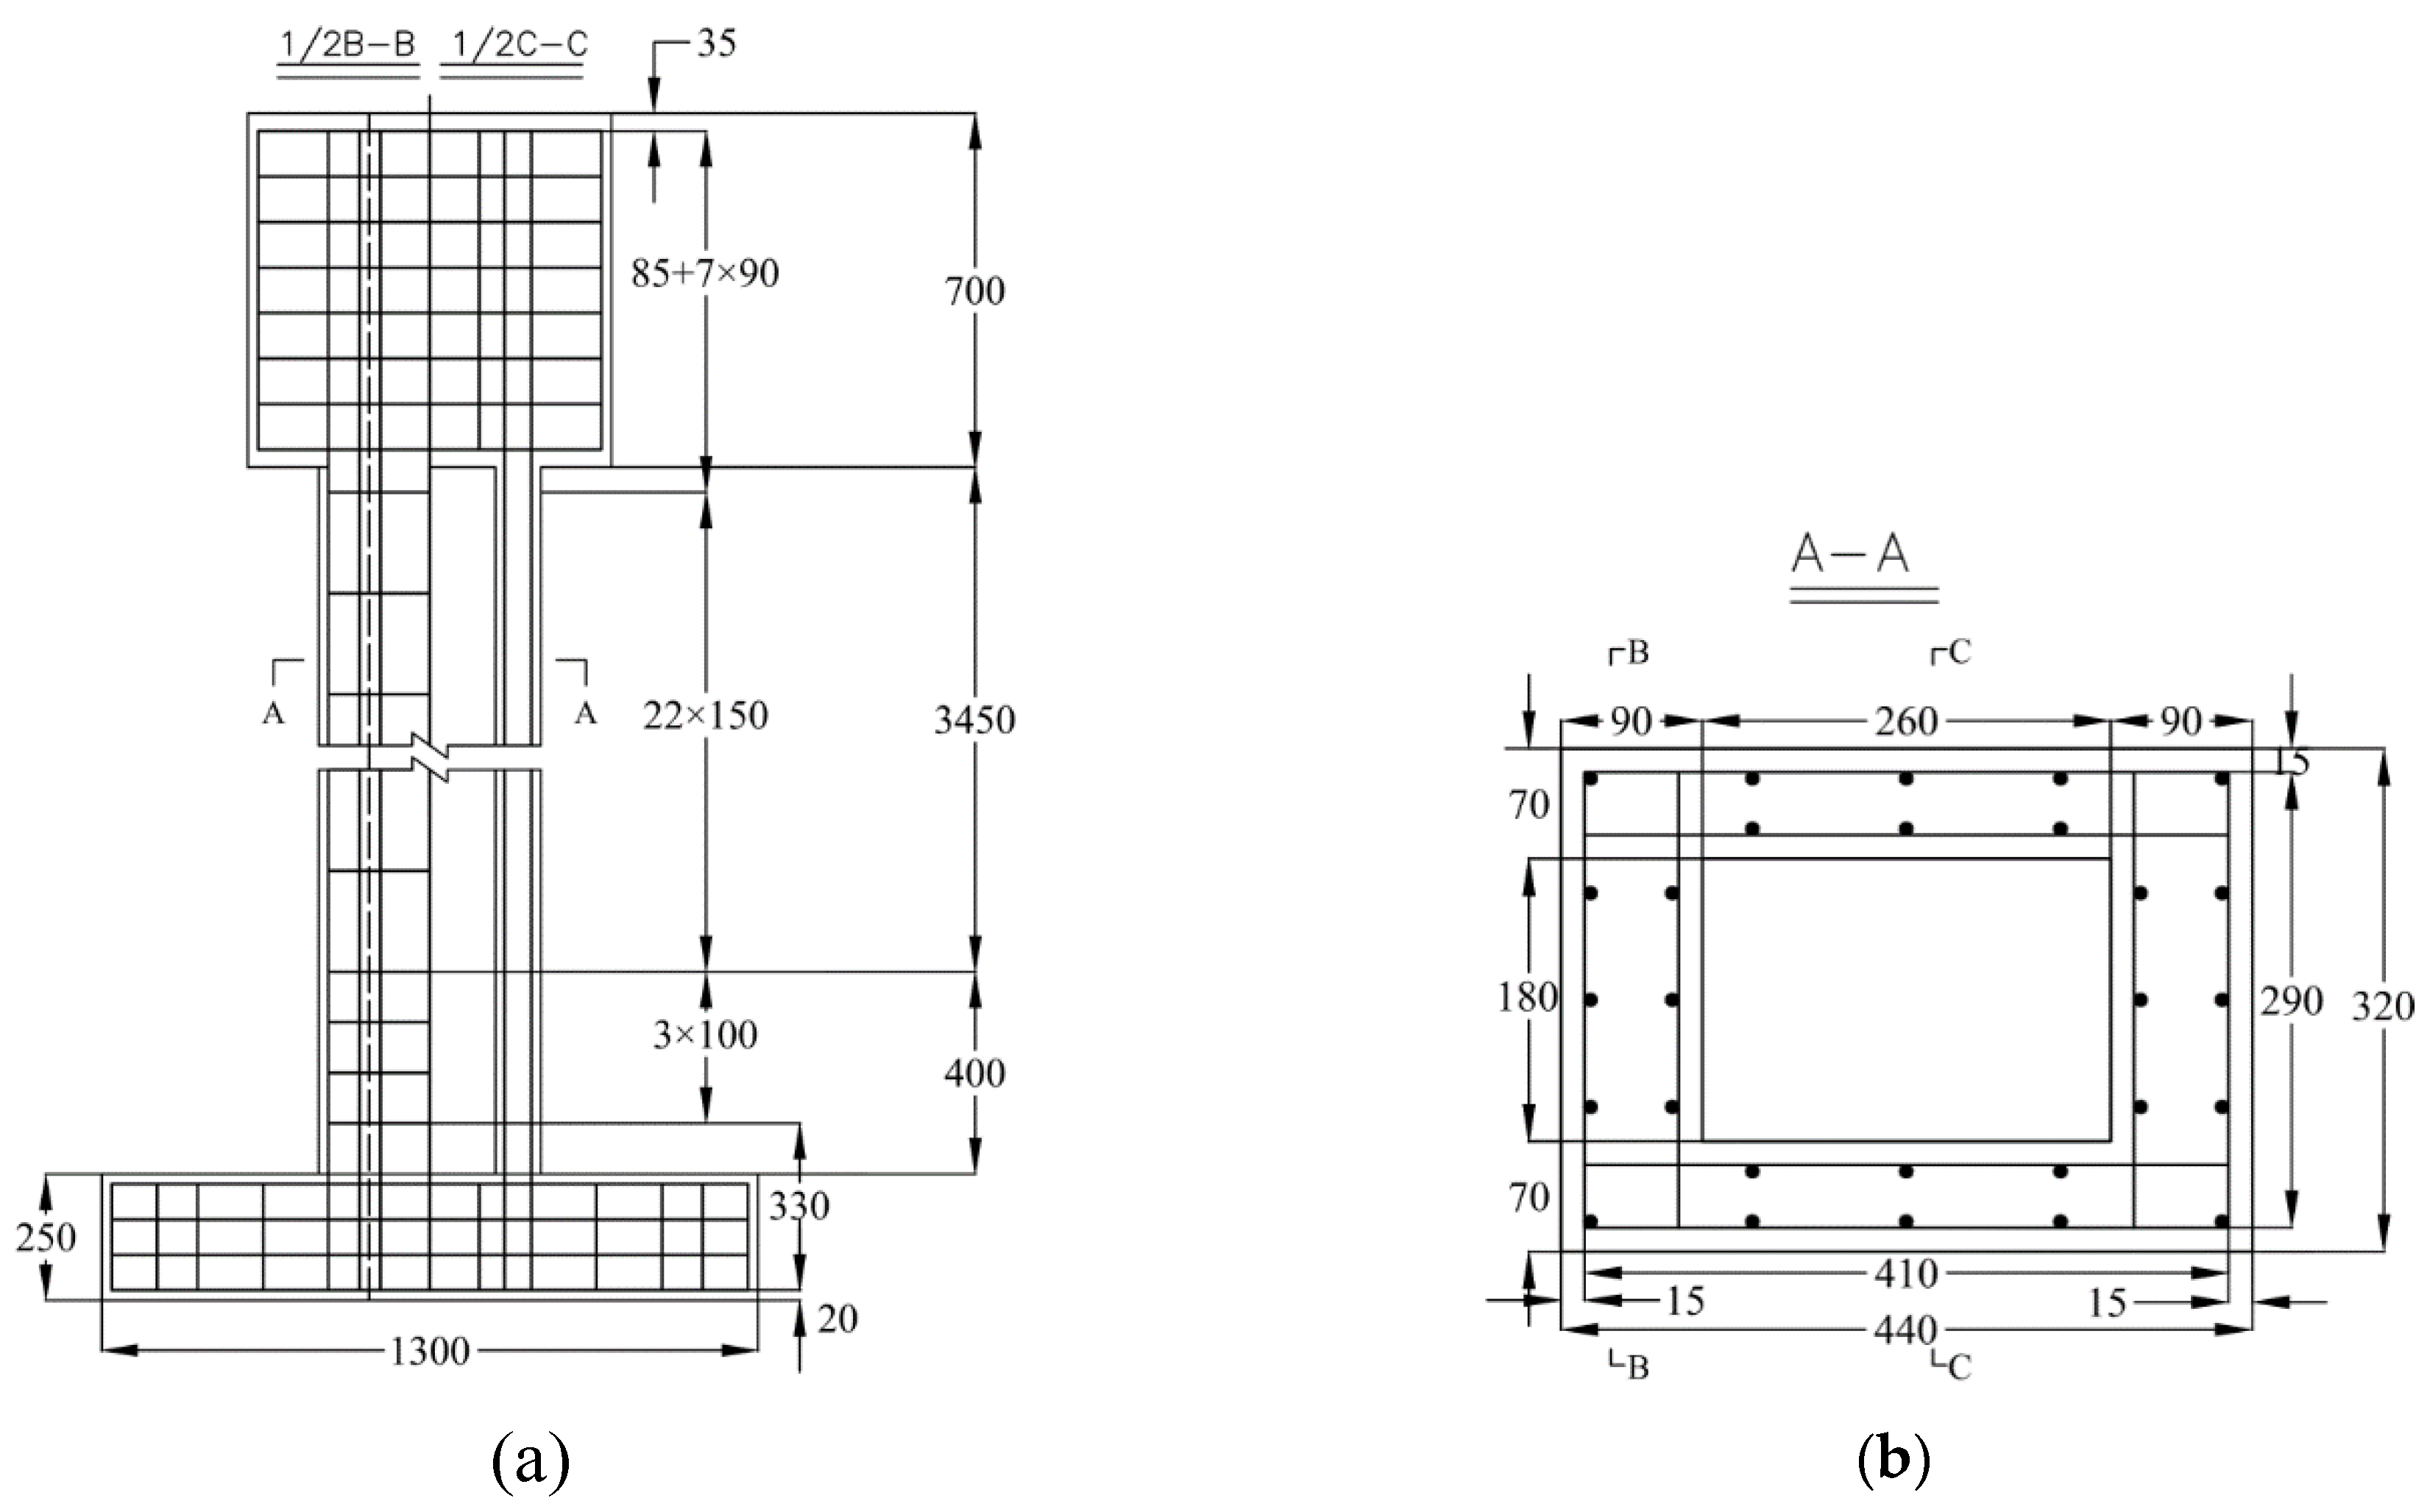
2.1. Test Specimen and Preparation

Fourteen RC bridge box piers (B1–B14) at a 1:14 scale representation of the prototype piers were prepared with four heights (H), four slenderness ratios ( λ ), three axial load ratios (n), and three transverse reinforcement ratios or stirrup ratios ( ρ V ), as shown in Table 1. Note the axial load was applied on top of the piers to represent their superstructure mass. Figure 1 illustrates the B1 sample as a representation.
The constant cross-section of the hollow structure model was 440 × 320 mm (Figure 1b), and the wall thickness in X and Y directions were 90 and 70 mm, respectively. The configuration of reinforcement details was the same for all specimens, except that the spacing between the transverse bars was different to produce samples with different transverse reinforcement ratios. For the specimens B1–B3, and B6–B14, the transverse bars were spaced with intervals of 50 mm in the 350 mm height zone from the bottom of the pier and at intervals of 100 mm in other zones. For the specimens B4 and B5, the interval spacing in the bottom area were 70 and 100 mm, respectively. Sufficient longitudinal steels are included in pier specimens to present the mid-height plastic response, and sufficient confinements were used to improve the pier ductility and prevent shear failure, as reported by Chen et al. [4].
The top section of a pier was cast to be a solid section with a dimension of 700 × 720 × 540 mm, as shown in Figure 1a. The load from the load actuator was then applied on this pier top. An RC footing with a dimension of 250 × 800 × 1300 mm was also cast to strictly fix the bottom of the pier. The RC footing was bolted to the ground through four high-strength screws. The piers were reinforced with 28Φ8 longitudinal bars and Φ6 transverse reinforcement bars. The measured yield strength of Φ6 and Φ8 rebars were 375.3 MPa and 326.5 MPa, respectively; the ultimate strengths were 503.8 MPa and 456.6 MPa, respectively; the elastic modulus values were 2.11 × 10⁵ MPa and 2.12 × 10⁵ MPa, respectively.
The normal-strength concrete with fine aggregates and ordinary Portland cement was cast to reach the design strength of C50 (50 MPa at 28 day-curing age). The water-cement ratio was 0.36. Six replicate cube concrete samples with a dimension of 150 × 150 × 150 mm were cast to measure the compressive strength and cleavage strength; six replicate concrete samples with a dimension of 150 × 150 × 300 mm were cast to measure the elastic modulus (Ec). All the tests were carried out after a 28-day curing in a humid room. The results show that the average compressive strength, cleavage strength, and elastic modulus are 49.41 MPa, 3.44 MPa, and 3.11 × 10⁴ MPa, respectively.
The RC pier samples were cast in wood frames, themselves compacted in three layers. Each layer was vibrated until no significant release of air bubble was observed. Figure 2 shows the photos of the whole preparation procedure of RC pier in the lab. Note the hollow space was produced by pouring fresh concrete into the space between the internal and external molds, as respectively shown in Figure 2d,e.

2.2. Strain Gauge Installation

The strains of steel and concrete at key positions were measured by the resistance strain gauges that were installed, as shown in Figure 3. The resistance strain gauges with a size of 50 mm × 3 mm and 3 mm × 2 mm were respectively used for concrete and steel strain tests. Table 2 shows the detailed parameters of strain gauges, and Figure 4 presents a real arrangement of strain gauges on steels and concrete. As the specimens are subjected to biaxial loading at their top position and sufficient longitudinal steels are included in specimens, the flexure failure could first occur at their bottom; thus, the strain gauges are installed at the bottom position of piers.

2.3. Data Acquisition

The displacement acquisition system with the TUMTtest control software developed by Tsinghua University was applied to acquire testing data during the quasi-static test. The British IMP (Isolated Measurement Pods) data acquisition device with the acquisition software was applied for the acquisition of strains at the sampling frequency of 1 Hz (Figure 5a). The cracks width gauge (PTS-C10) was applied to measure the crack width after each cycle loading (Figure 5b). The initiation and development of cracks on the specimen were recorded, and the cracks were highlighted on the concrete surface.

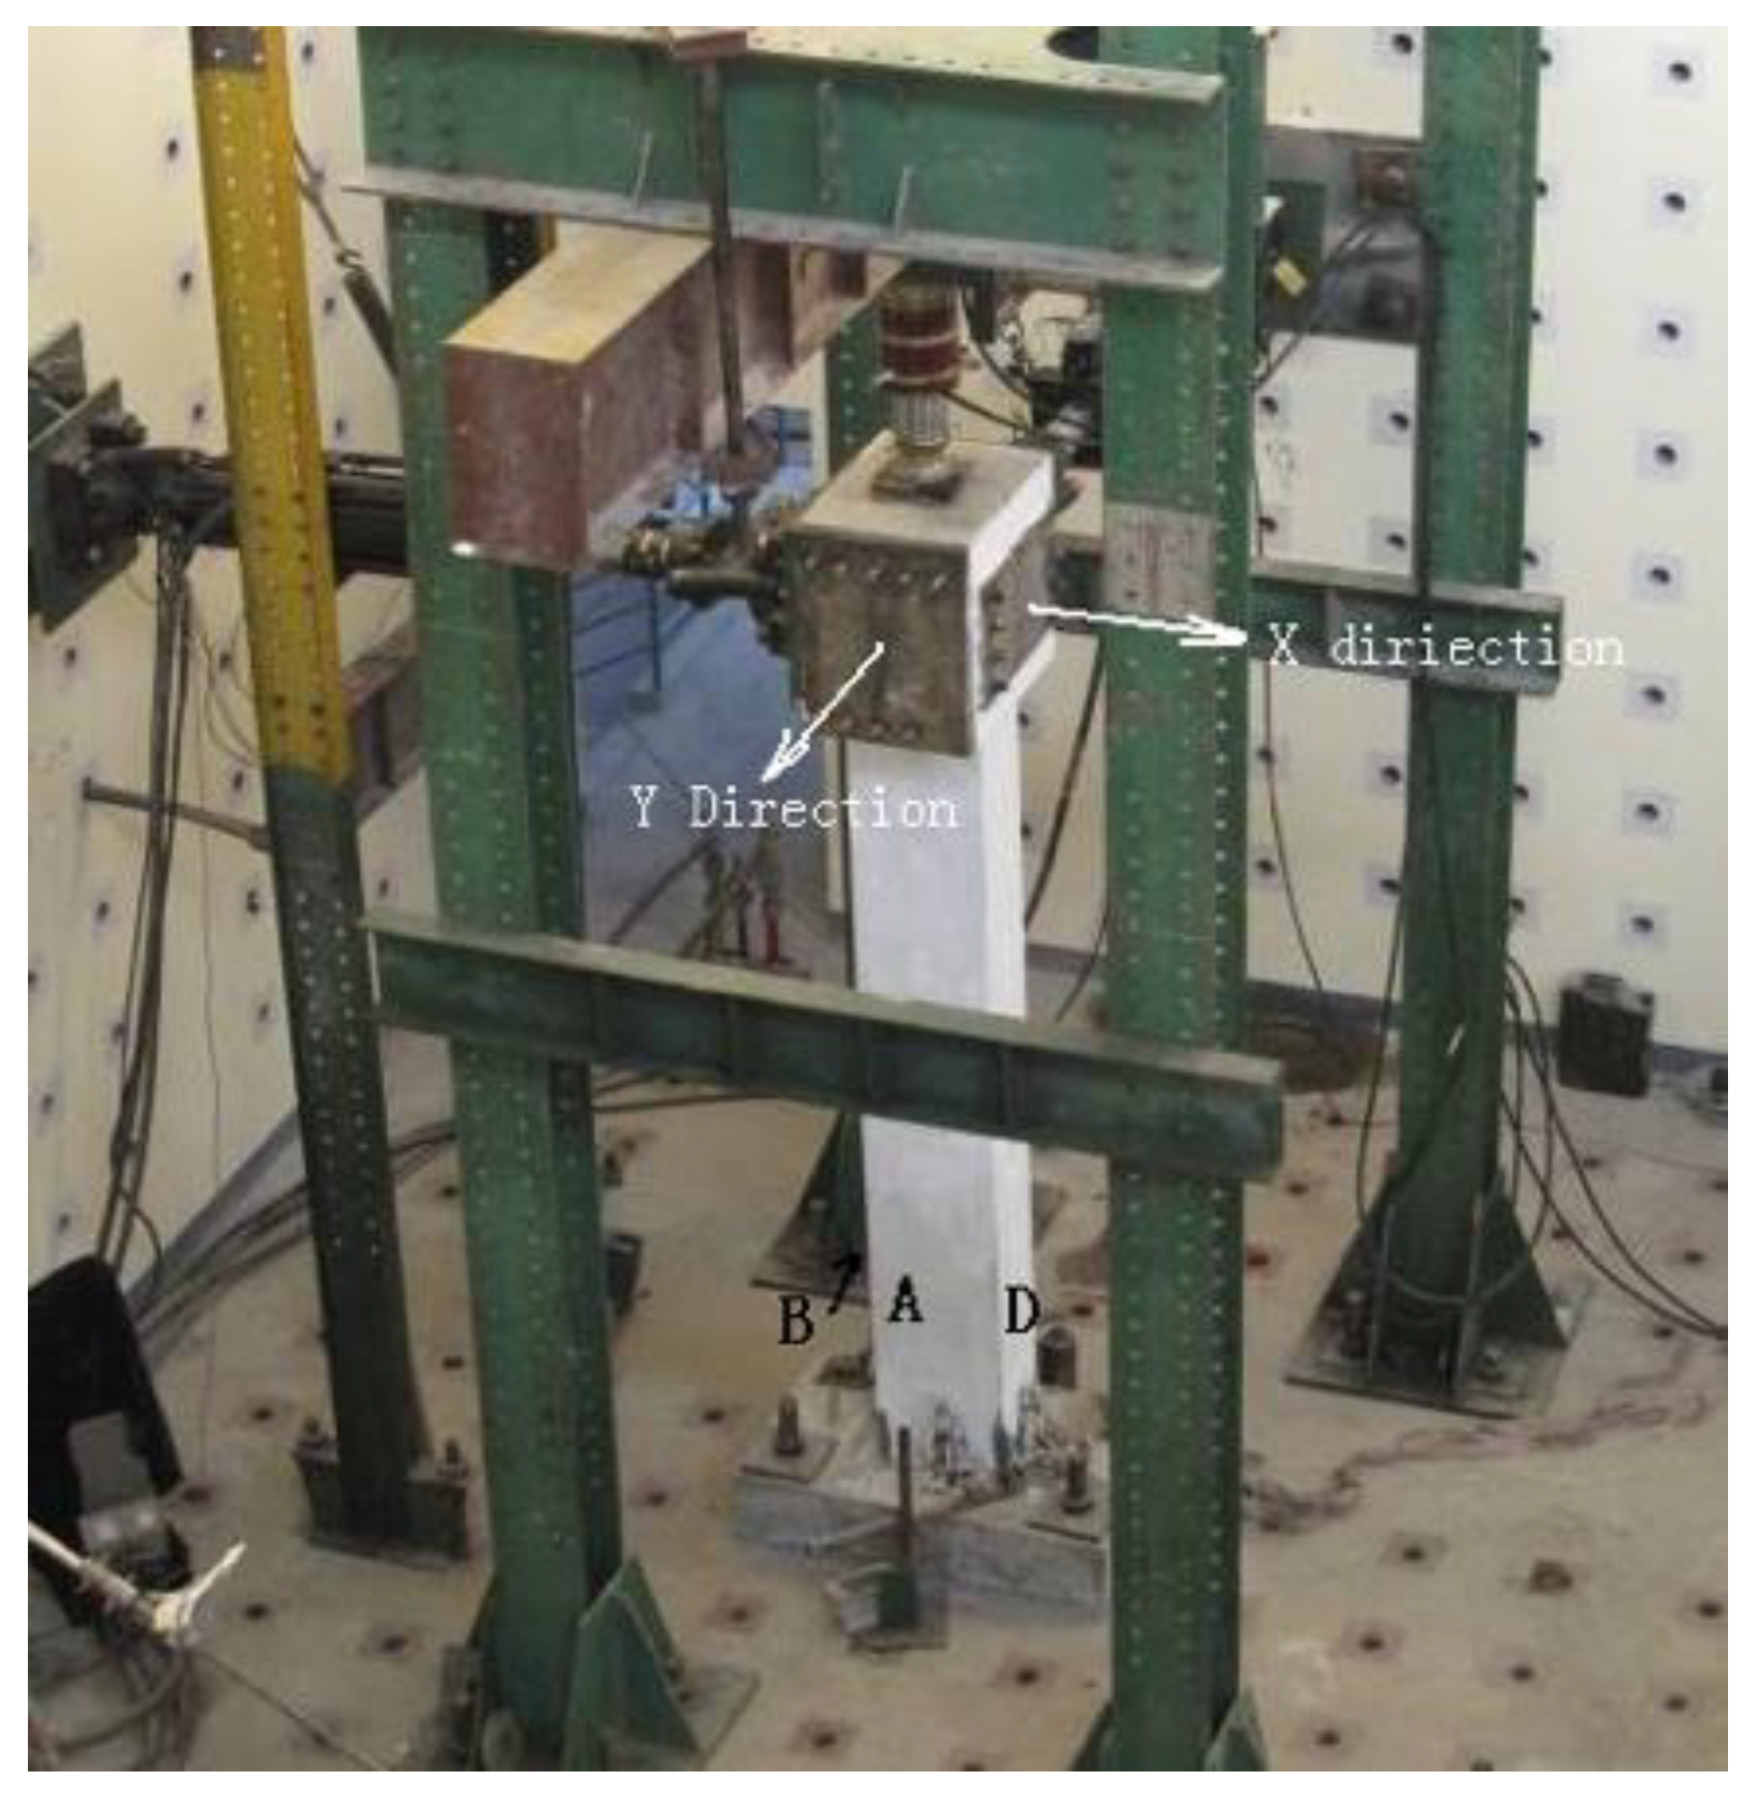
2.4. Test Setup and Loading Procedure

Figure 6 shows the testing setup in the lab. The X direction is the strong axial direction with relatively high stiffness, corresponding to the B and D faces, and the Y direction is the weak axial direction with relatively low stiffness in this paper, corresponding to the A and C faces. The displacement control method was used by cyclically applying lateral displacements on the top end of the bridge piers in both X and Y directions by means of an MTS (Mechanical Testing & Simulation) hydraulic actuator (Figure 6).
The loading actuator controls the top displacement values and the corresponding forces. The top of the sample was under compression when it was subjected to a hydraulic jack force on its top surface. The maximum loading capacity for the actuator and jack was 500 kN and 1000 kN, respectively; the maximum displacement capacity for the actuator and jack was 250 mm and 200 mm, respectively. The compression loads are respectively 105 kN, 210 kN, and 420 kN corresponding to the axial load ratios (n) of 0.05, 0.1, and 0.2.
Two cycles were taken for each displacement loading level. The first displacement load was 2 mm for both X and Y directions, and the amplitude increased by 2 mm increments. When the steel stress reached yield strength, the displacement amplitude increments were increased to 3 mm until the horizontal force started to decline; then, the displacement amplitude increments were raised to 5 mm until the end of the test. A digital single-lens reflex camera was used to capture the damage variation of specimen surface during the cyclic loading process. The cracks appearing on the sample surface and other defects (i.e., steel bar yielding, spalling of concrete, pier collapsing) were recorded for quantitative analysis.
The hysteresis curves for each specimen were recorded; their shape and the enclosed areas were used to determine the energy dissipation capacity of specimens (i.e., hysteresis energy) and their seismic performance. The hysteresis energy in each loading cycle in the X and Y directions were obtained, and the total hysteresis energy E t o t was calculated by:
E t o t   =   P x d x + P y d y
Note that the cumulative dissipated energy at each displacement level was calculated by the area of the two hysteresis loops at that displacement level.

2.5. Subsection

All the specimens presented increasing damage levels with displacement loads regardless of the specimen configurations. As expected, the damage (i.e., cracks) initiated at the pier base and propagated slowly prior to reinforcement yielding, but after reinforcement yielding, the damage developed relatively rapidly until the specimen failed. The cyclic crack open-closure phenomenon was observed under cyclic horizontal loading and constant compression loading. This was expected and consistent with other studies [26]. The cumulative dissipated energy also consistently increased with the displacement load.
To explore the similar damage characteristics of all the fourteen specimens during the bilateral cyclic loading, Figure 7 qualitatively shows the typical consecutive damage propagation stages at the critical position of B2 pier sample (as an example), that is, the interface between the top surface of footing and its above hollow pier:
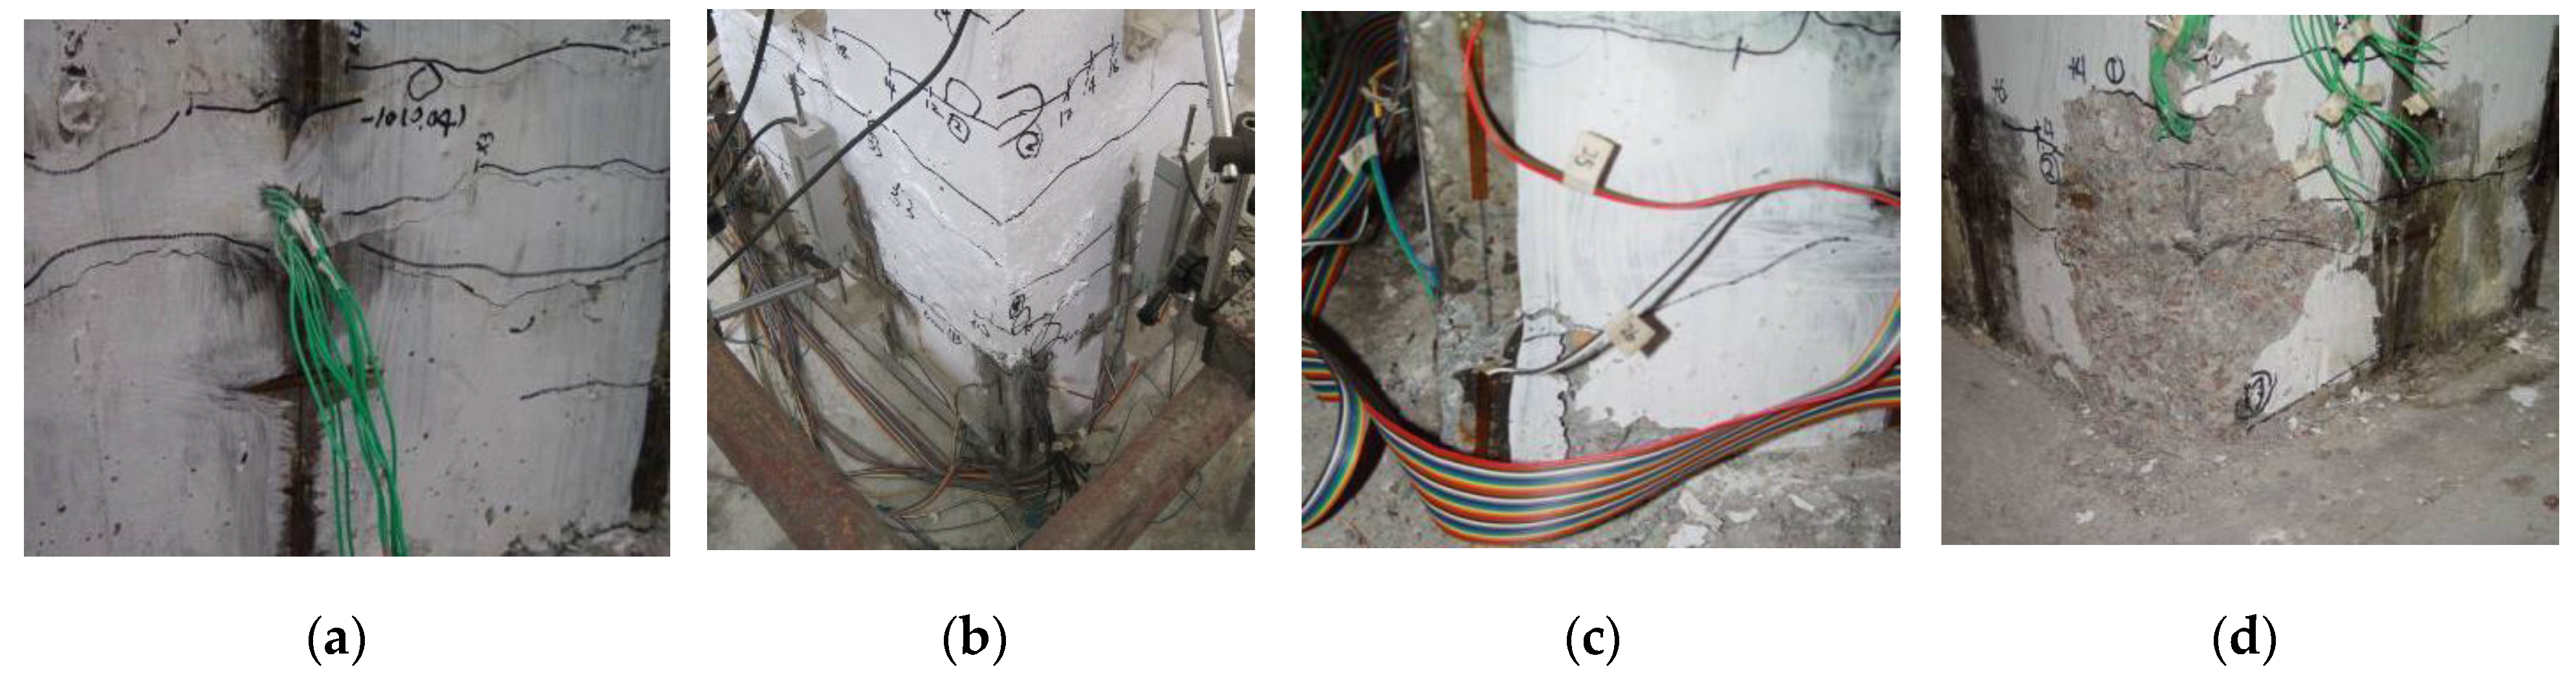
  • Stage 1 (Figure 7a): Cracking on the concrete surface in the horizontal direction at the 4 mm displacement load after the formation of a plastic region. More cracks at higher position initiated with the increasing displacement loading;
  • Stage 2 (Figure 7b): Yielding of longitudinal reinforcements at the 12 mm displacement load; the occurrence of yielding was indicated by the strain gauge values on longitudinal steels;
  • Stage 3 (Figure 7c): Spalling of concrete at the footing interface after the yielding of longitudinal reinforcement at the 31 mm displacement load;
  • Stage 4 (Figure 7d): Pier collapsing with the longitudinal reinforcement buckling or break in the testing end.
Note that the above general observations are consistent with experimental findings from others such as [27]. The results indicate that the damage propagation is highly dependent on the tensile and compressive strain of concrete materials and tensile strain of steel bars.
Figure 8 shows a typical horizontal and parallel crack pattern on the external surface of B2 concrete pier at Faces A and B (Figure 8a) and Faces C and D (Figure 8b) at the end of loading (after 2.5-h loading). The first crack with the width of 0.06 mm initiated at the interface (C and D surfaces, Figure 9) between the top surface of footing and its above hollow pier at the displacement loading of 4 mm. At the same pier height, another crack appeared on the A and B surfaces at the next displacement loading of 6 mm. With the increase of displacement loading until the maximum displacement loading of 70 mm, the cracks propagated with more than 2 mm wide, and more cracks appeared at the higher position of the concrete surface until they reached 1.8 m in height, as shown in Figure 8c. The cracks is represented as horizontal lines. The concrete crushing area is represented by the area of black zones; these areas are used to indicate the concrete crushing severity and damage level. Note that all the specimens present similar damage evolution characteristics as a consequence of flexure failure starting from concrete cracking to the yielding of longitudinal reinforcements, concrete spalling, and pier collapsing.
As this study focuses on the development of seismic damage model of bridge piers, the critical damage characteristics in terms of structural deformation and hysteretic energy were analyzed, as they mainly contribute to seismic damage of concrete structures. The other results regarding the influence of axial load ratio, slenderness ratio, and stirrup spacing on the damage characteristics were thus not analyzed in this study. Note that the damage characteristics of different specimen groups with the same variable are similar, the representation results of the group with only slenderness ratios are different (B13, B10, B2, and B7 are respectively 6.9, 10.0, 13.1, 16.3) and presented as follows.
As agreed with Figure 7, the results in Figure 10 generally show that the damage propagated with the increasing displacement load. At the same displacement, the specimens with different design configurations (i.e., the slenderness ratio in this case) present different damage levels. With smaller slenderness ratios from 16.3 to 6.9, the damage development was faster. For example, at a displacement load of 40 mm, specimen B7 with a slenderness ratio of 16.3 had the first stage of damage (i.e., cracking on concrete surface); specimen B2 with a slenderness ratio of 13.1 had the damage level that is between Stage 2 and Stage 3; specimen B10 with a slenderness ratio of 10.0 had the third stage of damage (i.e., spalling of concrete); specimen B13 with a slenderness ratio of 6.9 had the final stage of damage (i.e., pier collapsing). This difference can be explained in Figure 10b, where the correlation between the cumulative energy dissipation values and the displacement load is presented. As the displacement load increased, the cumulative energy dissipated by the pier increased, particularly after the steel bar yielded; but the increasing pattern varies with different specimen design configurations (i.e., the slenderness ratio in this case). This increasing pattern is consistent with that for the damage propagation characteristic: with smaller slenderness ratios from 16.3 to 6.9, the cumulative energy dissipation was faster. Thus, if a specimen has a better seismic energy dissipation capacity, the damage level caused by the seismic waves can be lower.
As shown in Figure 10b, all the cumulative dissipated energy patterns have a similar parabola curve pattern: the cumulative dissipated energy value is minimal when the displacement load is minor before the concrete cracking at the yielding displacement (approximately 20 mm) and increases gradually faster after the displacement load passes yield displacement. Different specimen configurations cause different energy dissipation values, and thus absorb different amounts of seismic energy at different loading stages, producing different damage levels. Interestingly, this difference is minimal when the displacement load is small and increases when the displacement load is relatively larger. This result indicates that the energy dissipated by a structure has a great impact on the damage level of hollow RC bridge piers, and that this impact varies with the displacement load; this agrees with existing studies such as those by Qu and Ye [28] and Jiang et al. [29]. Therefore, to establish a seismic damage model, it is necessary to consider the amount of the impact that energy consumption has on the damage under different displacement load stages.

3. Seismic Damage Model

3.1. Review of Previous Damage Model

The most recent review on damage index can be found in the literature [30]. Within a variety of damage indices, the damage index proposed by Park and Ang [22] is one of the most popular ones to assess the damage levels of structures in the earthquake engineering field [27]. This Park–Ang model is a linear combination of the maximum deformation and the total hysteresis energy. Note the excessive deformation and hysteretic energy are the most critical factors contributing to seismic damage. The damage index D is expressed as:
D   =   δ i , m a x δ u + β d E F y δ u
where δ i , m a x is the maximum displacement, δ u is the ultimate displacement under monotonic loading, F y is the yield strength, ∫dE is the dissipated hysteretic energy, and β is a parameter that depends on structural properties of the RC member, considering the cyclic loading effect, and can be determined by experiments [27].
The Park–Ang model, however, posesses several deficiencies, such as the incapacity of convergence at upper and lower limits [29]. Kumar and Usami [21] then improved the Park–Ang damage model by considering the influence of the loading history and deformation history on damage evolution. The damage index D of this Usami model is expressed as:
D   =   ( 1 γ ) j   =   1 N 1 ( δ i , m a x δ y δ u δ y ) c + γ i   =   1 N h [ E i F y ( δ u δ y ) ] c
where N 1 is the number of half cycles producing δ i , m a x for the first time, N h is the number of half cycles, E i is the hysteretic energy dissipated in the ith half cycle, c is the testing constant, and γ  is the combination parameter.

3.2. Modified Usami Model

Our experimental results indicate the impact of energy dissipated by the hollow RC pier structure on the damage level at different displacement loads should be considered. At a relatively small displacement load, this impact of pier energy consumption would be lower than that at a large displacement load, given an equal cumulative hysteretic energy dissipation value; this indicates that the impact of the hysteretic energy on the damage varies with the amplitude of displacement load. In this paper, a new seismic damage model for RC bridge piers based on the modified version of the Usami damage model, herein referred to as the M-Usami Model(Modified Usami Model), is proposed:
D = ( 1 γ ) j = 1 N 1 ( δ i , max δ y δ u δ y ) c + γ i = 1 N h [ E i ( δ max , i ± / δ u ) 2 F y ( δ u δ y ) ] c
where δ m a x , i ± is the maximum positive or negative displacement load in ith half loading cycle. The different impacts of energy dissipation at different displacement loads are expressed the square of the ratio of δ m a x , i ± to δ u .
For a simplified calculation of Equation (4) in practical applications, the integral calculation of the hysteretic energy dissipation can be simplified through correlation analysis. A simplified formula between the accumulated hysteresis dissipated energy ( E i ) and the ductility coefficient μ i can be established and shown as
X - direction :   E c u m , i   =   12.54 μ i 1.661 E y
Y - direction :   E c u m , i   =   16.95 μ i 1.601 E y
where E c u m , i is the total accumulative hysteresis energy to ith half cycle, E y   =   P y Δ y / 2 , and μ i is the ductility coefficient in the ith cycle. The displacement ductility factor is defined as the displacement corresponding to 85% of the maximum lateral load divided by the yield displacement, and the yield displacement is calculated by the double straight-line energy equivalent area method [30]. This is shown in Figure 11, where S1 + S3 = S2, and point B is the yield point. The accumulative hysteresis energy of the ith half cycle is obtained according to:
Y - direction :   E i ( E c u m , i E c u m , i 1 ) / 2
The accumulative hysteresis energy of ith half cycle in X and Y direction can be simplified to be expressed as:
X - direction :   E i 6.27 ( μ i 1.661 μ i 1 1.661 ) E y
Y - direction :   E i 8.475 ( μ i 1.601 μ i 1 1.601 ) E y

3.3. Seismic Damage Model Considering Biaxial Coupling Load Effect

In this section, the seismic damage index for the X and Y directions are combined to produce a comprehensive seismic damage model that considers the bi-axial load coupling effect. The model parameters of the developed M-Usami model and other two existing models (i.e., Usami model, and Park–Ang model) are first calibrated. The performance of M-Usami model in evaluating the seismic damage evaluation of hollow RC bridge piers subjected to bilateral seismic loading was then compared with that of the other two models.

3.3.1. Damage Index Considering Biaxial Coupling Load Effect

The above damage models are used to represent damage of the components only in the X-direction or in the Y-direction. Therefore, it is useful to establish a comprehensive index for consideration of a biaxial coupling effect by the combination of the damage indexes in both the X and Y directions. The biaxial damage index of RC bridge pier under biaxial cyclic loading is thus defined:
D   =   D x + D y ε D x D y
where ε is the coupling factor of biaxial damage and has a defined range of 0 ε 1 . It is assumed that D   =   1 at the point of pier collapsing, and in doing so, the values of D x and D y as obtained from Equation (4) are used to determine ε . The coupling factors for all conditions were determined, from which the minimum value of 0.915 was chosen to be the biaxial coupling factor as it would be a conservative selection to represent real damage.

3.3.2. Parameter Calibration for M-Usami Model

The combination parameter γ and the experimental constant c are chosen following the method proposed by Usami and Kumar [21]. First, the combined parameter γ is determined and then the test constant c is determined according to the state of D   =   1 when the specimen is completely damaged. These parameters in all of the damage models are determined by this method.
The test results show that when the test constant c was between 1 and 3, and the combination parameters γ varied from 0.1 to 0.2. In the M-Usami model, the value of c was the smallest when the combination parameter γ of 0.15 was used. Then, using the axial compression ratio n, the slenderness ratio of length and width, the volume ratio ρ v , and the loading angle θ , the test constant c (shown in Table 3) is obtained according to:
X - direction :   c = 4.03 0.88 n + 0.072 λ 2.49 ρ v
Y - direction :   c = 4.49 1.49 n + 0.06 λ 3.21 ρ v

3.3.3. Parameter Calibration for the Usami Model and Park–Ang Model

Using the same method to calibrate the constant γ and c, the value of γ is again found to be 0.15, and the expression of c is:
X - direction : c = 3.345 1.593 n + 0.097 λ 0.939 ρ v
Y - direction : c = 1.73 1.366 n + 0.056 λ 1.319 ρ v
By using Equation (2), the model parameter β is obtained according to the damage condition of the test components, and the regression formula between β and the test parameters including n, λ , ρ v and θ is obtained according to:
X - direction : β = 0.113 + 0.307 n 0.014 λ + 0.141 ρ v
Y - direction : β = 0.011 + 0.205 n 0.0048 λ + 0.086 ρ v

3.4. Model Verification and Discussion

A comparative analysis of three damage models, namely the M-Usami damage model, the damage model of Usami, and Park–Ang damage model, was carried out. Their viability for the seismic damage evaluation was considered by using the previous testing results, from which a corresponding damage index range was determined according to a damage grade.
According to the failure state of quasi-static test results, four performance levels (I to IV) were defined to describe the seismic damage state of RC bridge piers (Table 4), and the damage index range from less than 0.1 to more than 1.0 was also given based on each damage state. The four-stage definition of damage limit states in this paper is based on the traditional defines from literature and codes such as [26,31], where the damage limit states are described from these four qualitative damage states: slight, moderate, extensive, and complete. The quantitative damage index values for 14 specimens corresponding to different qualitative damage levels were obtained by using experimental displacements and hysteresis energy values in Section 2. These experimentally determined damage index values were compared with those from the damage model as shown in Figure 12.
It can be seen that the M-Usami model and the Usami model can model the destruction of the experimental specimen well, especially at levels of minor damage and moderate damage. However, for specimens B4, B8, B10, Bl3, and B14, the values of the damage index from the Usami model are too small in the serious damage state when compared to the experiment but can represent the moderate damage state. This observation shows that the effect of the hysteretic energy dissipation on damage will increase at large displacements as the Usami model fails to consider this in its calculation. For the Park-Ang model, the damage level of components is over-estimated, especially for the specimens B3, B5, and B7.
Overall, the damage index calculated from the M-Usami agrees well with the real damage state. By comparing the calculation damage indexes of the three damage models presented, it was concluded that the M-Usami damage model can better represent the experimental phenomena and the actual damage of the test specimens, and thus can be potentially used as a bidirectional seismic damage model for RC bridge piers.
The M-Usami damage model integrates the effect of seismic energy dissipation on damage level by setting a square of the ratio of displacement load in each loading cycle to the ultimate displacement under monotonic loading. This is a judicious practice, as the cumulative energy dissipation contributes parabolically to the damage propagation with displacement load: the larger the displacement load, the higher the energy dissipated by the pier with a parabolic increase. The square of the ratio of displacement load to the ultimate displacement can thus essentially reflect the impact of cumulative energy dissipation on damage propagation.
Given the importance of seismic energy dissipation in decreasing seismic damage suffered by structures, a specimen design with different energy dissipation capacity should be considered. For example, our study shows that with a higher slenderness ratio, the structure can deform much larger at the same damage level. In addition, tall pier specimens can be reinforced with sufficient longitudinal steels and confinements to prevent mid-height plastic response and shear failure, as shown in this study and others, such as Chen et al. [4].
This study focuses on the pseudo-static tests on tall hollow RC bridge piers, while the earthquakes in the field have dynamic excitation waves with much higher frequencies, initiating the contributions of the inertial forces of the piers to the variations of seismic response, such as the position of plastic hinges [6]. Note the plastic deformation formed at the pier base in this pseudo static experiment, as shown in Figure 7. In addition, the pier bottom was bolted into the underground without considering the soil–foundation–structure interaction in this study. Future studies can thus be conducted to understand the seismic performance of hollow RC bridge piers under biaxial dynamic loading with consideration of soil-foundation-structure by using shake table tests. Presently, there is no current design method suitable for designing hollow RC bridge piers subjected to multi-dimensional seismic excitations; the quantitative assessment of seismic damage suffered by structures in this study could still provide insights into the development of performance-based seismic design codes for hollow RC bridge piers.

4. Conclusions

In this paper, the results of biaxial quasi-static testing of 14 RC bridge piers with different axial load ratios, slenderness ratios, and reinforcement ratios were analyzed to examine their hysteretic behaviors and damage evolution under bilateral low-frequency cyclic loading. A new seismic damage model for RC bridge piers subjected to bilateral seismic load was developed, and the evaluation results are compared with those from the Usami model and the Park–Ang model. The following conclusions can be drawn from this study.
  • Four consecutive damage stages were found: (a) cracking on concrete surface, (b) yielding of longitudinal reinforcements, (c) spalling of concrete, and (d) pier collapsing after the concrete crushed and the longitudinal bars ruptured due to the flexural failure.
  • Both damage level and cumulative energy dissipation increase with displacement load. The damage level caused by the seismic waves can be reduced by designing specimens with a good seismic energy dissipation capacity.
  • The cumulative dissipated energy parabolically increases with displacement load. Thus, the influence of energy dissipation on structural damage is more significant after the occurrence of reinforcement yielding, while the cumulative dissipated energy value is minimal when the displacement load is minute before the concrete cracking at the yielding displacement.
  • The Usami damage model was improved by considering the impacts of energy dissipation at different displacement loads on the damage level to evaluate the damage index of hollow RC pier subjected to bilateral seismic excitations.
  • The developed M-Usami damage index well characterizes the damage levels consistent with the testing results, and could be potentially used to evaluate the damage levels of hollow RC bridge piers in practice.

Author Contributions

Conceptualization, S.L. and Z.X.; Data curation, J.X.; Formal analysis, S.L.; Funding acquisition, Z.X.; Investigation, Z.X. and J.X.; Methodology, S.L.; Supervision, J.X.; Validation, S.L., Z.X., and J.X.; Visualization, J.X.; Writing—original draft, Z.X.; Writing—review & editing, S.L. and Z.X.

Funding

This research was funded by the Natural Science Foundation of China (NSFC), grant number 51178101 and 51378112.

Conflicts of Interest

The authors declare no conflict of interest.

References

  1. Bertagnoli, G.; Mancini, G.; Tondolo, F. Early age cracking of massive concrete piers. Mag. Concr. Res. 2011, 63, 723–736. [Google Scholar] [CrossRef]
  2. Wu, Z.; Wong, H.S.; Buenfeld, N.R. Transport properties of concrete after drying-wetting regimes to elucidate the effects of moisture content, hysteresis and microcracking. Cem. Concr. Res. 2017, 98, 136–154. [Google Scholar] [CrossRef] [Green Version]
  3. Zong, Z.; Xia, J.; Xu, C. Seismic study of high piers of large-span bridges: An overview and research development. J. Southeast Univ. Nat. Sci. Ed. 2013, 45, 445–452. [Google Scholar] [CrossRef]
  4. Chen, X.; Guan, Z.; Li, J.; Spencer, B.F., Jr. Shake Table Tests of Tall-Pier Bridges to Evaluate Seismic Performance. J. Bridge Eng. 2018, 23, 04018058. [Google Scholar] [CrossRef]
  5. Han, Q.; Du, X.; Zhou, Y. Experimental study of hollow rectangular bridge column performance under vertical and cyclically bilateral loads. Earthq. Eng. Eng. Vib. 2013, 12, 433–445. [Google Scholar] [CrossRef]
  6. Ceravolo, R.; Demarie, G.V.; Giordano, L.; Mancini, G.; Sabia, D. Problems in applying code-specified capacity design procedures to seismic design of tall piers. Eng. Struct. 2009, 31, 1811–1821. [Google Scholar] [CrossRef]
  7. Li, J.Z.; Tang, H.; Guan, Z. Shake table test and numerical analysis of a bridge model supported on elastomeric pad bearings. J. Earthq. Eng. 2017, 21, 604–634. [Google Scholar] [CrossRef]
  8. Kim, H.Y.; Lee, J.H.; Hwang, D.K.; Kwahk, I.J.; Kim, T.H.; Lee, S.H. Research for Hollow Reinforced Concrete Bridge Piers in Korea. World Acad. Sci. Eng. Technol. Int. J. Civ. Environ. Struct. Constr. Archit. Eng. 2015, 9, 951–958. [Google Scholar]
  9. Calvi, G.M.; Pavese, A.; Rasulo, A. Experimental and numerical studies on the seismic response of R.C. hollow bridge piers. Bull. Earthq. Eng. 2005, 3, 267–297. [Google Scholar] [CrossRef]
  10. Pinto, A.V.; Molina, J.; Tsionis, G. Cyclic tests on large scale models of existing bridge piers with rectangular hollow cross-section. Earthq. Eng. Struct. Dyn. 2003, 32, 1995–2012. [Google Scholar] [CrossRef]
  11. Yoshikazu, T.; Hirokazu, I. Inelastic seismic performance of RC tall piers with hollow section. In Proceedings of the 12th WCEE, Auckland, New Zealand, 4 February 2000. [Google Scholar]
  12. Yeh, Y.K.; Mo, Y.L.; Yang, C.Y. Seismic performance of rectangular hollow bridge columns. J. Struct. Eng. 2002, 128, 60–68. [Google Scholar] [CrossRef]
  13. Qiu, F.; Li, W.; Pan, P. Experimental tests on reinforced concrete columns under biaxial quasi-static loading. Eng. Struct. 2002, 24, 419–428. [Google Scholar] [CrossRef]
  14. Rodrigues, H.; Arede, A.; Varum, H.; Costa, A. Experimental study on the biaxial bending cyclic behaviour of RC columns. In Proceedings of the European Conference on Earthquake Engineering, Ohrid, Macedonia, 30 August–3 September 2010. [Google Scholar]
  15. Rodrigues, H.; Varum, H.; Arede, A.; Costa, A. A comparative analysis of energy dissipation and equivalent viscous damping of RC columns subjected to uniaxial and biaxial loading. Eng. Struct. 2012, 35, 149–164. [Google Scholar] [CrossRef] [Green Version]
  16. Rodrigues, H.; Varum, H.; Arede, A. Behavior of rectangular reinforced-concrete columns under biaxial cyclic loading and variable axial loads. J. Struct. Eng. 2015, 142. [Google Scholar] [CrossRef]
  17. Rodrigues, H.; Varum, H.; Arede, A.; Vila-Pouca, N.; Varum, H. Experimental study of repaired RC columns subjected to uniaxial and biaxial horizontal loading and variable axial load with longitudinal reinforcement welded steel bars solutions. Eng. Struct. 2018, 155, 371–386. [Google Scholar] [CrossRef]
  18. Tsuno, K.; Park, R. Experimental study of reinforced concrete bridge piers subjected to bidirectional quasi-static loading. Doboku Gakkai Ronbunshu 2004, 2004, 11–26. [Google Scholar] [CrossRef]
  19. Chang, S.Y. Experimental studies of reinforced concrete bridge columns under axial load plus biaxial bending. J. Struct. Eng. 2009, 136, 12–25. [Google Scholar] [CrossRef]
  20. Cassese, P.; Ricci, P.; Verderame, G.M. Experimental study on the seismic performance of existing reinforced concrete bridge piers with hollow rectangular section. Eng. Struct. 2017, 144, 88–106. [Google Scholar] [CrossRef]
  21. Kumar, S.; Usami, T. A note on the evaluation of damage in steel structures under cyclic loading. J. Struct. Eng. 1994, 40, 177–188. [Google Scholar]
  22. Park, Y.J.; Ang, A.H.S. Mechanistic seismic damage model for reinforced concrete. J. Struct. Eng. 1985, 111, 722–739. [Google Scholar] [CrossRef]
  23. Kumar, S.; Usami, T. Damage evaluation in steel box columns by cyclic loading tests. J. Struct. Eng. 1996, 122, 626–634. [Google Scholar] [CrossRef]
  24. Wu, Z.; Wong, H.S.; Buenfeld, N.R. Effect of confining pressure and microcracks on mass transport properties of concrete. Adv. Appl. Ceram. 2014, 113, 485–495. [Google Scholar] [CrossRef]
  25. Wang, B.; Zheng, S.; Guo, X. Study on Restoring Force Model of SRHSHPC Frame Columns Considering Damage Effects. J. Build. Struct. 2012, 33, 69–76. (In Chinese) [Google Scholar]
  26. Sharifi, A.; Banan, M.R.; Banan, M.R. A strain-consistent approach for determination of bounds of ductility damage index for different performance levels for seismic design of RC frame members. Eng. Struct. 2012, 37, 143–151. [Google Scholar] [CrossRef]
  27. Mahboubi, S.; Shiravand, M.R. Proposed Input Energy-Based Damage Index for RC Bridge Piers. J. Bridge Eng. 2018, 24, 04018103. [Google Scholar] [CrossRef]
  28. Qu, Z.; Ye, L.-P. Strength deterioration model based on effective Hysteretic energe dissipation for RC members under cyclic loading. Eng. Mech. 2010, 28, 45–51. (In Chinese) [Google Scholar]
  29. Jiang, H.J.; Chen, L.Z.; Chen, Q. Seismic damage assessment and performance levels of reinforced concrete members. Procedia Eng. 2011, 14, 939–945. [Google Scholar] [CrossRef]
  30. Xia, J.; Zong, Z.; Xu, C.; Li, M. Seismic performance of double—skin steel—concrete composite box piers: Part I—Bidirectional quasi-static testing. J. Southeast Univ. 2016, 32, 58–66. [Google Scholar]
  31. FEMA. HAZUS: Multi-Hazard Loss Estimation Methodology Earthquake Model: Technical Manual. Available online: https://www.fema.gov/media-library/assets/documents/24609 (accessed on 6 October 2018).
Figure 1. Configurations of the sectional reinforcement setup. (a) Side view, (b) Top view. Unit: mm.
Applsci 09 01481 g001
Figure 2. Sample preparation procedure: (a) Preparation of wood frames; (b) Installation and protection of strain gauge on steel surface; (c) Assembling of rebars; (d) Installation of internal wood molds; (e) Installation of external wood molds; (f) Concrete casting; (g) the demolded RC (Reinforced Concrete) piers.
Applsci 09 01481 g002aApplsci 09 01481 g002b
Figure 3. Arrangement of strain gauges on (a) front view of concrete, (b) side view of concrete, (c) steel (unit: mm).
Applsci 09 01481 g003
Figure 4. Photos of strain gauges arrangement on (a) steel; (b) concrete.
Applsci 09 01481 g004
Figure 5. The experimental instruments: (a) The acquisition system of strain and displacement; (b) Crack width gauge.
Applsci 09 01481 g005
Figure 6. Setup for testing bridge piers in X Direction and Y Direction.
Applsci 09 01481 g006
Figure 7. Damage propagation of pier end at under bilateral cyclic loading: (a) Cracking on concrete surface; (b) Yielding of longitudinal reinforcements; (c) Spalling of concrete; (d) Pier collapsing.
Applsci 09 01481 g007
Figure 8. The typical crack pattern on the concrete surface of B2 sample: (a) Faces A and B; (b) Faces C and D; (c) Highlighted cracking and concrete crushing area.
Applsci 09 01481 g008
Figure 9. The loading of MTS hydraulic actuator in (a) X direction and (b) Y direction.
Applsci 09 01481 g009
Figure 10. Damage evolution curves (a) and cumulative dissipated energy (b) of the test specimens with increasing displacement load. Note that the slenderness ratios λ are 6.9, 10.0, 13.1, 16.3 for B13, B10, B2, and B7, respectively.
Applsci 09 01481 g010
Figure 11. Double straight-line energy equivalent area method for displacement ductility.
Applsci 09 01481 g011
Figure 12. Damage index values of three damage models with experimental data. (a) the M-Usami model; (b) the Usami model; (c) the Park–Ang model.
Applsci 09 01481 g012aApplsci 09 01481 g012b
Table 1. Specimen design and mechanical properties.
Specimen No.NoteH (m)n (%) λ (%) ρ V   ( % ) f c u   ( MPa ) f u   ( MPa ) Ec (MPa)
B1Different axial load ratios with H = 4.8 m4.80.2013.11.0644.603.233.08 × 104
B24.80.1013.11.0644.603.233.08 × 104
B34.80.0513.11.0649.153.363.14 × 104
B4Different stirrup ratios with H = 4.8 m4.80.1013.10.7349.153.363.14 × 104
B54.80.1013.10.5649.153.363.14 × 104
B6Different axial load ratios with H = 5.8 m5.80.2016.31.0649.153.363.14 × 104
B75.80.1016.31.0649.153.363.14 × 104
B85.80.0516.31.0649.153.363.14 × 104
B9Different axial load ratios with H = 3.8 m3.80.2010.01.0654.473.743.15 × 104
B103.80.1010.01.0654.473.743.15 × 104
B113.80.0510.01.0649.153.363.14 × 104
B12Different slenderness ratios with H = 2.8 m2.80.206.91.0654.473.743.15 × 104
B132.80.106.91.0654.473.743.15 × 104
B142.80.056.91.0649.153.363.14 × 104
Table 2. Main parameters of resistance strain gauges.
CategoriesTypesResistanceSensitivity CoefficientGate Length × Gate WidthPrecision Grade
Concrete strain gaugeBX120-50AA119.9 ± 0.1 Ω2.08 ± 1%50 mm × 3 mmA
Steel strain gaugeBX120-5AA119.9 ± 0.1 Ω2.08 ± 1%3 mm × 2 mmA
Table 3. Parameters in the M-Usami model.
SpecimenAxial Load Ratio n Slenderness   Ratio λ Transverse   Reinforcement   Ratio   ρ V / % Loading   Angle   θ in X DirectionTest Constant c in X Direction Loading   Angle   θ in Y DirectionTest Constant c in Y Direction
B10.213.11.06π/41.64π/42.28
B20.113.11.06π/41.79π/42.40
B30.0513.11.06π/41.84π/42.39
B40.113.10.73π/42.64π/43.16
B50.113.10.56π/42.92π/44.16
B60.216.31.06π/42.00π/42.33
B70.116.31.06π/42.09π/42.65
B80.0516.31.06π/42.15π/42.65
B90.2101.06π/41.43π/42.08
B100.1101.06π/41.54π/42.30
B110.05101.06π/41.55π/42.40
B120.26.91.06π/41.11π/41.84
B130.16.91.06π/41.18π/42.00
B140.056.91.06π/41.30π/41.98
Table 4. Damage limit states of the piers.
Damage IndexPerformance LevelPerformance ObjectiveDamage Level DescriptionQualitative Description of the Performance Level Division (Failure Phenomenon)
D D < 0.1ICan use after simple repairMost in good condition, minor damage onlyNo damage or local concrete slight cracking
0.1 ≤   D D < 0.40IIMuch damage needs to be repairedModerate damageCracking phenomenon is common and lateral longitudinal reinforcement yielded
0.4 ≤   D D < 1.0IIIStructure with unrepairable damageHeavy damageConcrete crushed and the ultimate bearing capacity reached
D D > 1.0IVStructure collapseCollapseUltimate compressive strain of core concrete, ultimate strength of longitudinal reinforcement reached; 85% of the limited load.

