Article

Influence of Numerical Aperture on Molten Area Formation in Fusion Micro-Welding of Glass by Picosecond Pulsed Laser

1
Graduate School of Natural Science and Technology, Okayama University, 3-1-1 Tsushimanaka, Kita-ku, Okayama 700-8530, Japan
2
Kataoka Corporation, 2-14-27 Shinyokohama, Kohoku-ku, Yokohama 222-0033, Japan
*
Author to whom correspondence should be addressed.
Appl. Sci. 2019, 9(7), 1412; https://doi.org/10.3390/app9071412
Submission received: 28 February 2019 / Revised: 29 March 2019 / Accepted: 2 April 2019 / Published: 3 April 2019
(This article belongs to the Section Applied Physics General)

Abstract

:
Focusing condition such as numerical aperture (N.A.) has a great influence on the creation of molten area and the stable welding process in fusion micro-welding of glass. In this study, a picosecond pulsed laser of 1064 nm in wavelength and 12.5 ps in pulse duration was tightly focused inside a borosilicate glass using objective lenses of numerical apertures 0.45, 0.65, and 0.85 with spherical aberration correction. Influence of numerical aperture on molten area formation was experimentally investigated through analysis of focusing situation in glass, and movement of absorption point, and then molten area characteristics were discussed. It is concluded that N.A. of 0.65 with superior focusing characteristics can form a large and continuous molten area without cracks, which enables achievement of stable joining of glass material by picosecond pulsed laser.

1. Introduction

Glass material is widely used in optics and semiconductor industries because of its excellent optical transparency, chemical durability, and heat resistance [1,2,3]. Recently, the reliable and stable joining of glass materials is required owing to the demand for glass products with small and complicated shapes [4,5]. A lot of techniques such as optical contact [6], the gluing method, and anodic bonding have been used to join glass materials together [7]. However, there are some disadvantages such as low bonding strength and long heating time at high temperature. In addition, space selective joining is not available, since these methods are designed for the spatially uniform joining of glass material [8,9].
Micro-welding of glass material by ultrashort pulsed lasers was reported by Tamaki et al. [10], and ultrashort pulsed lasers have been proven to be a powerful and reliable tool for fusion micro-welding of glass material in the past several years [11,12]. Fusion micro-welding by an ultrashort pulsed laser, which has the capability for space selective welding, is an ultra-high speed phenomenon with low thermal load [13]. This joining method can be accomplished by local heating without any intermediate layer and mechanical contact. In this method, ultrashort pulsed laser with high repetition rate leads to the melting glass material at the vicinity of focal region due to heat accumulation [14]. Therefore, glass material around the laser focusing point is heated above the melting point, and molten area is much larger than the focal volume. It should be noticed that the heat accumulation effect that produces a larger molten area is beneficial for fusion micro-welding of glass [15,16]. Furthermore, the pulse energy of laser beam is deposited into the material at the focal volume through nonlinear absorption and/or subsequent linear absorption by the plasma [16,17]. Miyamoto et al. [18] have shown that, in glass material, the absorption of laser energy is based on nonlinear photo-ionization and avalanche ionization, which originated from the nonlinear properties of ultrashort laser pulses. On the other hand, welding is normally recognized as a thermal process, and also a slow phenomenon with heat-melting process. Therefore, both nonlinear and heat-melting are used in fusion micro-welding of glass by ultrashort pulsed lasers, which is a unique combination.
Nordin et al. [19] reported that when picosecond pulsed laser was focused inside glass material in fusion micro-welding, the absorption point moved periodically in the laser irradiation direction, and the molten area was created around the focusing point. Thus, stabilization of absorption phenomena is important to obtain the stable welding process. In addition, multi-photon ionization and avalanche ionization are related to molten area appearance inside glass material [20,21,22]. Variations of numerical aperture (N.A.) affect the ray of laser beam inside glass due to refractive index, which would result in different laser intensities. Therefore, the influence of focusing condition such as numerical aperture on micro-welding characteristics is of great significance in achieving the stable welding process.
Cvecek et al. [23] reported that focusing objective lenses with a higher numerical aperture are necessary to generate plasma by nonlinear processes in micro-welding of glass by means of an ultrashort pulsed laser. However, minimal work has been reported discussing the influence of numerical aperture of objective lens on molten area specifically, while it has been reported that experiments with spherical aberration correction can get a stable and larger molten area than those without spherical aberration correction [19]. Besides, in order to adapt fusion micro-welding of glass material by ultrashort pulsed laser for industrial applications, stabilizing the welding process is required.
In this study, a picosecond pulsed laser of 1064 nm in wavelength and 12.5 ps in pulse duration was tightly focused inside the borosilicate glass by objective lenses of various numerical apertures with spherical aberration correction. The numerical apertures of objective lenses were 0.45, 0.65, and 0.85, respectively. Influence of numerical aperture on molten area formation was experimentally investigated through analysis of focusing situation in glass, movement of absorption point, and molten area characteristics. Firstly, the analysis results of ray tracking for numerical apertures and the measurement results of diameter of laser spot focused in glass were discussed. Then, the formation phenomena of molten area were recorded by high-speed observation of laser beam irradiated area, and the absorption rate was measured by the power meter. Finally, molten area characteristics such as the state, size, and shape were characterized.

2. Materials and Methods

2.1. Glass Material

The specimen used in this study was borosilicate glass (Schott, D263), which is a highly chemical resistant material with excellent transmission, low fluorescence, exceptional flatness and tight geometric properties [24]. Excellent stability and low coefficient of thermal expansion of D263 glass enable remarkable resistant to high temperature levels. Therefore, this type of glass is suitable for the micro-welding experiments. Table 1 shows the material properties of the glass used in this study. The size of the glass specimen is shown in Figure 1.

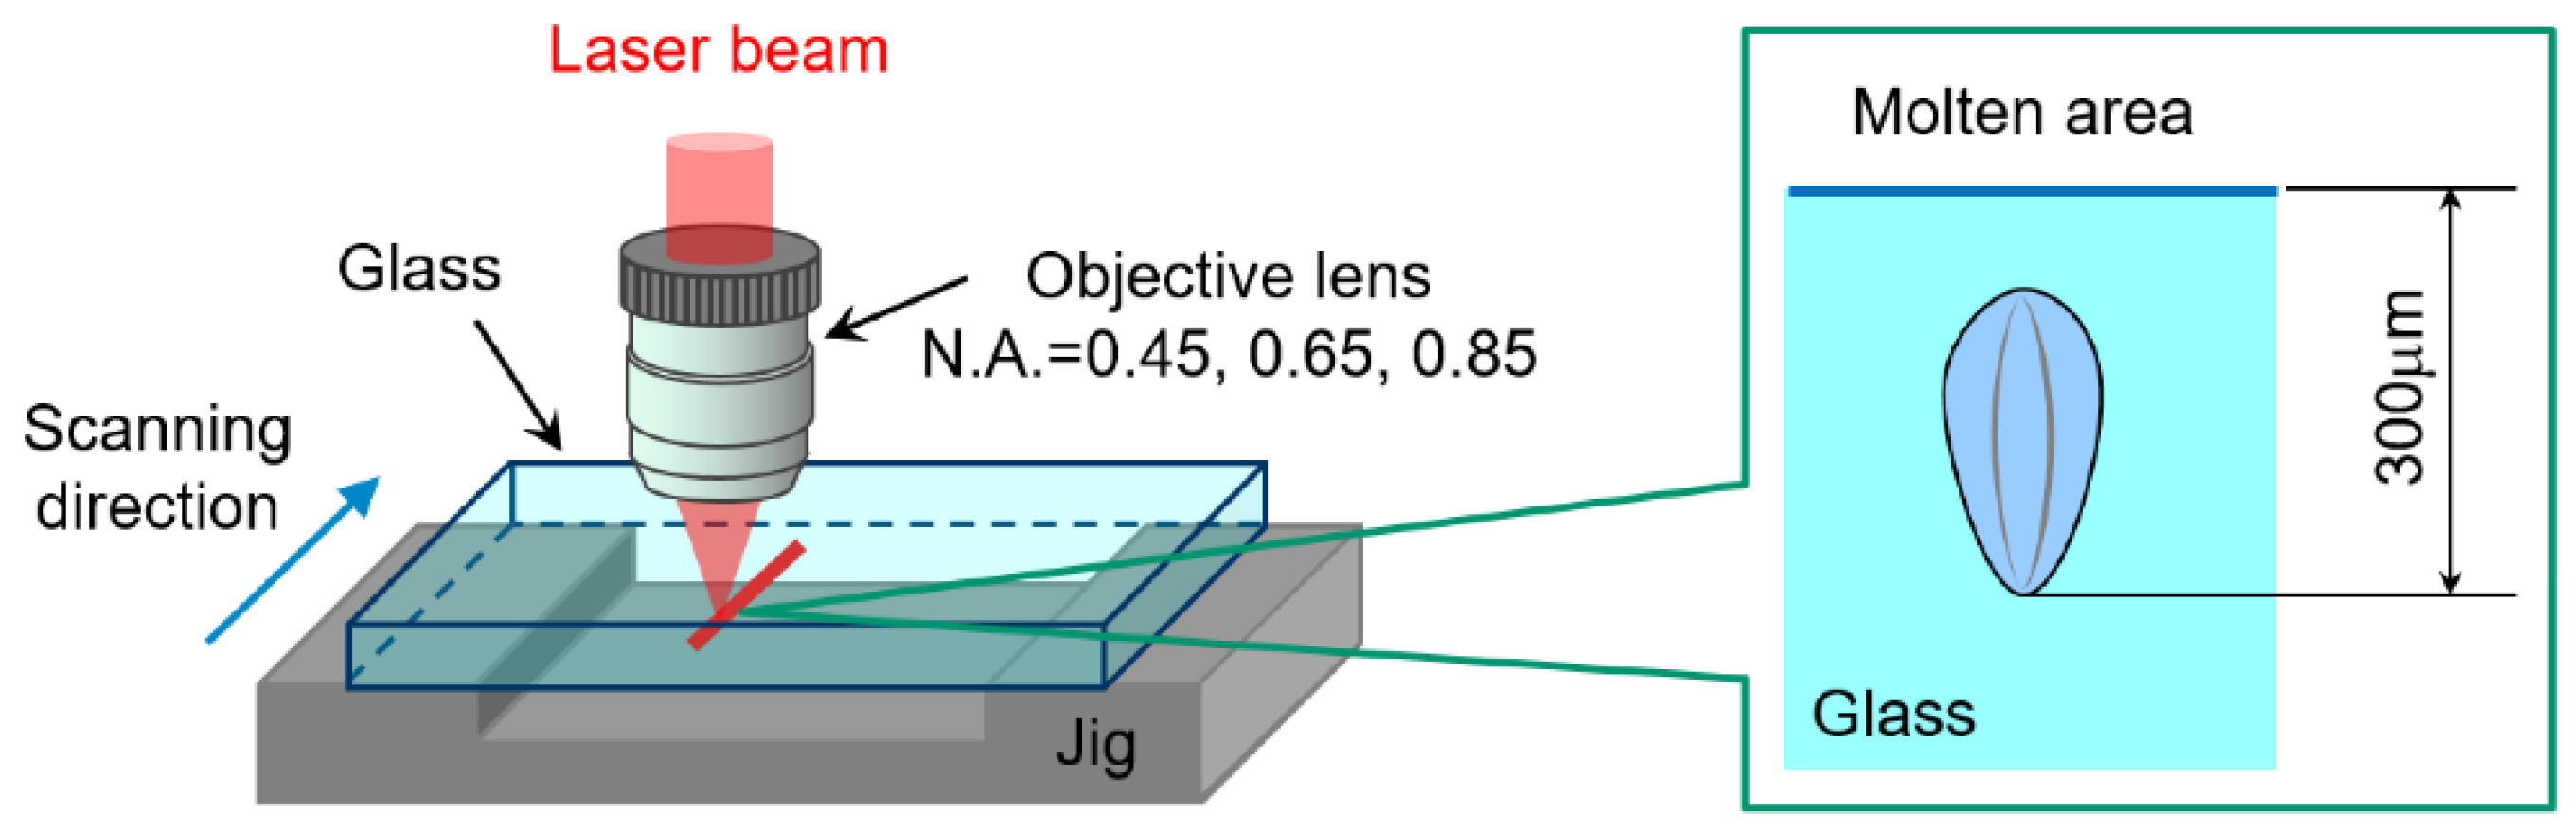
2.2. Laser Irradiation Setup

Figure 2 shows the schematic illustration of laser irradiation setup in bead-on-plate welding experiment. A picosecond pulsed laser of 1064 nm wavelength and 12.5 ps pulse duration was used as a laser source, which was tightly focused inside the glass specimen by an objective lens with spherical aberration correction. For fusion micro-welding by using ultrashort pulsed laser, 10 ps in pulse duration is typically preferable [25]. As this extreme short pulse duration makes it easy to achieve very high peak laser intensity with low pulse energies, and it shows better results such as nonlinear absorption inside transparent materials and melting phenomena by combining a high pulse repetition rate [26,27]. In order to focus on discussing the influence of numerical aperture, pulse duration was fixed at 12.5 ps in this study. N.A. 0.45, 0.65, and 0.85 of objective lenses with spherical aberration correction were used. The specifications of laser oscillator are shown in Table 2. The borosilicate glass (Schott, D263) specimen was fixed on a jig and scanned linearly by using several combinations of processing parameters. The laser beam was focused at 300 µm below the top surface of glass specimen, and molten area was formed inside the glass specimen by the laser irradiation [18]. The geometrical contour of one molten area was similar to tear drop, thus this kind of molten area is referred to as “teardrop-shaped” in this paper. Then, the molten area of glass specimen was observed by using an optical microscope. The observation directions such as top view, side view, and cross sectional view are shown in Figure 3.

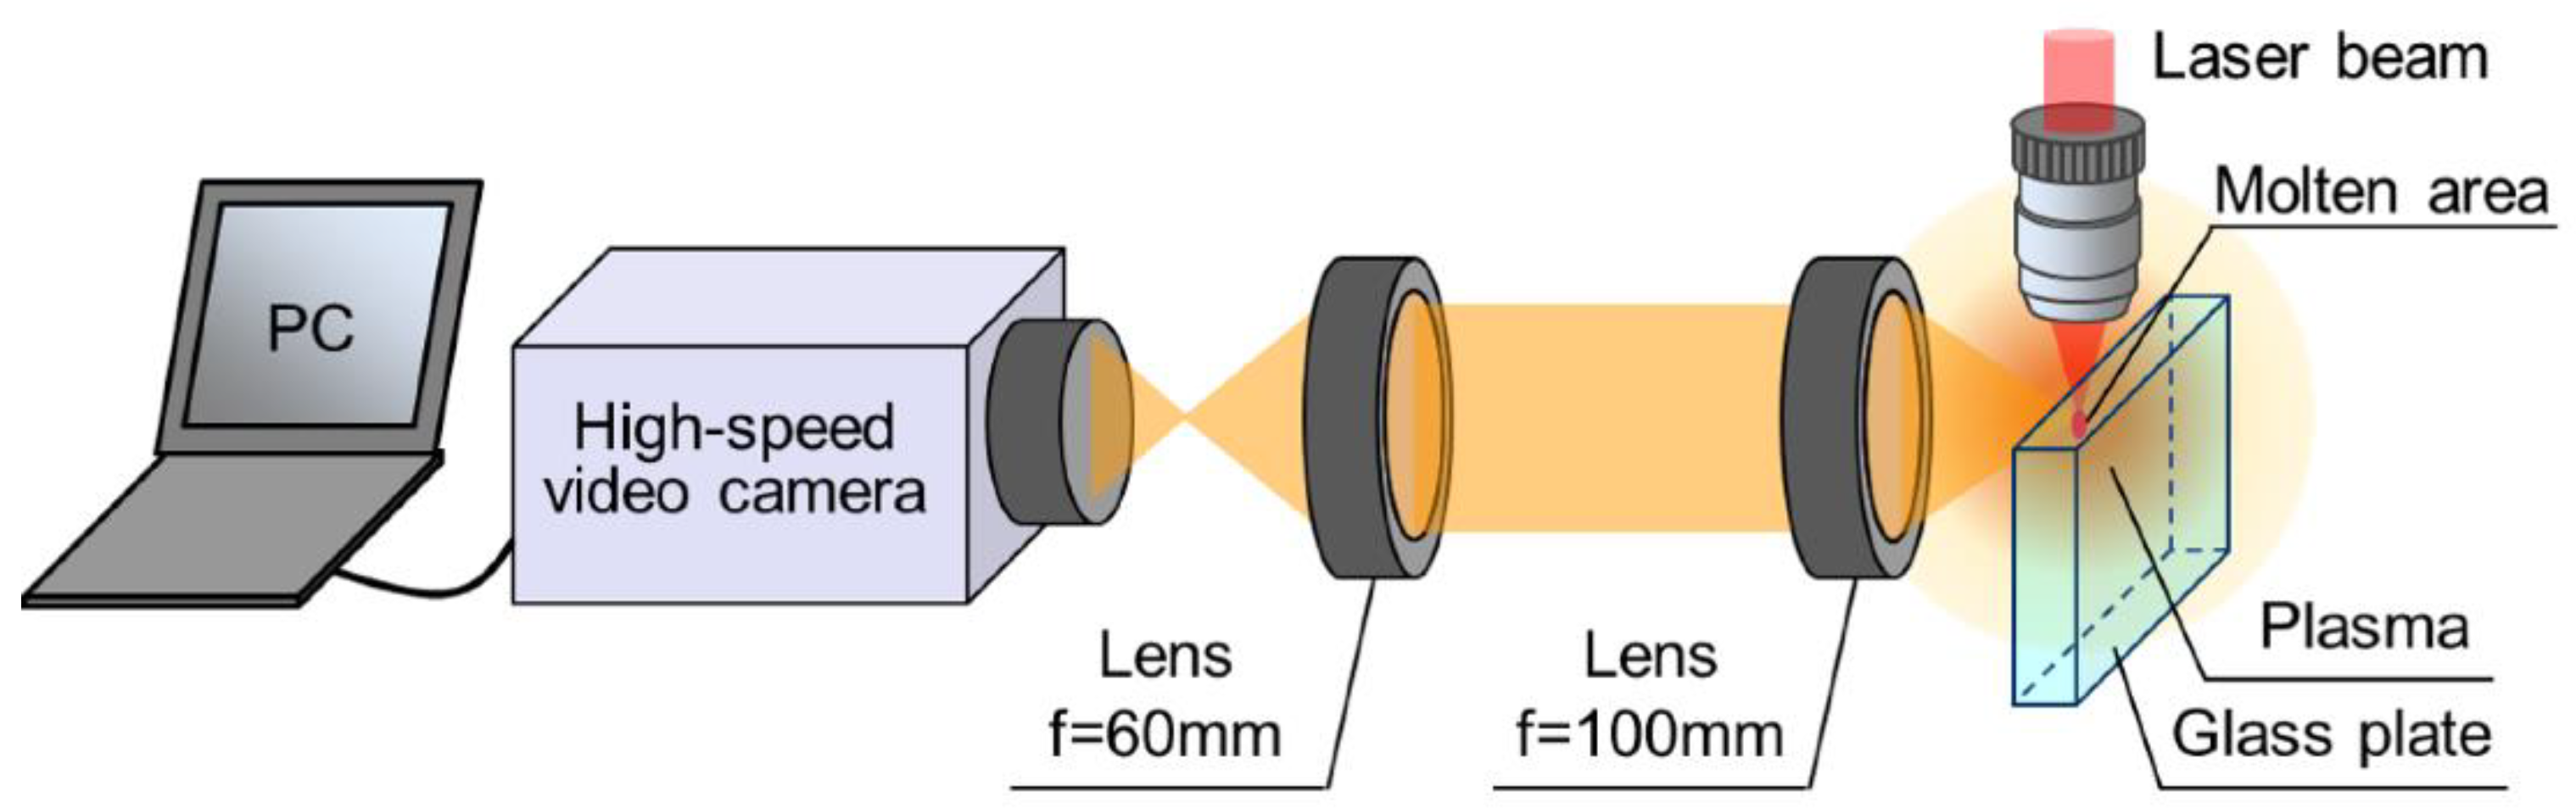
2.3. High-Speed Observation Setup

In order to investigate the formation of molten area, the laser beam irradiation area was observed from the side using a high-speed video camera (Shimadzu Corporation HPV2A). The frame rate was 64,000 fps, and exposure time was a quarter of frame interval (4 µs), as shown in Table 3. The laser beam was tightly focused inside the borosilicate glass specimen by objective lenses of N.A. 0.45, 0.65, and 0.85 with spherical aberration correction, which enabled the nonlinear absorption that resulted in the creation of a free electron plasma. In this observation, some laser pulses were captured in one image, but the molten area was formed by not only one laser shot but also the sum of multiple laser shots. Thus, the movement of absorption point could be detected, and a series of the plasma light movement could be captured to observe the absorption point movement, which was calculated by using the feed rate of specimen. In addition, two achromatic lenses with focal lengths of 60 mm and 100 mm were combined in the optical system of observation, as shown in Figure 4.

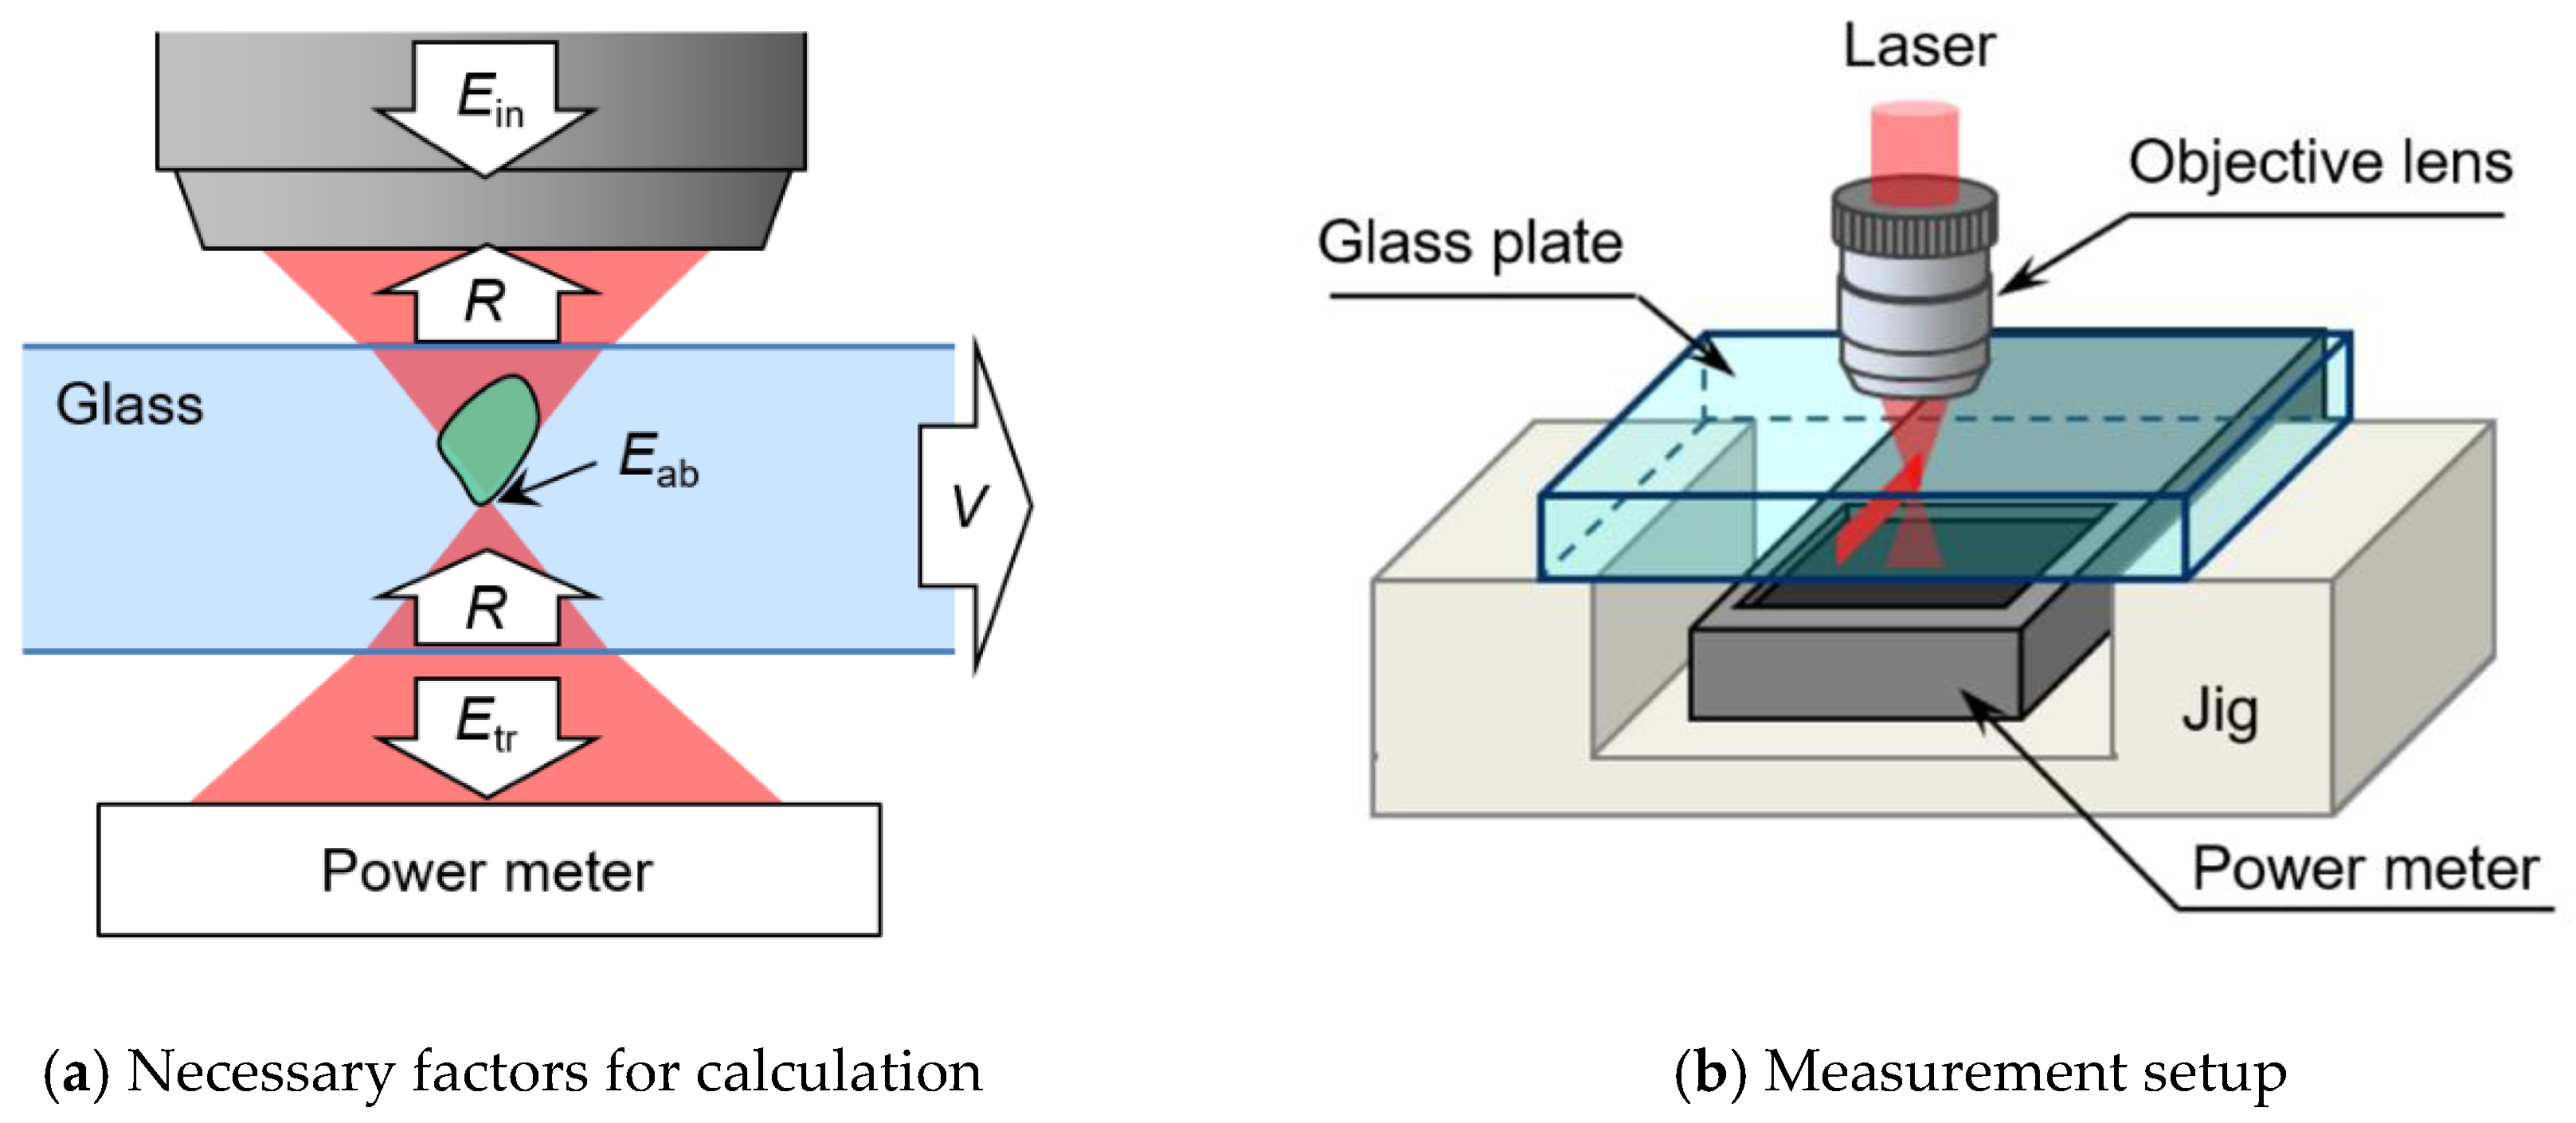
2.4. Measurement Setup of Absorption Rate

Influence of numerical aperture on formation phenomena of molten area was investigated through measuring the absorption rate Aab, which was calculated using Equation (1).
A ab = E ab E in = E in ( 1 R ) 2 E tr E in ( 1 R )
where Eab is the absorbed laser energy, Ein is the input laser energy, R is the reflectivity at the surface of glass, and Etr is the transmitting laser power [19]. Measurement of the absorption rate Aab would be helpful to understand the formation of molten area deeply and hence, discussion of the size of molten area. As shown in Figure 5a, the reflectivity R, input laser energy Ein and transmitting laser power Etr are the necessary factors to calculate the absorption rate Aab using Equation (1). Since the reflectivity R and the input laser energy Ein are known, the transmitting laser power Etr should be experimentally measured to obtain the absorption rate Aab. As can be seen from Figure 5b, the laser beam was focused inside the glass specimen fixed on a jig by the objective lenses of various numerical apertures, and a photodiode type power meter was placed 2.0 mm below the glass specimen to measure the transmitting laser power Etr. At this point, reflection and scattering phenomena of laser beam were not considered, and the measurement and calculated results were recorded as the absorption rate Aab.

2.5. Ray Tracking Method

In order to investigate the influence of numerical aperture on focusing situation, an analysis of ray tracking for numerical apertures 0.45, 0.65, and 0.85 in air and glass were carried out, respectively. The analysis model of ray tracking is shown in Figure 6. Ray tracking is defined as the path that laser beam went through when focused in air or glass, which is helpful to discuss the power density. Thirteen rays of laser beam were initially set in the distance D as the diameter of laser beam at the objective lens. In this analysis, 9.0 mm, 6.0 mm and 5.8 mm were defined for the cases of N.A. 0.45, 0.65, and 0.85, respectively. In other words, the density of ray was 1.44 rays/mm, 2.17 rays/mm and 2.24 rays/mm, respectively. Moreover, the angle of incidence α was 26.74°, 40.54°, and 58.21°, respectively, for corresponding numerical aperture in air, which was calculated using Equation (2).
N . A . = n   s i n α
where n = 1.0, which is the index of refraction of air [28]. Objective lenses with different numerical apertures were used to focus the laser beam, thus it was defined that the rays of laser beam intersected at one point. The focusing length of objective lens f were 9.0 mm, 3.6 mm, and 1.8 mm for N.A. 0.45, 0.65, and 0.85, respectively.

3. Results and Discussion

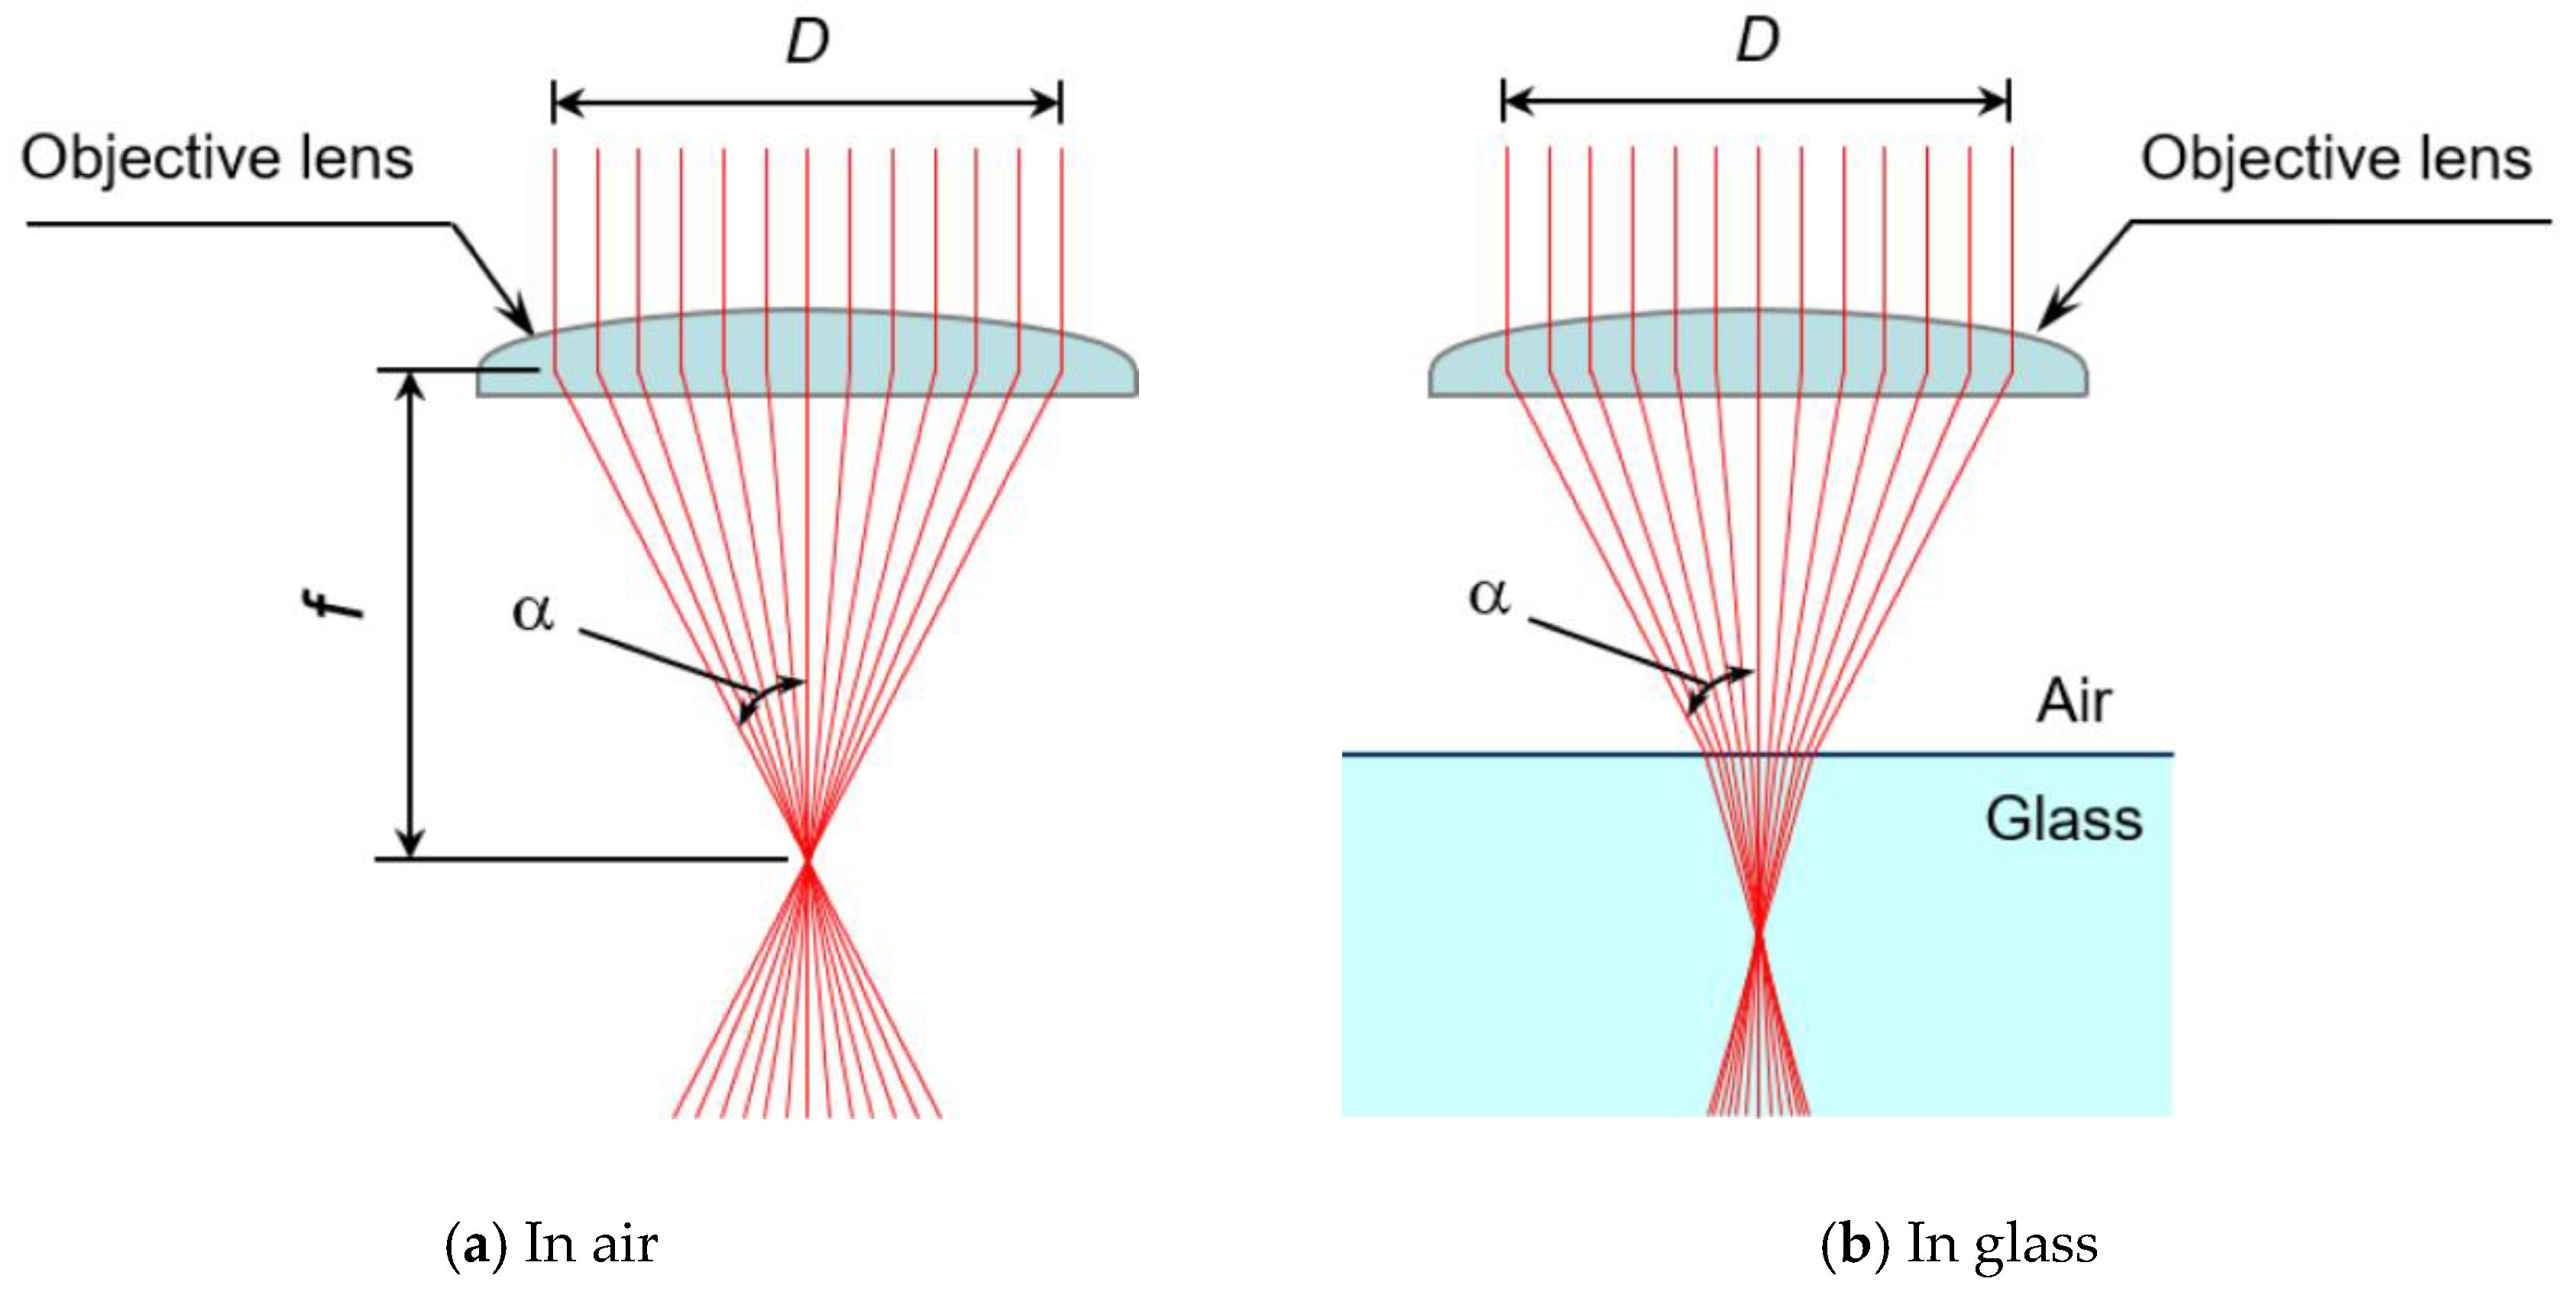
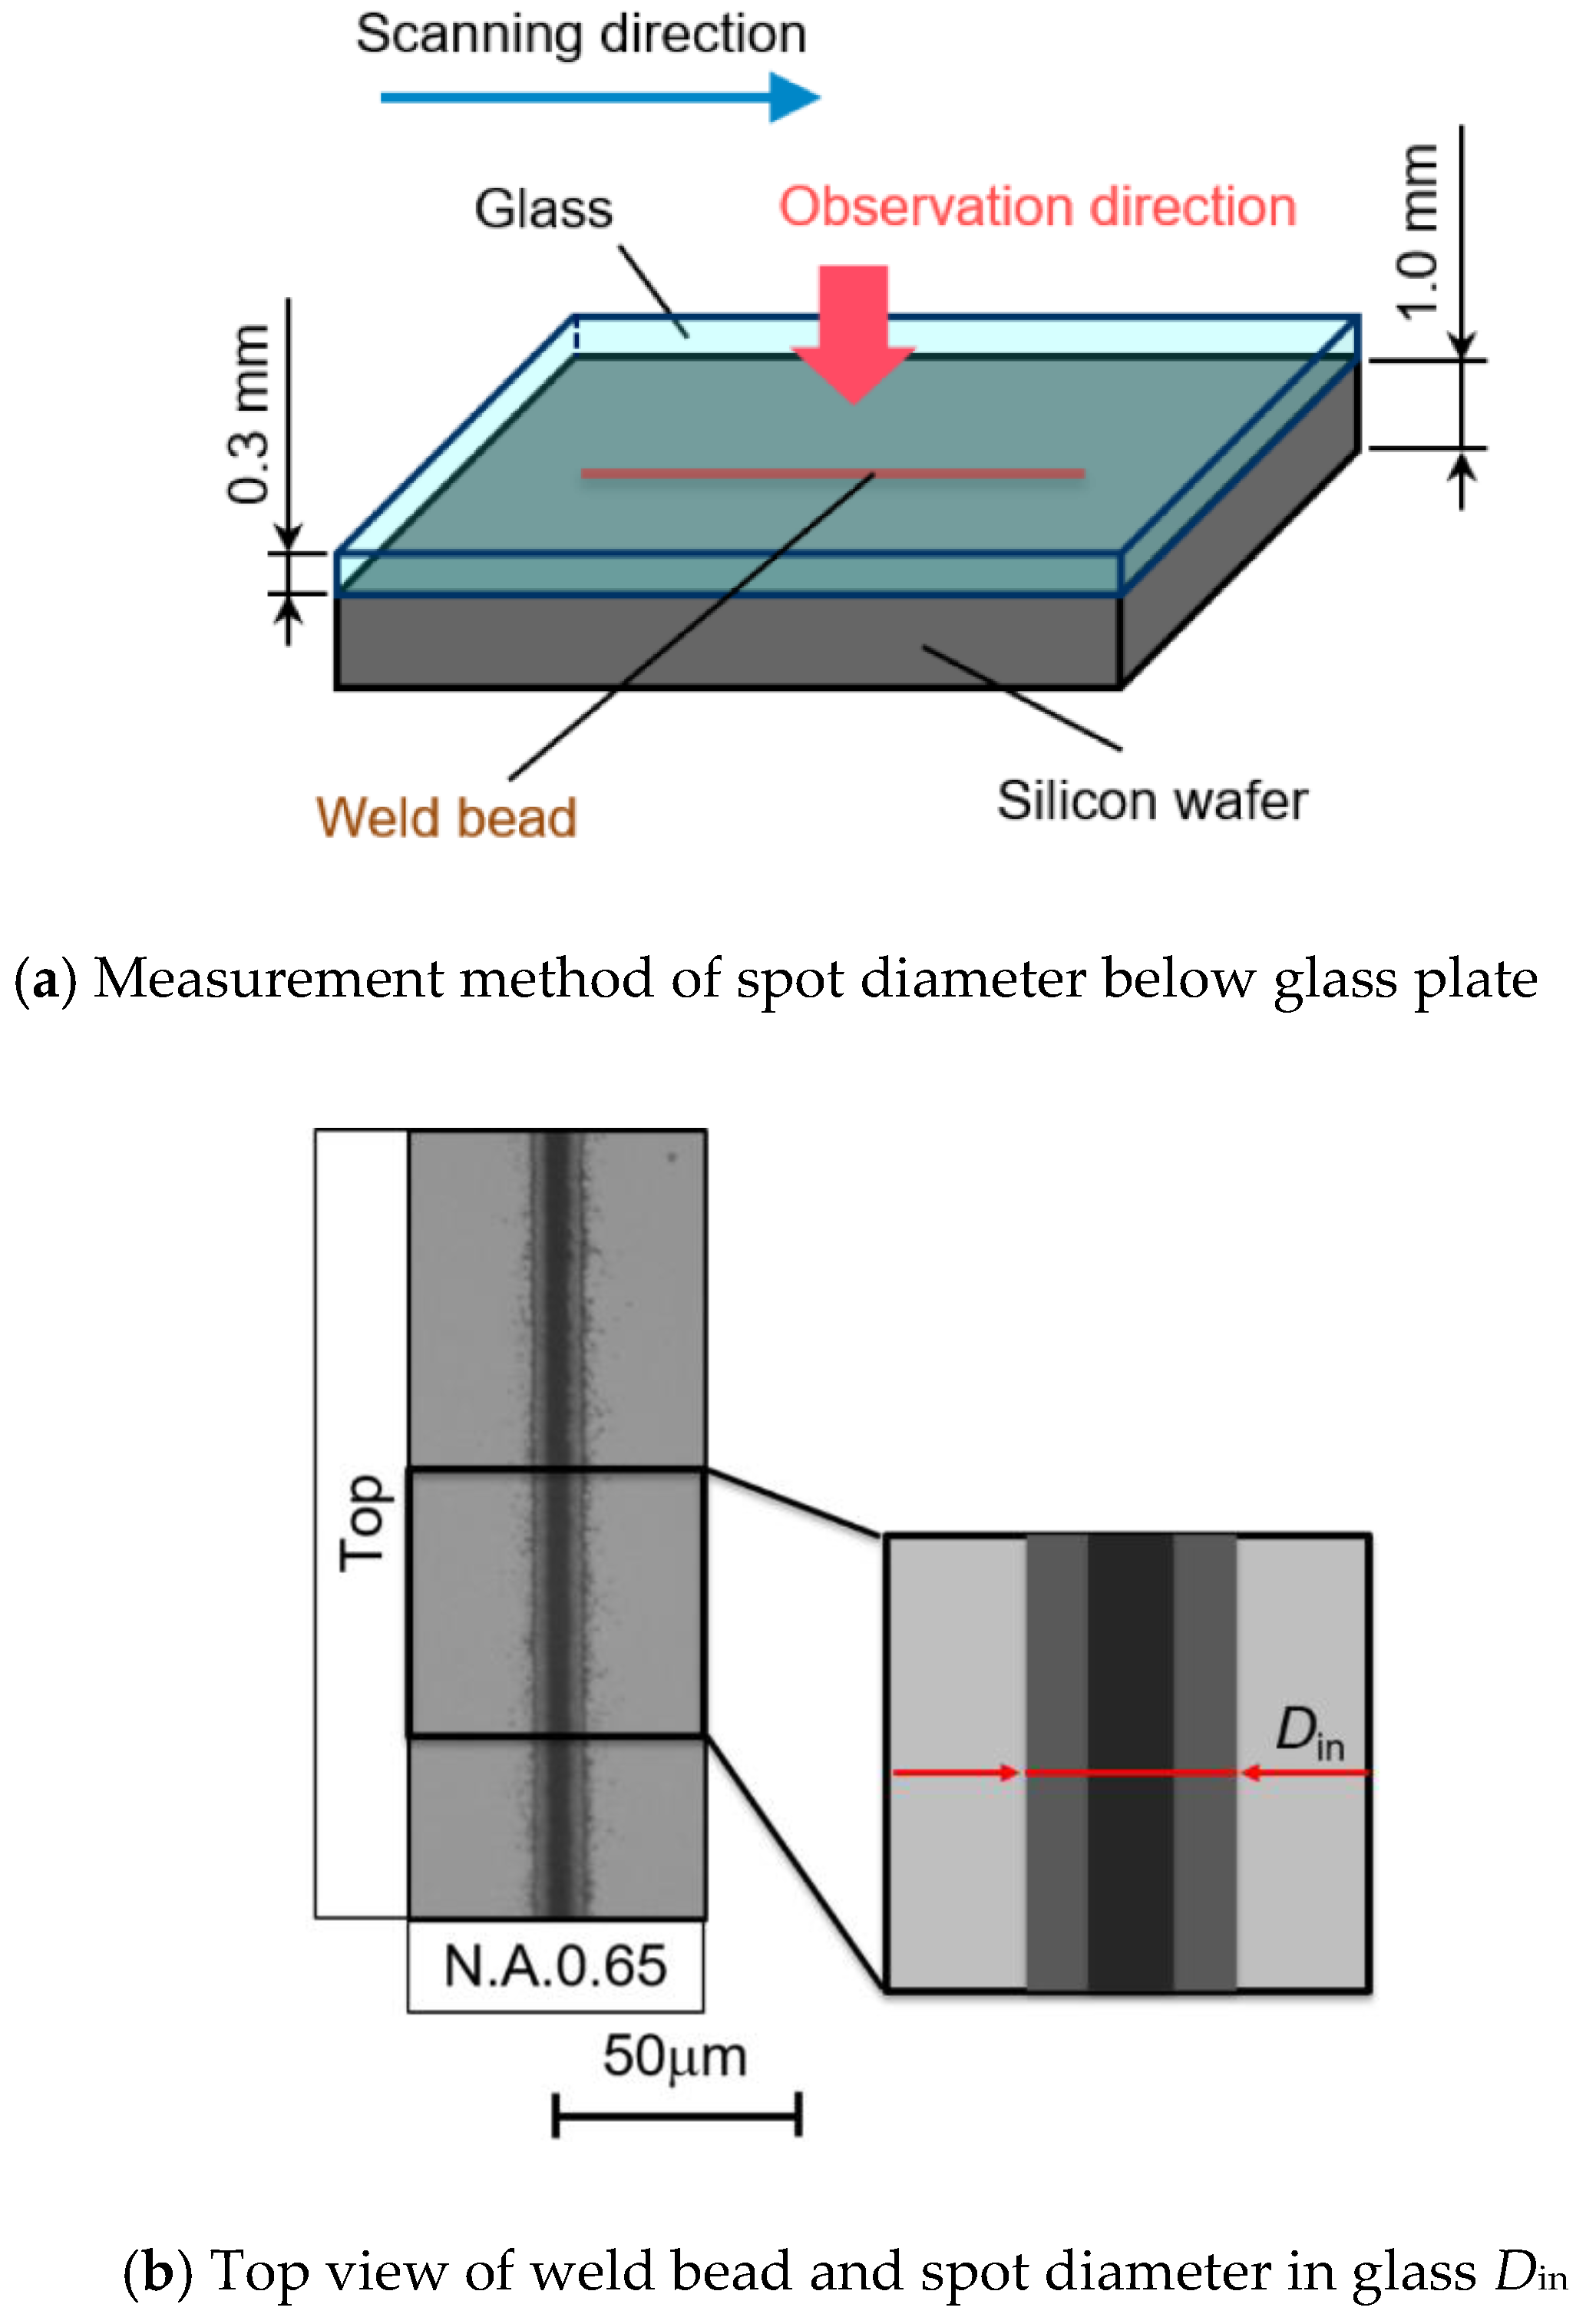
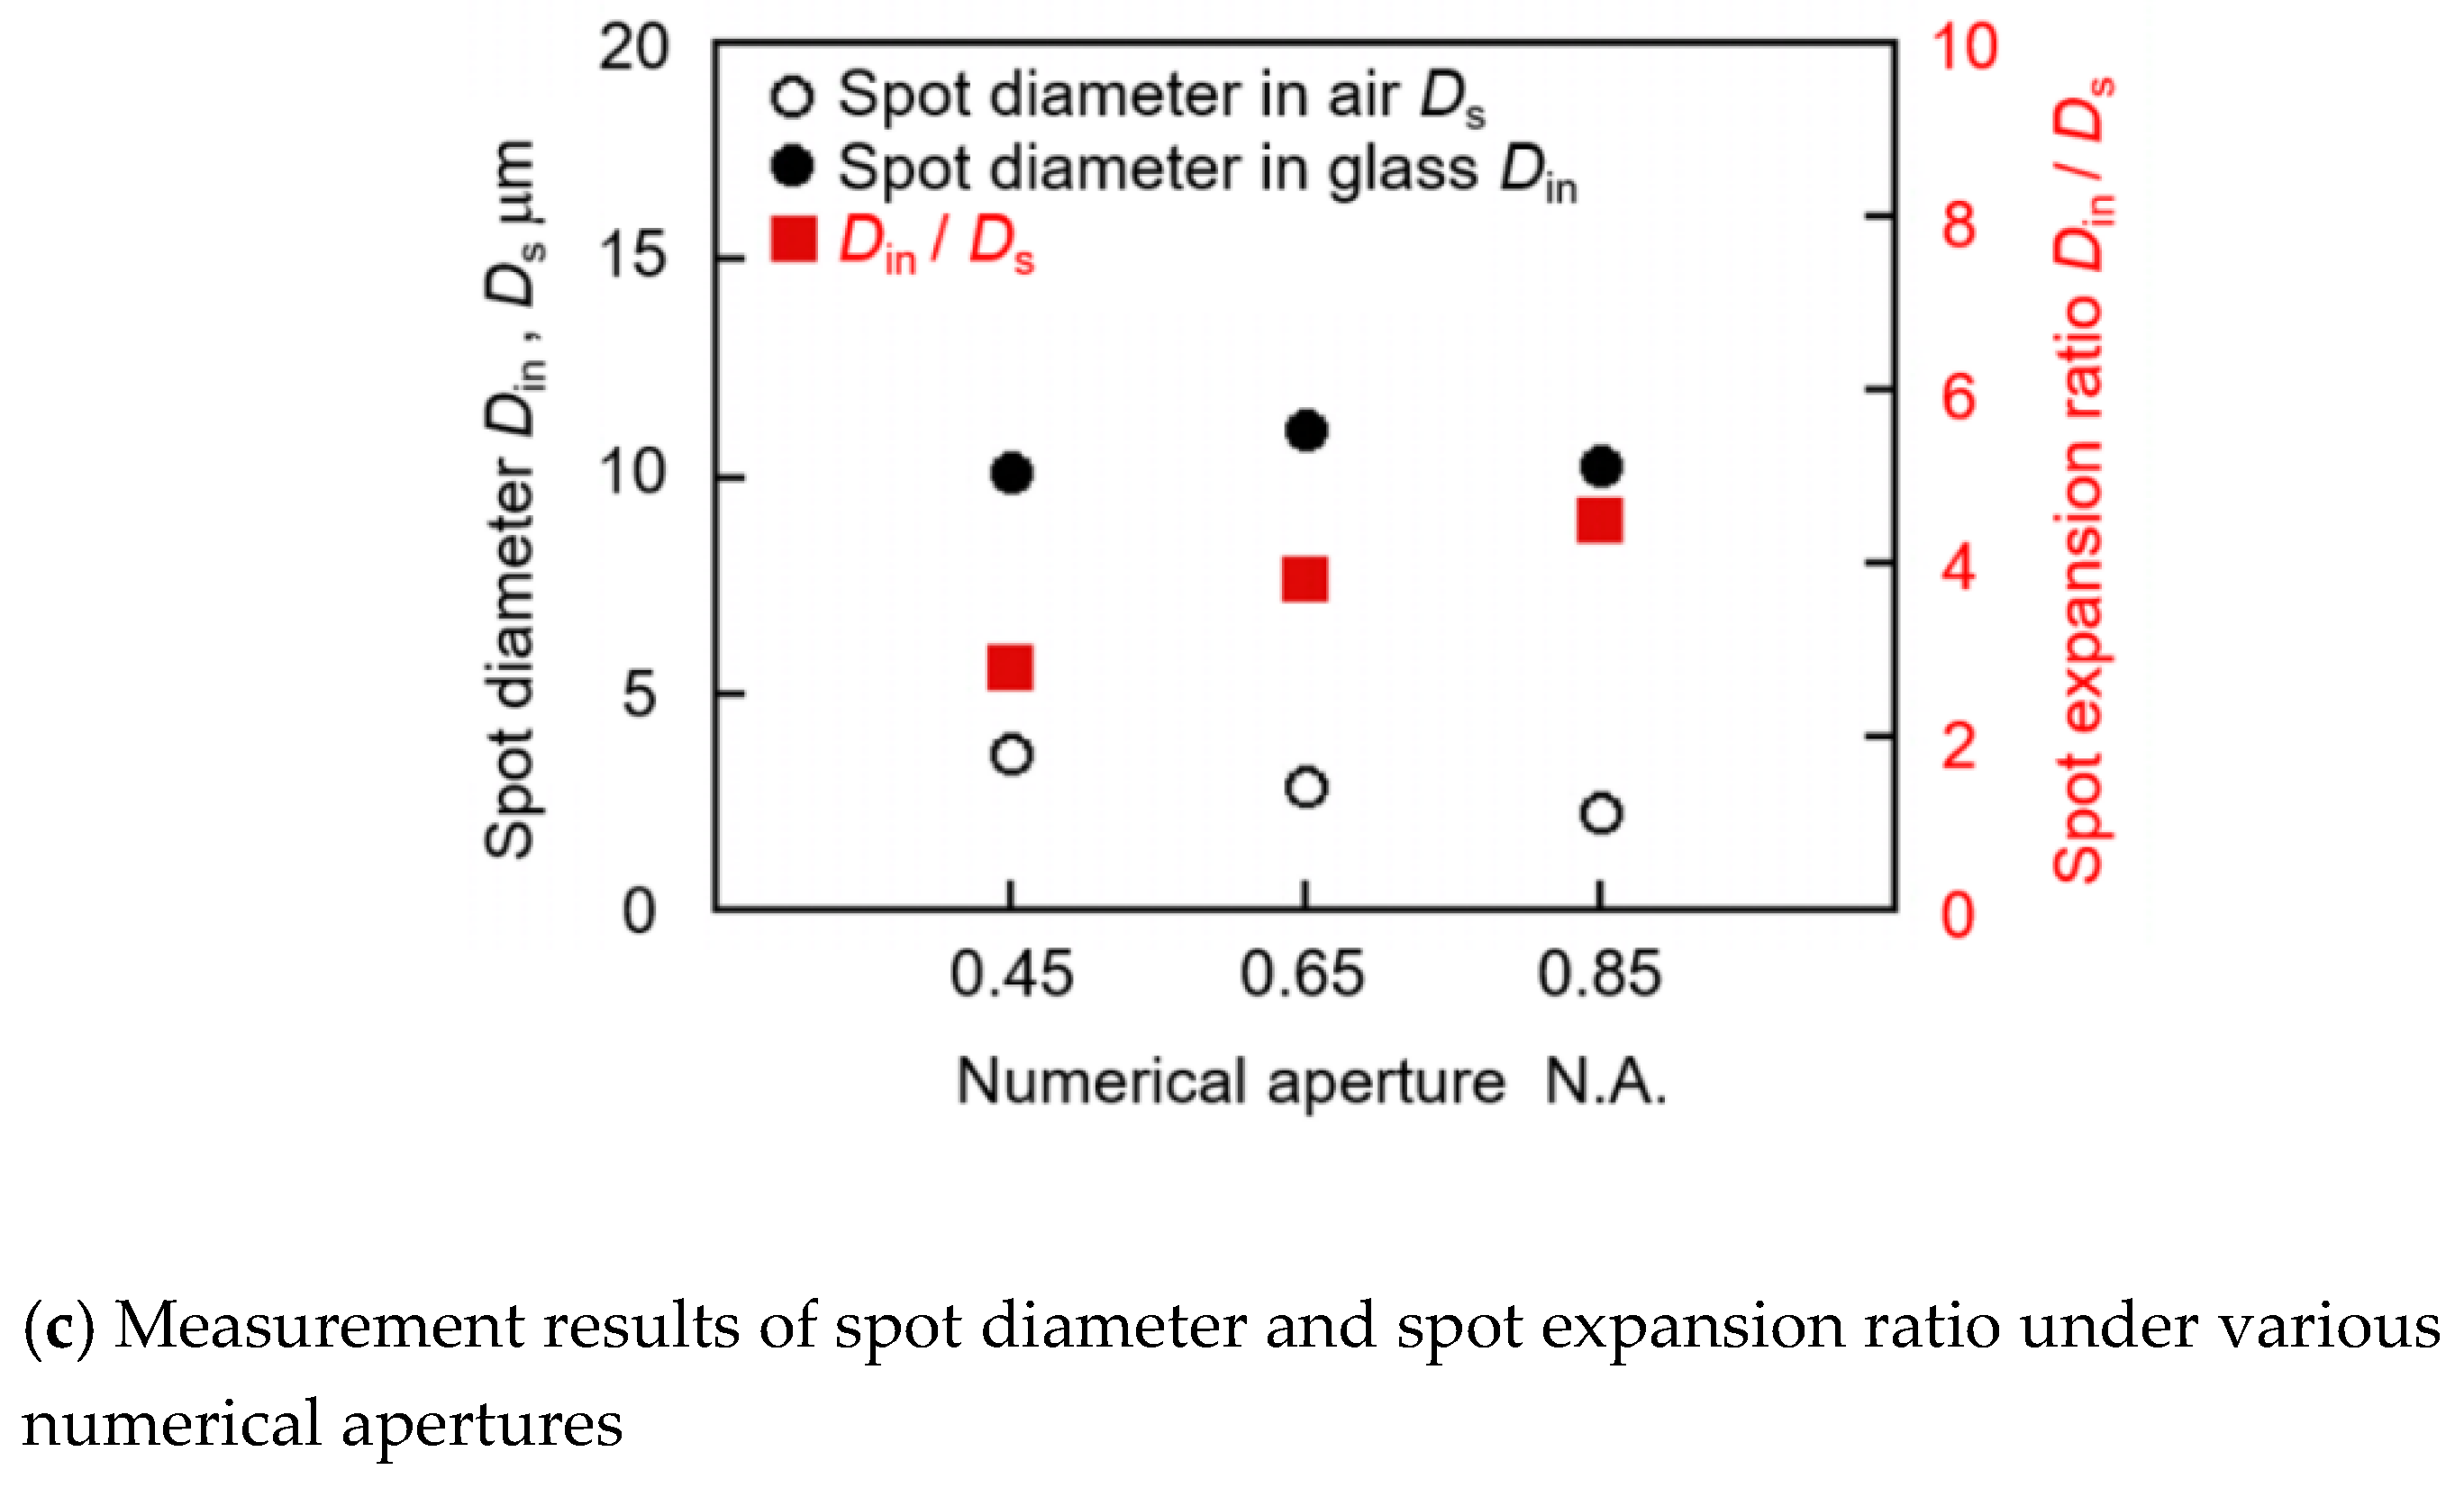
3.1. Influence of Numerical Aperture on Focusing Situation in Glass

Optical microscope was used to observe the side view of molten area in the scanning direction of laser beam, as shown in Figure 7. The laser beam was tightly focused inside glass by objective lens of N.A. of 0.65 with spherical aberration correction. The pulse repetition rate, scanning velocity, and pulse energy were 1.0 MHz, 100 mm/s, and 1.5 µJ, respectively. As can be seen from the figure, the starting point of laser absorption was created when an ultrashort pulsed laser beam was tightly focused inside the glass, and the absorption area was expanded by the upward movement of the absorption point. Then, this absorption point was dropped down and shifted to the right side to complete the first cycle of molten area formation, and new starting point of laser absorption was established. The process was repeated periodically, and the welding lines were created. Therefore, molten area was not created by only one laser shot, but by the sum of multiple laser shots [19]. It is considered that the focusing condition such as numerical aperture has a great influence on this phenomenon, which is strongly related to the absorbed energy of the laser beam.
The results of ray tracking are shown in Figure 8a,b. The most centralized part in the path of ray tracking was defined as the spot, and the distance between upper intersection point and bottom intersection point in laser beam axis was determined as the elongation distance of spot d1 + d2. It can be seen from Figure 8a that d1 + d2 was equal to 0 for each numerical aperture in air, and higher numerical aperture resulted in diffusion of laser beam. Figure 8b shows that rays of laser beam of each numerical aperture passed through the interface between air and glass. Then, the angle of ray changed because of a different refractive index at the interface between air and glass, according to the Snell’s law. It can be seen that rays of laser beam did not intersect at one point, which indicated that the laser beam could not be focused in glass the same way as that in air. The value of d1 + d2 was smaller, when numerical aperture was lower, such as 0.45. This result showed that the distance of high power density in laser beam axis was shorter, and it was difficult to maintain absorption of laser energy. However, the rays of laser beam in laser irradiation direction diffused evidently, when the numerical aperture was higher. Therefore, higher numerical aperture indicated that the focusing situation was more likely to be disturbed. This is because higher numerical aperture such as 0.85 resulted in larger angle of incidence, and thus larger angle of refraction. This phenomenon caused loose focusing situation in glass and thus the reduction of power density. Thus, it can be considered that the spot diameter in glass would be decreased with increasing numerical aperture. N.A. of 0.65 showed superior focusing characteristics when compared with N.A. of 0.45 and 0.85, which enables achievement of stable welding of glass. The measurement results of spot diameter and absorption rate for various numerical apertures are discussed in subsequent sections.
Figure 9 shows the measurement results of laser spot focused in glass. As shown in Figure 9a, the glass plate of 0.3 mm thickness and monocrystalline silicon wafer of 1.0 mm thickness were placed together by optical contact, and then laser beam was focused and scanned around the interface of these two materials from the glass plate side. The top view of the formed weld bead in the case of N.A. of 0.65 and the definition of spot diameter in glass Din are shown in Figure 9b,c shows the measurement results of spot diameter in glass Din, spot diameter in air Ds and spot expansion ratio Din/Ds with various numerical apertures. Din/Ds is the ratio of spot diameter in glass and spot diameter in air, which determines the expansion ratio of laser spot in glass to that in air. As can be seen from Figure 9c, spot diameter in air Ds decreased with increasing numerical aperture. The laser spot in glass was expanded, compared to that in air for all numerical apertures of objective lenses, which was caused by refraction of laser beam in glass. In addition, higher numerical aperture showed larger spot expansion ratio than lower numerical aperture, which indicated that laser spot was largely expanded. This result agreed well with the conclusion of ray tracking that higher numerical aperture caused a loose focusing situation in glass. Therefore, numerical aperture has a great influence on the focusing situation of laser beam in glass, and it is important to choose a proper numerical aperture of objective lens in the fusion micro-welding of glass.

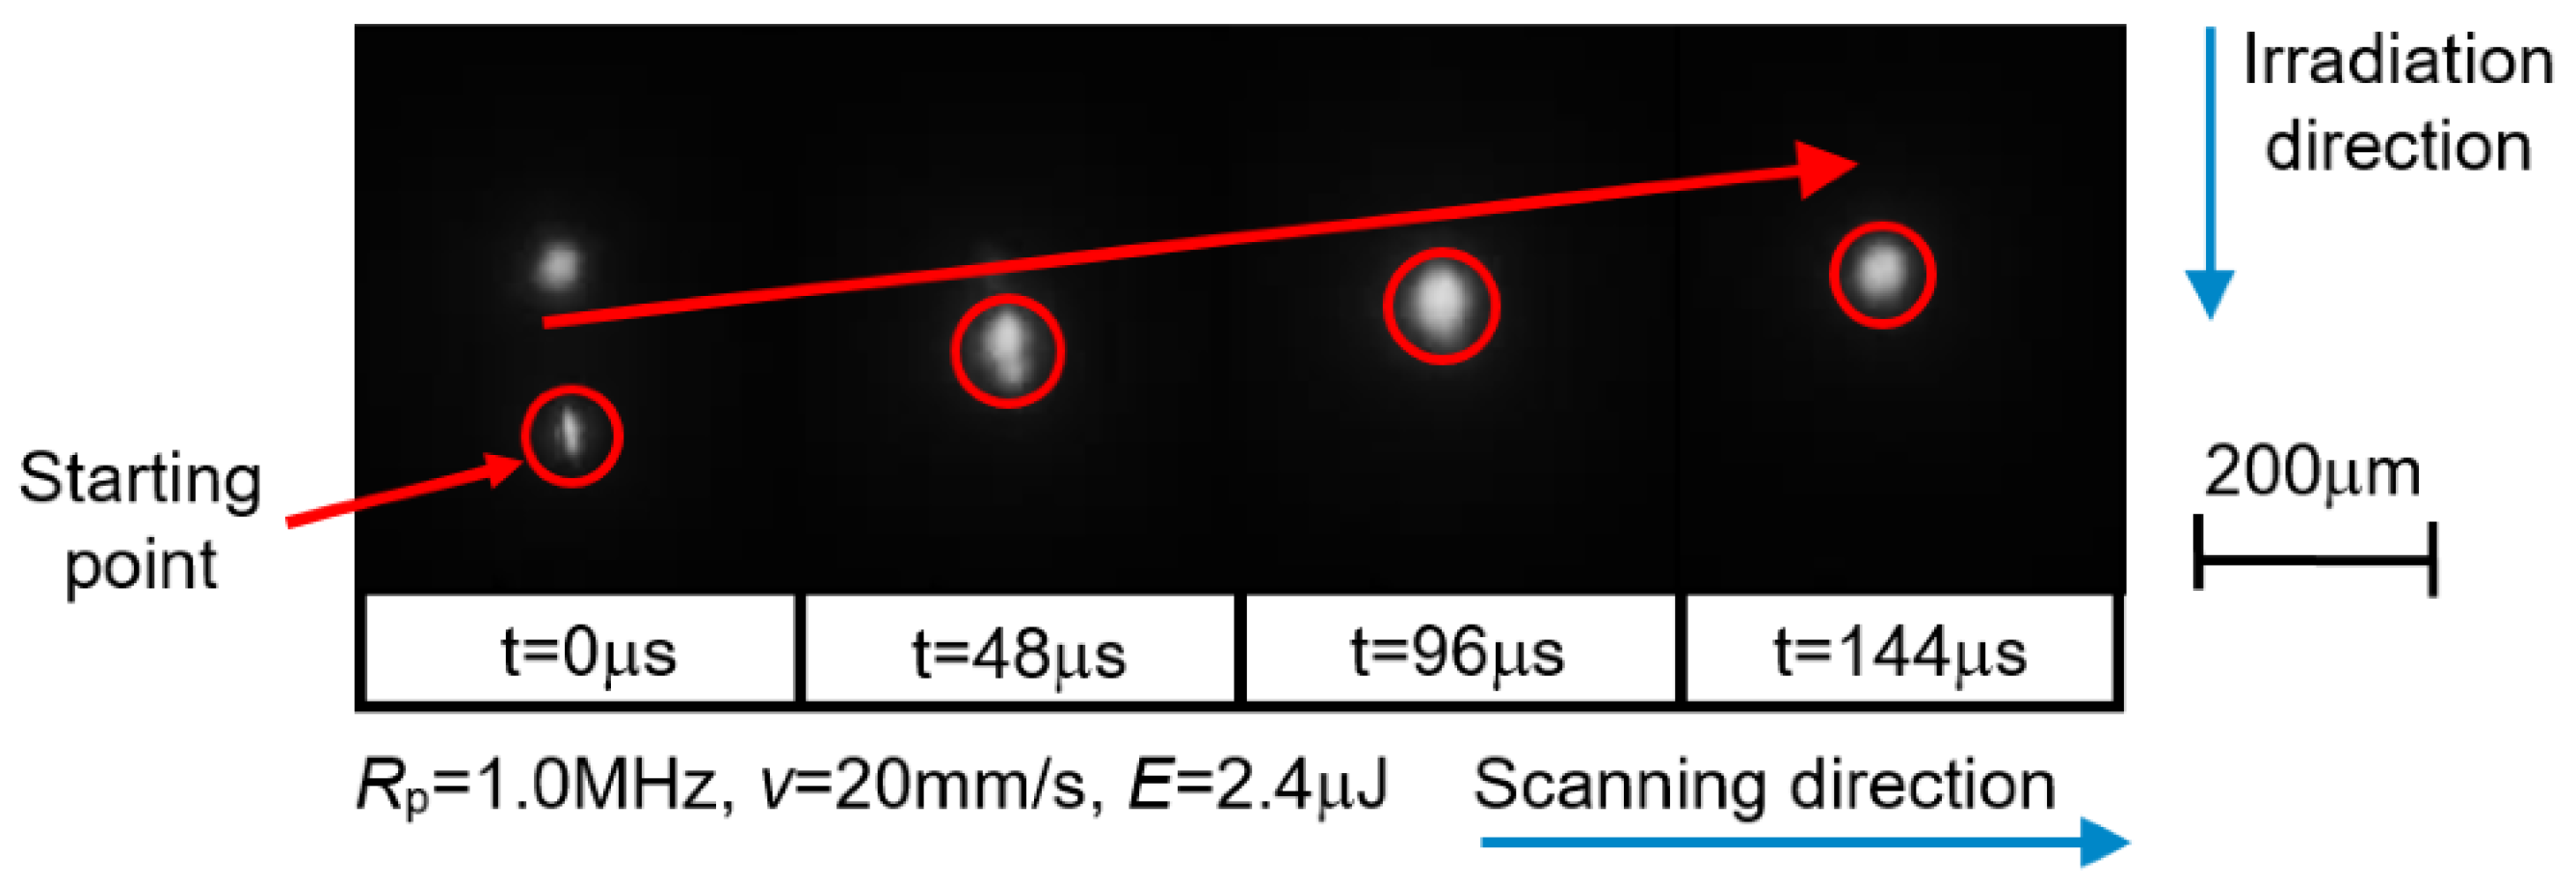
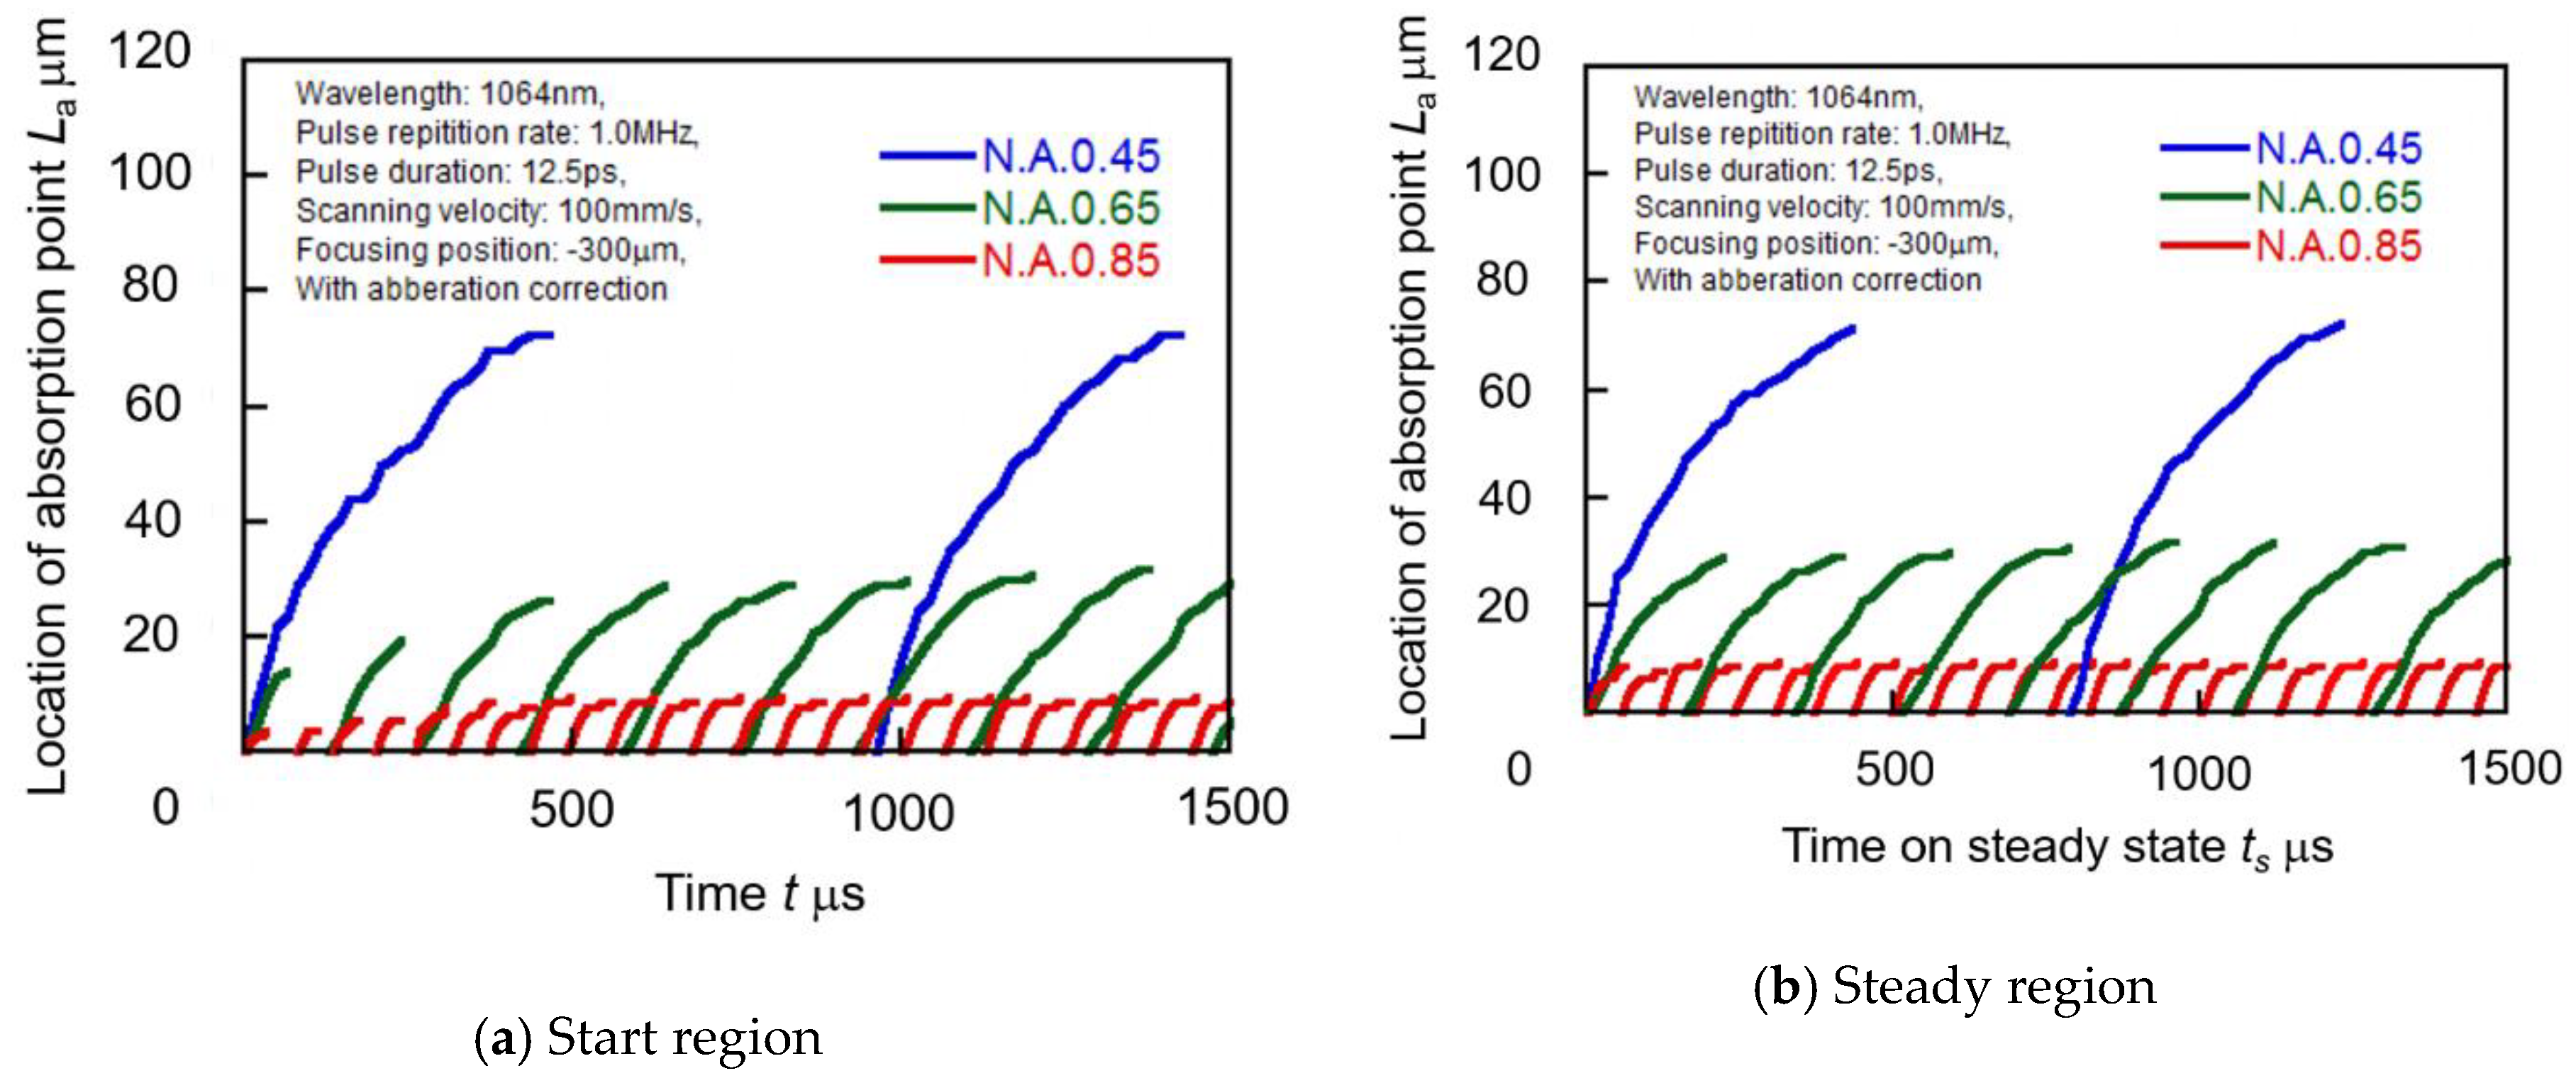
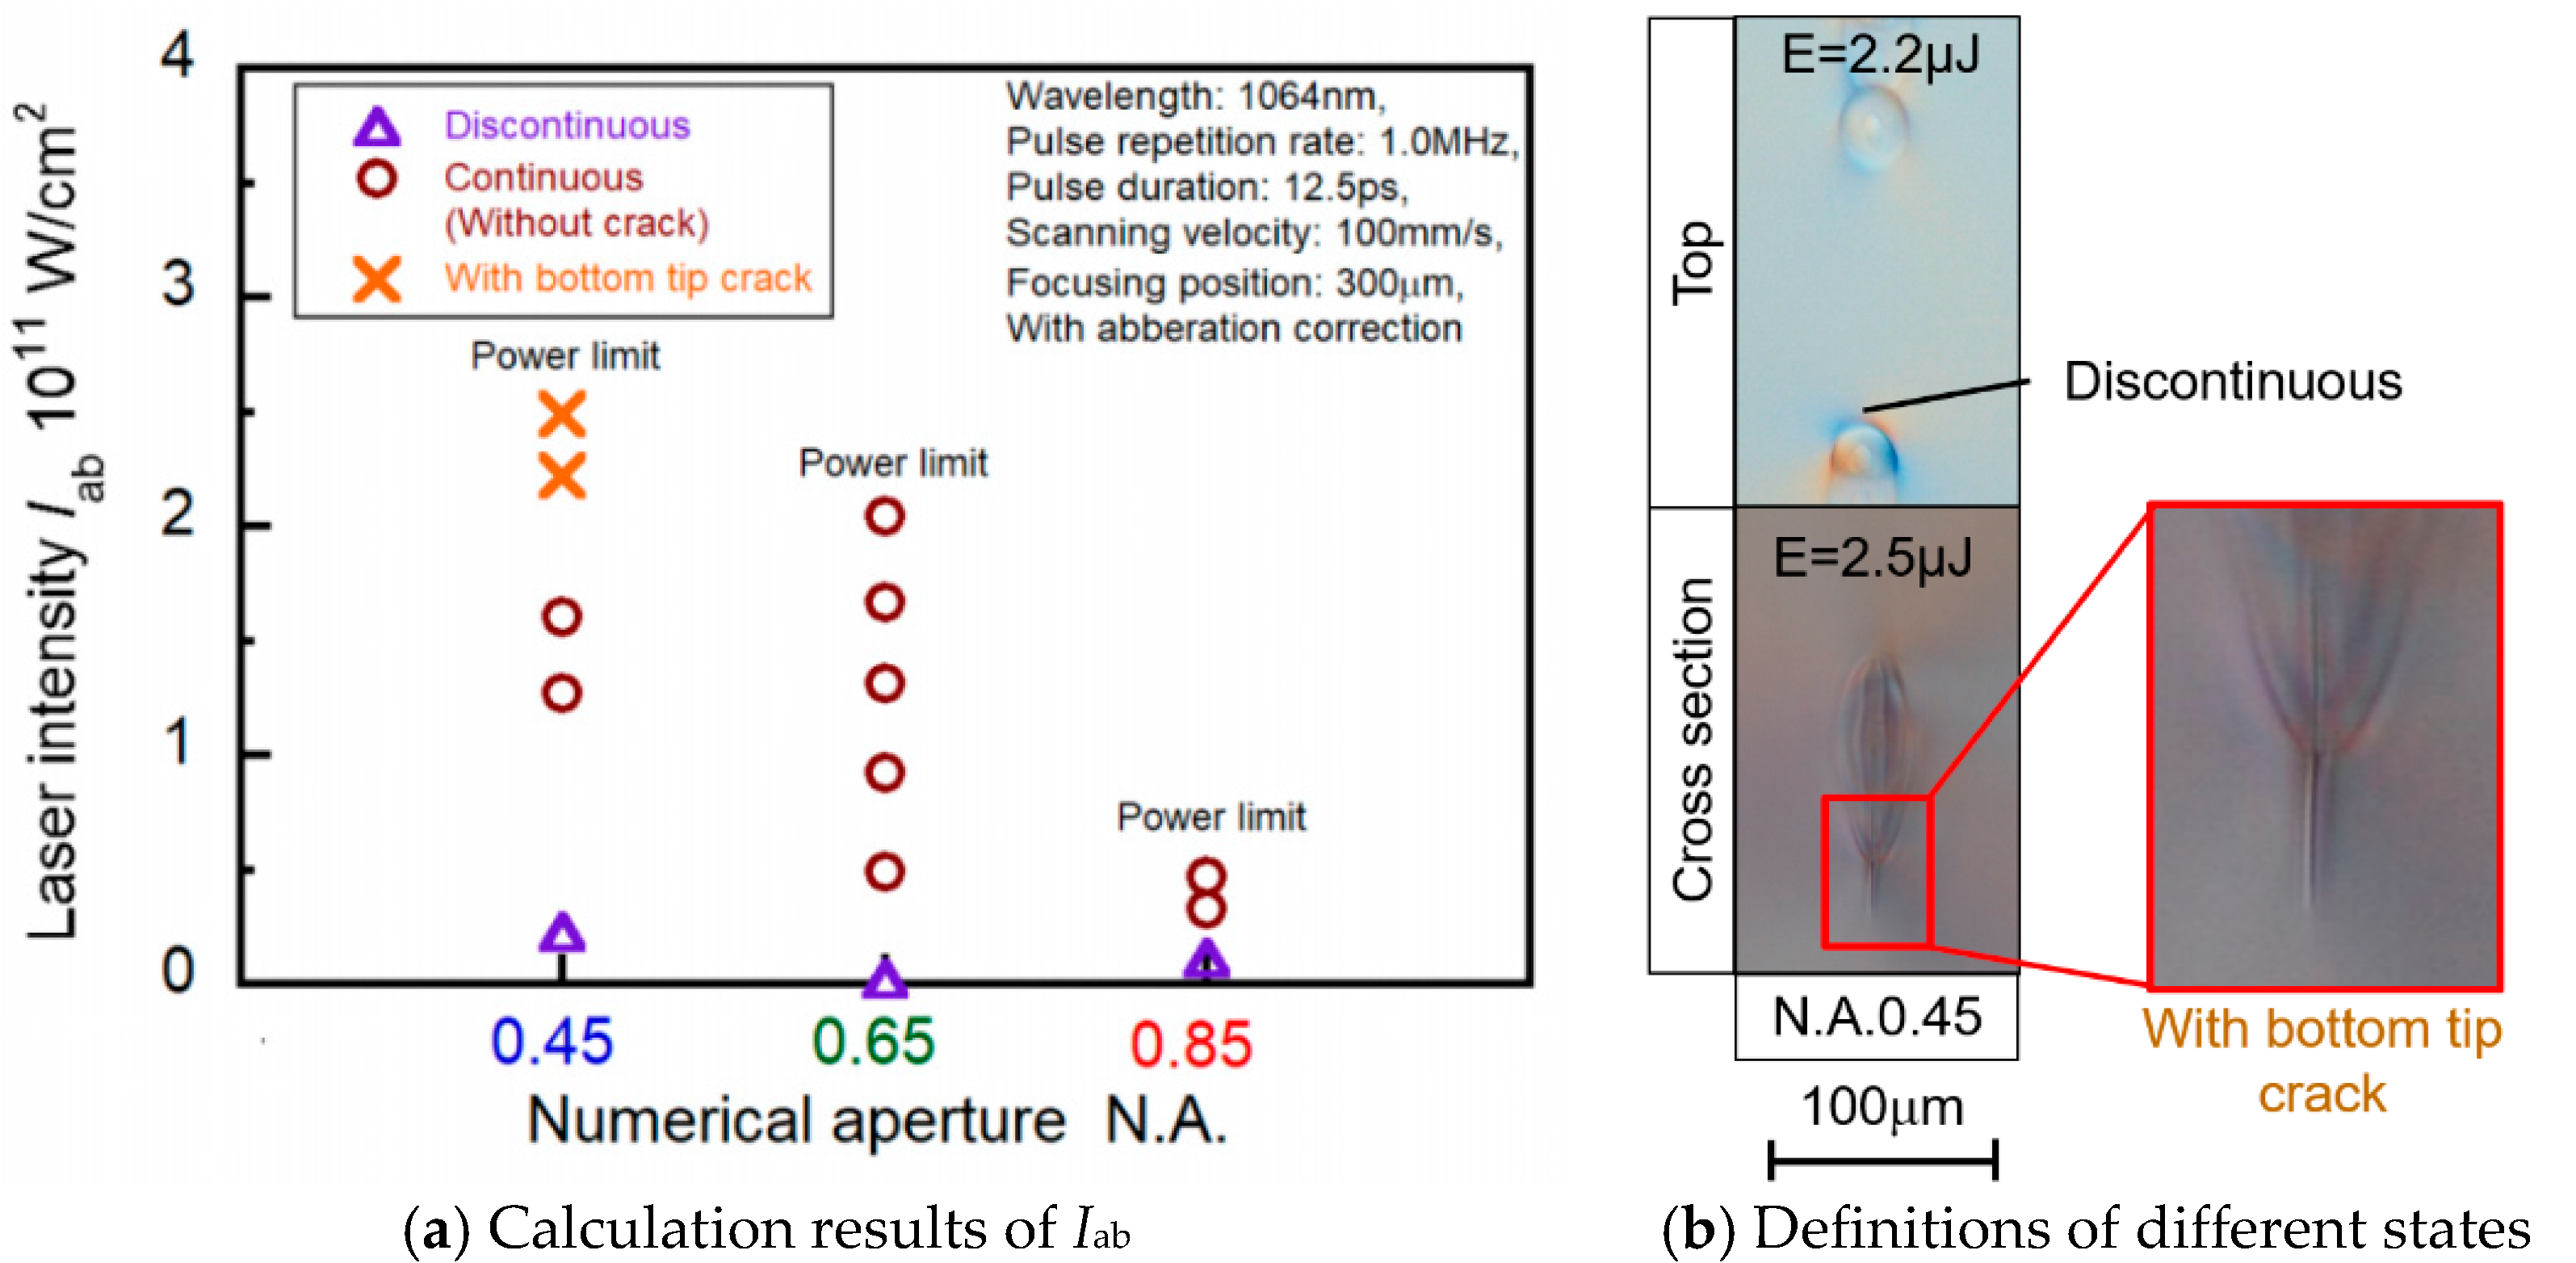
3.2. Influence of Numerical Aperture on Movement of Absorption Point

As mentioned above, different focusing situations were obtained by using objective lenses of different numerical apertures. It was also understood that absorption point moved repeatedly in laser irradiation direction and molten area was created around the focusing point [19]. Therefore, it can be considered that numerical aperture would have an influence on movement of absorption point, and this was experimentally investigated by the formation phenomena of molten area and the absorption rate with different numerical apertures in this section.
The absorption of laser energy is based on multi-photon ionization and avalanche ionization of nonlinear phenomenon, when an ultrashort pulsed laser beam is tightly focused inside the glass. The focusing point is considered as the starting point for laser absorption, which is defined as the absorption point. In this study, high-speed video camera was used to observe the absorption point movement without illumination light. Only plasma light was observed during this observation, which was easy to recognize the absorption point, as shown in Figure 10. The laser irradiation condition of pulse repetition rate 1.0 MHz, scanning velocity 20 mm/s and pulse energy 2.4 µJ was employed in this experiment. In order to estimate the amount of effective laser pulses that reached the glass per spot volume, the number of overlapped laser pulses N was calculated using Equation (3).
N = D in R p v
where Din is the spot diameter in glass, Rp is the pulse repetition rate and v is the scanning velocity [29]. Here, pulse repetition rate and scanning velocity are Rp = 1.0 MHz and v = 20 mm/s, respectively. According to the results shown in Figure 9c, spot diameter Din is estimated as 10 µm. Therefore, the calculation result of N is 500, showing that 500 overlapped laser pulses reached the glass per spot volume in this experiment. In the captured images of Figure 10, the absorption point of laser beam moved in upper direction with increasing time from the starting point. It should be noticed that there were two white spots at t = 0 µs. This phenomenon indicates the transition of absorption point, which was dropped down from the upper side.
Then, the location of absorption point was measured in these captured images by calculating the feed rate of specimen. The location of lowest point of absorption movement was set to 0 µm, and the direction to the laser source was considered as positive value. These measurement results were arranged as the relationship between location of absorption point La and time for various numerical apertures, which indicated the influence of numerical aperture on formation phenomena of molten area, as shown in Figure 11. Figure 11a shows the measurement results at the start region of laser irradiation. N.A. of 0.45 showed a constant maximum location of absorption point from the start. On the other hand, maximum location of absorption point movement during one cycle increased with time at beginning in the case of N.A. of 0.65 and 0.85. Then, the location of absorption point of these two numerical apertures took a constant maximum value, and each cycle of absorption point movement was almost constant after 400 µs and 300 µs, respectively. This state was referred to as the steady region. After recounting the time, the relationship between Ha and time of the steady region is shown in Figure 11b. It can be seen that location of absorption point was varied by numerical apertures. Lower N.A., which showed a constant maximum location of absorption point from start of irradiation, obtained a larger location of absorption point and longer cycle of absorption point movement in the steady region, compared with higher N.A. However, longer movement of absorption point in case of lower N.A. caused longer cycle of heating and cooling in the upper and lower parts of molten area, and thus the imbalance of temperature distribution would result in a large thermal stress and unstable phenomena. In contrast, higher N.A., which showed increasing location of absorption point at the start of irradiation, obtained smaller location of absorption point and shorter cycle of absorption point movement in the steady region. Thus, accurate control of absorption point could be expected by using the objective lens of higher N.A. On the other hand, in the case of N.A. of 0.65 and 0.85, it is considered that micro-welding without cracks can be achieved in a wide range of irradiation conditions because of smaller location of absorption point, shorter cycle of absorption point movement, and shorter cycle of heating and cooling.
In order to investigate the absorption rate Aab for various numerical apertures, the transmitting laser power Etr was measured by using a power meter. Then absorption rate Aab was calculated based on the measurement results of transmitting laser power Etr. Figure 12 shows the relationship between pulse energy and absorption rate of laser energy for various numerical apertures. As can be seen from the figure, absorption rate Aab increased with increasing pulse energy, and drastic change of absorption rate Aab occurred for all numerical apertures of objective lenses, which indicated that the absorption of laser energy in glass was a nonlinear phenomenon. N.A. of 0.65 showed the highest absorption rate compared to N.A. of 0.45 and 0.85. It is considered that longer cycle of absorption point movement and no absorption of laser energy during the interval time of teardrop-shaped molten area formation resulted in lower absorption rate in the case of N.A. of 0.45. However, N.A. of 0.85 showed a lower absorption rate, although the cycle of absorption point movement was short, which would be caused by the increased dispersion of laser beam at the focal point inside the glass.

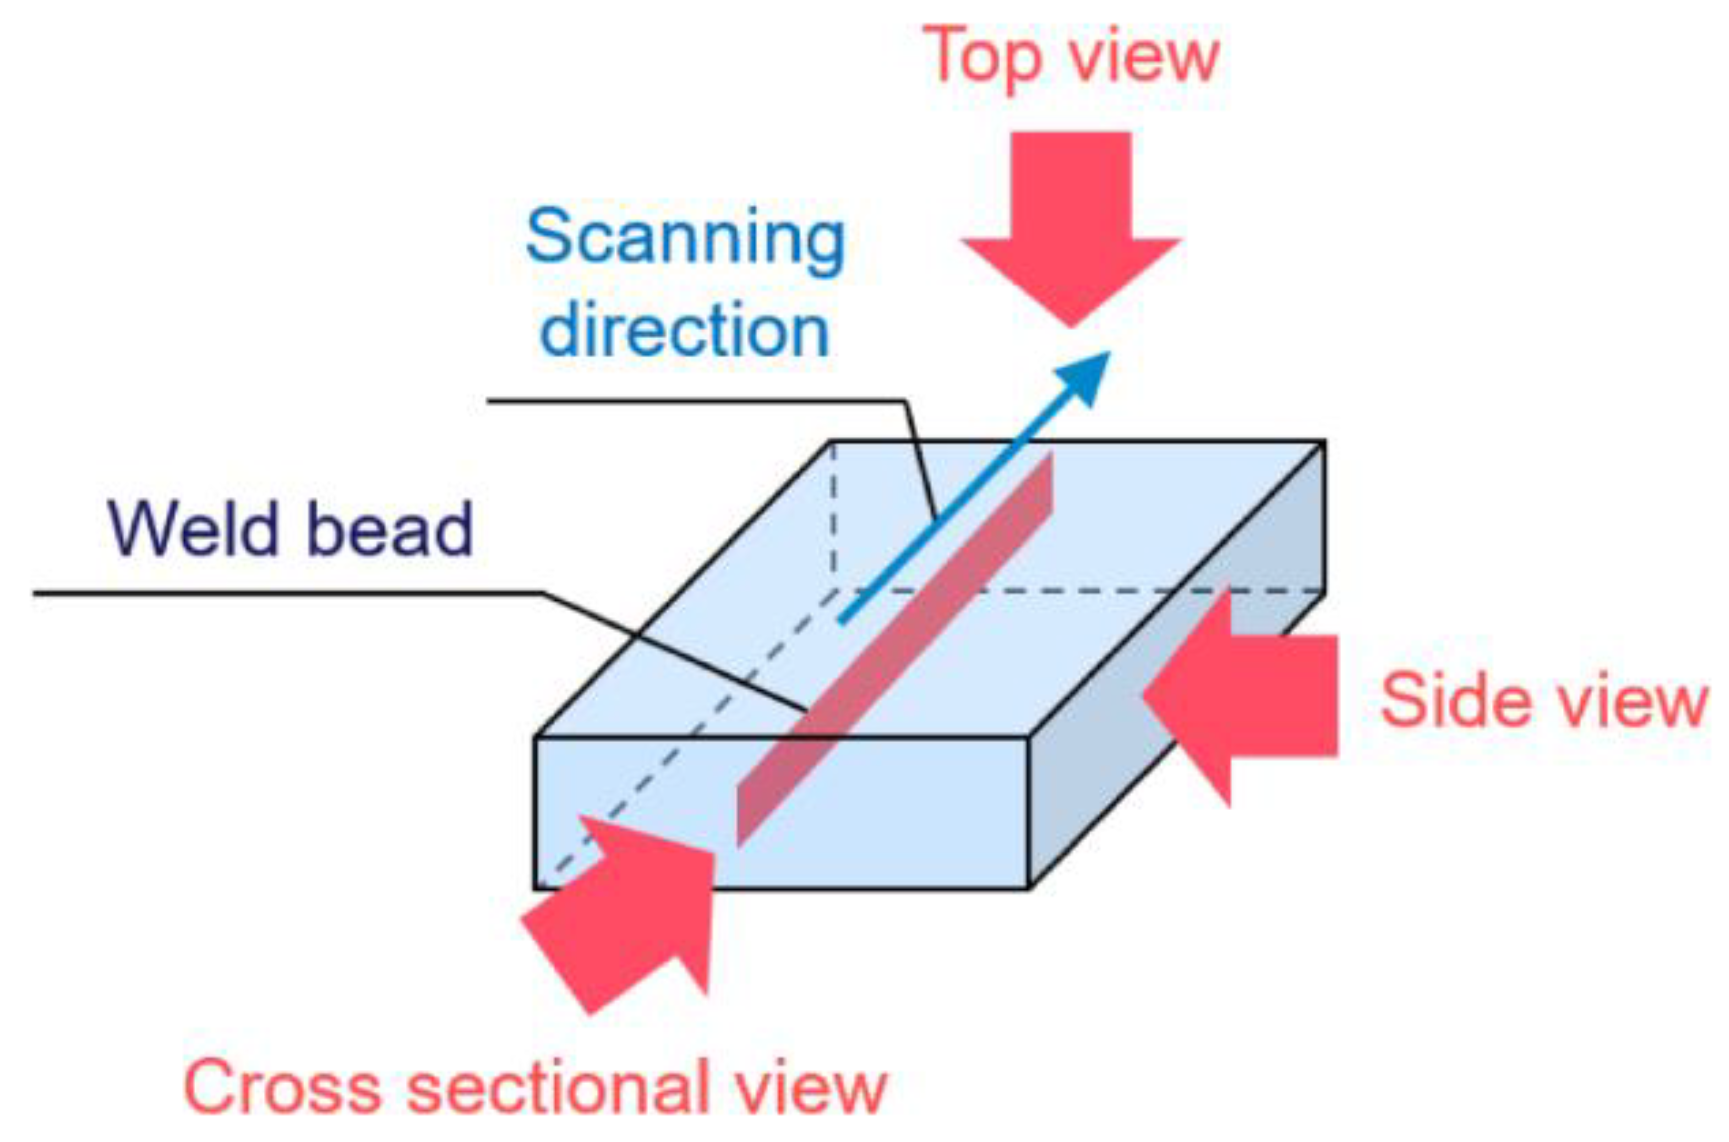
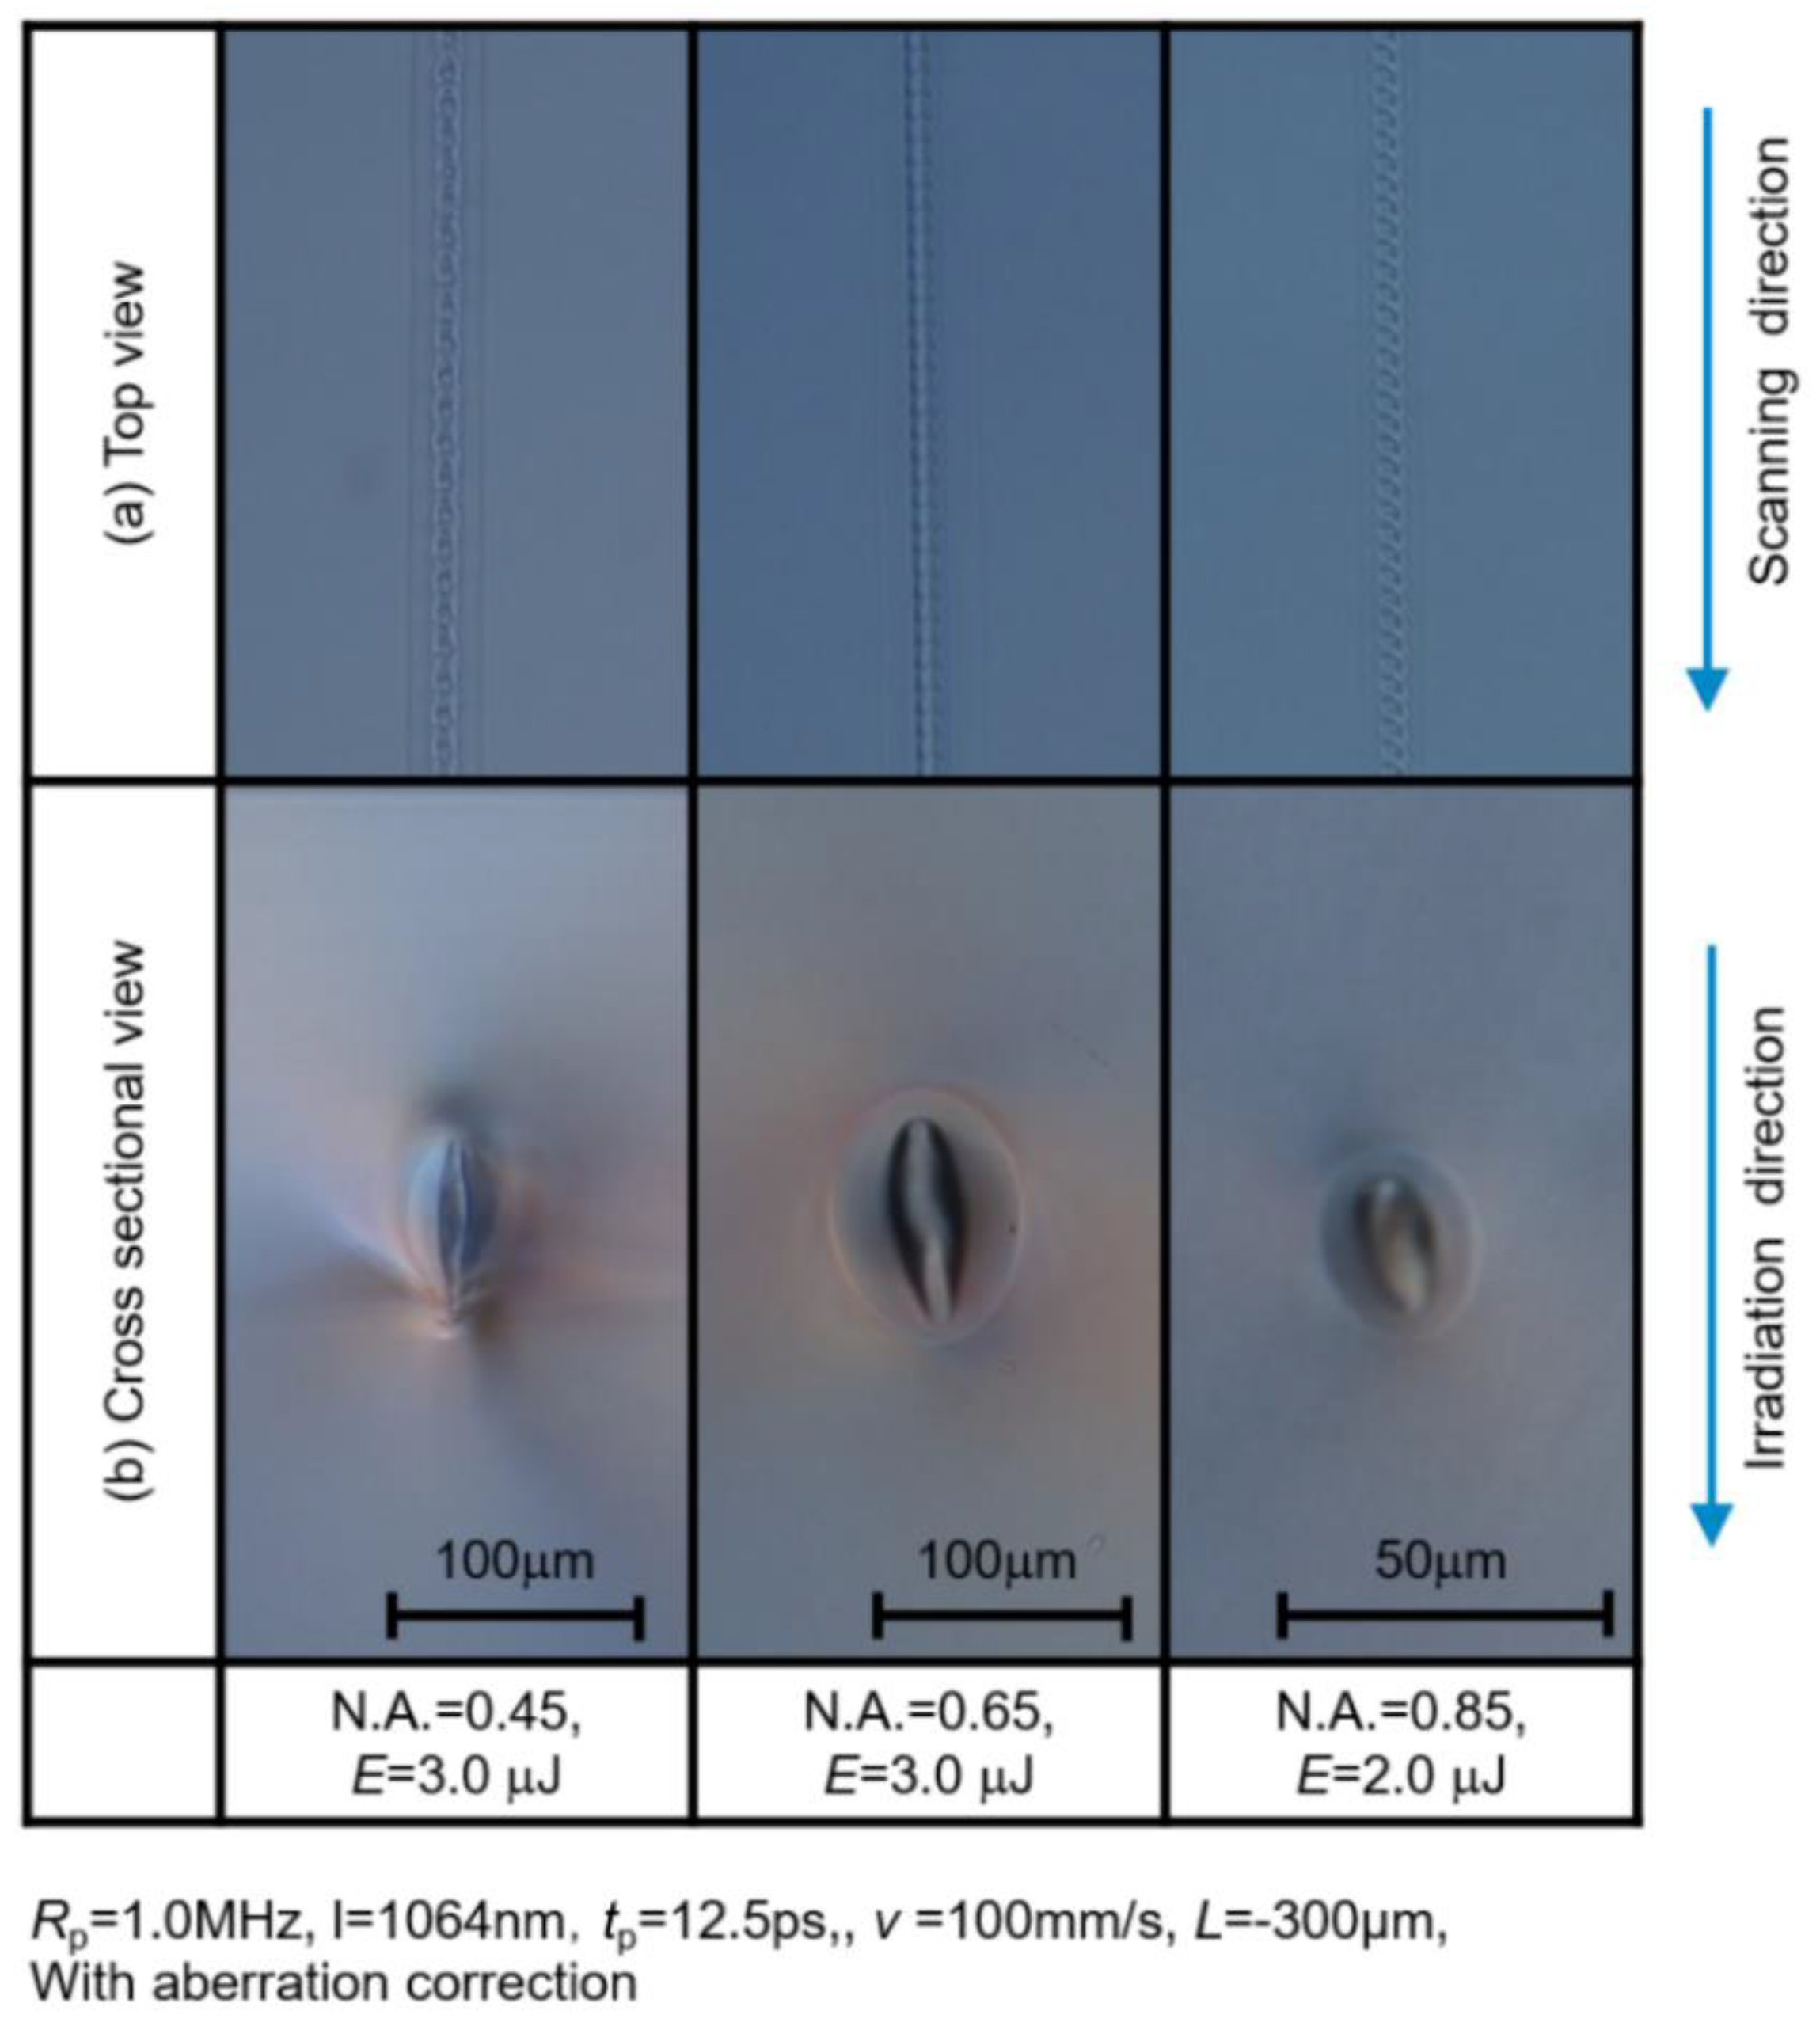
3.3. Influence of Numerical Aperture on Molten Area Characteristics

It is well known that absorption point moved repeatedly in the laser irradiation direction and molten area was created around the focusing point. Thus, based on the discussion of absorption point movement, molten area characteristics such as the state, size and shape by different numerical apertures were investigated in this section.
In order to discuss the state of molten area, considering the results of absorption rate mentioned above, laser intensity Iab at the focusing point was calculated using Equation (4).
I ab = 4 E in A ab π d s 2 τ p
where Ein is the input laser energy, Aab is the absorption rate, ds is the diameter of laser beam at focal point, and τp is the pulse duration [30]. These calculation results were shown in Figure 13a, in which the triangular marks show discontinuous creation of molten area, the circular marks show the continuous creation of molten area without crack, and the cross marks show appearance of crack at the bottom tip. Figure 13b shows the example of these different states observed by the optical microscope, in the case of N.A. of 0.45. The discontinuous creation of molten area was observed from the top view at the pulse energy of 2.2 µJ, and the crack appeared at the bottom tip of molten area, as shown in cross sectional view at the pulse energy of 2.5 µJ. As can be seen from Figure 13a, N.A. of 0.65 can create a molten area without crack by using the highest laser intensity. This phenomenon shows that N.A. of 0.65 can absorb higher laser energy without cracks, which is expected to result in a large size of molten area compared with other N.A values. Therefore, objective lens with N.A. of 0.65 can achieve stable and efficient formation of molten area. The change in size of molten area under different pulse energies by various numerical apertures will be discussed later.
Figure 14 shows the optical micro-photographs of the molten area observed from top and side direction for various numerical apertures. As can be seen from the figure, N.A. of 0.65 can achieve a larger size of molten area without crack generation from cross sectional view. However, the cracks were generated at the bottom tip of molten area, when N.A. of 0.45 was used. In the case of N.A. of 0.85, the size of molten area was small compared with N.A. of 0.45 and 0.65, although a laser beam was tightly focused.
Next, influence of numerical aperture on the size of molten area was investigated by measuring the height and width of molten area from cross sectional view under different pulse energies, as shown in Figure 15. The size of molten area varied with change of numerical apertures, which was mainly because the location of absorption point was changed by numerical apertures as mentioned above. On the one hand, the size of molten area increased with increasing pulse energy with all numerical apertures, which is in accordance with the previous results that absorption rate increased with increasing pulse energy for all numerical apertures. On the other hand, lower numerical aperture could create a larger molten area, and the width by N.A. of 0.65 was the largest among all numerical apertures. This phenomenon corresponded to the previous results that N.A. of 0.65 showed the highest absorption rate compared with N.A. of 0.45 and 0.85. In addition, it also can be seen that N.A. of 0.65 could be used in a wider range of pulse energies than other N.A. values, which suggests that N.A. of 0.65 was more appropriate for the micro-welding process. As for N.A. of 0.85, there was almost no difference between the value of the height and width of the molten area. This phenomenon indicated that the molten area with N.A. of 0.85 did not elongate along laser beam axis evidently, which required accurate control of focusing position in the micro-welding of glass. In conclusion, it can be expected that absorbed energy in glass is higher and thus the reliable joining can be achieved, when the size of molten area increases with increasing the pulse energy with numerical aperture such as N.A. of 0.65.
Figure 16 shows the optical micro-photographs of molten area in the scanning direction of laser beam. In this experiment, laser beam was irradiated 300 µm below the top surface of glass by objective lenses of various numerical apertures with spherical aberration correction at the conditions of pulse repetition rate 1.0 MHz and scanning velocity 100 mm/s. It can be seen that numerical aperture affected the shape of molten area, which varied with numerical aperture especially at the beginning of laser scanning. Lower N.A. such as 0.45 resulted in remarkable spike shape at the bottom of molten area, because absorption point dropped down from the top edge to the bottom one of molten area, and laser energy was not absorbed during this time. In addition, the highest points of absorption point were almost constant, and it could keep similar height of molten area from the beginning as shown in Figure 11. However, remarkable spike shape might cause crack on molten area, which would result in low mechanical strength of welded glass. On the other hand, in the case of higher N.A. such as 0.65 and 0.85, continuous molten areas were formed. In these cases, it can also be seen that the location of absorption point gradually increased from the beginning of laser irradiation, and it resulted in a certain critical value. This phenomenon indicated that the absorption point was simultaneously formed and overlapped in the upper and lower parts of the molten area as shown in Figure 7, thus continuous molten area was formed. Therefore, it can be expected that N.A. of 0.65 has superior focusing characteristics and can form continuous molten area, which leads to achieving a stable welding process and high mechanical strength of welded glass material.

4. Conclusions

In this study, influence of numerical aperture on molten area formation in glass by picosecond pulsed laser was experimentally investigated. The ray tacking analysis could reveal the focusing situation inside glass material, which showed that higher numerical aperture of objective lens caused a loose focusing situation in glass. High-speed observation of laser irradiation area clarified the movement of absorption point inside glass material. The heat accumulation and much higher absorption will contribute to the creation of molten area. N.A. of 0.65 can absorb higher laser energy without cracks forming the continuous shape of molten area, and the width of molten area is the largest among various numerical apertures. Numerical aperture has a great influence on formation of molten area, and high numerical aperture is not the best. N.A. of 0.65 shows superior focusing characteristics, which makes it possible to achieve efficient formation of molten area and stable welding of glass. This phenomenon is important to conduct the micro-welding of glass by picosecond pulsed lasers.

Author Contributions

Methodology, Z.O., Y.O.(Yasuhiro Okamoto) and Y.O.(Yuta Ogino); Investigation, Z.O. and Y.O.(Yuta Ogino); Resources, Y.O.(Yasuhiro Okamoto), A.O. and T.S.; Writing—original draft preparation, Z.O.; Writing—review and editing, Z.O., Y.O.(Yasuhiro Okamoto) and A.O.; Supervision, Y.O.(Yasuhiro Okamoto) and A.O.; Funding acquisition, Y.O.(Yasuhiro Okamoto) and A.O.

Funding

This research was funded by JSPS KAKEN, grand number 24760107 and Amada Foundation AF-2018204.

Acknowledgments

Authors would like to express their sincere thanks to Togo Shinonaga, Assistant Professor, Graduate School of Natural Science and Technology, Okayama University for his contribution to the experiments.

Conflicts of Interest

The authors declare no conflict of interest. The funders had no role in the design of the study; in the collection, analyses, or interpretation of data; in the writing of the manuscript, or in the decision to publish the results.

References

  1. Axinte, E. Glasses as engineering materials: A review. Mater. Des. 2011, 32, 1717–1732. [Google Scholar] [CrossRef]
  2. Miyamoto, I.; Horn, A.; Gottmann, J.; Wortmann, D.; Yoshino, F. Fusion welding of glass using femtosecond laser pulses with high-repetition rates. J. Laser Micro/Nanoeng. 2007, 2, 57–63. [Google Scholar] [CrossRef]
  3. Okamoto, Y.; Miyamoto, I.; Cvecek, K.; Okada, A.; Takahashi, K.; Schmidt, M. Evaluation of molten zone in micro-welding of glass by picosecond pulsed laser. J. Laser Micro/Nanoeng. 2013, 8, 65–69. [Google Scholar] [CrossRef]
  4. Darrin, A.G.; Osiander, R. MEMS Packaging Materials; Springer: Boston, MA, USA, 2011; p. 879. [Google Scholar]
  5. Sugioka, K.; Cheng, Y. Femtosecond laser three-dimensional micro- and nanofabrication. Appl. Phys. Rev. 2014, 1, 041303. [Google Scholar] [CrossRef]
  6. Cvecek, K.; Miyamoto, I.; Strauss, J.; Wolf, M.; Frick, T.; Schmidt, M. Sample preparation method for glass welding by ultrashort laser pulses yields higher seam strength. Appl. Opt. 2011, 50, 1941–1944. [Google Scholar] [CrossRef] [PubMed]
  7. Berthold, A.; Nicola, L.; Sarro, P.M.; Vellekoop, M.J. Glass-to-glass anodic bonding with standard IC technology thin films as intermediate layers. Sens. Actuators A Phys. 2000, 82, 224–228. [Google Scholar] [CrossRef]
  8. Greco, V.; Marchesini, F.; Molesini, G. Optical contact and Van Der Waals interactions: The role of the surface topography in determining the bonding strength of thick glass plates. J. Opt. A Pure Appl. Opt. 2001, 3, 85–88. [Google Scholar] [CrossRef]
  9. Wei, J.; Xie, H.; Nai, M.L.; Wong, C.K.; Lee, L.C. Low temperature wafer anodic bonding. J. Micromech. Microeng. 2003, 13, 217–222. [Google Scholar] [CrossRef]
  10. Tamaki, T.; Watanabe, W.; Nishii, J.; Itoh, K. Welding of transparent materials using femtosecond laser pulses. Jpn. J. Appl. Phys. 2005, 44, L687–L689. [Google Scholar] [CrossRef]
  11. Couairon, A.; Mysyrowicz, A. Femtosecond filamentation in transparent media. Phys. Rep. 2007, 441, 47–189. [Google Scholar] [CrossRef]
  12. Zimmermann, F.; Richter, S.; Doring, S.; Tunnermann, A.; Nolte, S. Ultrastable bonding of glass with femtosecond laser bursts. Appl. Opt. 2013, 52, 1149–1154. [Google Scholar] [CrossRef]
  13. Watanabe, W.; Onda, S.; Tamaki, T.; Itoh, K.; Nishii, J. Space-selective laser joining of dissimilar transparent materials using femtosecond laser pulses. Appl. Phys. Lett. 2006, 89, 021106. [Google Scholar] [CrossRef]
  14. Richter, S.; Döring, S.; Tünnermann, A.; Nolte, S. Bonding of glass with femtosecond laser pulses at high repetition rates. Appl. Phys. A 2011, 103, 257–261. [Google Scholar] [CrossRef]
  15. Schaffer, C.B.; Brodeur, A.; Garcia, J.F.; Mazur, E. Micromachining bulk glass by use of femtosecond laser pulses with nanojoule energy. Opt. Lett. 2011, 26, 93–95. [Google Scholar] [CrossRef]
  16. Ashcom, J.B.; Gattass, R.R.; Schaffer, C.B.; Mazur, E. Numerical aperture dependence of damage and supercontinuum generation from femtosecond laser pulses in bulk fused silica. J. Opt. Soc. Am. B 2006, 23, 2317–2322. [Google Scholar] [CrossRef]
  17. Miura, K.; Qiu, J.; Inouye, H.; Mitsuyu, T.; Hirao, K. Photowritten optical waveguides in various glasses with ultrashort pulse laser. Appl. Phys. Lett. 1997, 71, 3329–3331. [Google Scholar] [CrossRef]
  18. Miyamoto, I.; Cvecek, K.; Okamoto, Y.; Schmidt, M. Internal modification of glass by ultrashort laser pulse and its application to microwelding. Appl. Phys. A 2013, 114, 187–208. [Google Scholar] [CrossRef]
  19. Nordin, I.H.W.; Okamoto, Y.; Okada, A.; Takekuni, T.; Sakagawa, T. Effect of focusing condition on molten area characteristics in micro-welding of borosilicate glass by picosecond laser. Appl. Phys. A 2016, 122, 492. [Google Scholar] [CrossRef]
  20. Kennedy, P.K.; Boppart, S.A.; Hammer, D.X.; Rockwell, B.A.; Noojin, G.D.; Roach, W.P. A first order model for computation of laser-induced breakdown thresholds in ocular and aqueous media: Part II comparison to experiment. IEEE J. Quantum Electron. 1995, 31, 2250–2257. [Google Scholar] [CrossRef]
  21. Miyamoto, I.; Okamoto, Y.; Tanabe, R.; Ito, Y.; Cvecek, K.; Schmidt, M. Mechanism of dynamic plasma motion in internal modification of glass by fs-laser pulses at high pulse repetition rate. Opt. Express 2016, 24, 25718–25731. [Google Scholar] [CrossRef] [PubMed]
  22. Miyamoto, I.; Cvecek, K.; Schmidt, M. Evaluation of nonlinear absorptivity in internal modification of bulk glass by ultrashort laser pulses. Opt. Express 2011, 19, 10714–10727. [Google Scholar] [CrossRef] [PubMed]
  23. Cvecek, K.; Miyamoto, I.; Adam, M.; Schmidt, M. Effects of spherical aberrations on micro welding of glass using ultra short laser pulses. Phys. Procedia 2012, 39, 563–568. [Google Scholar] [CrossRef]
  24. Schott North America, Inc. Available online: https://www.us.schott.com/d/advanced_optics/4ec11ab4-e634-4b8a-88b5-7d86f9f9da1b/schott-glass-wafer-specification-english-us-26062018.pdf (accessed on 3 April 2019).
  25. Jaeggi, B.; Neuenschwander, B.; Schmid, M.; Muralt, M.; Zuercher, J.; Hunziker, U. Influence of the pulse duration in the ps-regime on the ablation efficiency of metals. Phys. Procedia 2011, 12, 164–171. [Google Scholar] [CrossRef]
  26. Liu, X.; Du, D.; Mourou, G. Laser ablation and micromachining with ultrashort laser pulses. IEEE J. Quantum Electron 1997, 33, 1706–1716. [Google Scholar] [CrossRef]
  27. Chichkov, B.N.; Momma, C.; Nolte, S.; Alvensleben, F.; Tünnermann, A. Femtosecond, picosecond and nanosecond laser ablation of solids. Appl. Phys. A 1996, 63, 109–115. [Google Scholar] [CrossRef]
  28. Hecht, E. Optics, 4th ed.; Addison-Wesley: New York, NY, USA, 2001; p. 215. [Google Scholar]
  29. Okamoto, Y.; Miyamoto, I.; Vihinen, J.; Okada, A. Novel micro-welding of silicon and glass by ultrashort pulsed laser. Mater. Sci. Forum 2014, 783–786, 2792–2797. [Google Scholar] [CrossRef]
  30. Arai, T. Fundamental Engineering Science for Laser Materials Processing; Maruzen Publishing: Tokyo, Japan, 2013; p. 140. [Google Scholar]
Figure 1. Size of glass specimen.
Applsci 09 01412 g001
Figure 2. Schematic illustration of laser irradiation setup in bead-on-plate welding experiment.
Applsci 09 01412 g002
Figure 3. Schematic illustration of observation direction by optical microscope.
Applsci 09 01412 g003
Figure 4. Schematic illustration of optical system and specimen setup in high-speed observation.
Applsci 09 01412 g004
Figure 5. Schematic illustration of calculation and measurement method of absorption rate.
Applsci 09 01412 g005
Figure 6. Analysis model of ray tracking.
Applsci 09 01412 g006
Figure 7. Schematic illustration of observation of molten area from side view direction.
Applsci 09 01412 g007
Figure 8. Focusing situation for various numerical apertures in air and glass.
Applsci 09 01412 g008
Figure 9. Measurement method and results of diameter of laser spot focused in glass.
Applsci 09 01412 g009aApplsci 09 01412 g009b
Figure 10. Observation of absorption point movement.
Applsci 09 01412 g010
Figure 11. Influence of numerical aperture on absorption point movement.
Applsci 09 01412 g011
Figure 12. Influence of numerical aperture on absorption rate.
Applsci 09 01412 g012
Figure 13. Influence of numerical aperture on state of molten area.
Applsci 09 01412 g013
Figure 14. Top and cross sectional views of molten area for various numerical apertures.
Applsci 09 01412 g014
Figure 15. Influence of numerical aperture on size of molten area.
Applsci 09 01412 g015
Figure 16. Influence of Numerical Aperture on Shape of Molten Area.
Applsci 09 01412 g016
Table 1. Specifications of borosilicate glass D263.
Density ρ (g/cm3)2.51
Specific heat c [ J/(kg⸱K) ]2.2
Melting temperature θ m (K)1100
Coefficient of thermal expansion α (1/K)7.2 × 10−6
Young’s modulus EY (kN/mm2)72.9
Refractive index NR1.5
Poisson’s ratio µ0.208
Knoop hardness470
Table 2. Specifications of laser oscillator.
Wavelength λ (nm)1064
Pulse repetition rate Rp (MHz)1.0
Pulse duration τp (ps)12.5
Average power stability<1% r.m.s
Spatial modeTEM00
Table 3. Specifications of high-speed video camera.
Pixel312 × 260
Frame rate (fps)64,000
Exposure time (µs)4
Color, GradationsMonochrome, 10bits

