1. Introduction
Subway stations play an important role in urban rail transit networks since passengers gather for boarding or alight at these locations. The service capacity of each station has a direct impact on the capacity of subway line and also on the whole subway network. Therefore, it is critically important to keep the station service capacity above an acceptable level in its full life cycle. The station equipment’s performance deteriorates and its reliability decreases over time. When station equipment fails, station capacity declines and the travel time of passengers increases, especially during rush hour periods. Therefore, how to optimize key equipment maintenance schedule to maintain the station capacity in the full life cycle is significantly important for subway operation companies.
The subway station capacity (SSC) issue has received some attention in the last two decades (see references [
1,
2,
3,
4,
5,
6,
7,
8,
9,
10,
11,
12,
13,
14,
15]). There are a few definitions involving SSC in the available literature. In references [
1,
2], SSC is defined as the maximum passenger flow through various facilities, such as stairs, escalators and gates, at one subway station. However, the influence of passenger flow is not considered in this definition. To solve the problem considered in this paper, dynamic SSC is defined later according to the gathering and scattering process of passengers. There have been a few methods to calculate or evaluate SSC in the available literature. The methods are classified into two main categories according to the modeling approach: the mathematical model-based method and the simulation-based method. The first approach evaluates the subway station system by means of mathematical formulas. The M/G/C/C state dependent queuing network is used in mathematical models of subway stations, especially for the staircase and the pavement (see references [
3,
4,
5,
6]). In reference [
7], an M/G/C/C-based capacity model of staircases and corridors is proposed for passenger evacuation in subway stations through analysis of passenger movements. However, there is little research on the evaluation or that calculates SSC in a holistic fashion. In references [
8,
9], an analytical queuing network model for a subway station including two subsystems is built, of which the first subsystem is built by the M/G/C/C state dependent queuing network and the second is constructed by the probability theory. However, equipment failure is not considered in the station capacity model which affects SSC. Simulation models (see references [
10,
11,
12,
13,
14,
15]) are suitable for animating stations in different perspectives, but only a few researchers have considered the capacity calculation problem. For example, a simulation model based on hybrid Petri nets is presented in [
11]. A modeling approach based on discrete-event simulation and response surface methodology (RSM) deals with the optimization of average passenger travel time inherent in the metro planning process in reference [
12]. In the references [
13,
14], the station simulation model based on AnyLogic is established to simulate the gathering and scattering process and evaluate the usage of device. In reference [
15], an AnyLogic model is established to analyze the current status of the subway station. These studies focused on how to model the station, evaluate the usage of device or identify bottlenecks of a station. However, a method to calculate the station capacity integrating simulation models has not been reported yet. The passenger carrying capacity of a rail transit station is calculated by simulation model based on the system dynamics theory [
2]. Similarly, the software AnyLogic based on social force model can be used to calculate SSC.
The reliability analysis of the key equipment such as the gate and the escalator play a critical role in our study. However, little research on reliability analysis of key equipment at subway stations has been conducted, to the best of our knowledge. The only research achievement has been to classify the common equipment faults and find out the fault causes. Gates and escalators belong to electromechanical equipment, and the methods to analyze their reliability are divided into the statistical model and the mechanism model. In this paper, the statistical model is used to analyze the reliability of equipment. Since there is no literature focusing on the reliability of station equipment, the idea of the reliability research on high-speed train bogie system is employed to analyze the reliability of key station equipment. In references [
16,
17,
18], the fault data of the bogie system is collected and the reliability of the bogie is analyzed based on the statistical method. In reference [
19], each component of the bogie system is estimated based on maximum likelihood estimation and the optimal distribution is determined by the A-D test method. There are many other works on the reliability analysis of mechanical equipment. Not all of the references used are listed here.
With regard to the maintenance schedule optimization, the methods of the preventive maintenance schedule model are systematically introduced and the reliability constraints are added to the preventive maintenance schedule model in reference [
20]. In reference [
21], life distribution of key train operation equipment is determined by the statistical method, and the optimization model of maintenance schedule is established. In reference [
22], the operation and maintenance status transition diagram of the whole service life of the equipment is given, and the relationship model between the maintenance schedule and the average availability of the equipment during the whole service life is established. Based on reliability analysis of the key components of rail transit vehicles, the optimization model of the vehicle maintenance schedule is established with the minimum maintenance cost as the goal in reference [
23]. This research provided useful maintenance schedule optimization models, but these models take the entire equipment as the research object which lacks pertinence, especially for electromechanical equipment since the failure rate of each component varies greatly. Therefore, it is necessary to build a maintenance schedule optimization model for the components of electromechanical equipment.
This paper aims at keeping or even enhancing SSC in the full life cycle. To investigate this issue, the dynamic SSC (DSSC) is defined and the method to calculate the expected DSSC (also referred to as expected station capacity) with equipment failure is proposed in the first stage. The average travel time of passengers is considered as the evaluation indicator of DSSC, which is calculated by passenger simulation model based on AnyLogic (see references [
13,
14,
15]). The DSSC model with key equipment failure is established based on binomial distribution and mathematical expectation. In the second stage, the reliability of key equipment at a subway station is investigated, and the lower bound of equipment reliability is determined by sensitivity analysis based on the equipment reliability-expected station capacity curve. In addition, the maximum likelihood estimation method (MLE) is adopted to estimate fault distribution parameters of key equipment, and the Anderson-Darling statistic is used to select the optimal distribution. Finally, an optimization method for the key equipment maintenance schedule is presented in the third stage, which aims at ensuring the reliable operation of equipment with the lowest maintenance cost so that the subway station capacity can be retained in the full life cycle.
The main contributions of the paper are as follows:
- (1)
The interaction between equipment failures and DSSC is analyzed, and the uncertain equipment failure model is incorporated into the DSSC model.
- (2)
Based on the sensitive analysis between equipment reliability and DSSC, a maintenance schedule optimization model of equipment which minimizes the maintenance cost is proposed.
This paper is organized as follows. The definition of SSC and the problem considered are introduced in
Section 2. The DSSC model considering equipment failure is proposed in
Section 3. The method to determine the optimal fault distribution of key equipment is presented in
Section 4. The maintenance schedule optimization of key equipment is presented in
Section 5. In
Section 6, how the proposed approach is applied to maintain station capacity is shown by a case study in detail. Finally, some conclusions are given in
Section 7.
5. Maintenance Schedule Optimization
The key equipment maintenance schedule optimization of subway station aims at keeping the reliable operation of equipment in a certain range with the lowest maintenance cost. For the key equipment, the failure rates of different components of the equipment are different. In order to repair the equipment more pertinently, improve the maintenance efficiency and reduce the maintenance cost, the equipment can be divided into n parts, and different maintenance schedules are adopted respectively. The maintenance schedule of the ith part is , the corresponding reliability function is , and the corresponding maintenance cost is , . Therefore, the total maintenance cost of equipment is .
Therefore, with the constraint of equipment reliability, the average maintenance cost per unit maintenance schedule is taken as the optimization objective, and the maintenance schedule optimization model is established. In consideration of the impact of equipment failure on the normal operation of the station, the maintenance cost not only refers to the cost of equipment maintenance and labor, but also includes the loss of equipment downtime [
21]. In addition, the maintenance cost data can be obtained from the maintenance account records. The maintenance schedule optimization model can be formulated as follows:
where
is the expected cost per unit time of normal operation of
ith part of equipment within a single maintenance schedule,
is the average total cost of
ith part of equipment within a single periodic maintenance including preventive replacement cost for non-repairable components and repair maintenance cost for repairable components,
is the average total cost of
ith part of equipment failure including replacement cost, repair maintenance cost and the loss of equipment downtime,
is the reliability function of
ith part of the equipment,
is the fault probability density function of
ith part of the equipment,
is maintenance schedule of
ith part which is the decision variable,
is the expected time of normal operation of equipment with a single maintenance schedule,
is lower bound of equipment reliability which is determined by sensitivity analysis based on the equipment reliability-expected station capacity curve.
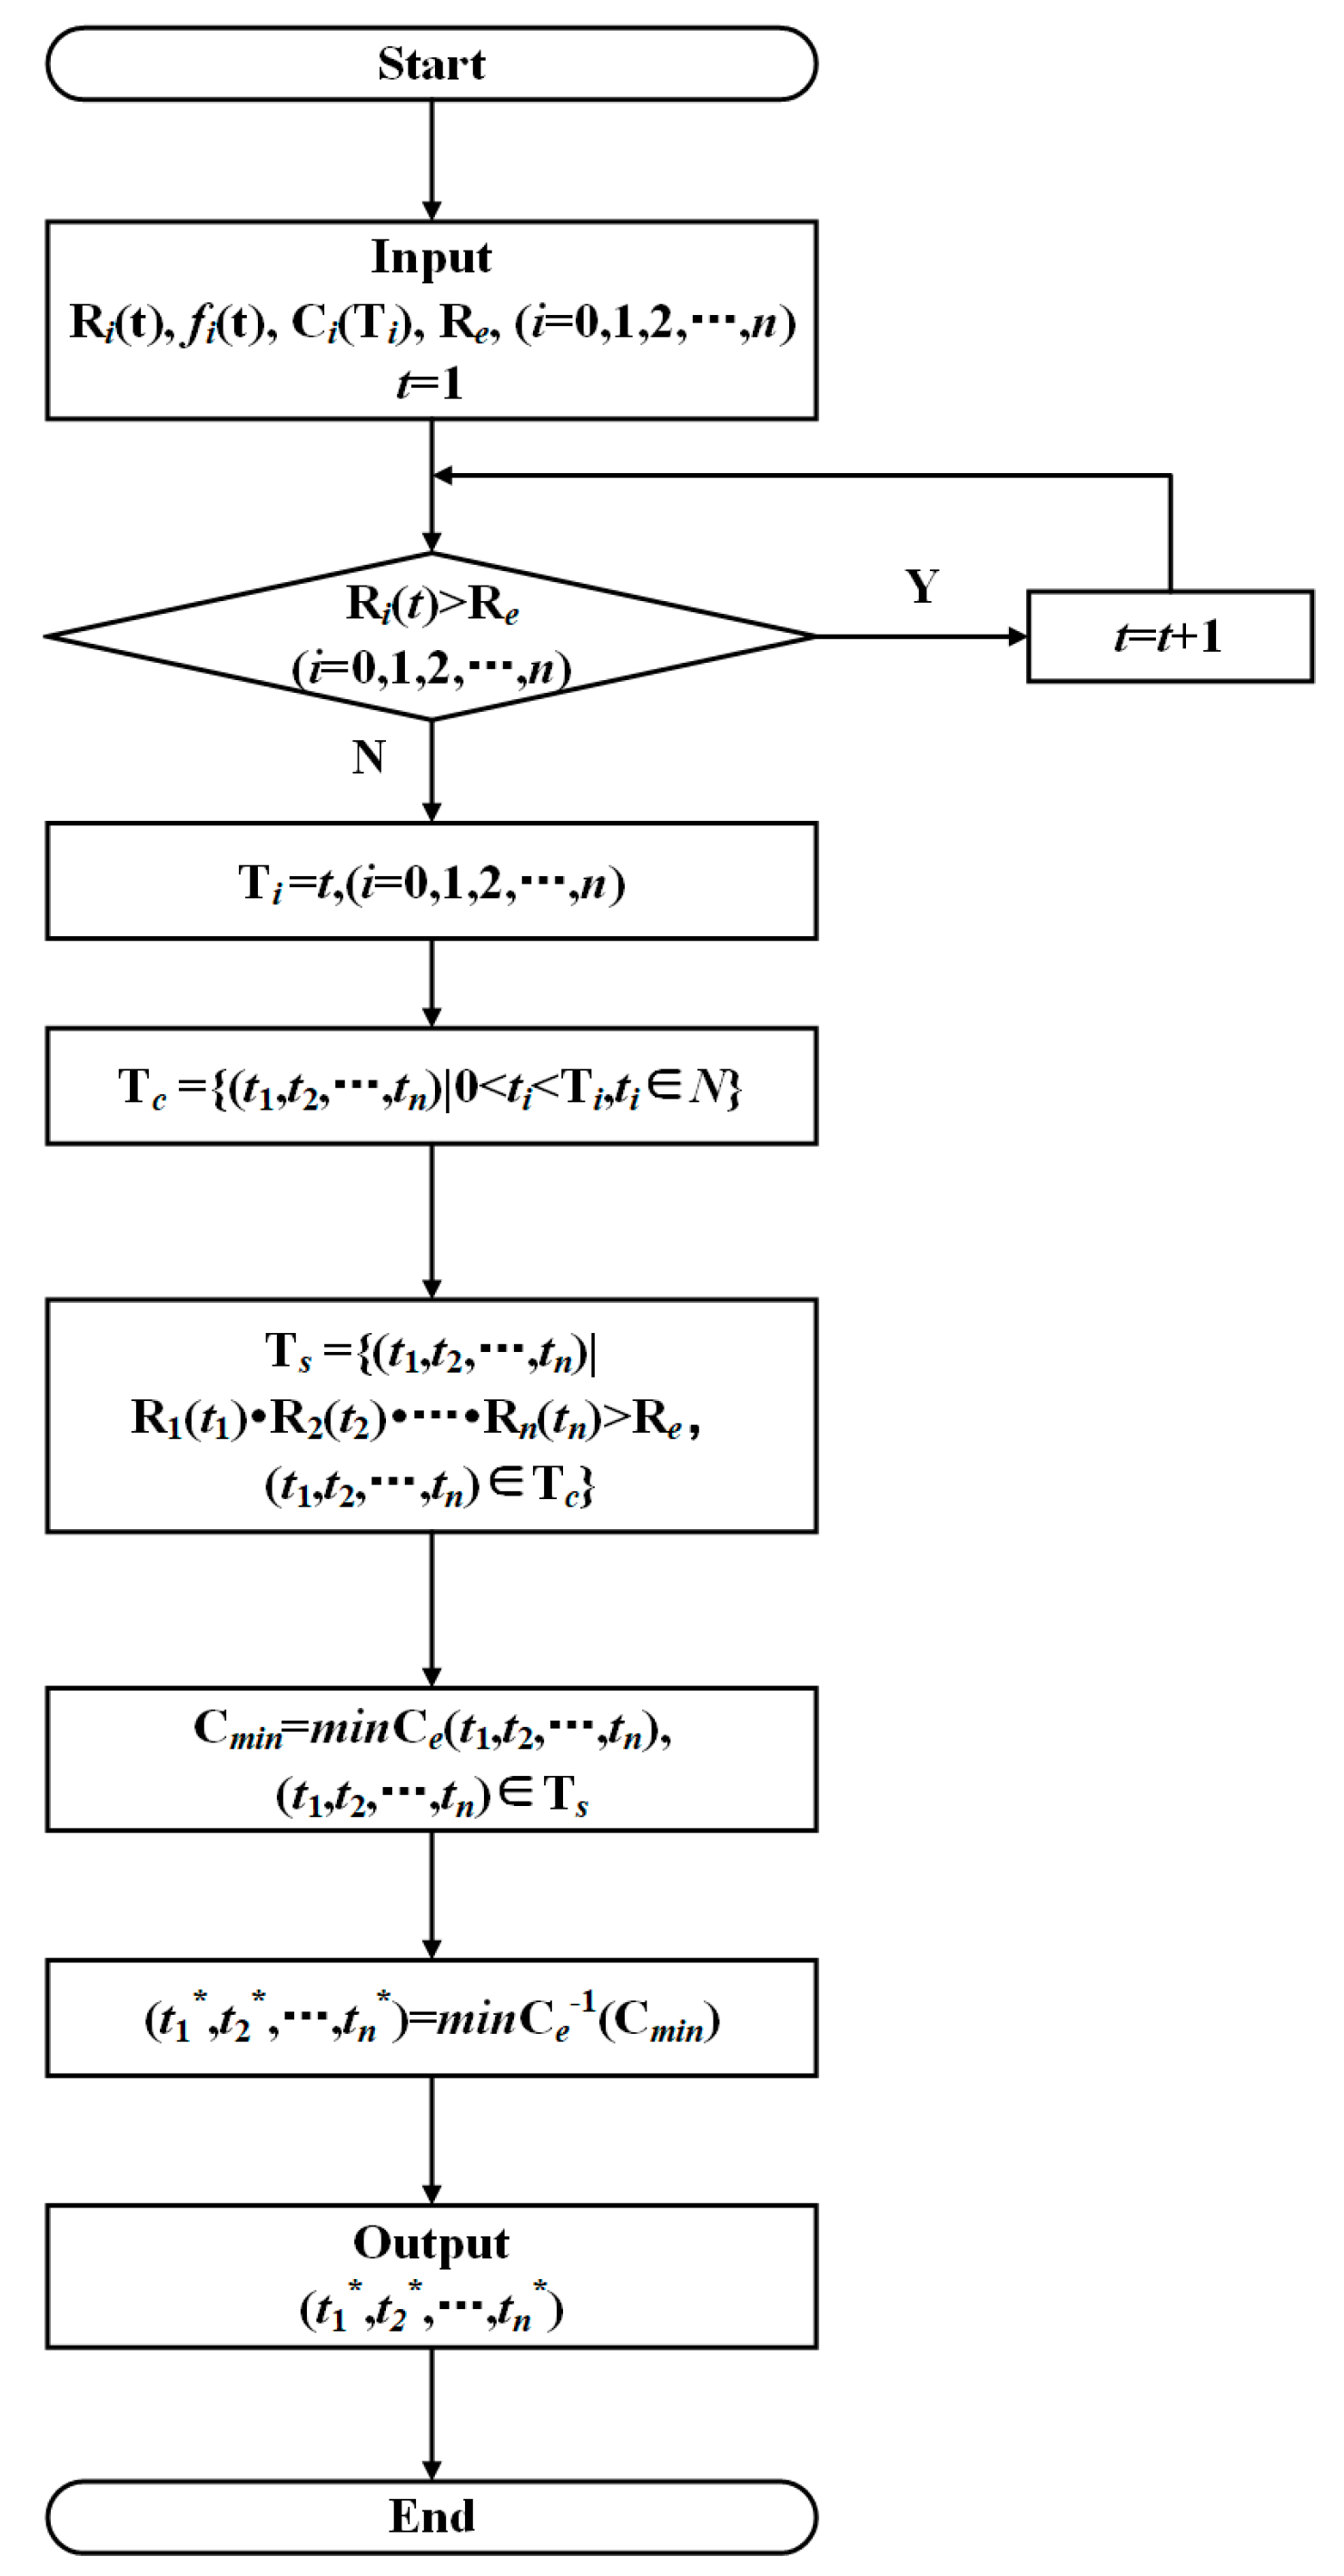
The enumeration method is adopted to solve the model, and the algorithm flow chart is shown in
Figure 4. Firstly, the reliability function
and the fault probability density function
of each part of the equipment and the lower bound of equipment reliability
are given before the optimization. Secondly, the minimum value of maintenance schedule
for each part of the equipment which cannot meet the equipment reliability requirement are determined by loop statement, since the reliability of the equipment components decreases as service time goes by. Then the preliminary maintenance schedule collections
for all of the equipment are obtained by combining the available maintenance schedules of the equipment components. Thirdly, the final maintenance schedule collections
which meet the equipment reliability requirement for the entire equipment is selected from
. Finally, for each maintenance schedule collection of
Ts, the total cost of the equipment
within a single maintenance schedule is calculated. Afterwards, the minimum value is selected, and the optimal maintenance schedule for each part of the equipment is obtained.
In summary, the method consists of the following steps:
- (1)
Passenger flow simulation model is built to calculate the ATT of the station with certain passenger inflow. For practical application, this step can be omitted.
- (2)
By using the sensitive analysis between equipment reliability and the expected DSSC, the boundary of equipment reliability is determined.
- (3)
Based on the maintenance records, gates and escalators are divided into several typical parts. The optimal fault distribution for each parts of equipment is selected from the common fault distributions with the A-D test.
- (4)
Finally, the related parameters of maintenance schedule optimization model are determined such as the lower bound of equipment reliability and the optimal fault distribution for each parts of equipment. The optimal maintenance schedule for key equipment is obtained by solving the model.
6. Simulation Study
In the former sections, the theory of the key equipment maintenance schedule optimization is presented. In this section, the proposed method will be validated by a detailed case study of a station at the Beijing subway with the help of simulation software AnyLogic.
6.1. Passenger Flow Simulation Model
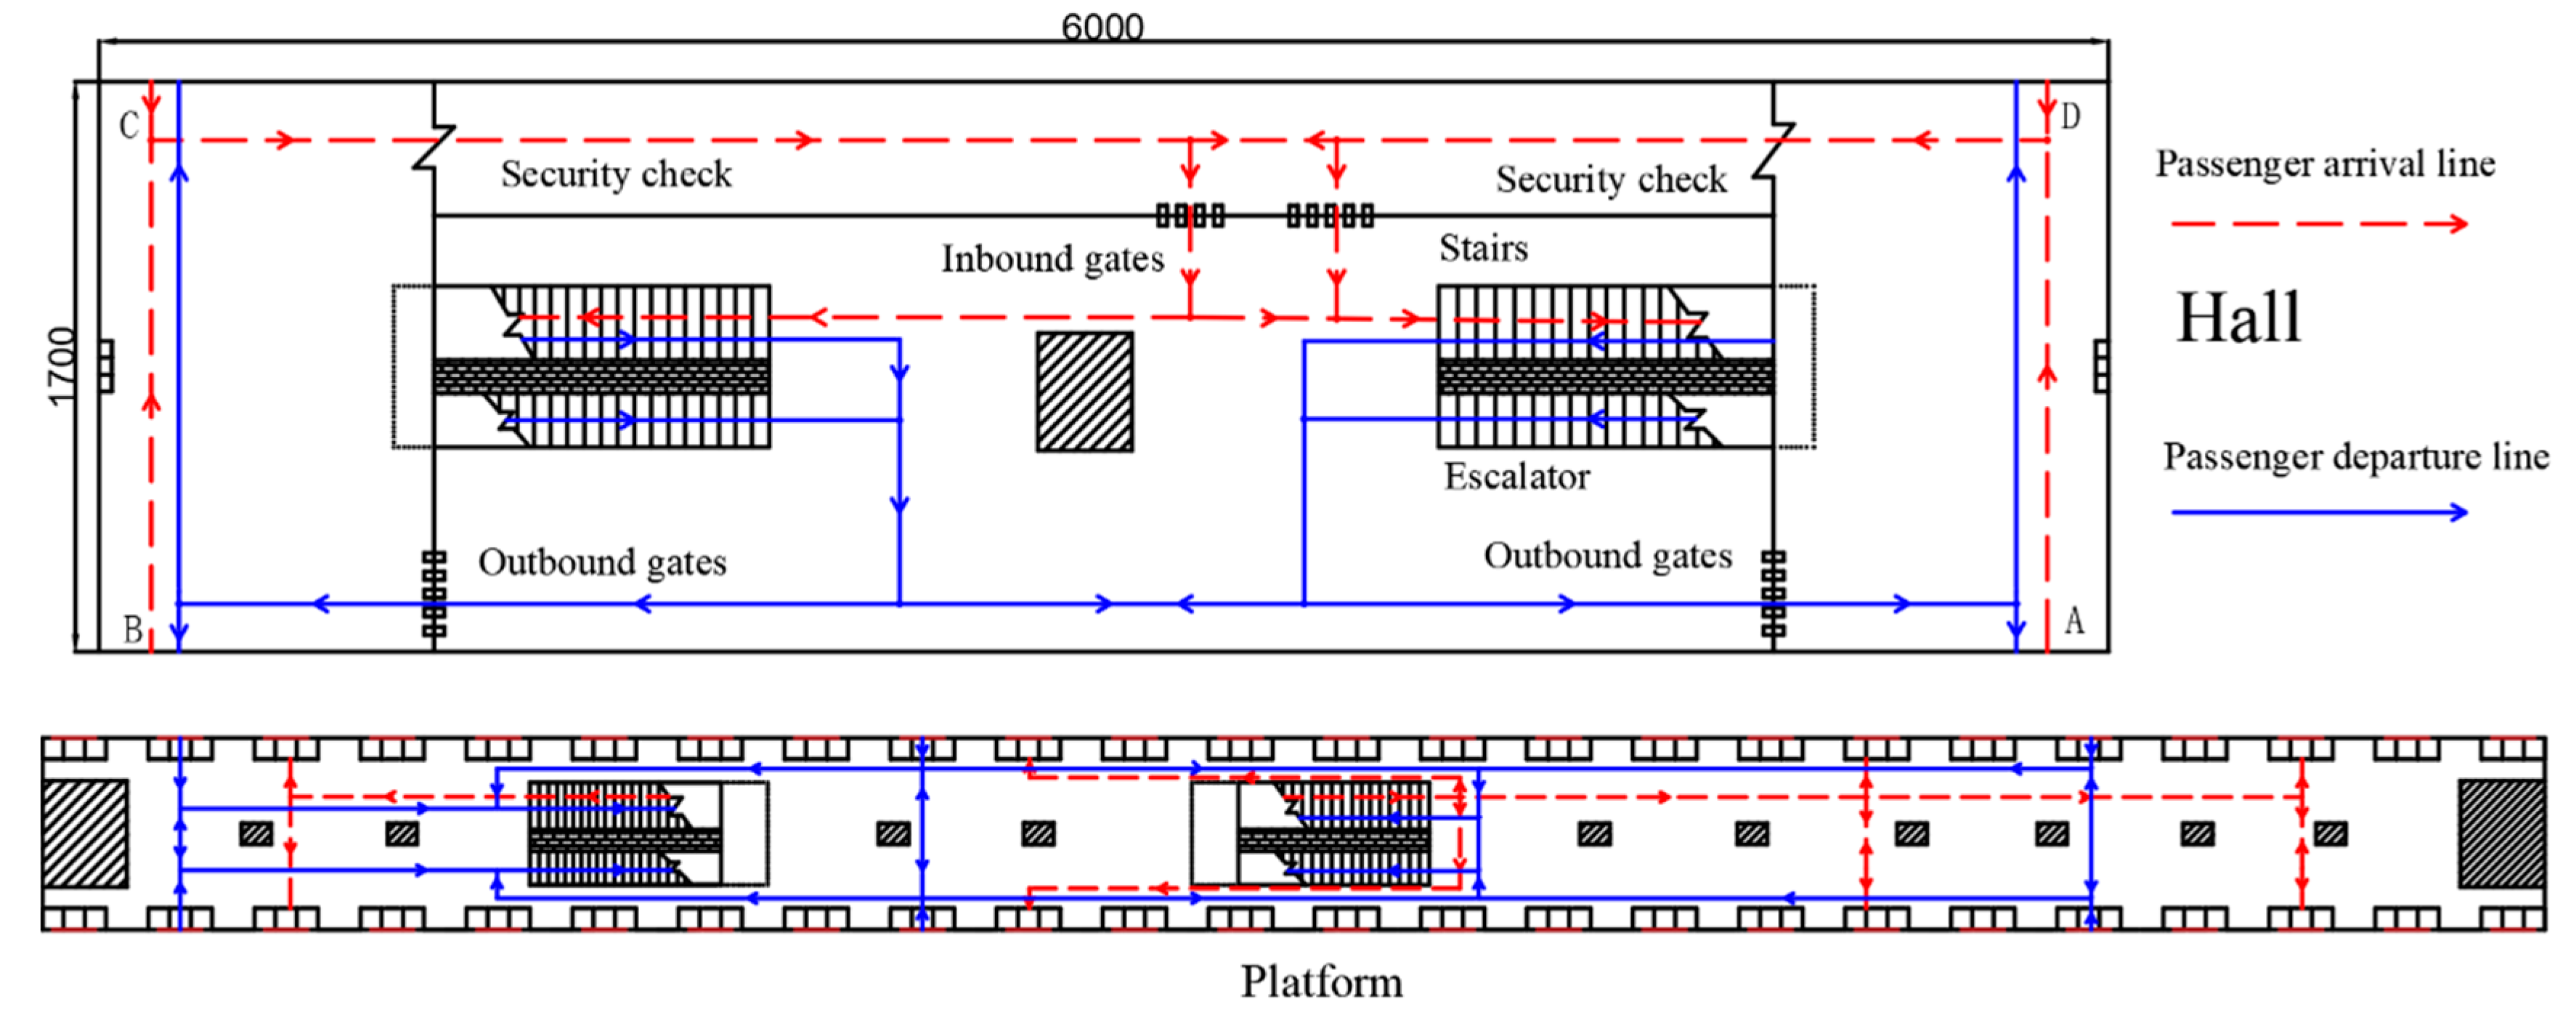
The Xinjiekou station in Beijing subway line 4 is taken as a case study in this paper. Based on a field investigation of the station, the layout map and passenger flow data of the station are obtained. The length of the station hall is 60 m, and the width is 17 m. The length of platform is 118 m, and the width is 9 m. The streamline layout of the station is shown in
Figure 5.
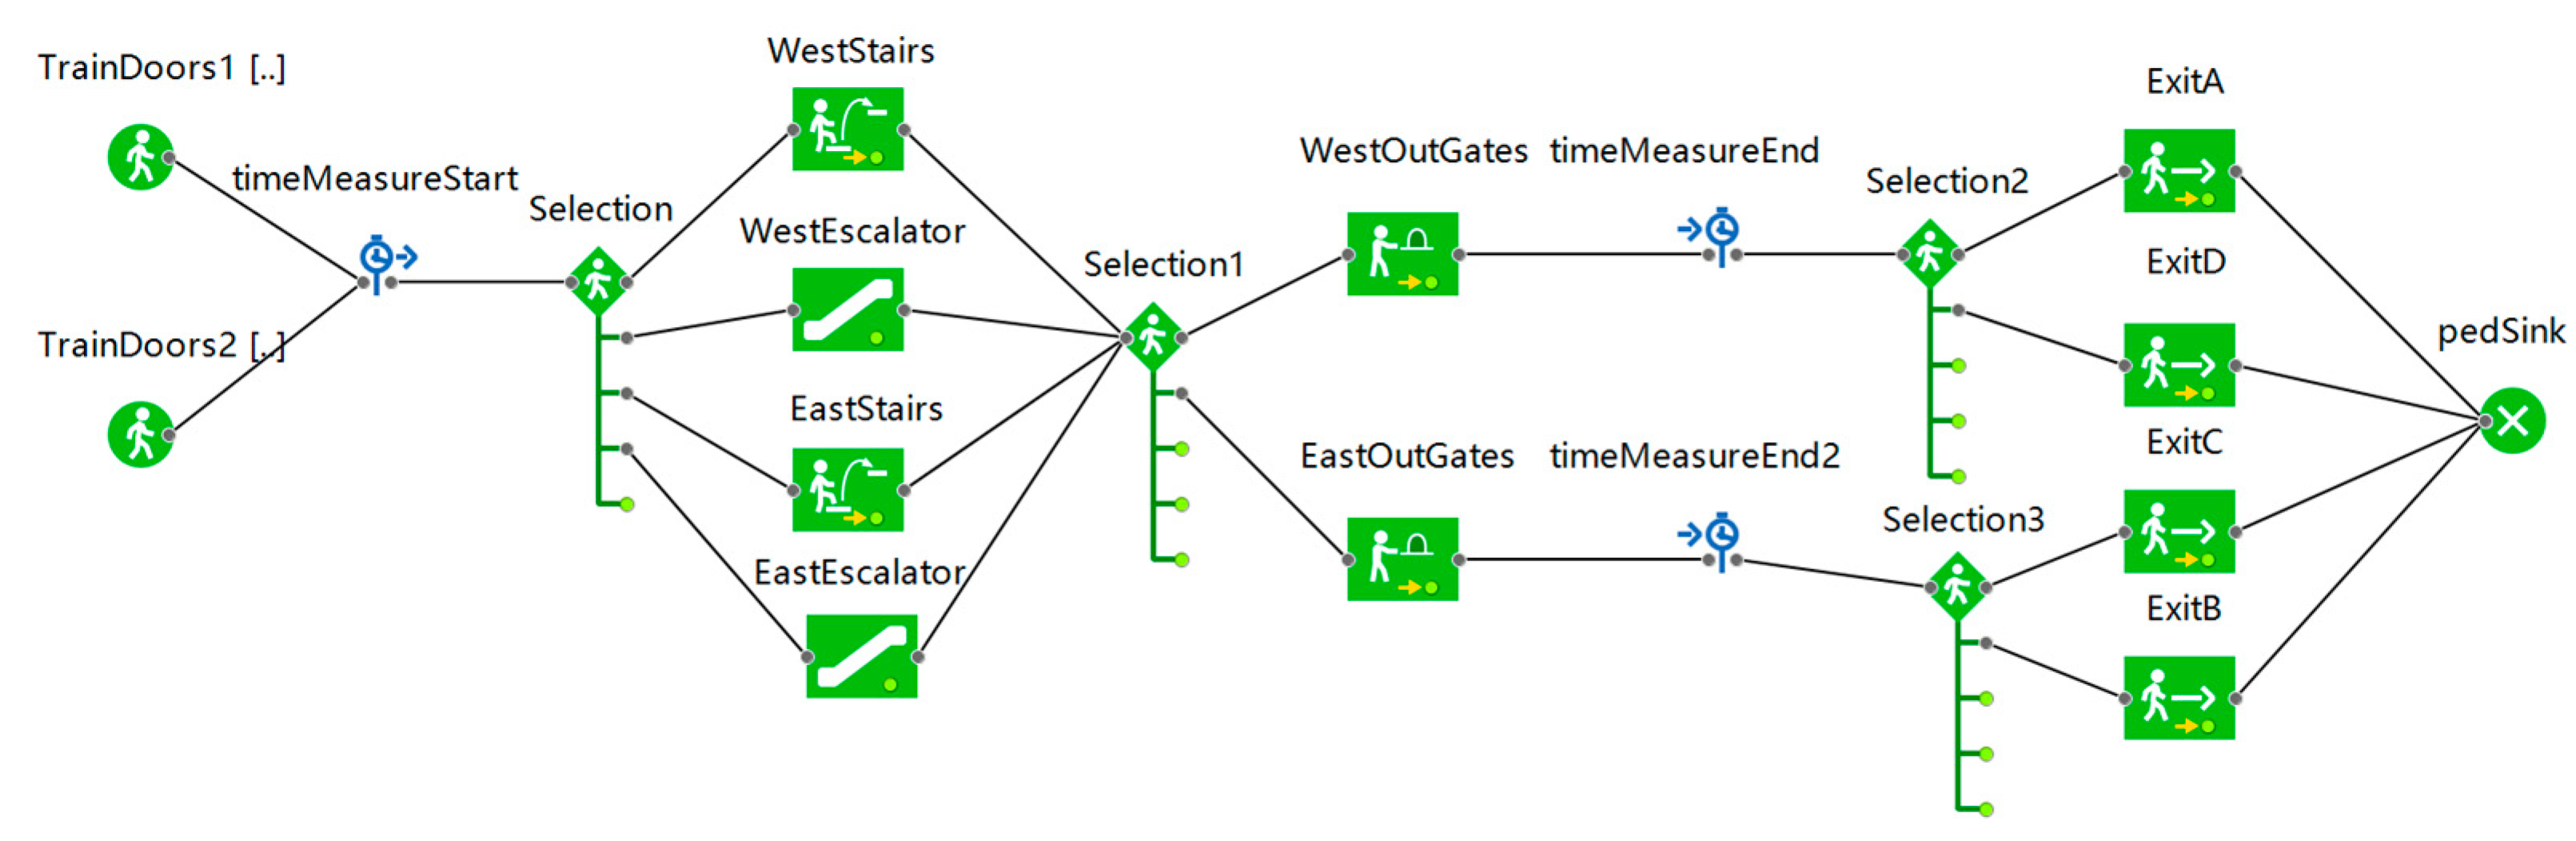
The AnyLogic model consists of a station environment model and a pedestrian behavior model. In the light of the layout of station, the station environment model is established in the first place. Firstly, the buildings of the station are built including the hall and the platform, such as walls, columns and obstacles. After that, various service facilities are built in the model, such as gates and escalators, and the corresponding parameters of ‘line service’ and ‘escalator group’ are set at the same time. Finally, the pedestrian sources and destinations are set with the ‘target line’. The station environment model is completed.
In the light of the layout of station, the station environment model is established, and the related environment model parameters are shown in
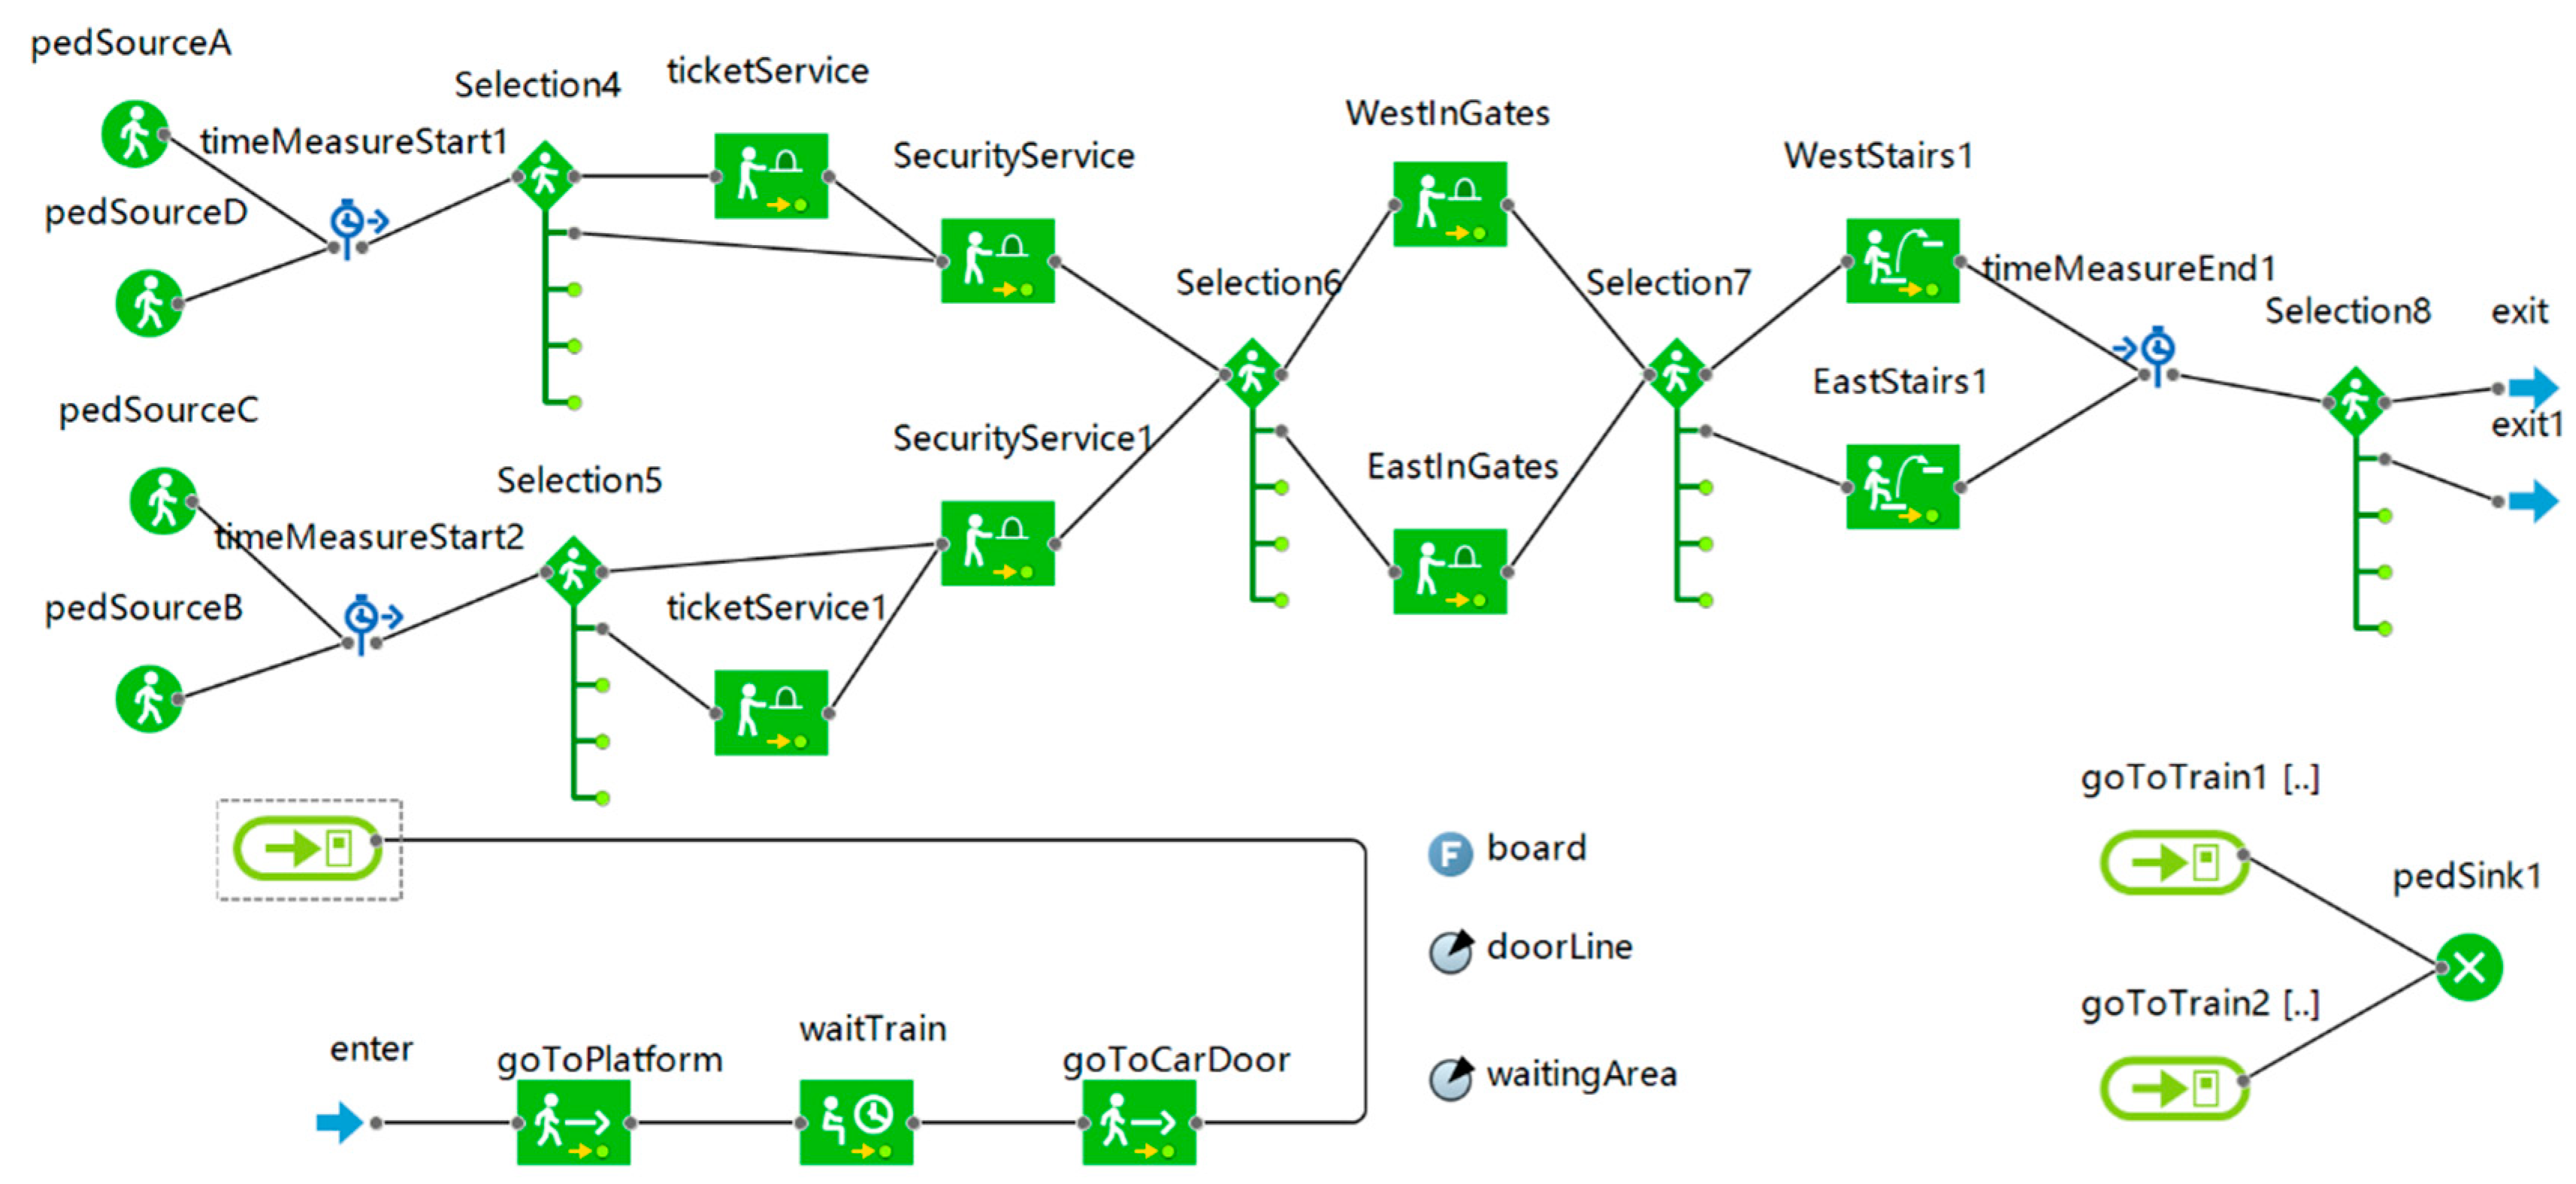
Table 3. According to the streamline layout, the logical modules in the pedestrian library are used to construct the whole process from pedestrian generation, and the receiving services are established from various service facilities to the disappearance of pedestrians. The pedestrian behavior model is established and shown in
Figure 6 and
Figure 7, respectively. It is necessary to calibrate the service parameters of the ‘Ped Service’ modules, and the related service parameters are shown in
Table 4.
In the simulation model, the pedestrian speed is 1 m/s. The subway train serving this station consists of six vehicles, and each vehicle is fitted out with four train doors. The headway time and dwell time running by the current timetable are 150 s and 30 s. Assume that there are no remaining passengers on the platform at the end of each alighting-boarding cycle. Total numbers of alighting passengers in each cycle during non-peak time and peak time are deterministic and equal to 160 and 510, respectively (In the Beijing subway, the peak time includes 7:00–9:00 a.m. and 6:00–8:00 p.m. and the rest of the operation time is non-peak time.). Passenger routing probabilities are estimated as the ratio of the passengers who arrived at an entrance and followed the specific route, by the total number of passengers who entered the system from this entrance. Other passenger flow data is described in
Table 5.
Due to the randomness of AnyLogic simulation results, multiple simulations experiments are carried out and the average value of the results is adopted. During non-peak time, the real time of the departure process and the arrival process is 134 s and 92 s, respectively. And the simulation time of the departure process and the arrival process is 130 s and 89 s, respectively. During peak time, the real time of the departure process and the arrival process is 187 s and 155 s, respectively. The simulation time of the departure process and the arrival process is 178 s and 148 s, respectively. The errors between simulation results and actual data are small. Therefore, the accuracy of the simulation model is verified.
6.2. Sensitivity Analysis
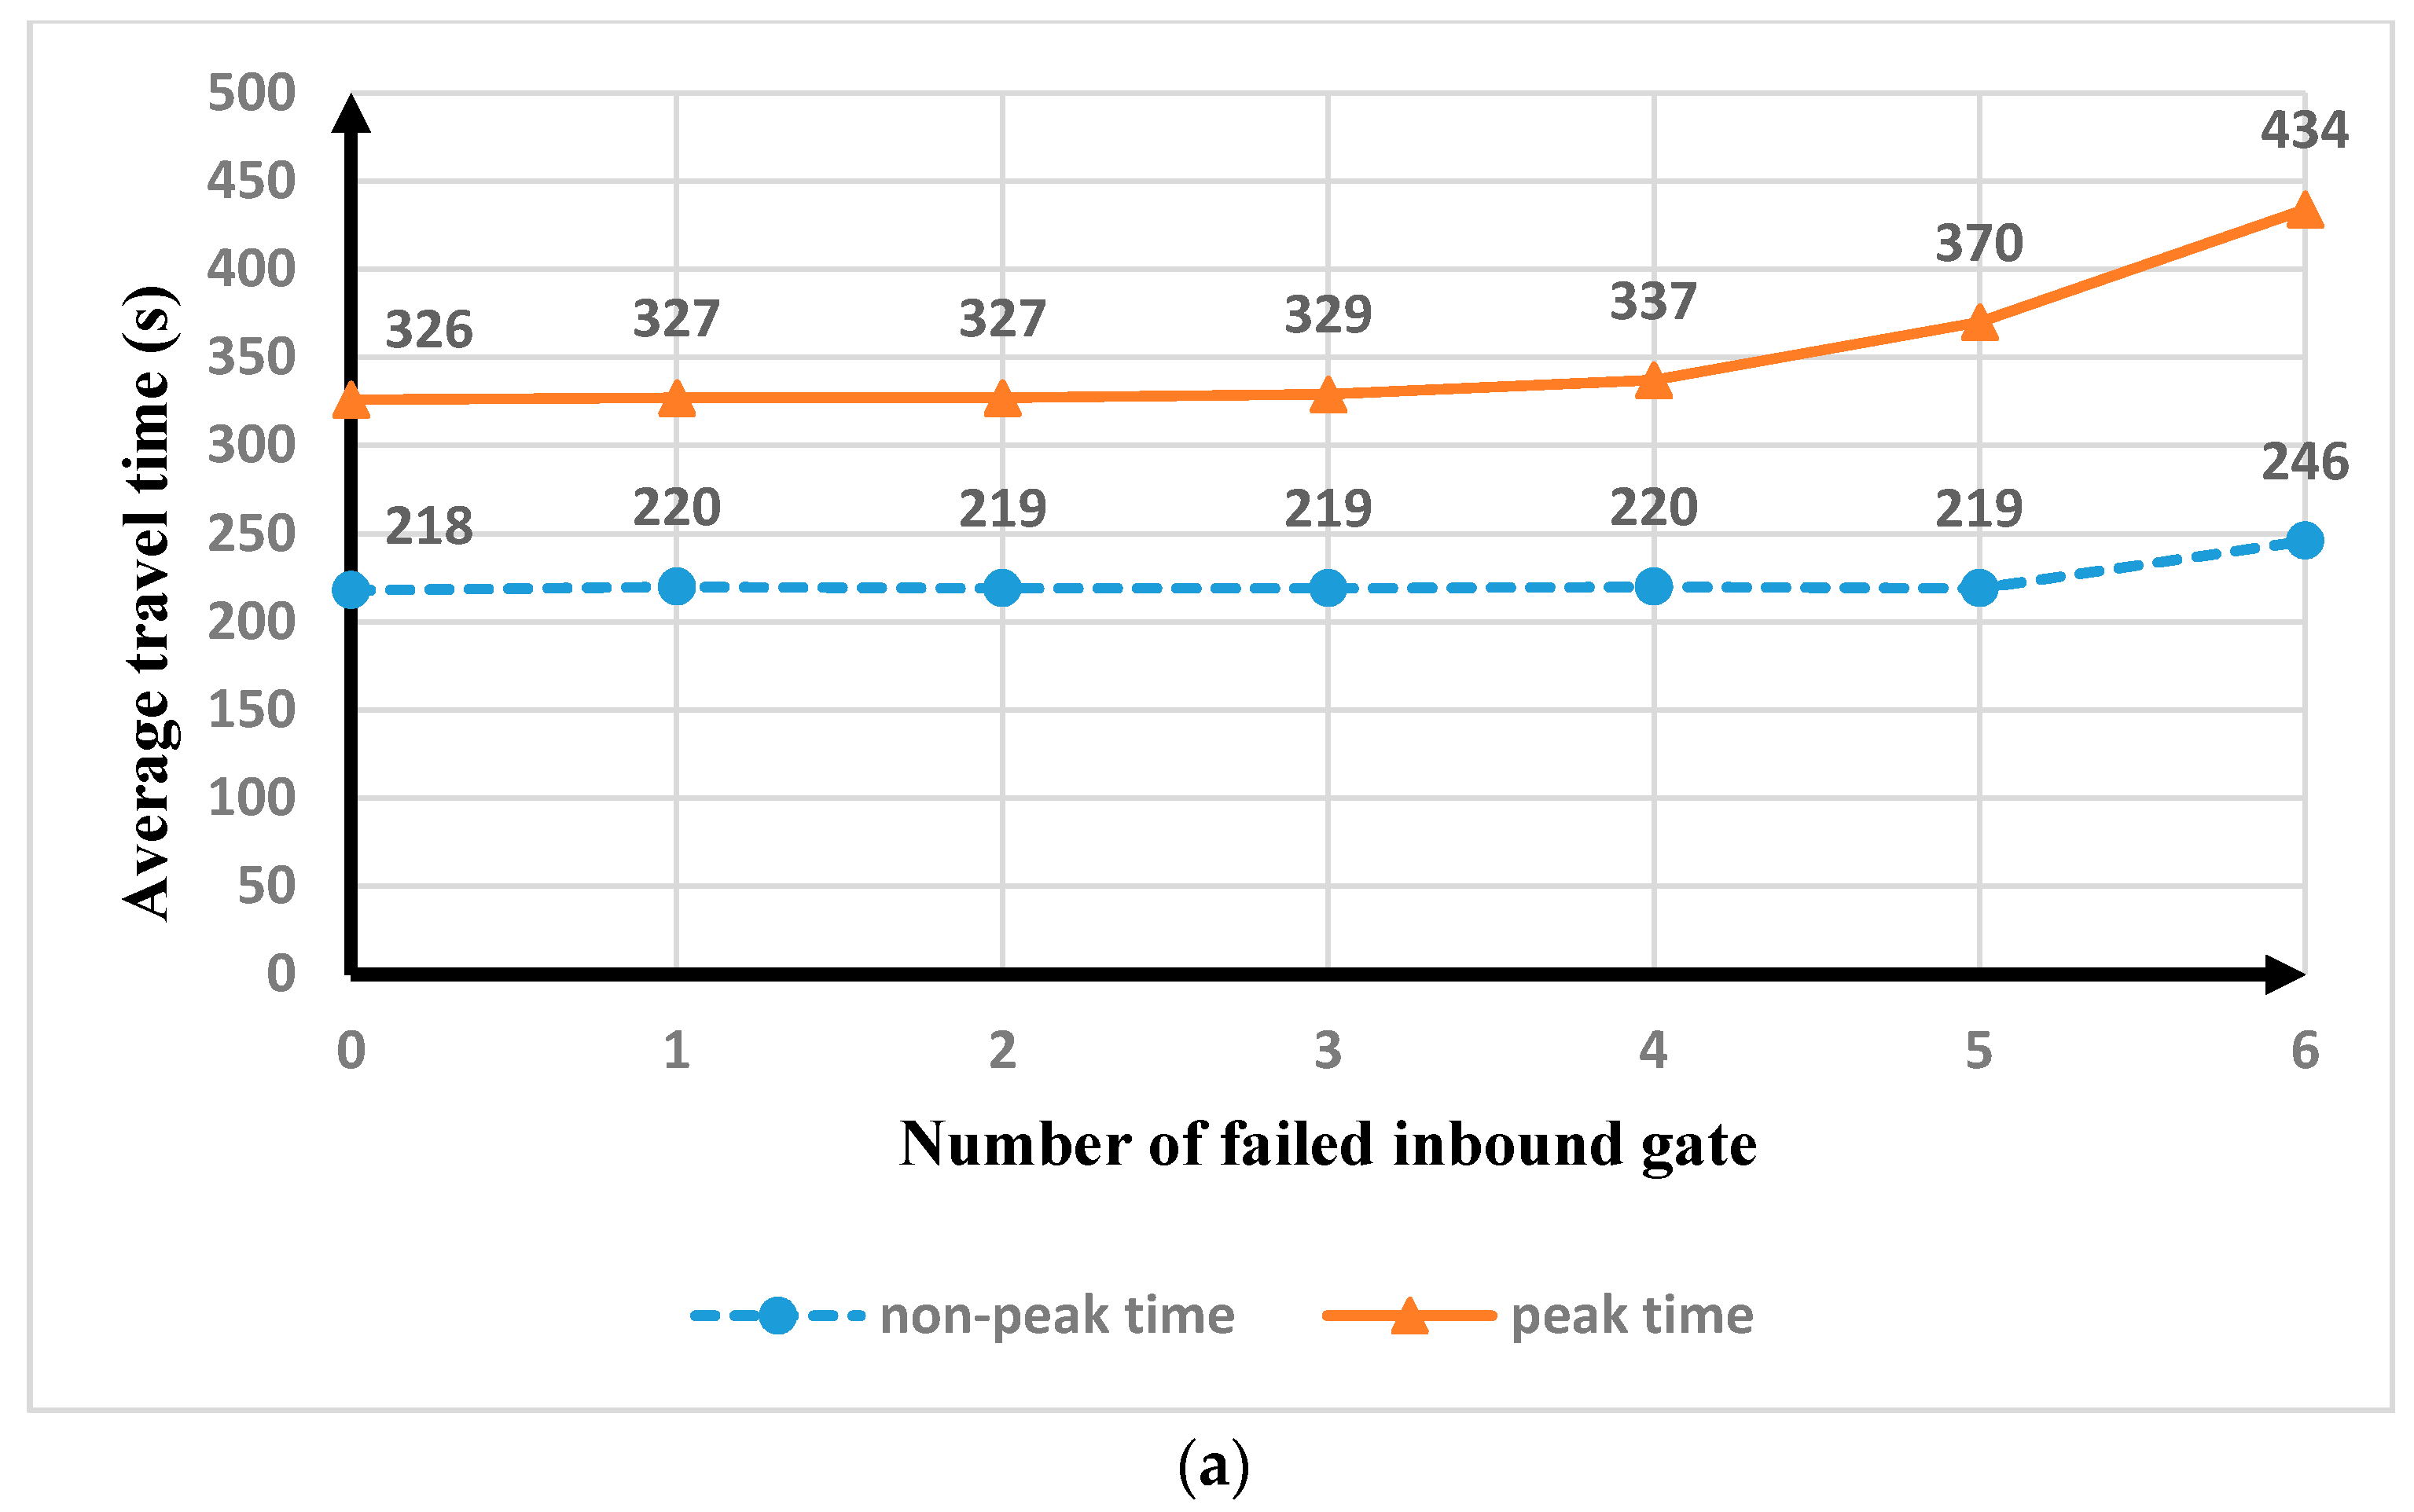
When other equipment is working properly, the impact of the number of failed gates on
is shown in
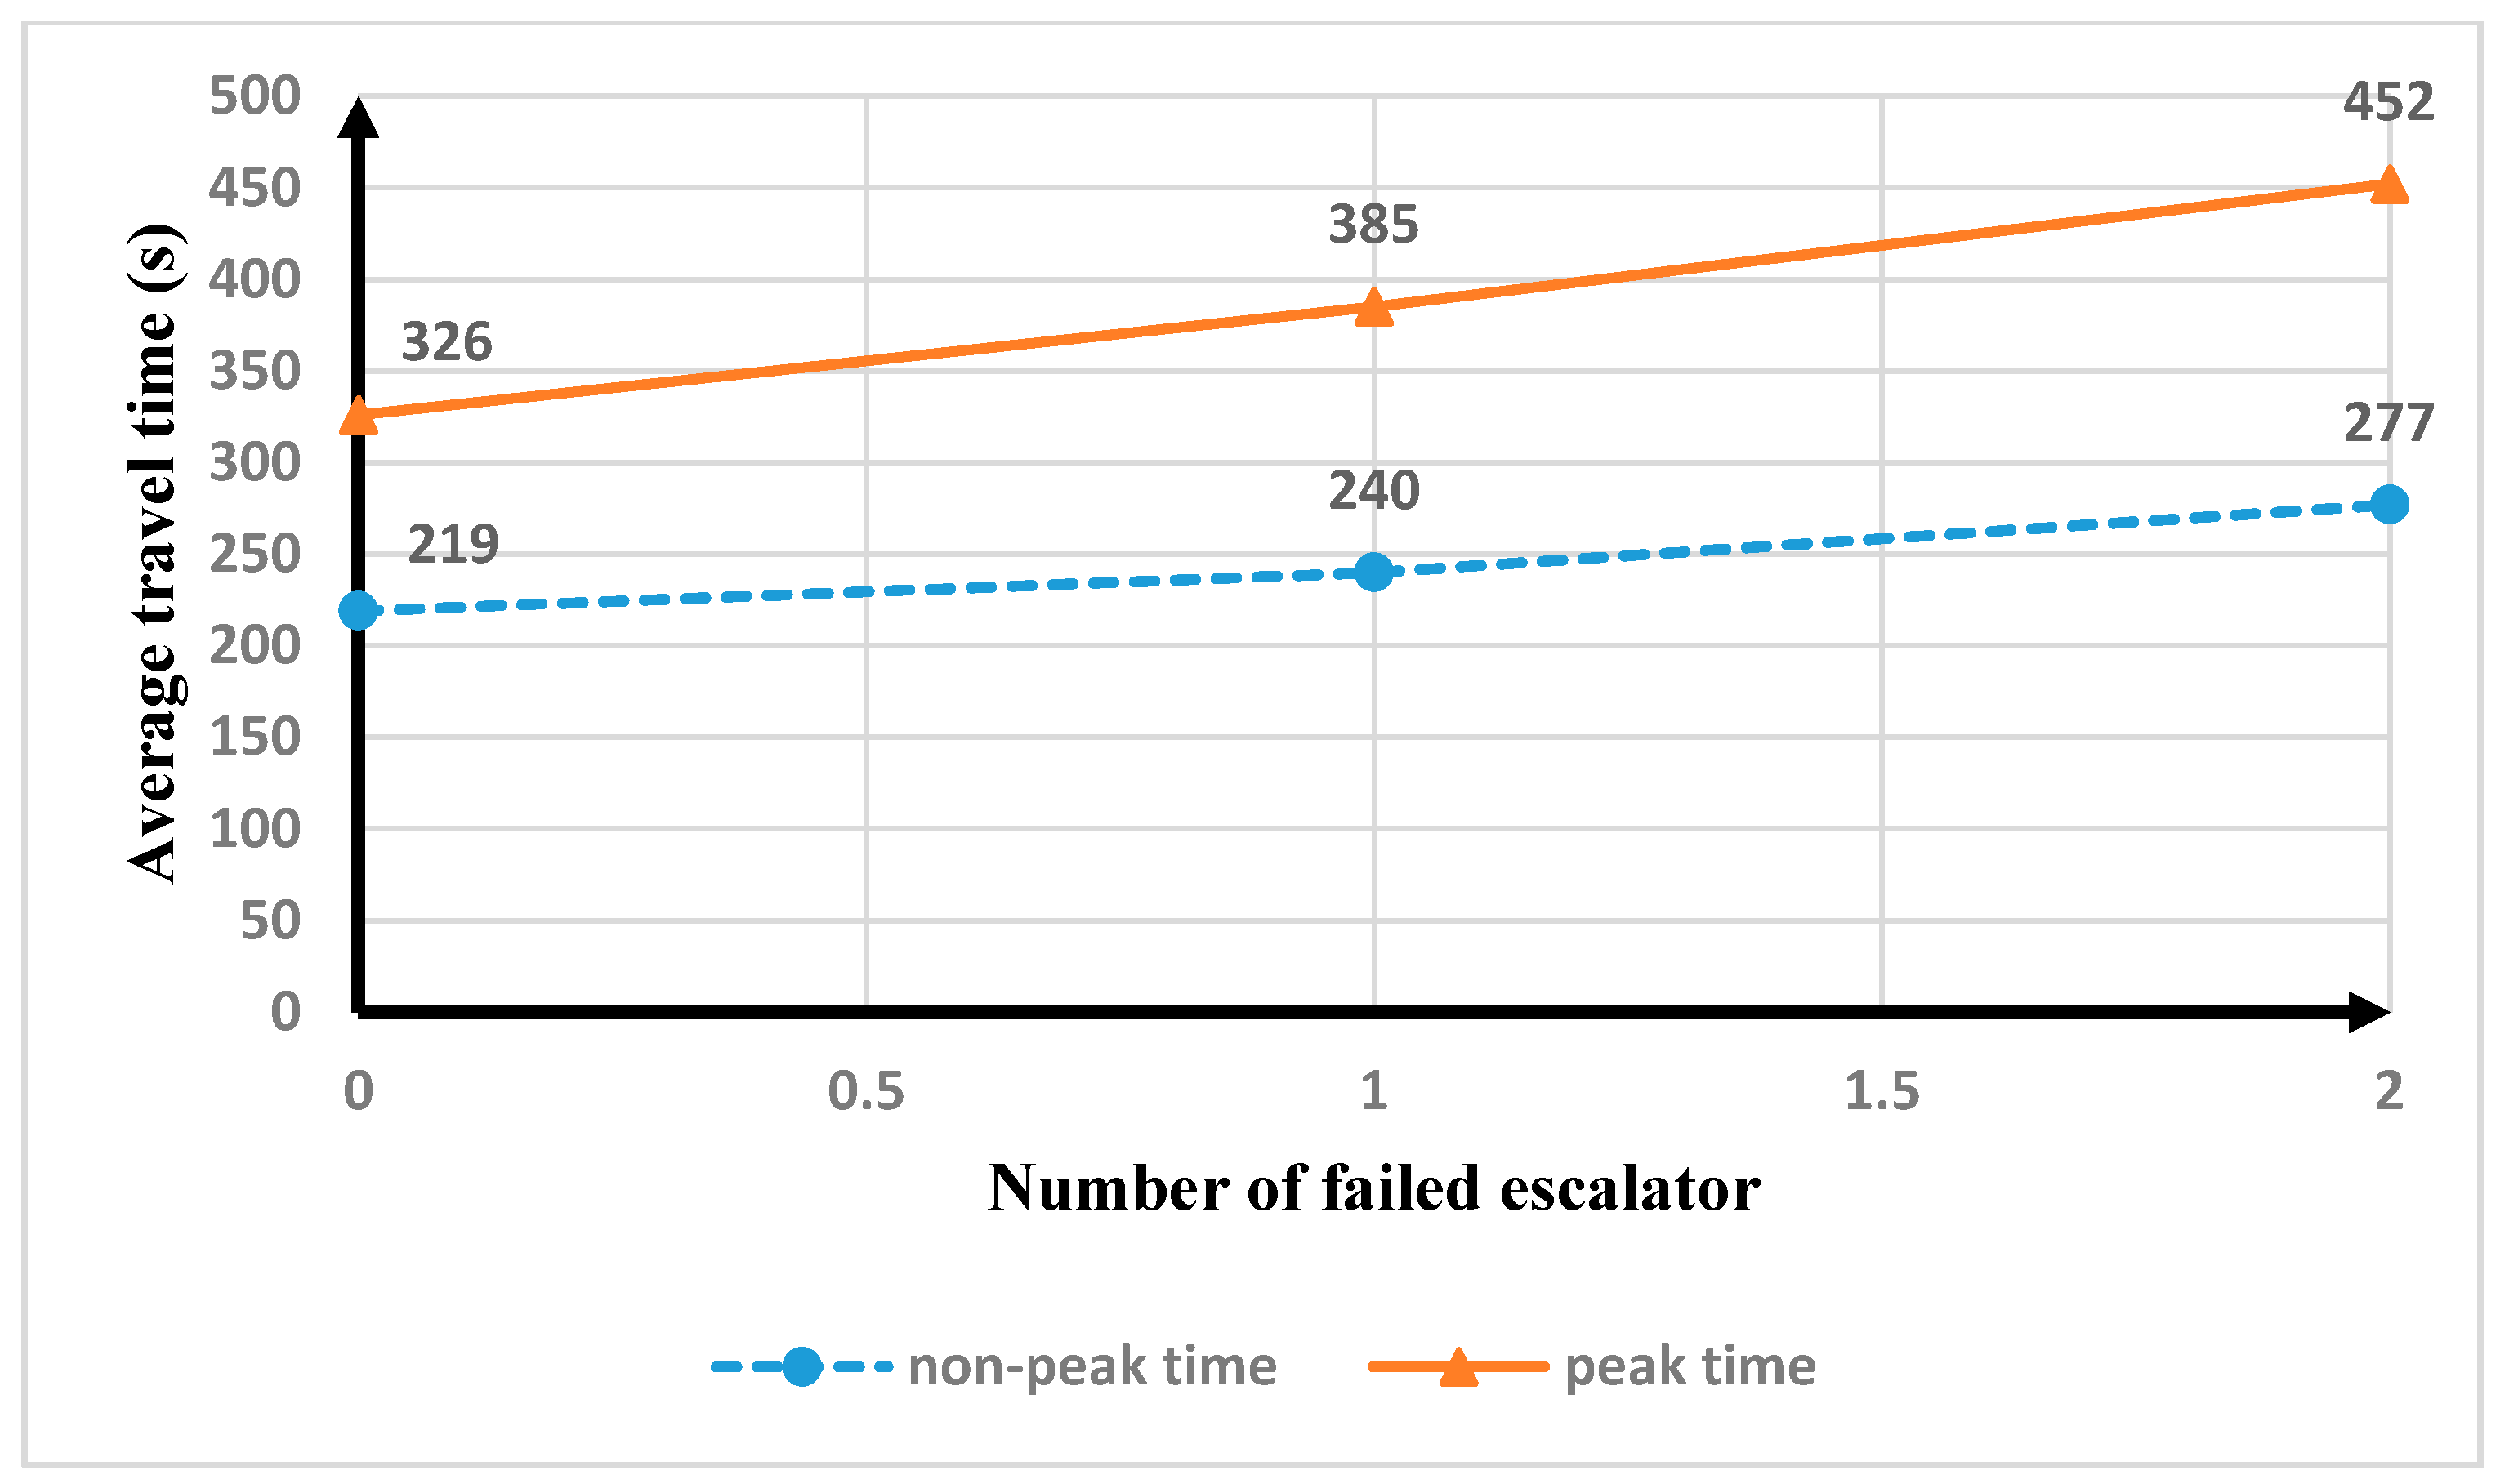
Figure 8. The two escalators at the station are both upward escalators, and the impact of the number of failed escalators on
is shown in
Figure 9.
As is shown in
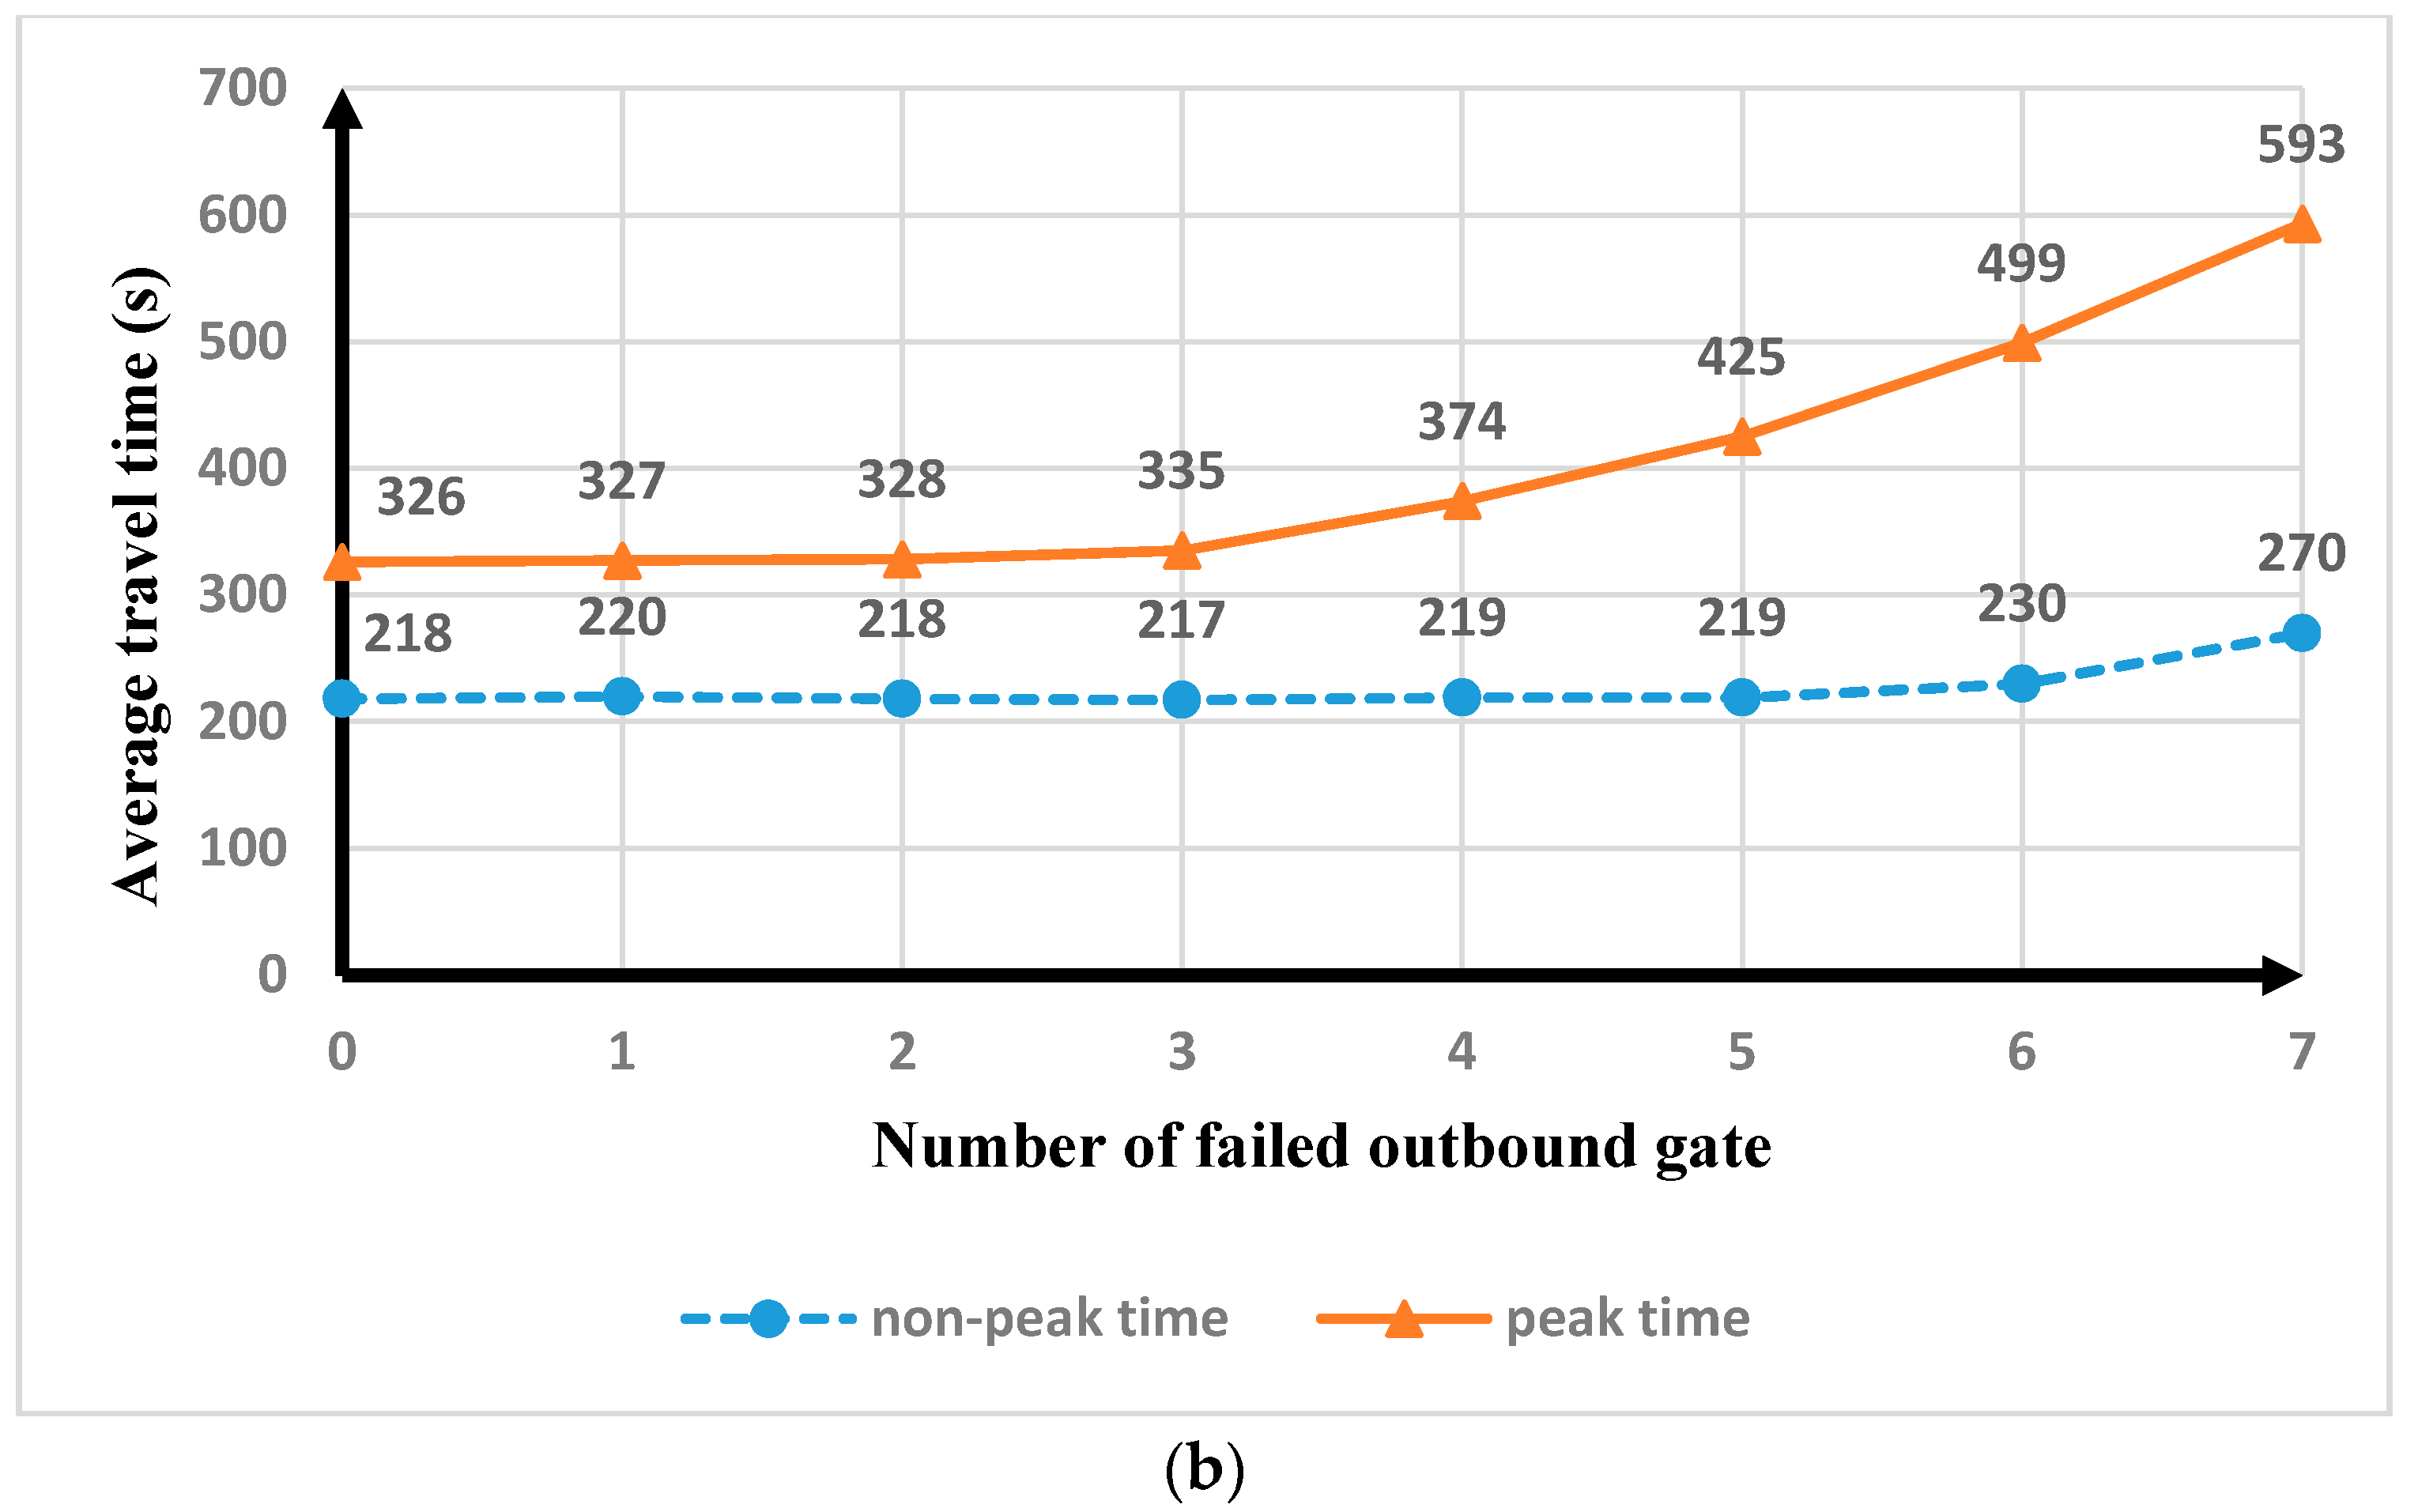
Figure 8, the impact of equipment failure on the DSSC during peak time is much more severe, therefore, the equipment that failed during peak time needs to be repaired in time. During peak time, when the number of failed inbound gates is less than 3 or the number of failed outbound gates is less than 2, the average travel time is almost unchanged. Since the gates are not the capacity bottleneck of the station, the travel time of passengers is not affected under the current passenger flow conditions. When the number of failed inbound gates is more than 3 or the number of failed outbound gates is more than 2, the average travel time increases rapidly and gates need to be repaired in time. As for the inbound gate,
and
. As for the outbound gates,
and
. When the sensitivity threshold
is 1%, the critical value of failed inbound gates is 3 and the critical value of failed outbound gates is 2. In addition, the impact of outbound gate failure on the DSSC is much more severe. Therefore, the failed outbound gates deserve higher priority for repair. As is shown in
Figure 9, the travel time increases significantly when the escalator fails, and the average travel time also becomes longer with the increase of the number of failed escalators. When the escalator fails, the route from the platform to the hall is reduced, and the passenger streamline is more conflicted on the stairs. It is necessary to prevent escalators from malfunctioning, especially during rush hour. During peak time,
and
. Therefore, the maintenance priority of station equipment is as follows: the escalators have higher priority for repair than the gates, and the outbound gates have higher priority for repair than the inbound gates.
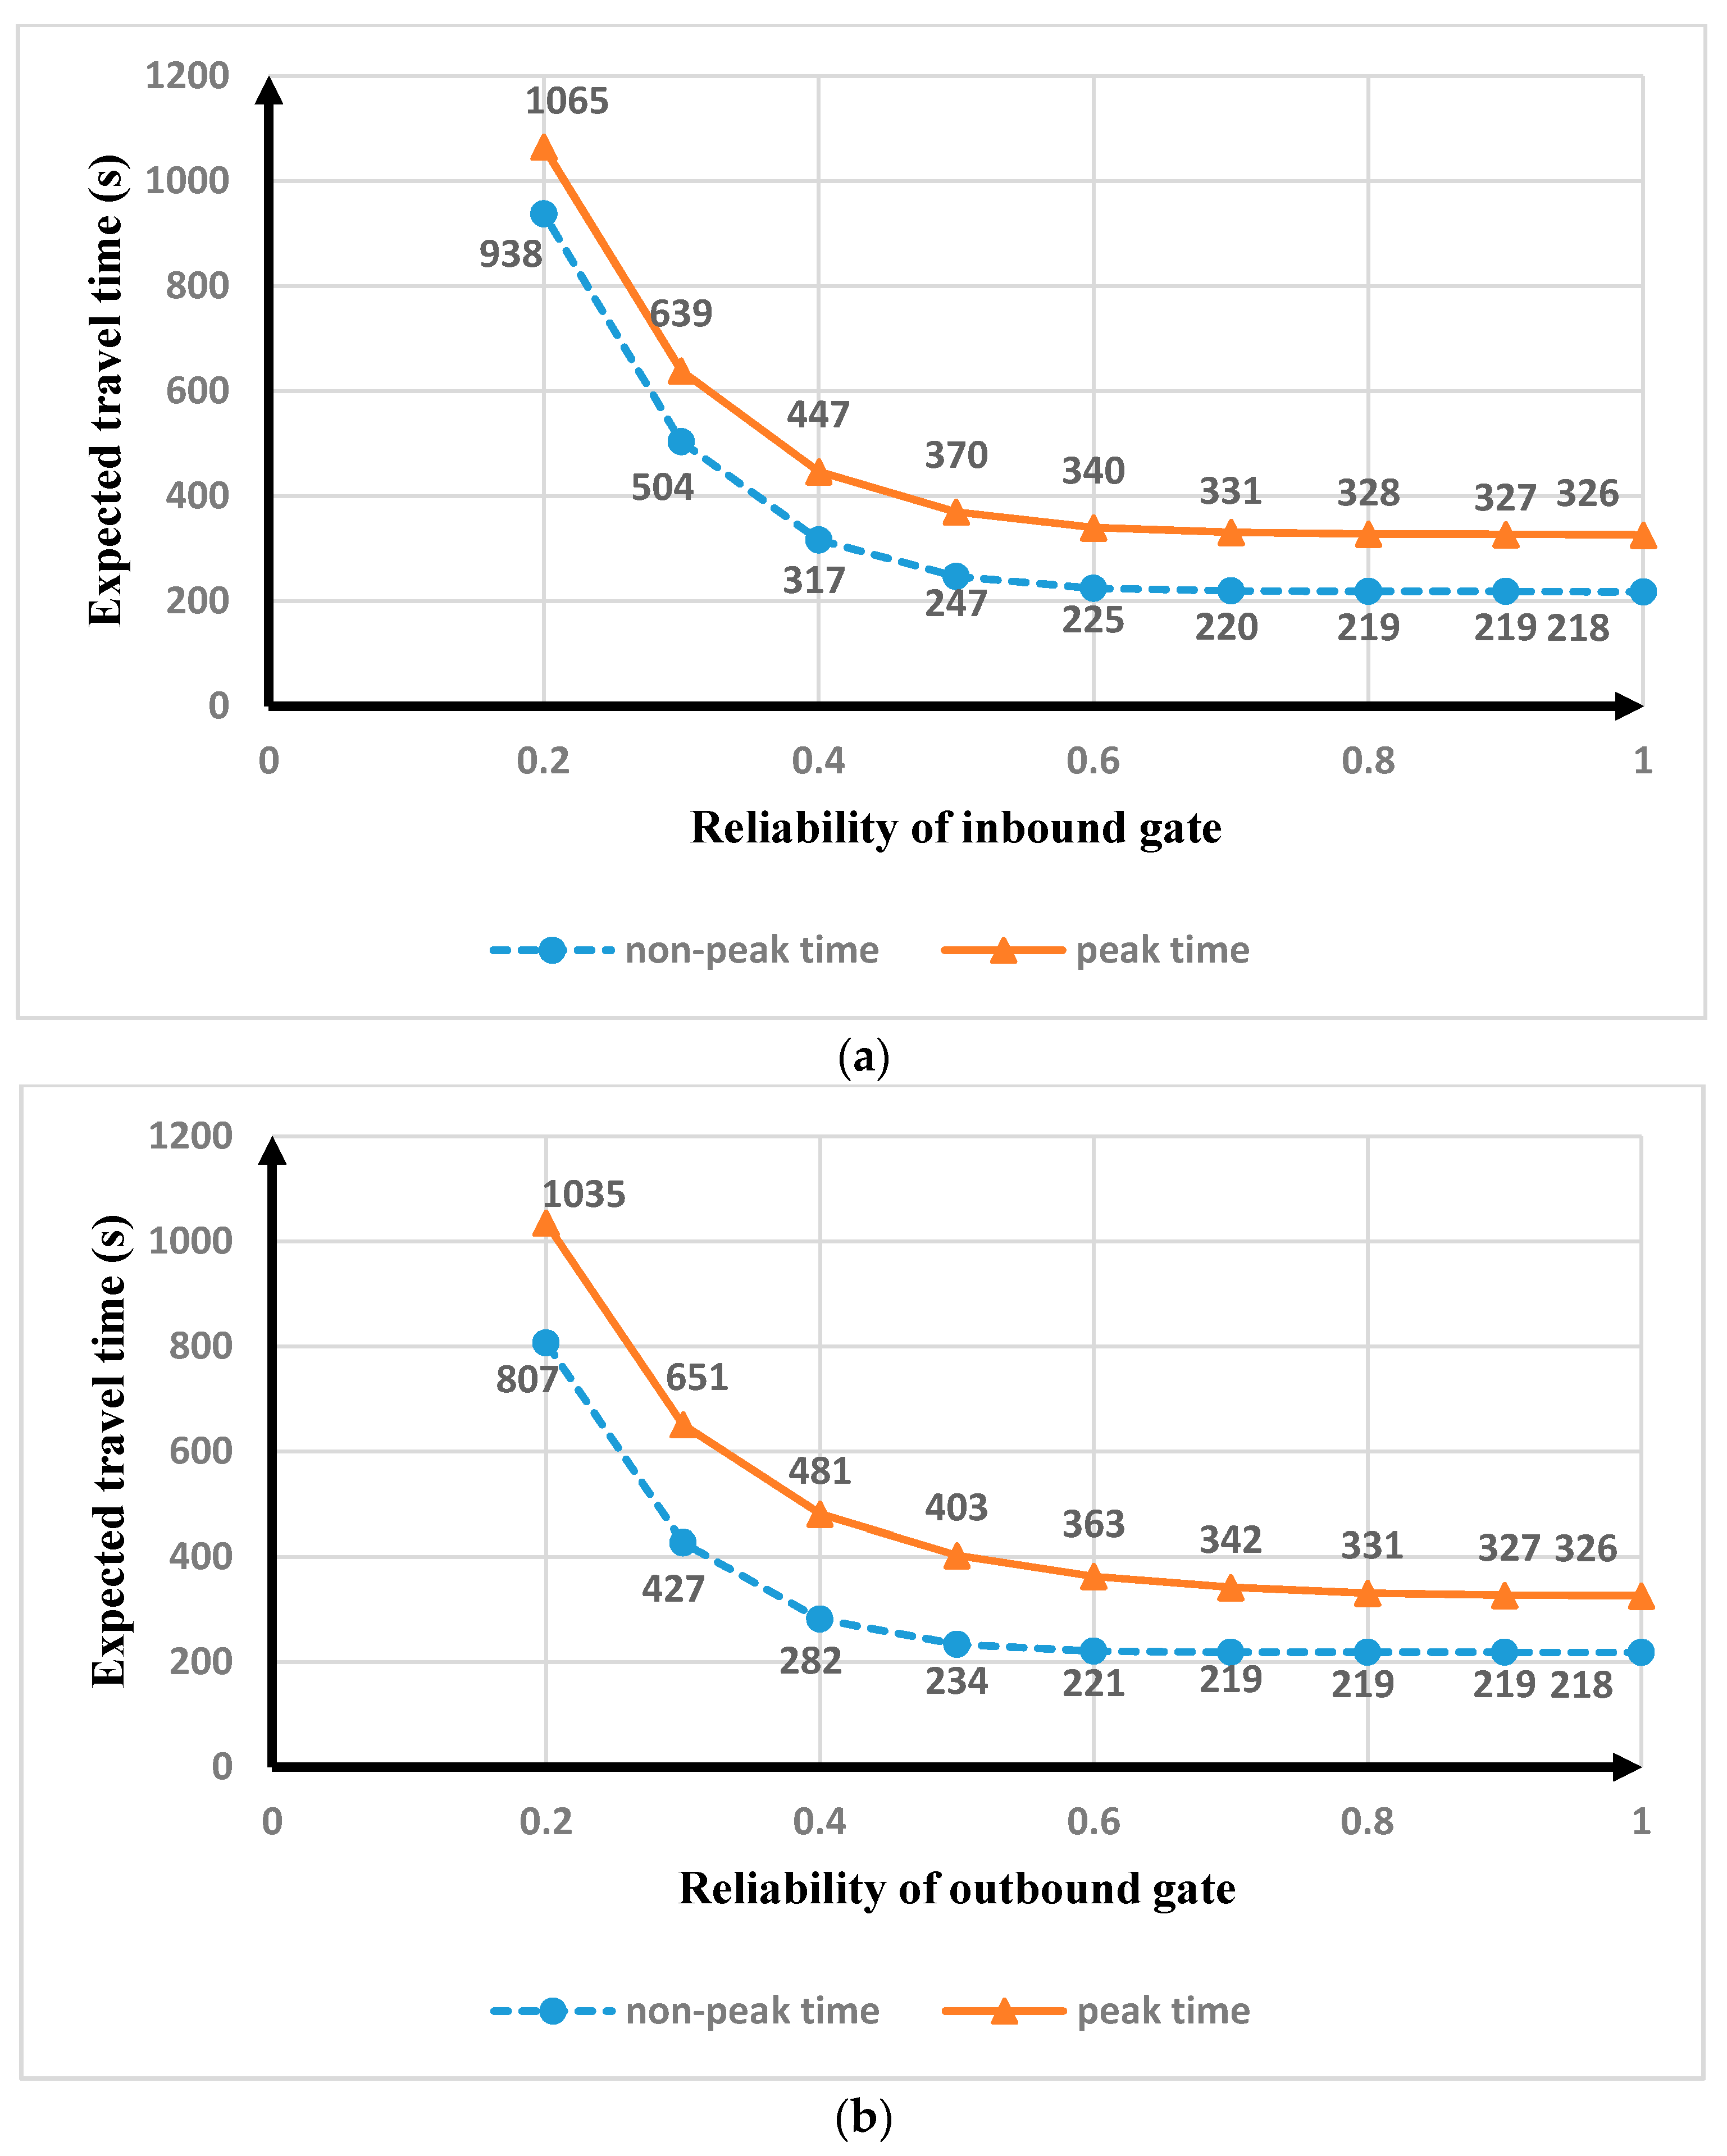
The station capacity model with equipment failure is used to analyze the impact of the reliability of the key equipment on the expected DSSC (also referred to as expected station capacity). When all inbound gates or outbound gates fail, the travel time is infinite in principle. However, in order to measure time and the unit time granularity of calculating station capacity is 1 h, the travel time is assigned as 3600 s in the simulation study. When the reliability of the other equipment is 1, the impact of the reliability of gate on the expected DSSC is shown in
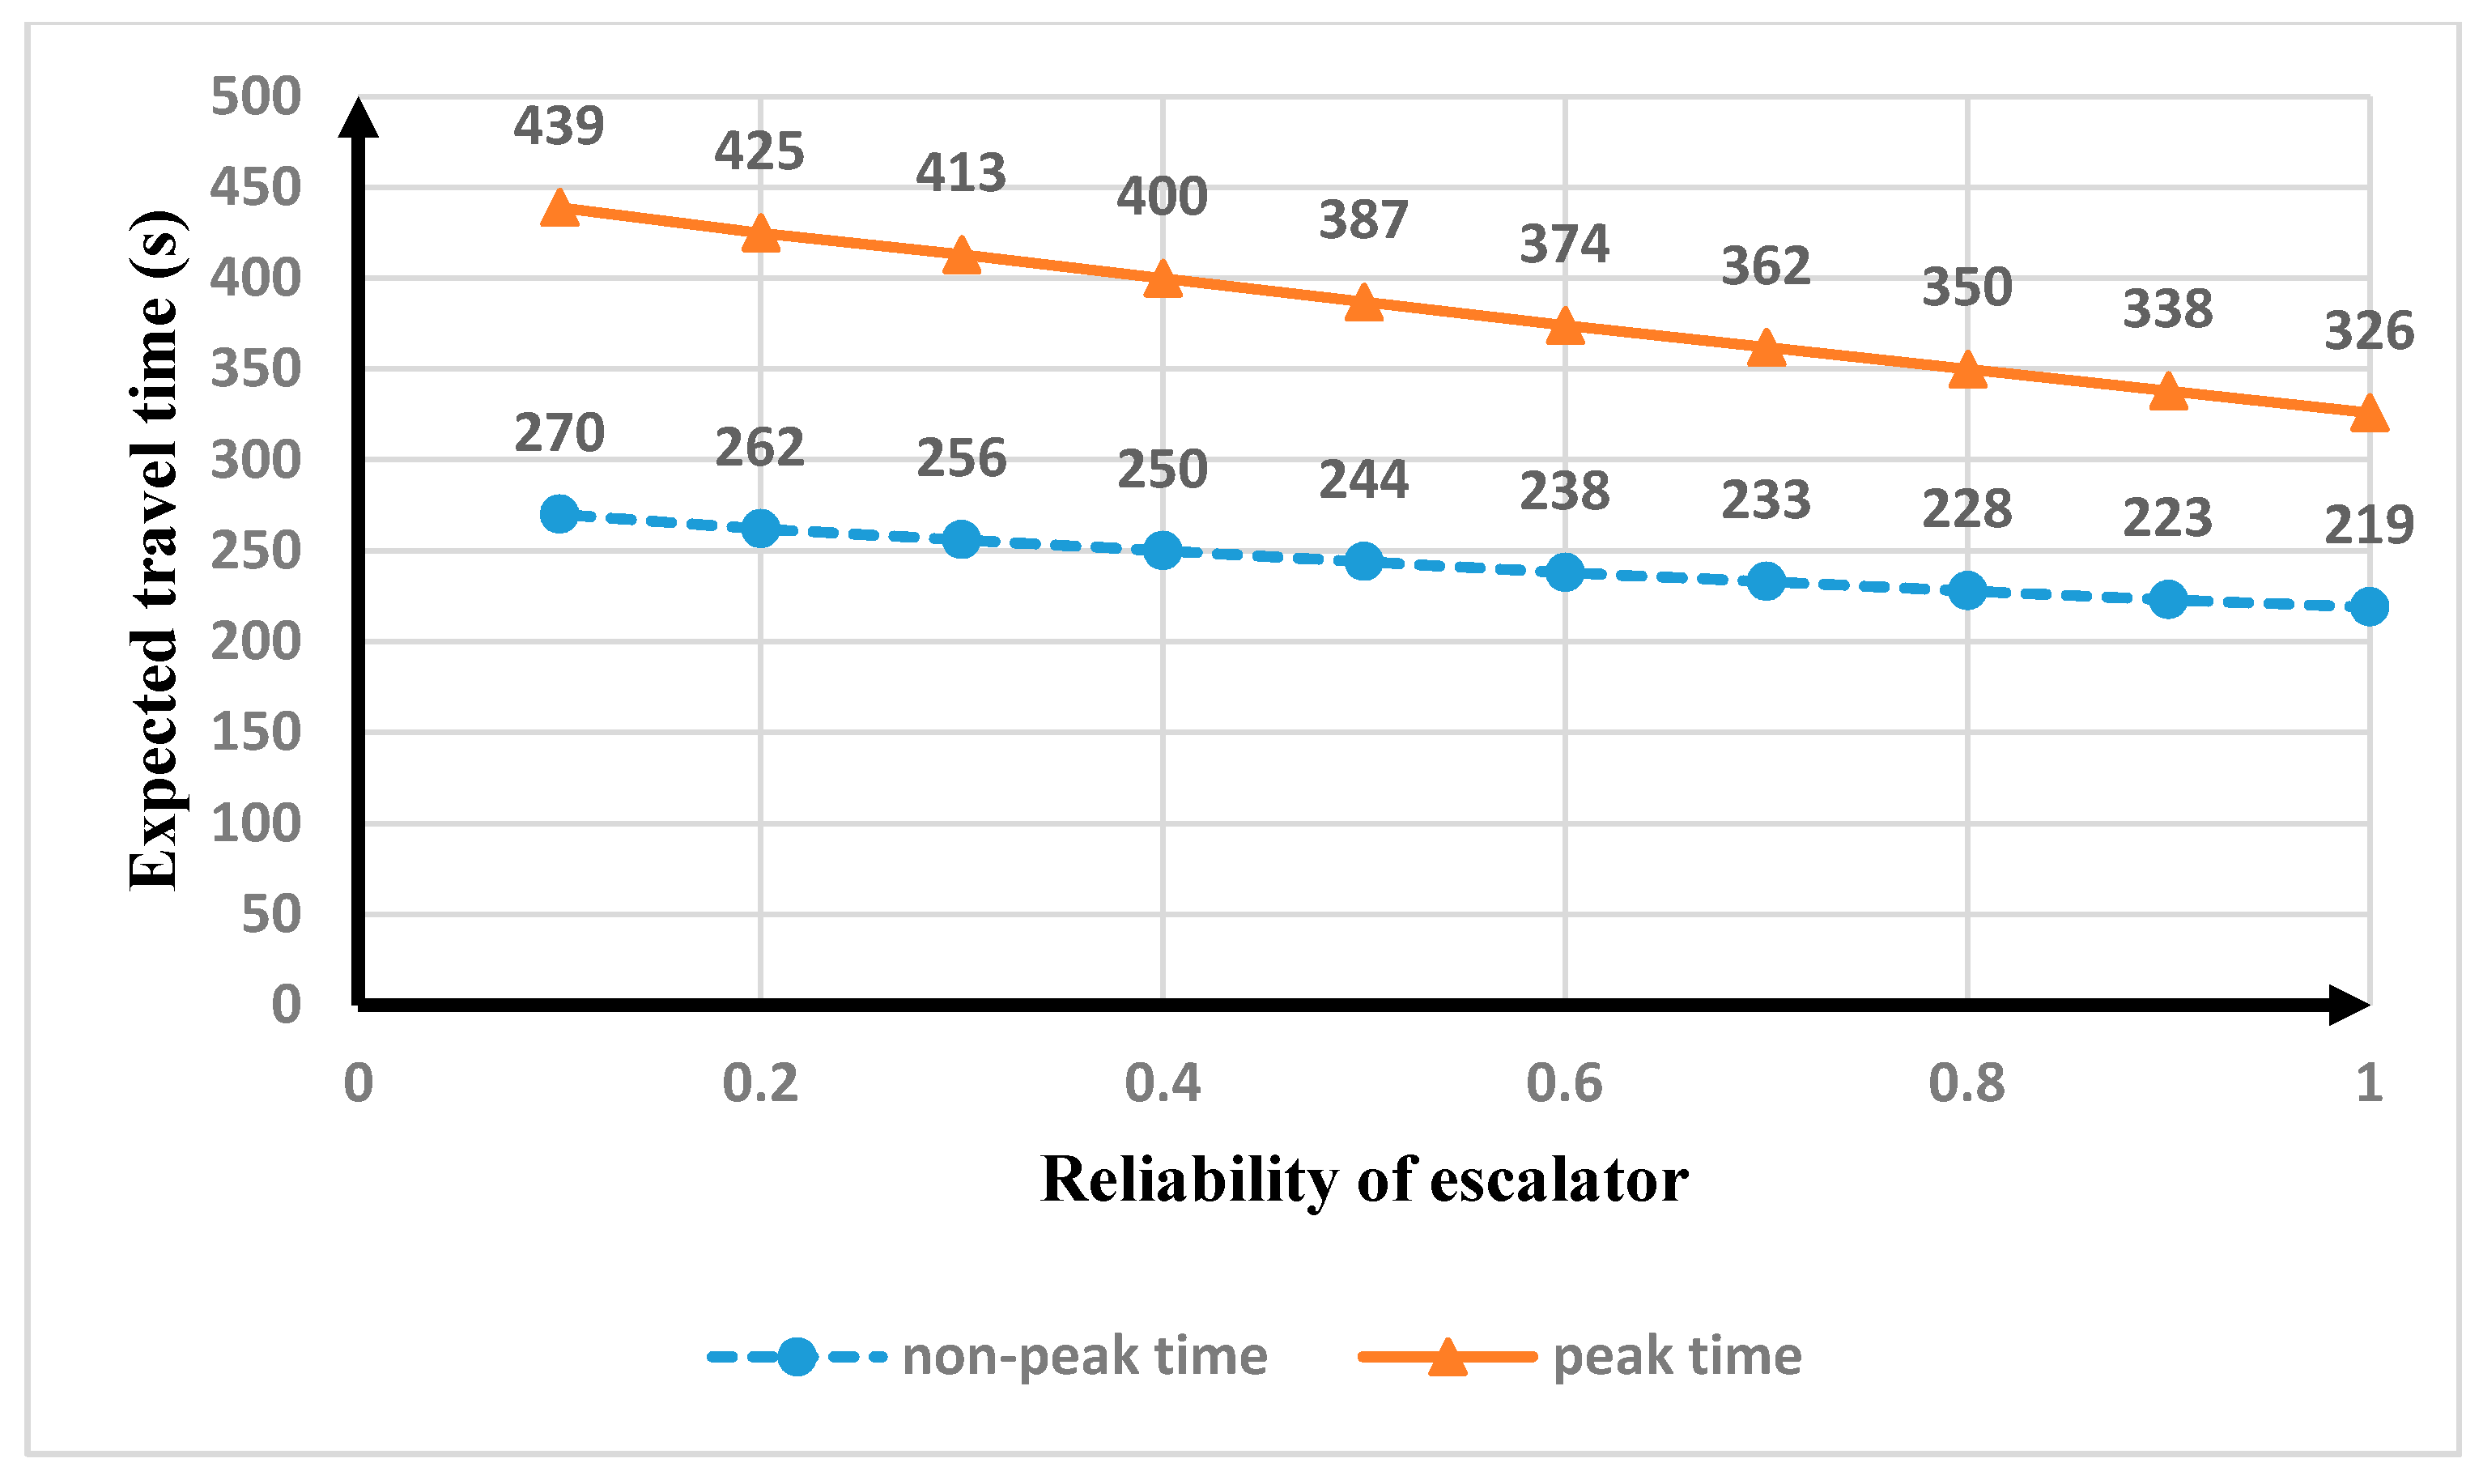
Figure 10. Similarly, the impact of the reliability of escalator on the expected DSSC is shown in
Figure 11.
As shown in
Figure 10, as the reliability of the gate increases, the expected average travel time gradually decreases and remains stable after the reliability reaches 0.7. When the reliability of the gate is 0.6, the sensitivity of the inbound gate and the outbound gate is 4.3% and 11.3%, respectively. When the reliability of the gate is 0.7, the sensitivity of the inbound gate and the outbound gate is 1.5% and 4.9%, respectively. When the sensitivity threshold
is 10%, the reliability of the gate needs to be maintained at 0.7 or higher in the current passenger flow conditions. Similarly, when the reliability of the escalator is 0.7, the sensitivity of the escalator is 11.0%, when the reliability of the escalator is 0.8, the sensitivity of the escalator is 7.3%. Hence, the reliability of the escalator needs to be maintained at 0.8 or higher. When key equipment does not reach the specified reliability, maintenance measures need to be taken to maintain station capacity.
6.3. Reliability Modeling of the Key Equipment
In this section, the reliability modeling issue is presented for the two kinds of key equipment: the gate and the escalator. The fault data are obtained from the maintenance records of the subway company. In this paper, the maximum likelihood estimation method (MLE) is selected to estimate parameters of fault distributions, and the Anderson-Darling statistic is used to select the optimal distribution.
6.3.1. Reliability Modeling of the Gate
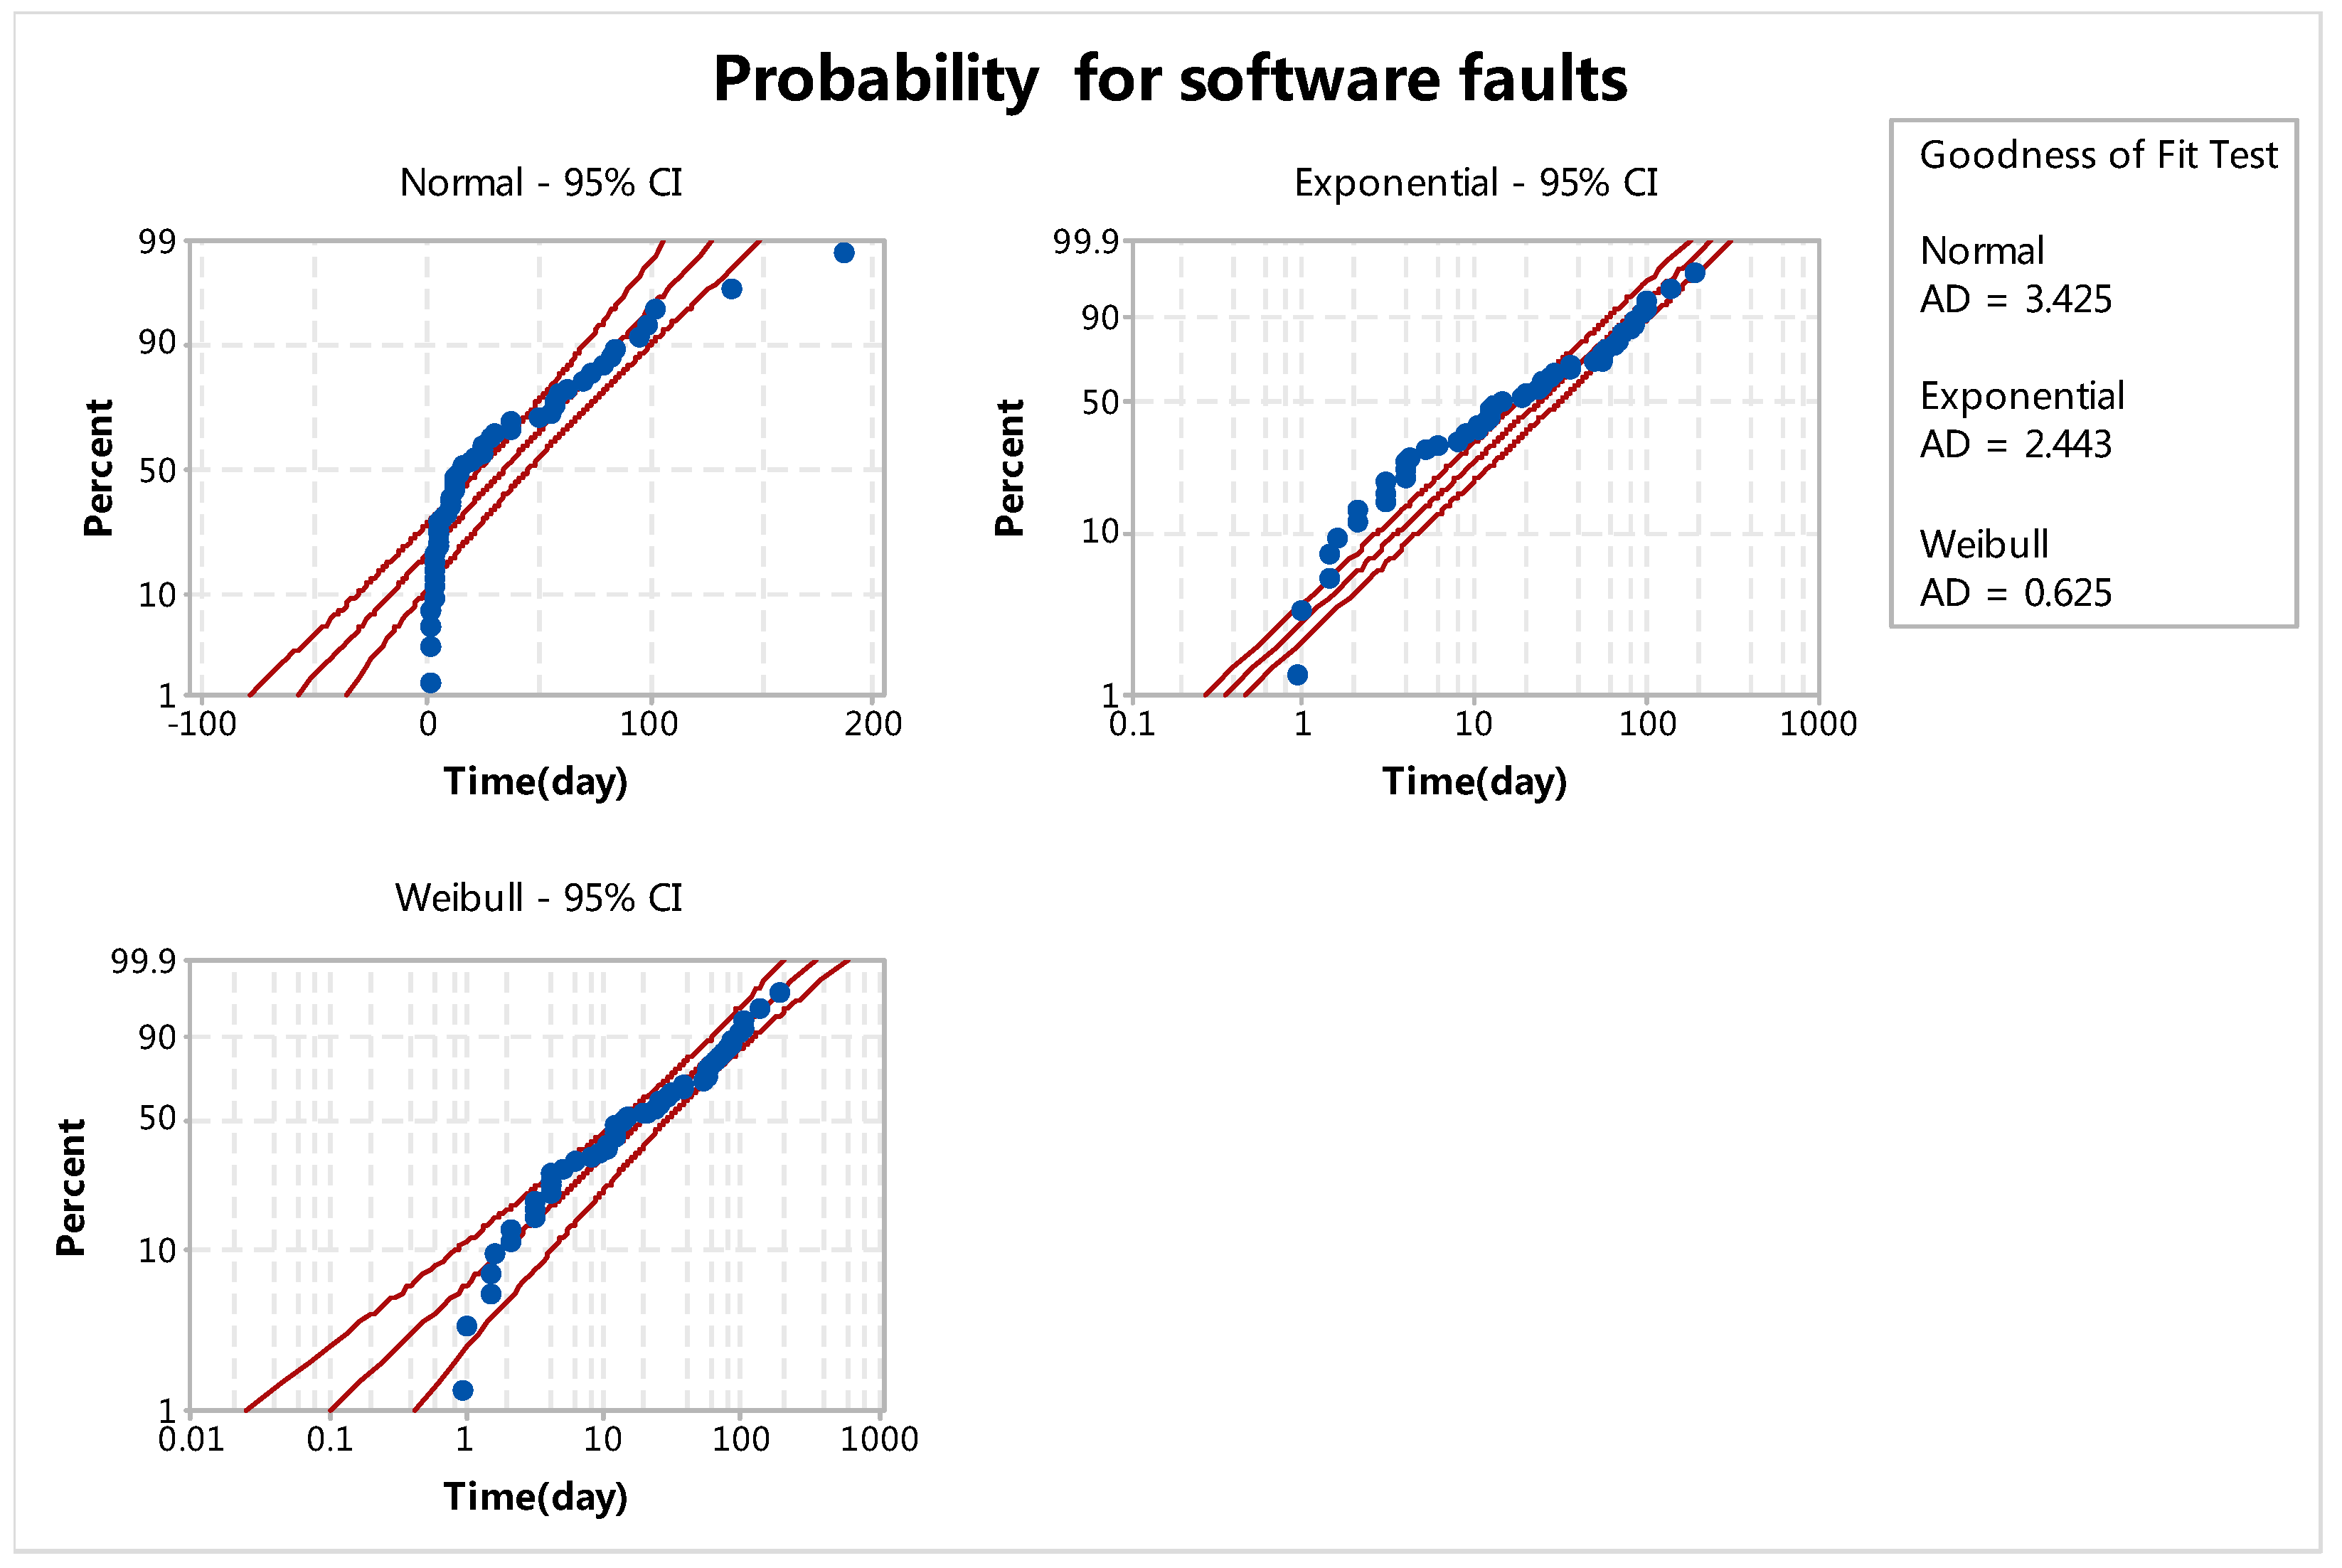
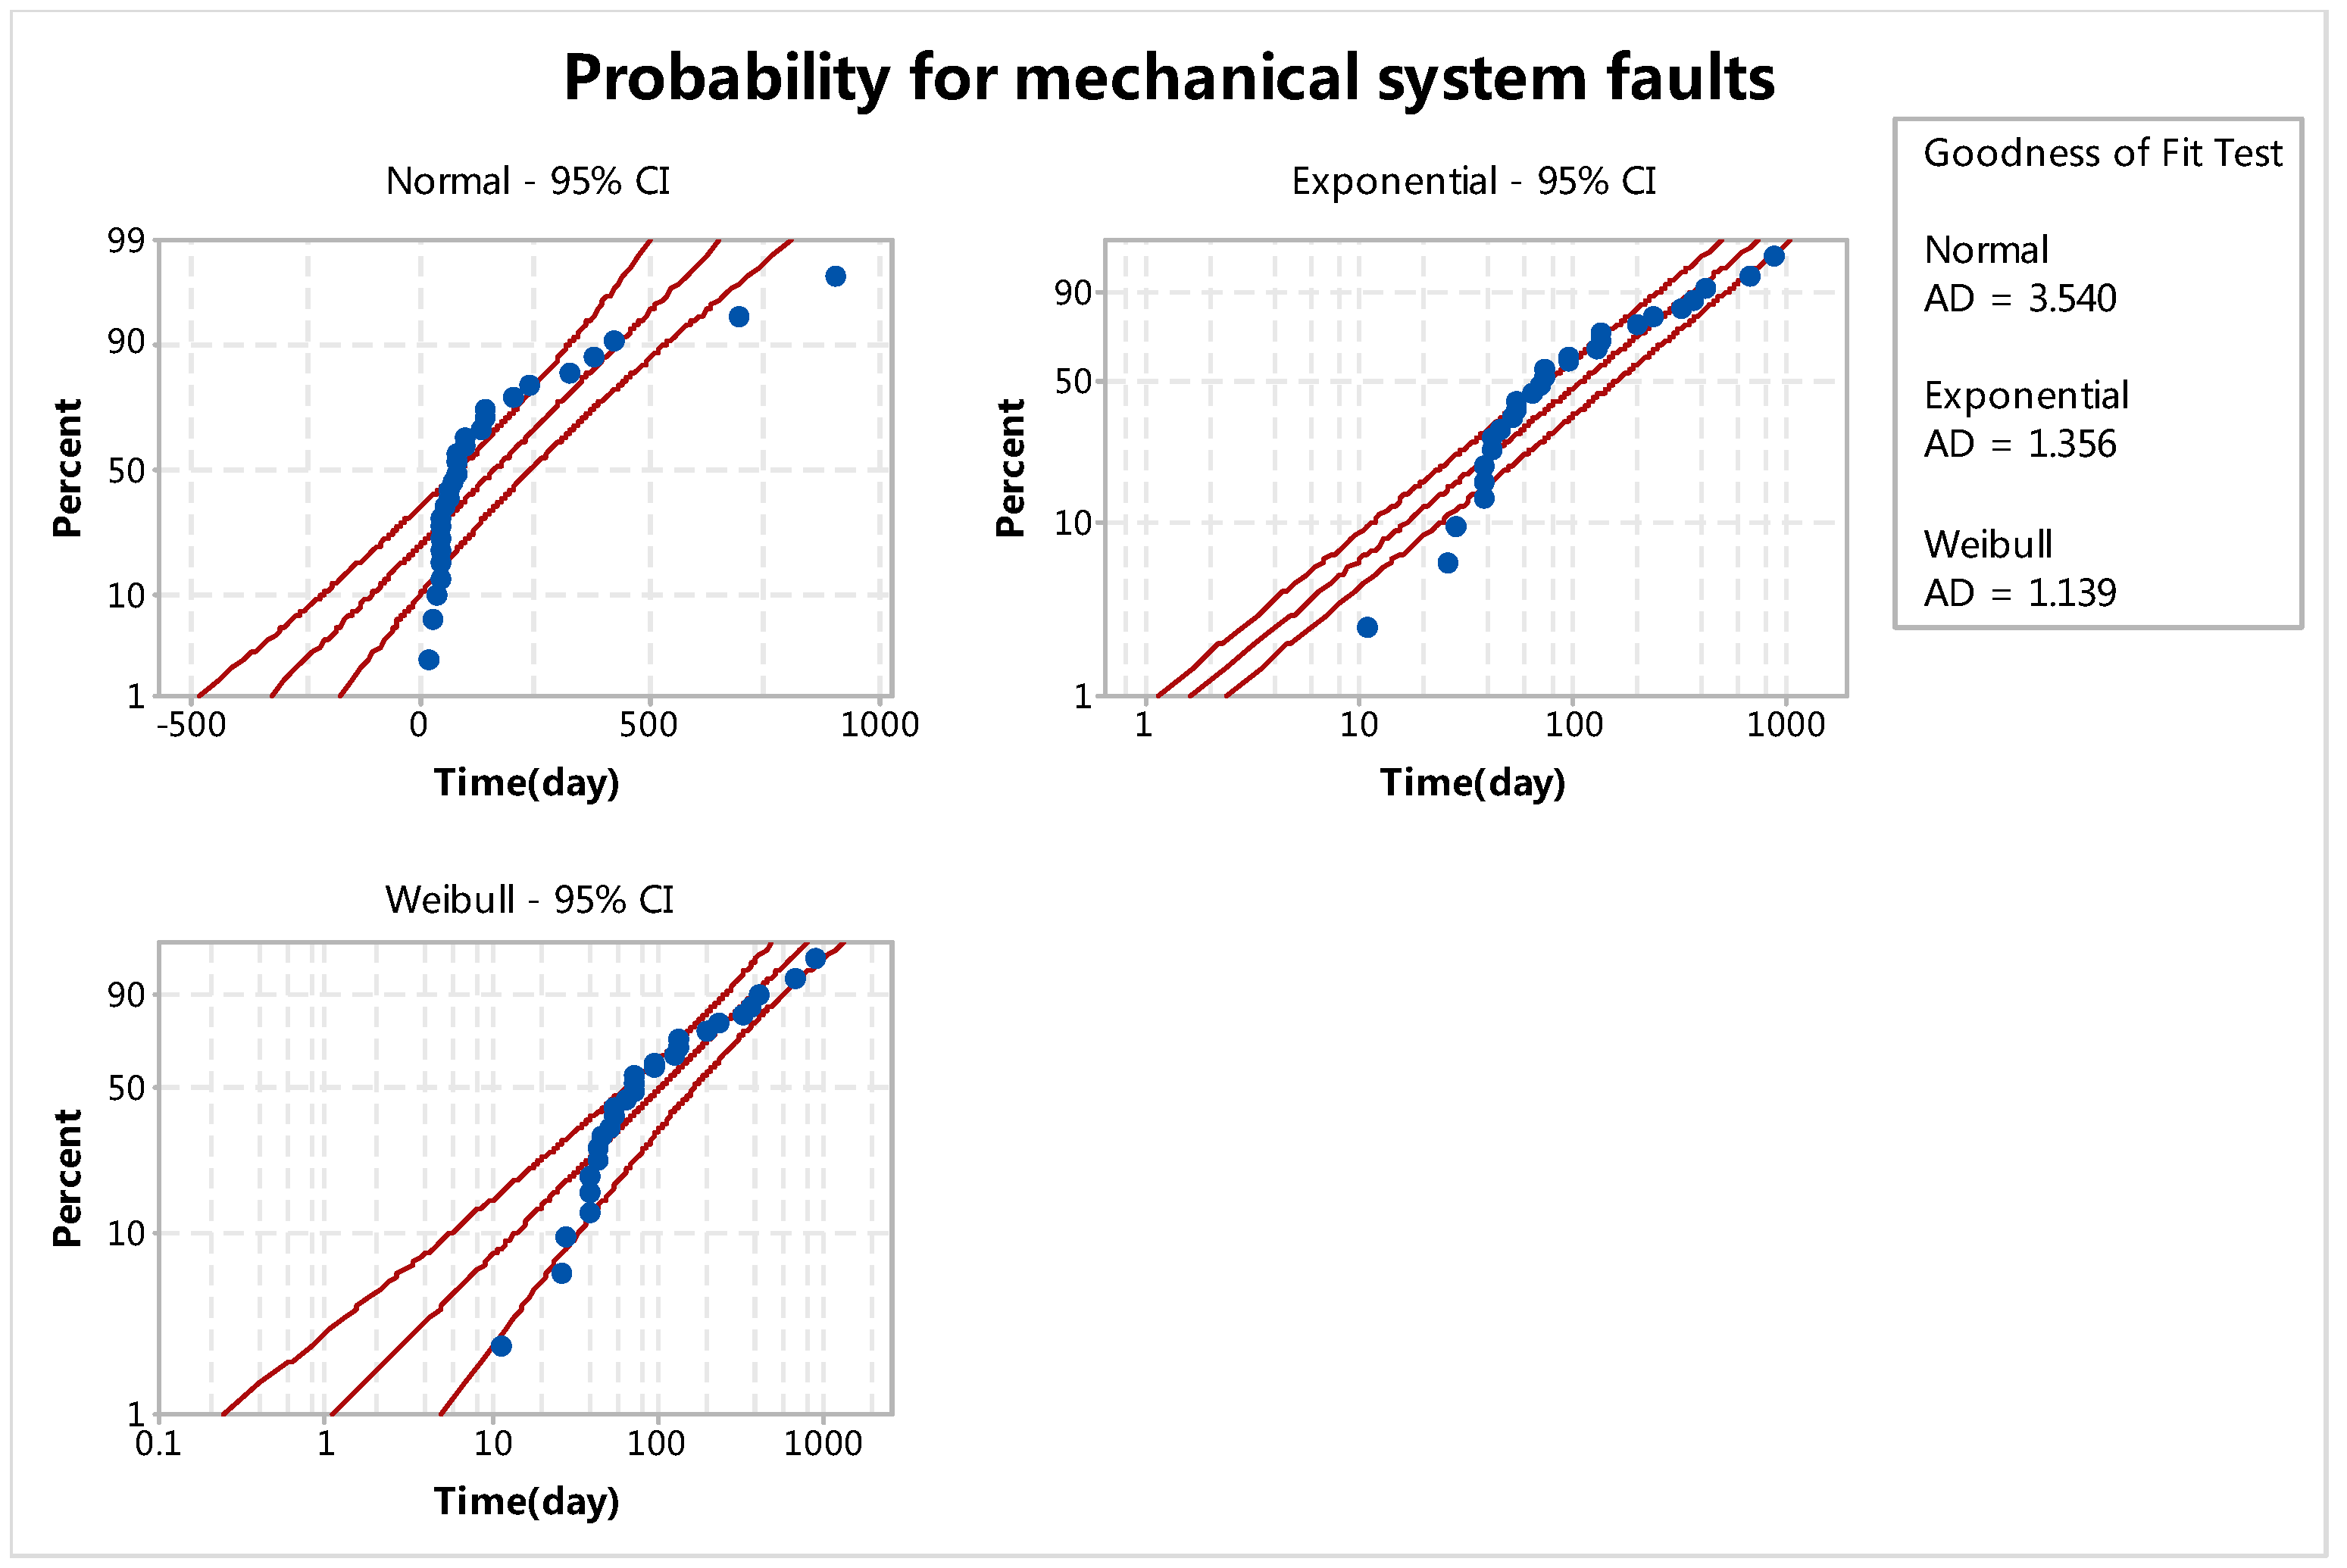
The components of the gate include the box body, the blocking body, the machine core, the control module and the auxiliary module. The failure-prone components of the gate are mainly the machine core and control module. In the light of the maintenance records of the gate, the faults of the gate can be divided into two categories: software faults and hardware faults. The common software fault is the system crash which requires restart of the gate. The familiar hardware faults include poor contact of circuit, abnormal component parameters and component damage which requires replacement of components. Based on the statistical analysis of fault data, the software faults account for 43% and the hardware faults account for 57%. The software and hardware fault distribution fitting are completed separately.
In this study, 51 samples of the software fault intervals of the gate are used. The average fault interval is 34 days, and the standard deviation is 40. The result of goodness of fit test is shown in
Figure 12. As shown in
Figure 12,
Weibull distribution fits the fault data best, and the Anderson-Darling statistic of
Weibull distribution is the smallest. Therefore, the optimal fault distribution of software is
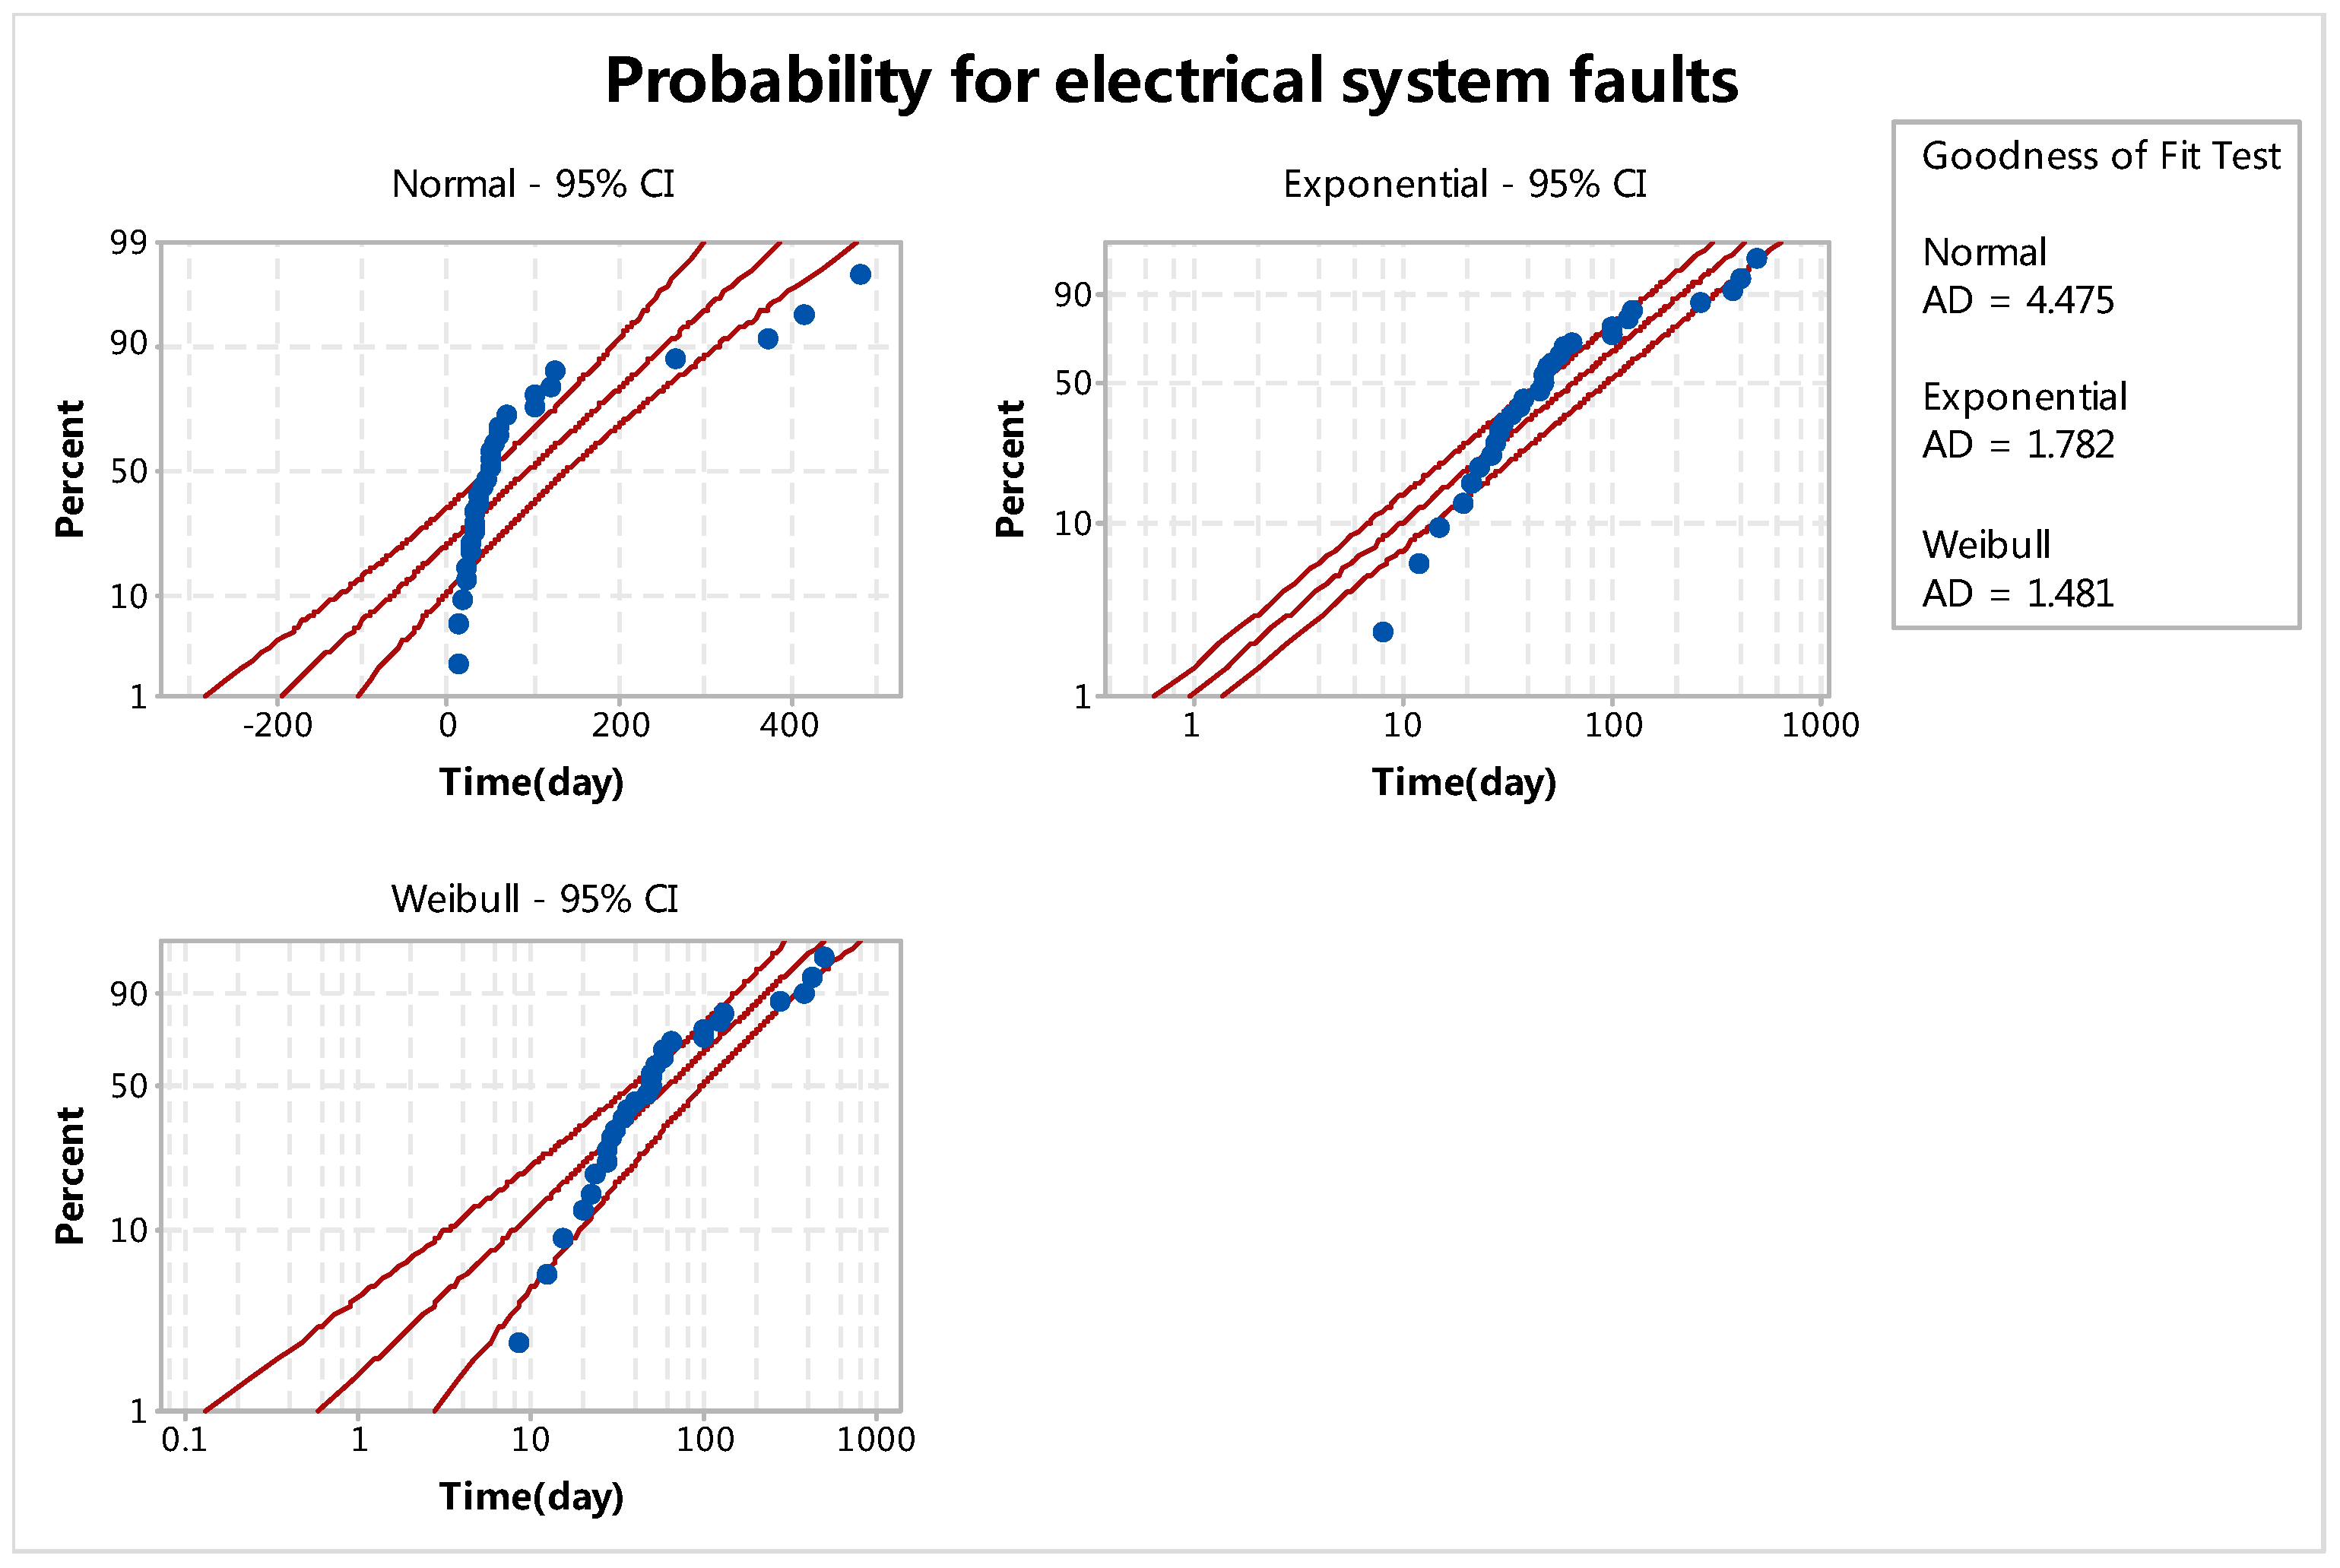
Weibull distribution, and the shape parameter is 0.80, the scale parameter is 30.05. For the hardware fault of the gate, 63 samples of the fault interval are used. The average fault interval is 62 days, and the standard deviation is 82. The result of goodness of fit test is shown in
Figure 13. As shown in
Figure 13,
Weibull distribution fits the fault data best, and the Anderson-Darling statistic of
Weibull distribution is the smallest. Therefore, the optimal fault distribution of hardware is
Weibull distribution, and the shape parameter is 0.843, the scale parameter is 55.92. The reliability function of
Weibull distribution is formulated as follows:
where
,
and
,
is the shape parameter and
is the scale parameter.
6.3.2. Reliability Modeling of the Escalator
The escalator is a large and complex form of transportation equipment with a mechanical structure as the main body. In terms of its functions, the escalator is divided into eight parts: support structure, escalator step system, guide rail system, handrail drive system, handrail device, safety protection device, electrical control system and automatic lubrication device. In light of the maintenance records of the escalator, the faults of the escalator are divided into two categories: intrinsic faults and faults caused by external environment factors, such as passenger interference and foreign objects intrusion. The intrinsic faults are divided into electrical system faults and mechanical system faults. Electrical system faults include control system fault, safety switch action, relay defective and etc., which need to reset control system and all kinds of switches. Mechanical system faults include handrail belt fault, motor bearing fault, drive chain fault and etc., which need to be adjusted or replaced. Based on the statistical analysis of fault data, the faults caused by external environment factors account for 34%, which are not considered since they are uncontrollable, and the intrinsic faults account for 66%, among which electrical system faults account for 37% and mechanical system faults account for 29%. These two class of faults can be repaired and are considered in the maintenance schedule optimization. The electrical system and mechanical system fault distribution fitting are done separately.
For the electrical system faults of the escalator, 29 samples of the fault interval are used. The average fault interval is 94 days, and the standard deviation is 125. The result of goodness of fit test is shown in
Figure 14. As is shown in
Figure 14, Weibull distribution fits the fault data best, and the Anderson-Darling statistic of Weibull distribution is the smallest. Therefore, the optimal fault distribution of electrical system is Weibull distribution, and the shape parameter is 0.91, the scale parameter is 88.23. For the mechanical system fault of the escalator, 28 samples of the fault interval are used. The average fault interval is 161 days, and the standard deviation is 212. The result of the goodness of fit test is shown in
Figure 15. As is shown in
Figure 15, Weibull distribution fits the fault data best, and the Anderson-Darling statistic of Weibull distribution is the smallest. Therefore, the optimal fault distribution of the mechanical system is Weibull distribution, and the shape parameter is 0.923, the scale parameter is 153.69.
6.4. Maintenance Schedule Optimization
The optimal fault distribution of each components of the key equipment and the corresponding parameters are determined. In addition, the maintenance cost data is obtained from the maintenance account records. The maintenance cost of the gate software, is 100 RMB and is 300 RMB. For the gate hardware, is 250 RMB and is 1000 RMB. For the electrical system of the escalator, is 500 RMB and is 1500 RMB. For the mechanical system of the escalator, is 1000 RMB and is 3000 RMB.
The lower bound of equipment reliability is determined by sensitivity analysis based on the equipment reliability-expected station capacity curve. The lower bound of reliability of gate is 0.7, and the lower bound of reliability of escalator is 0.8. The relevant parameters of the equipment are taken into the maintenance schedule optimization model, and MATLAB is used to get a solution of the model. As a result, the optimal software maintenance schedule of the gate is 3 days, and the optimal hardware maintenance schedule of the gate is 8 days. The optimal maintenance schedule of the electrical system of the escalator is 7 days, and the optimal maintenance schedule of the mechanical system of the escalator is 16 days. Therefore, the optimal maintenance strategy of the gates is as follows: the maintenance schedule of software is 3 days, and the maintenance schedule of the gate is one week. The optimal maintenance strategy of the escalators is as follows: the maintenance schedule of the electrical system is one week, and the maintenance schedule of the escalator is half a month.
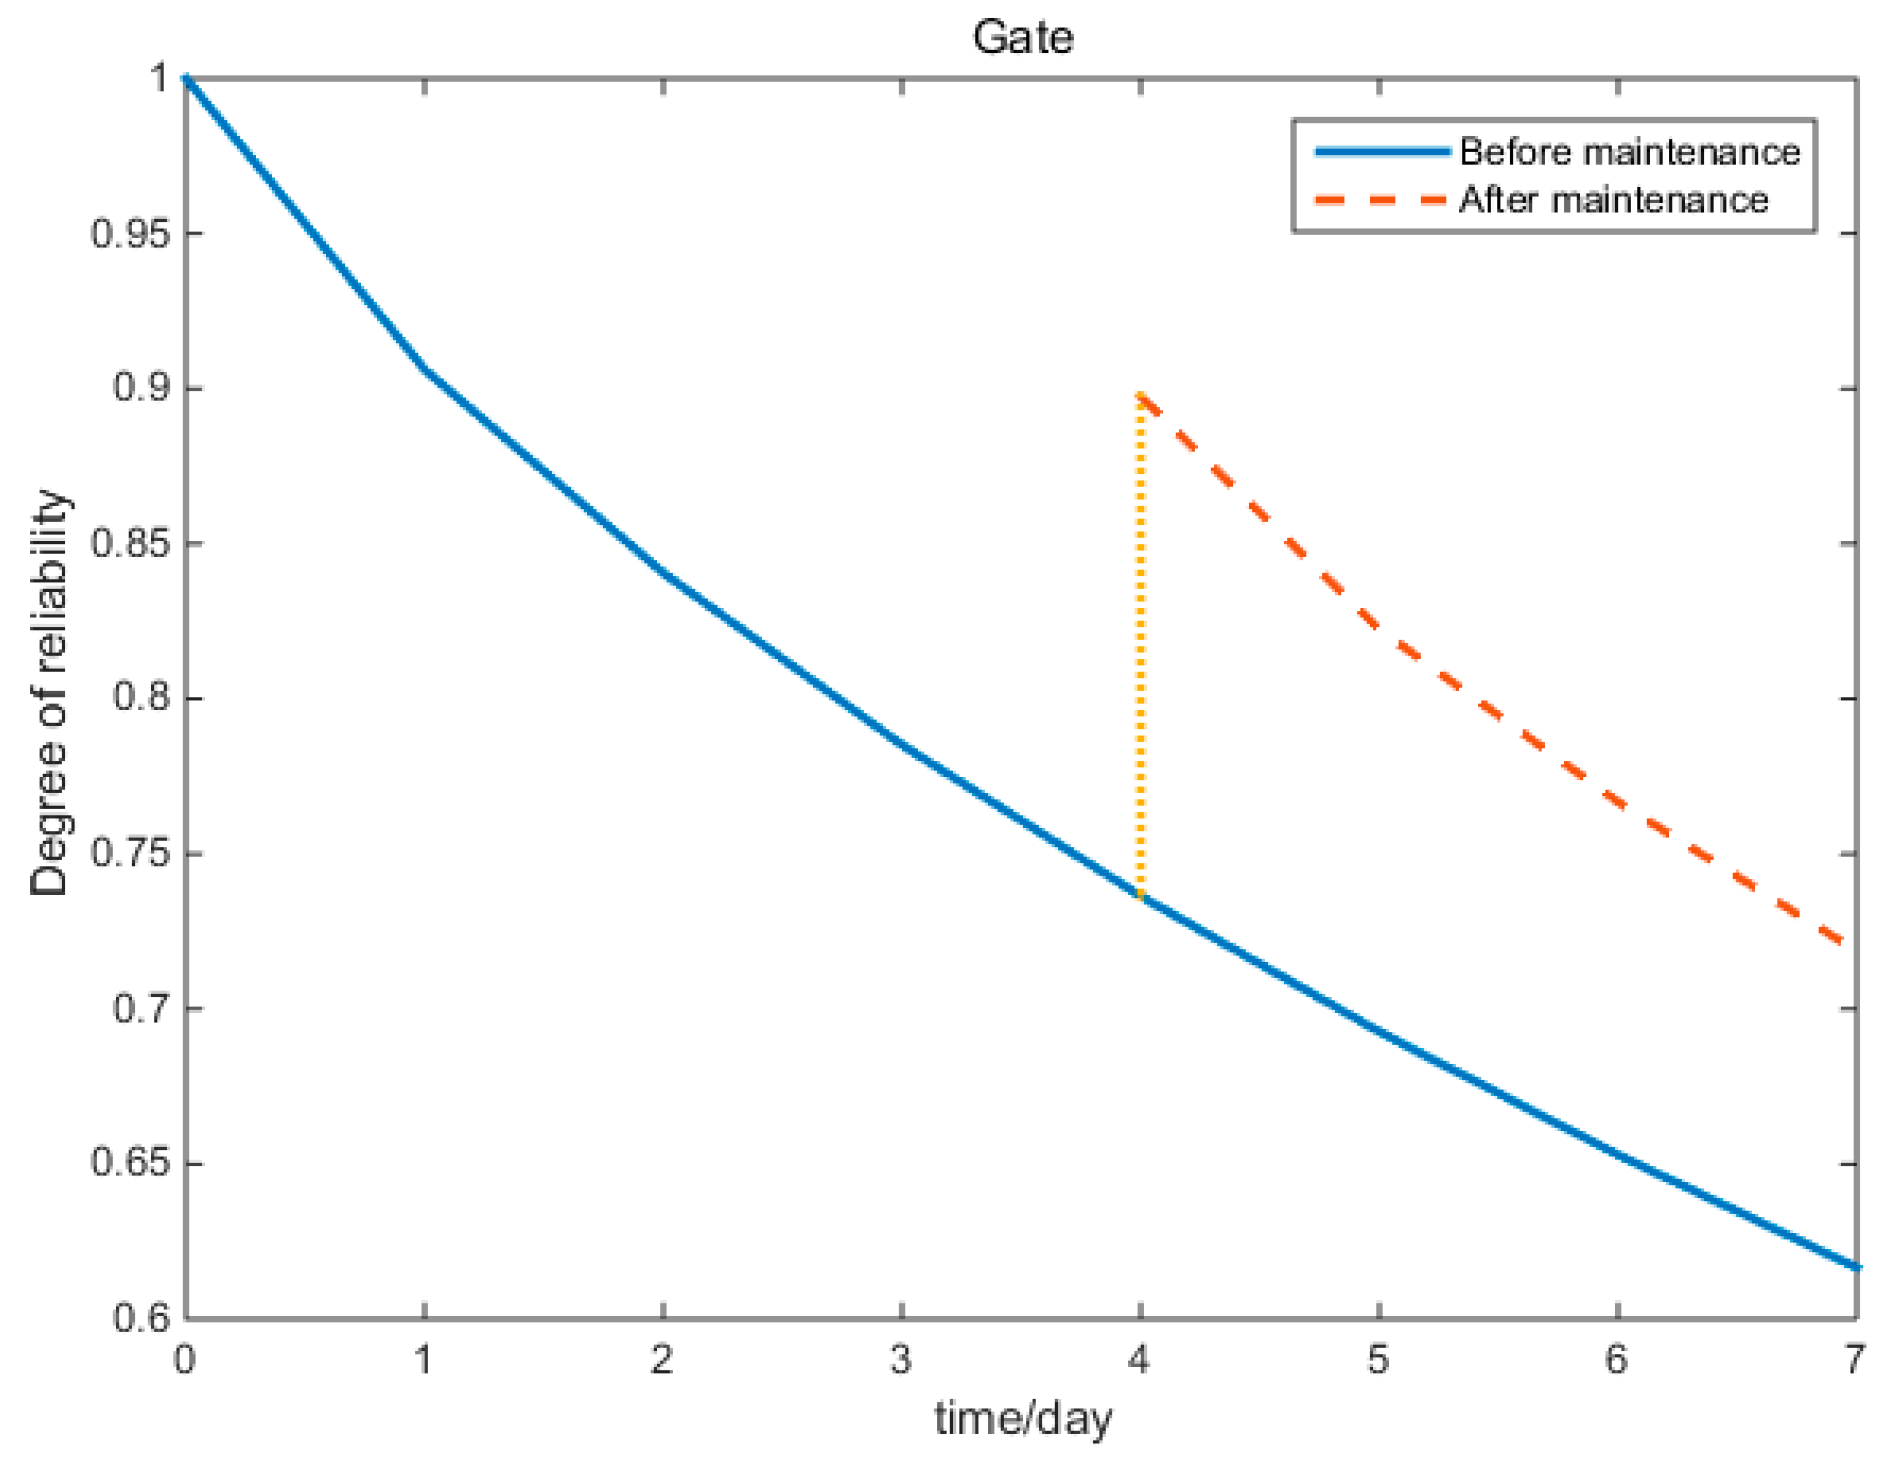
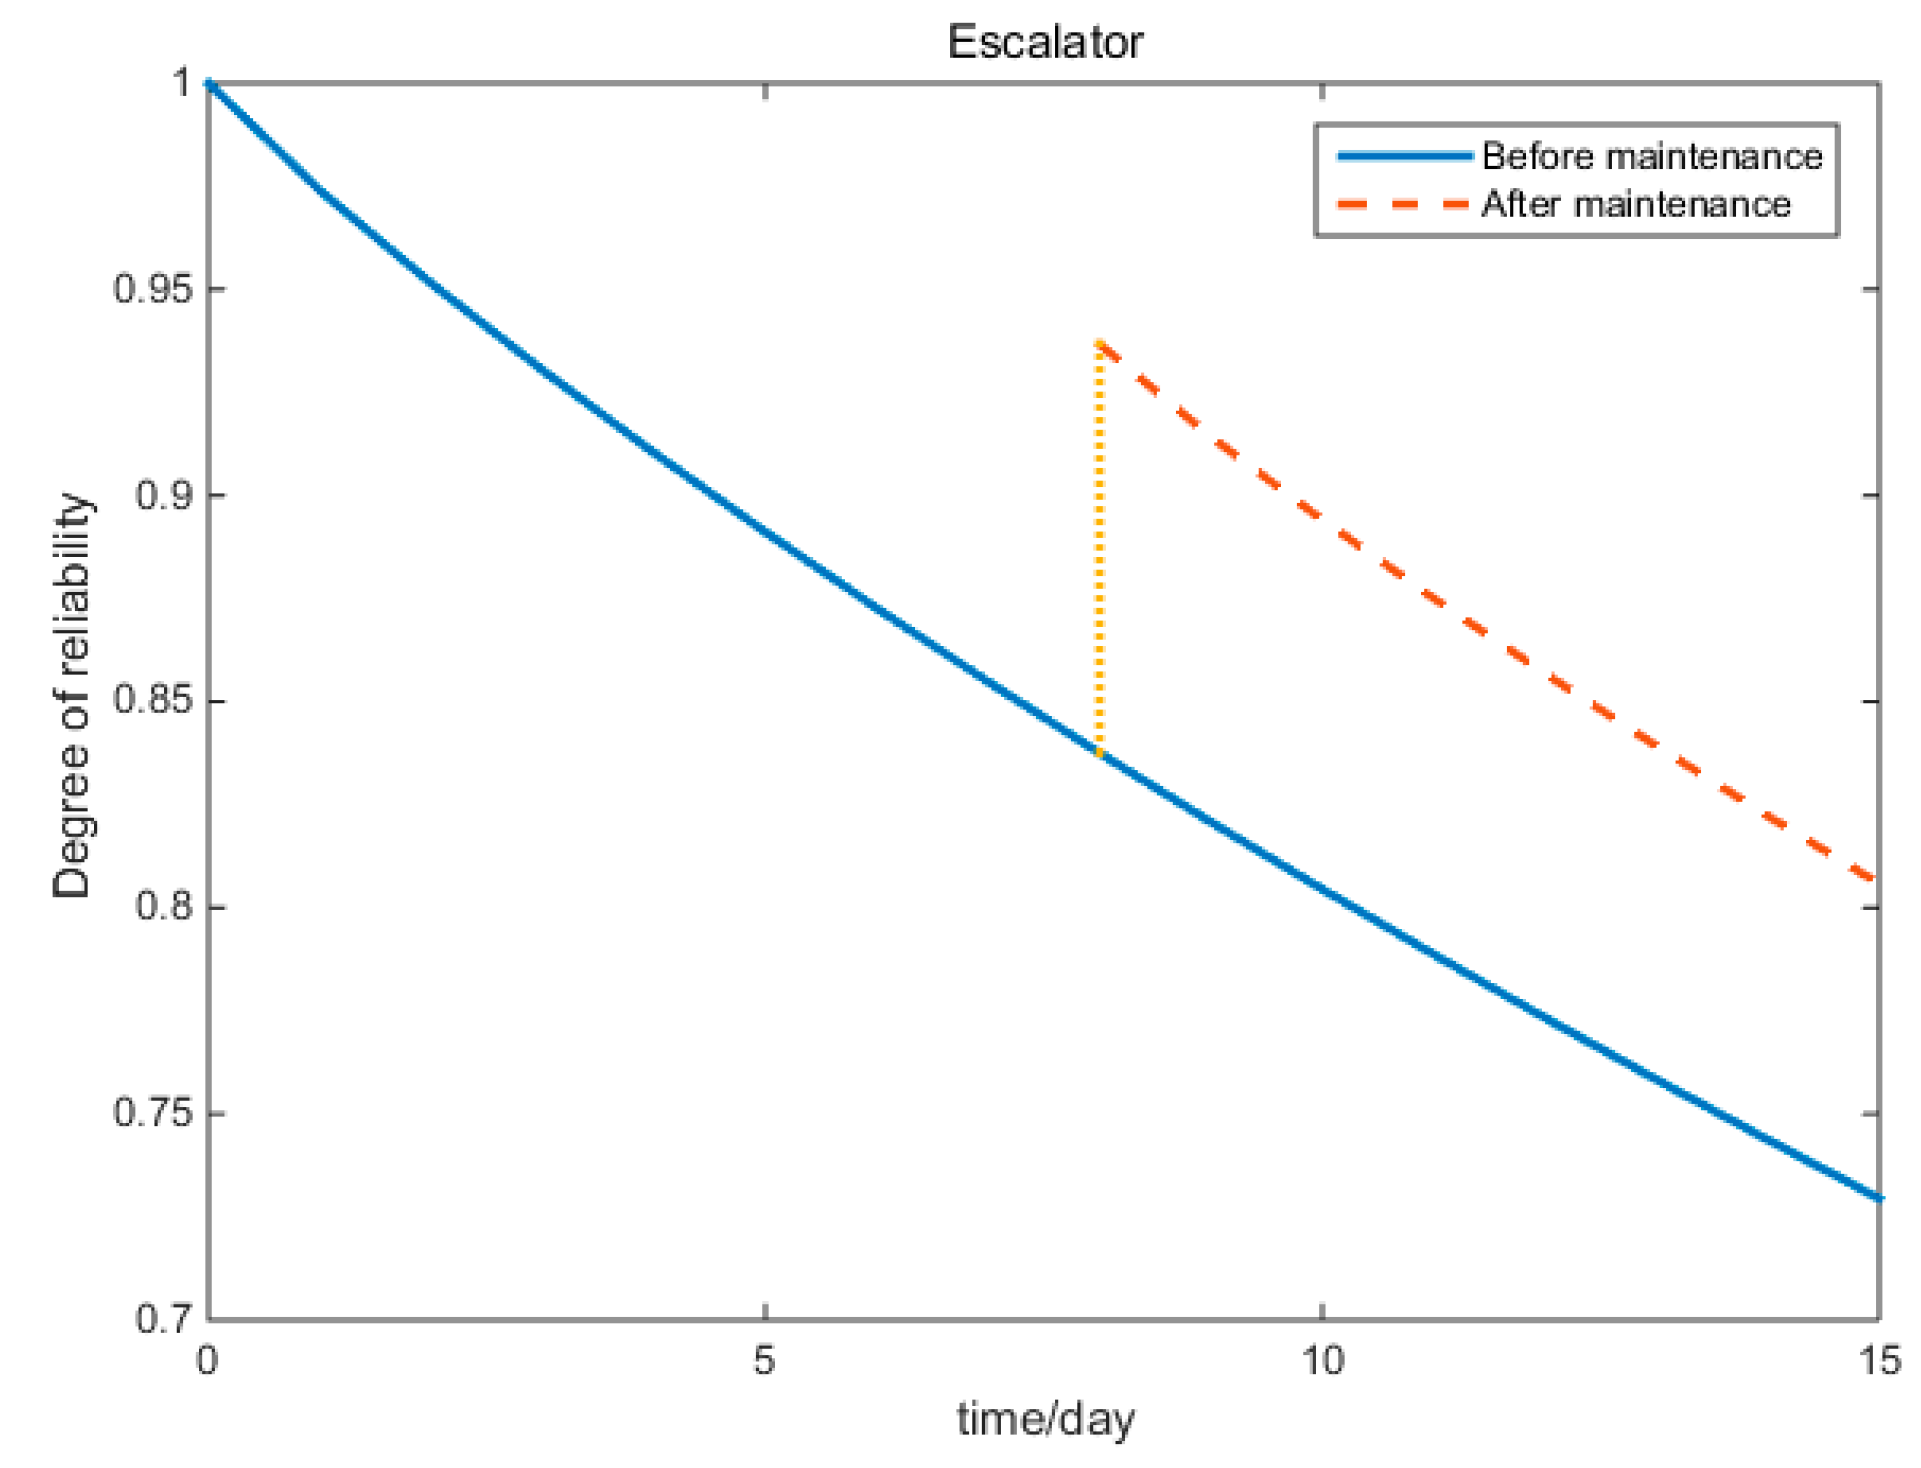
The current maintenance schedule of gates is half a year and the gates are repaired after failure in the majority of cases. The current maintenance schedule of escalators is 2 weeks. The equipment reliability between the current maintenance schedules and the optimal maintenance schedules are compared. The comparison result of gates is shown in
Figure 16 and the comparison result of escalators is shown in
Figure 17. As shown in
Figure 16, the initial reliability of the gate is 1, and the reliability decreases as the operation time goes by. After the maintenance for software system of gates on the third day, the reliability of the gate is restored to 0.9 on the fourth day. The reliability of gates is decreased further as operation time goes on and decreases to 0.7 at the seventh day. After the maintenance for the entire gate on the seventh day, the reliability of the gate is restored to 1 again on the eighth day. The change of the escalator reliability before and after maintenance is shown in
Figure 7.
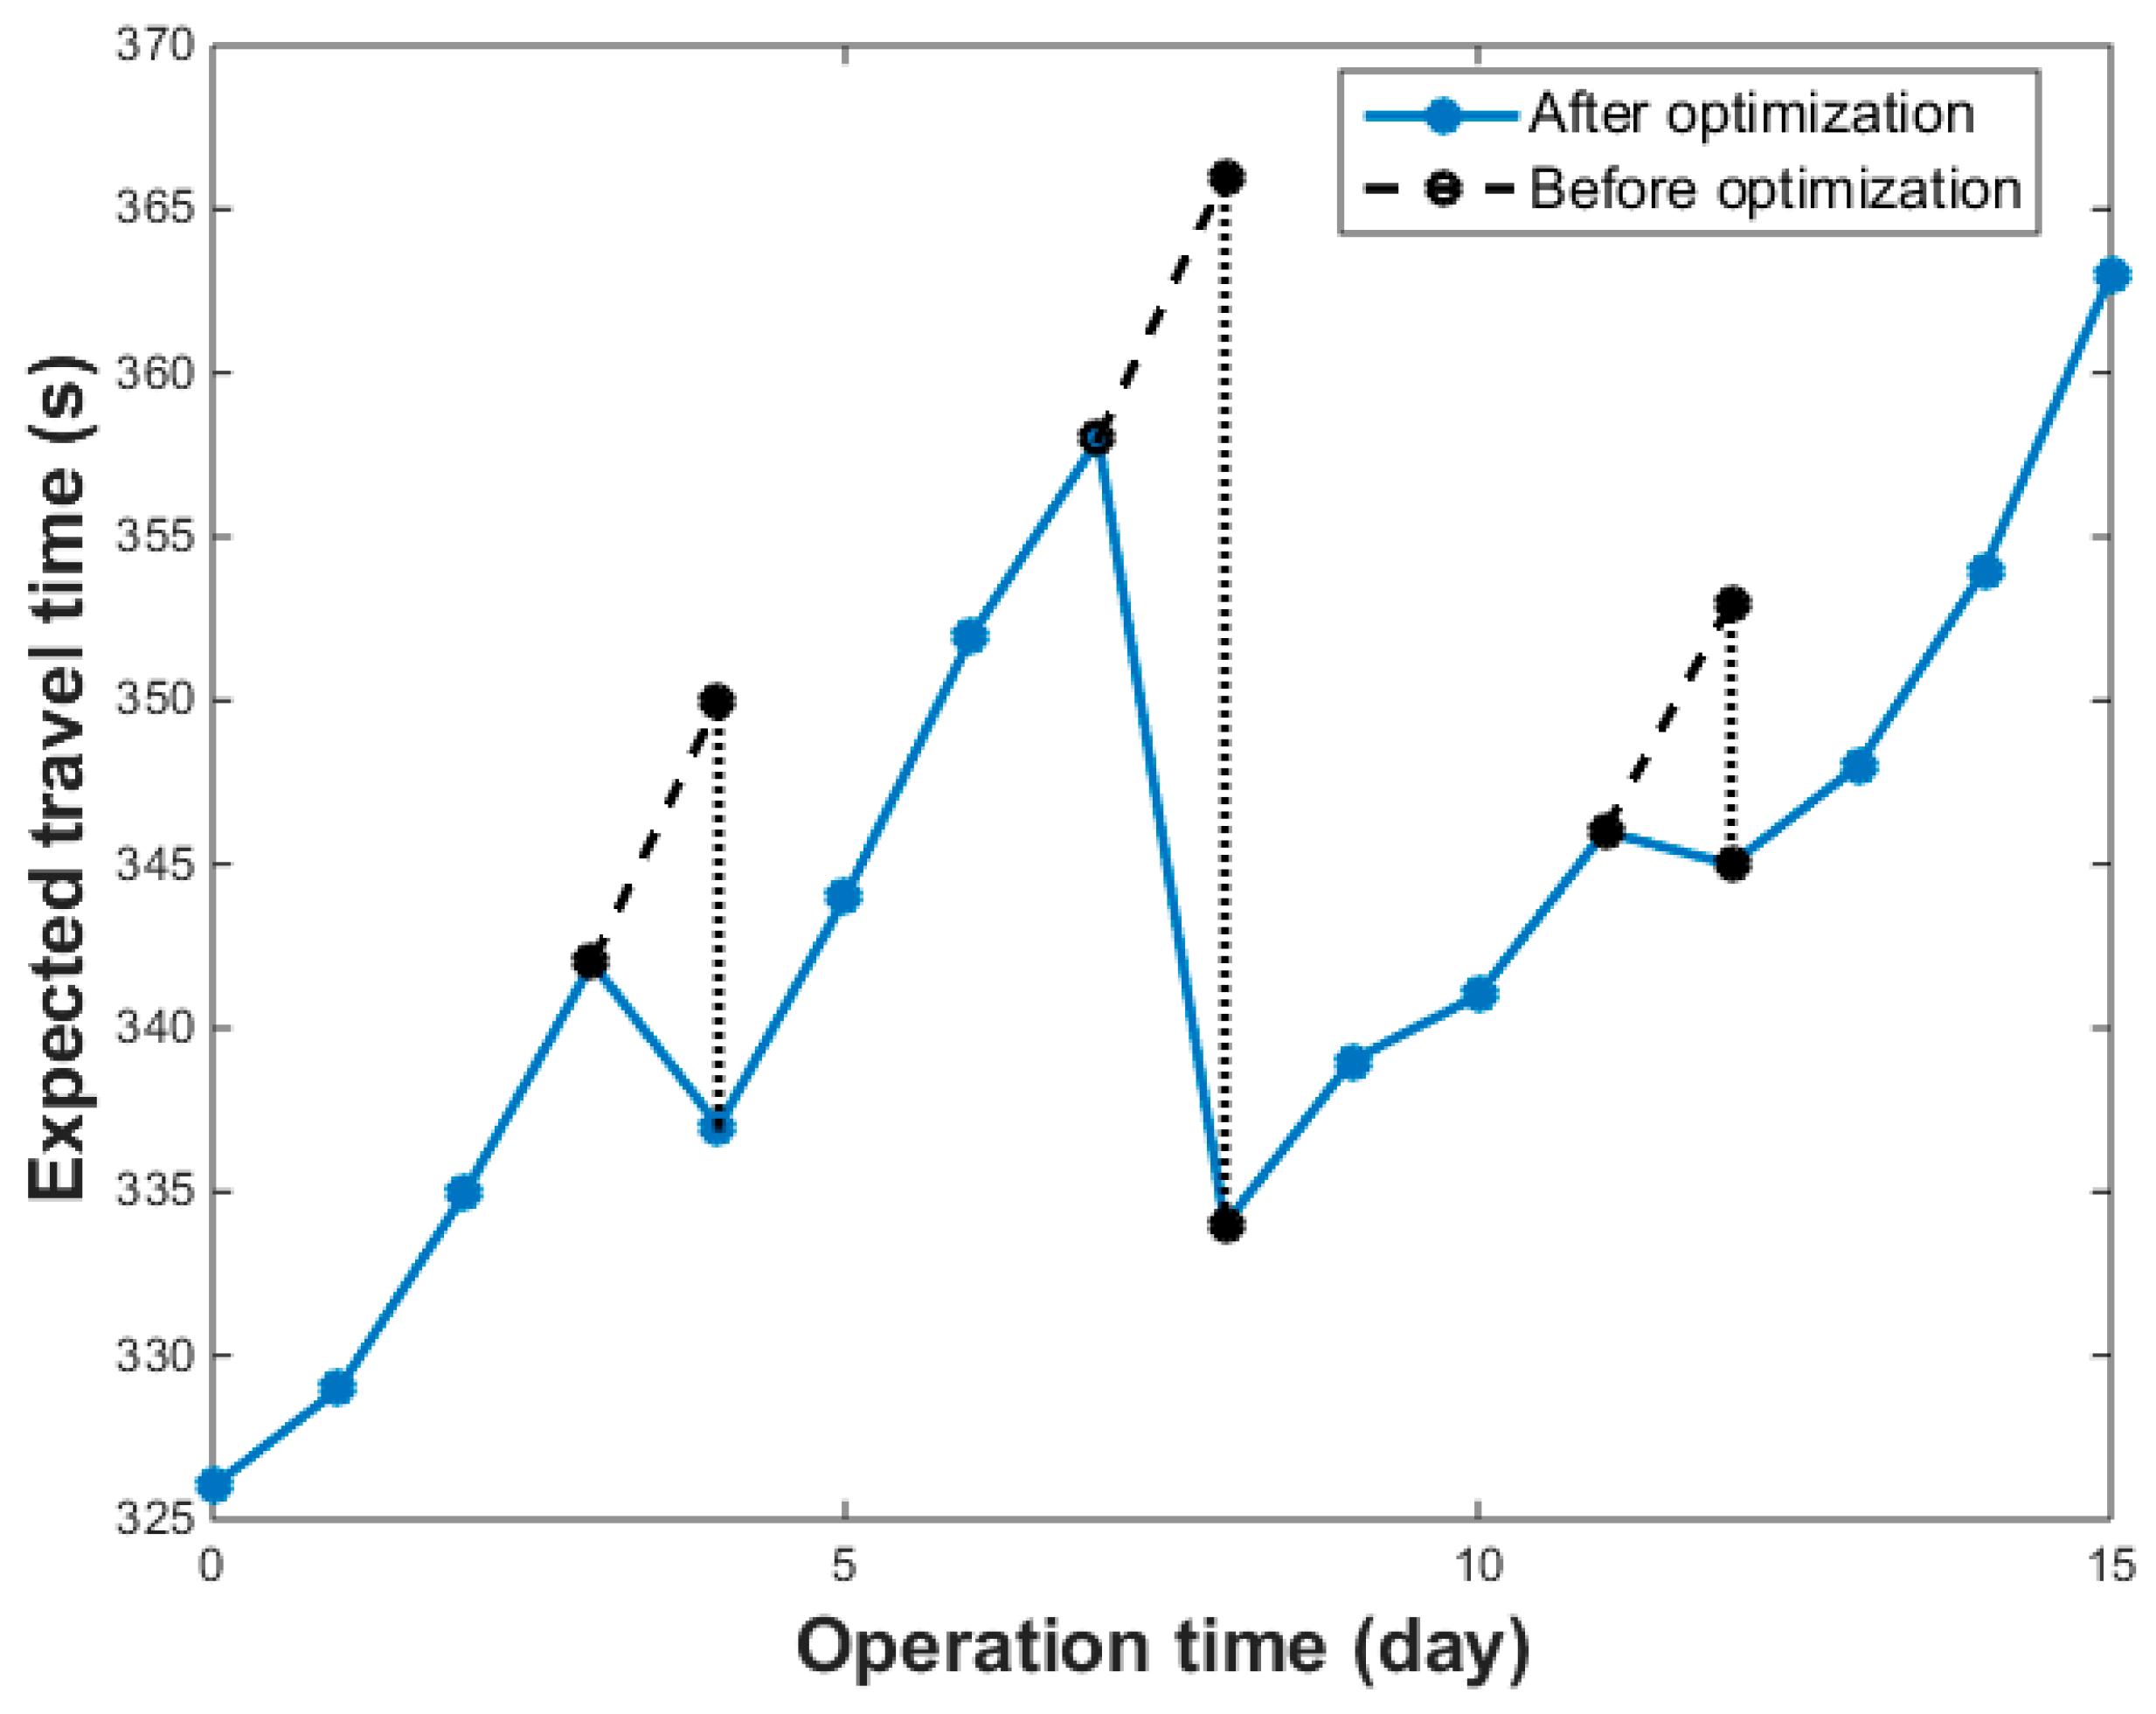
Figure 18 shows the variation of the expected DSSC during rush hours over operation time after maintenance schedule optimization, which is evaluated with expected travel time of passengers. In the beginning, the reliability of gates and escalators is 1, and the expected travel time is 326 s. As operation time goes by, the reliability of key equipment decreases and the expected travel time increases. After the maintenance for software system of gates on the third day, the reliability of gates is restored to 0.9, and the expected travel time reduces to 337 s. The expected travel time increases again with operation time. After the maintenance for gates and electrical system of escalators on the seventh day, the reliability of gates and escalators is restored to 1 and 0.95, respectively, and the expected travel time decreases again. After the maintenance for software system of the gates on the eleventh day, the expected travel time remains almost unchanged. Finally, the expected DSSC is restored to the initial level after equipment maintenance every half a month. Before the maintenance schedule optimization, the failure probability of key equipment increases and the expected DSSC declines without timely maintenance. From the above analysis, the reliability of key equipment is maintained with the optimal maintenance schedules and the station capacity is remained in a certain level by maintaining the reliability of key equipment.
7. Conclusions
In this paper, the dynamical subway station capacity (DSSC) is defined according to the gathering and scattering process of the subway station and the travel time of passengers is taken as the DSSC indicator. In consideration of key equipment failure, the expected DSSC model is established based on the idea of binomial distribution and mathematical expectation. After that, the lower bound of equipment reliability is determined by sensitivity analysis based on the equipment reliability-expected station capacity curve. Finally, the maintenance schedule optimization model is established to maintain DSSC with the lowest cost under the constraint of equipment reliability, and a solution to the maintenance optimization model is also proposed. The simulation results demonstrate that the station capacity can be maintained in a level range by using the proposed method of maintenance schedule optimization. This provides a useful alternative for subway operation companies. This is the first contribution which aims at maintaining the station capacity while considering key equipment failure by optimizing the maintenance schedule of the key equipment.
There are still some technical issues need to be considered. For example, a more general expected capacity calculation framework may be considered, in which passenger route assignment aims to achieve the maximum capacity of the subway station subject to equipment failure. In addition, the age regression factor may be considered in maintenance schedule optimization, since not all equipment can be restored to a completely new state after maintenance. These areas will be our work in the future.


