Optical Conveyor Belts for Chiral Discrimination: Influence of De-Phasing Parameter


Abstract
:Featured Application
Abstract

1. Introduction
2. Results
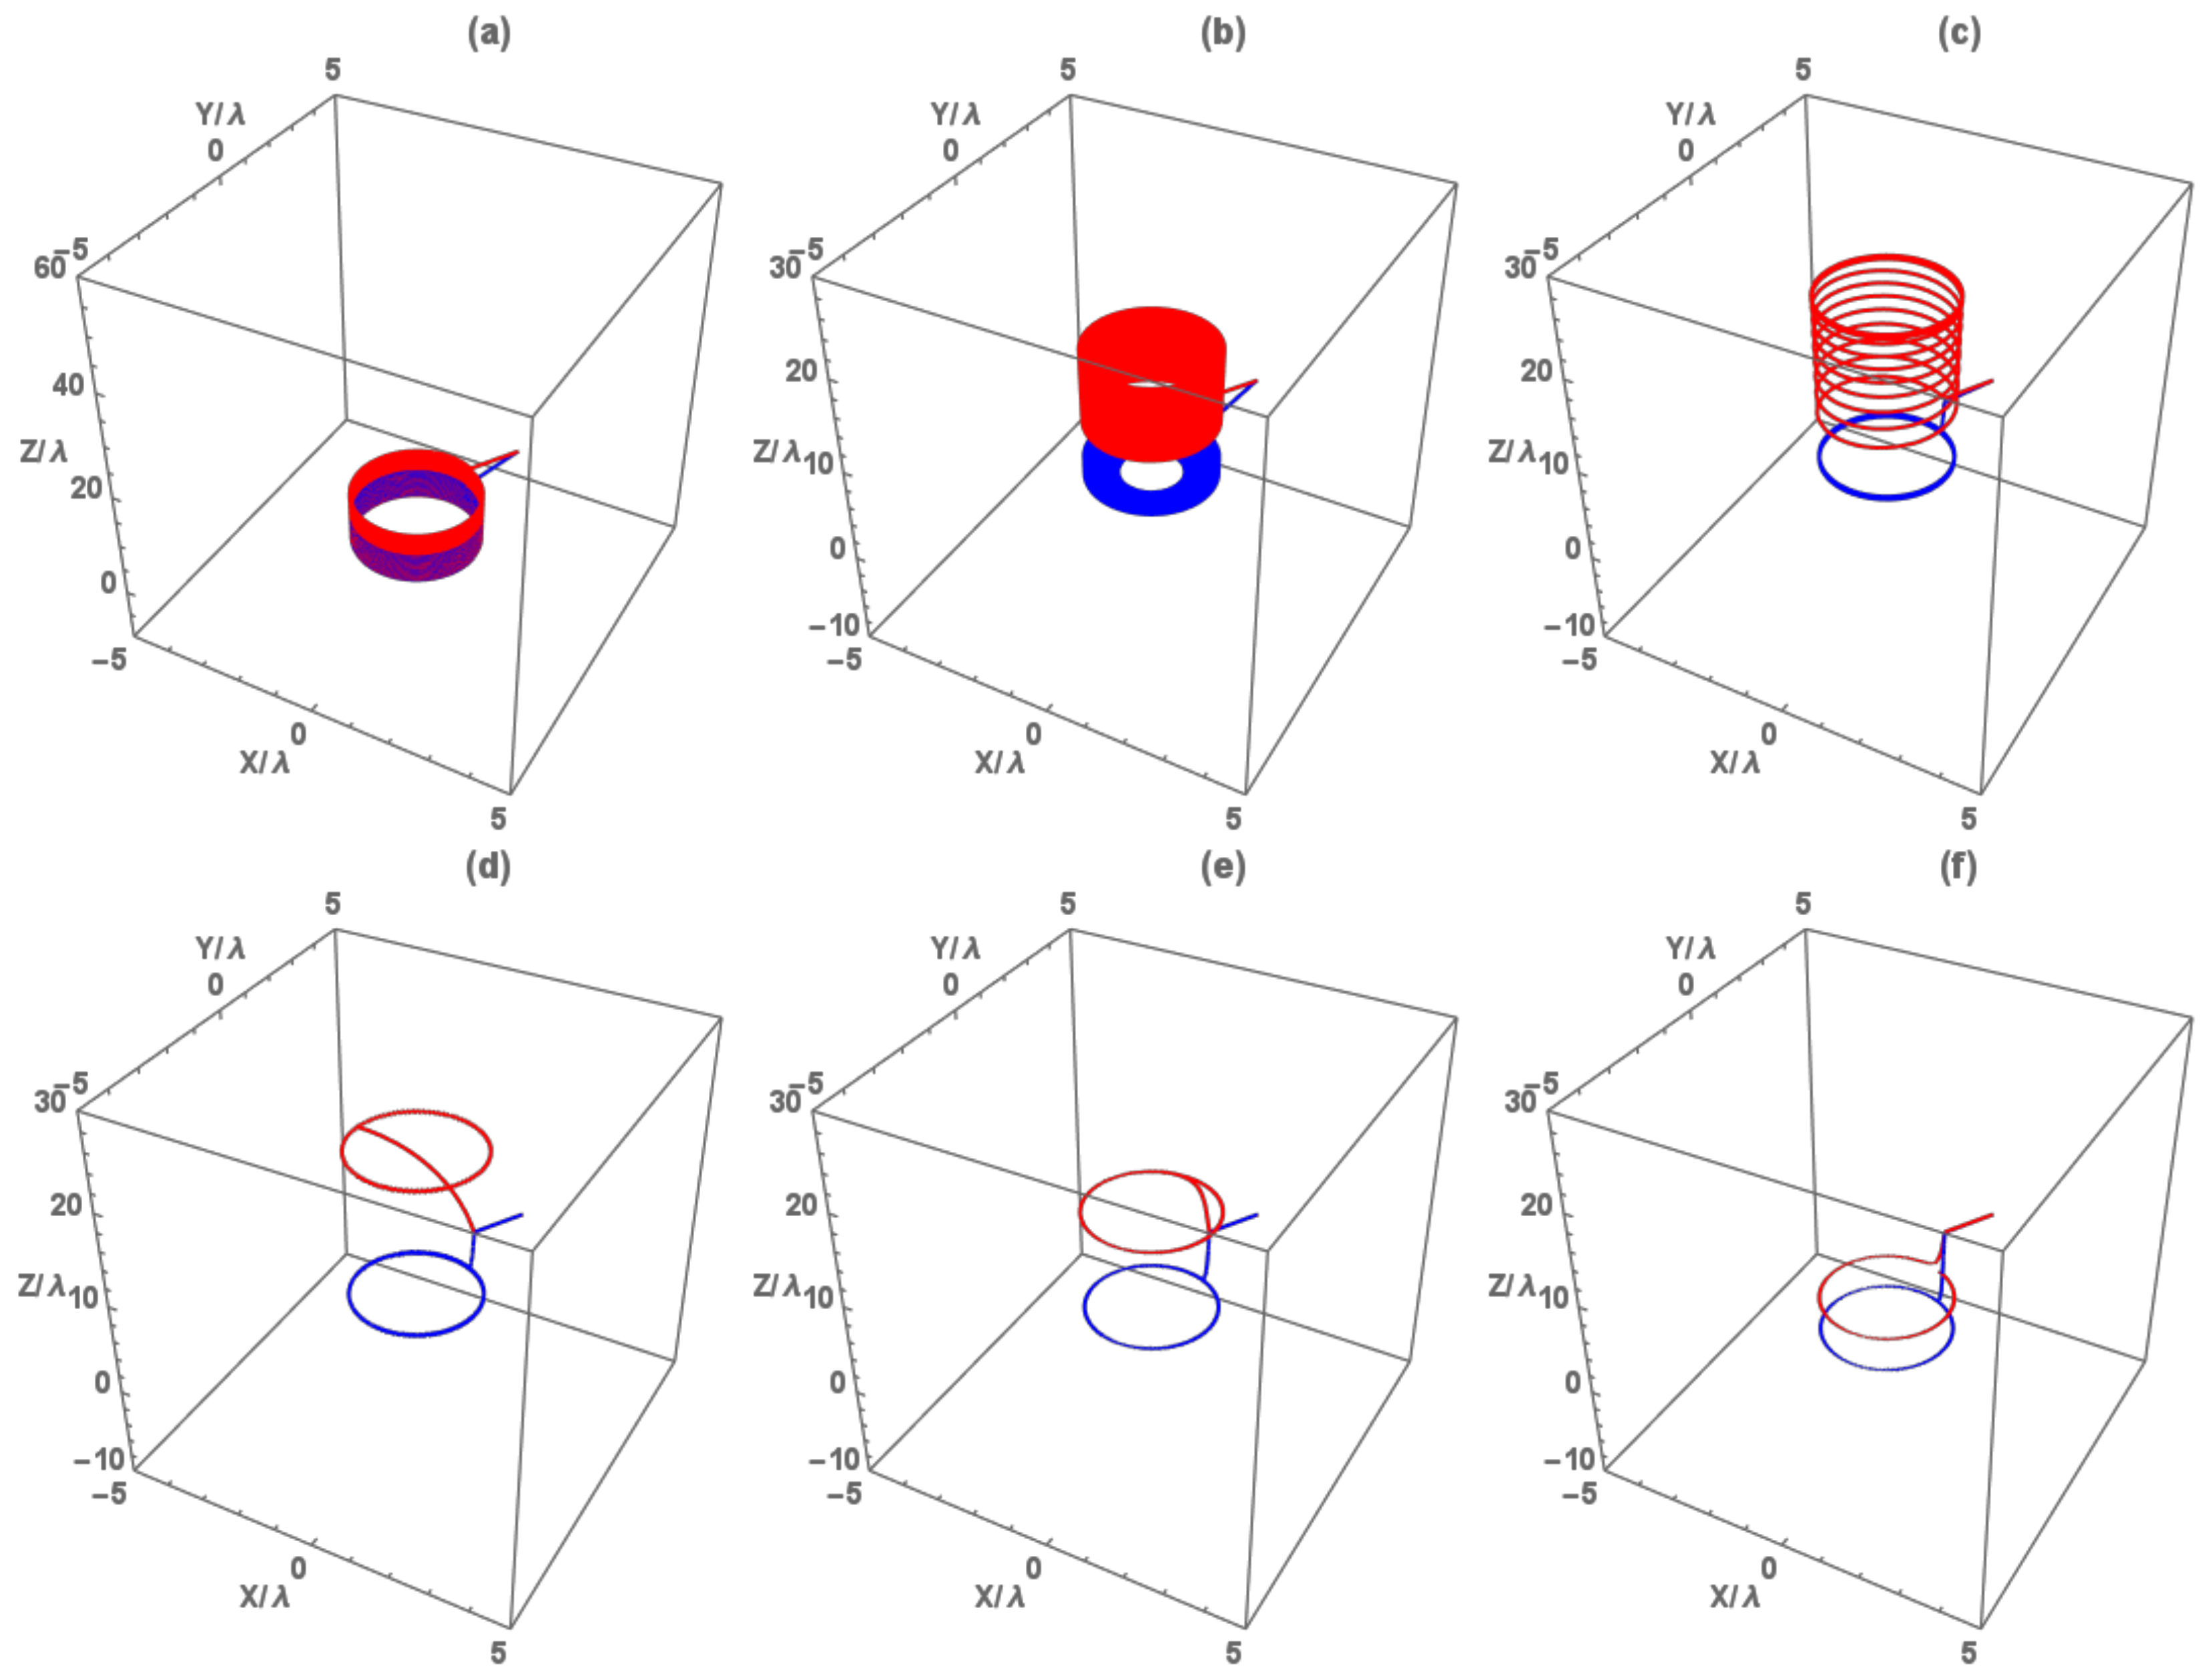
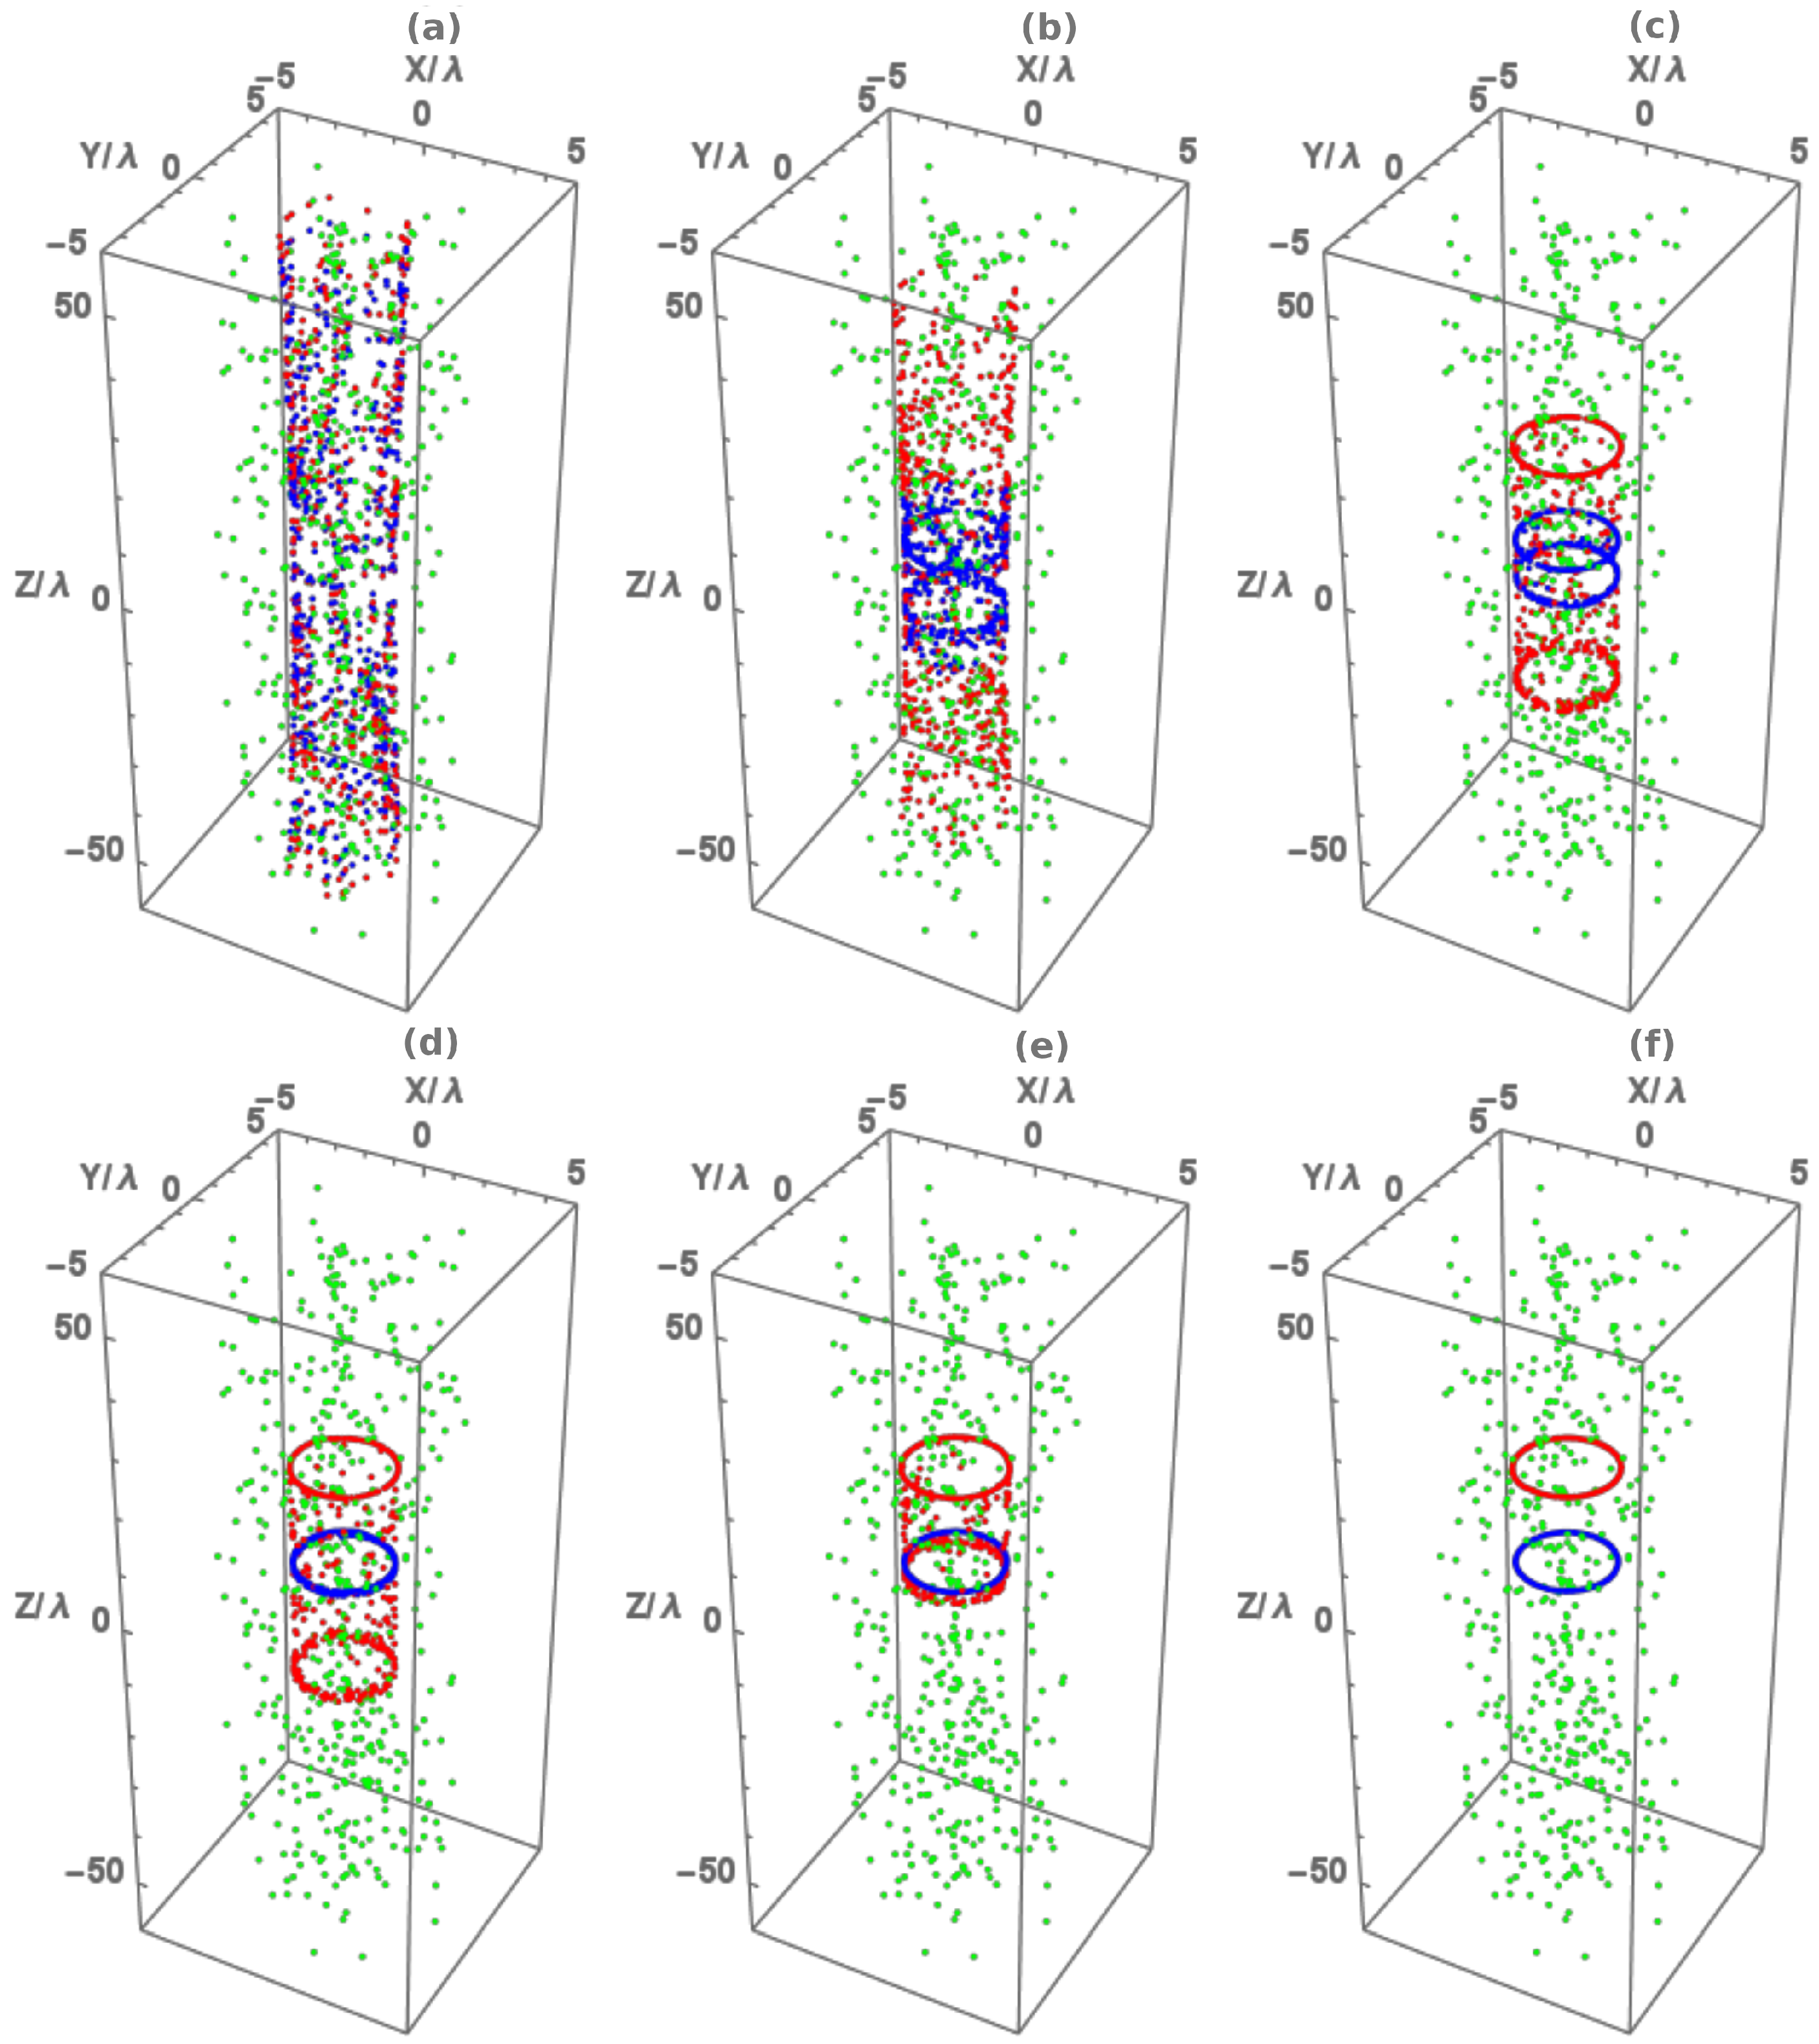
2.1. Optical Forces
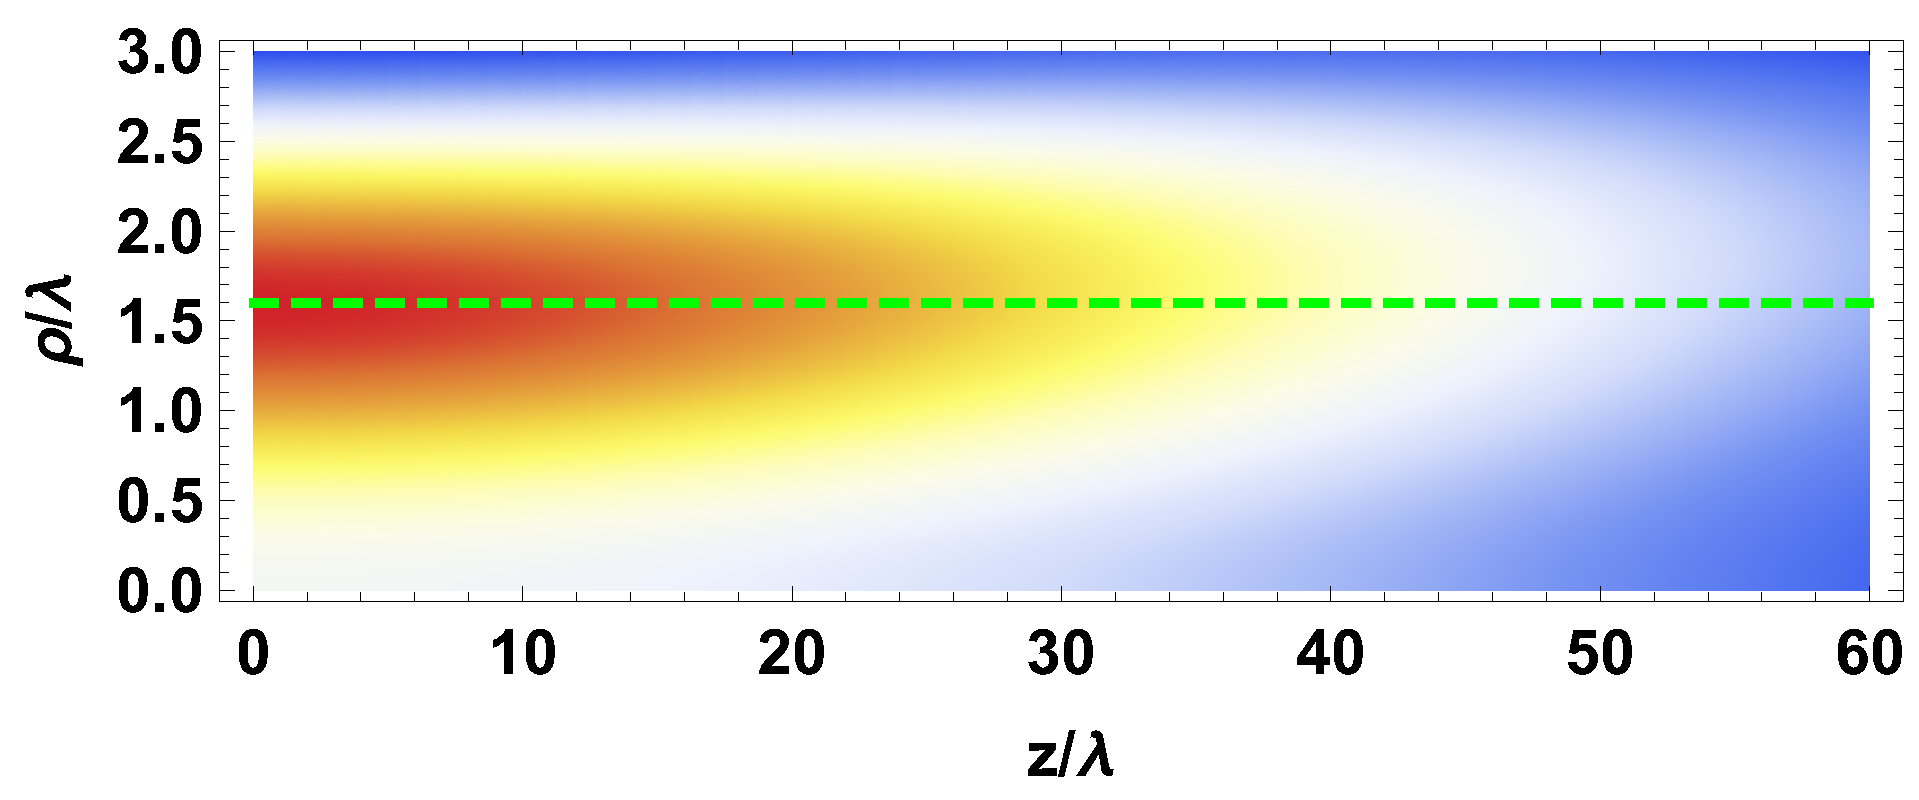
2.2. Electromagnetic Field
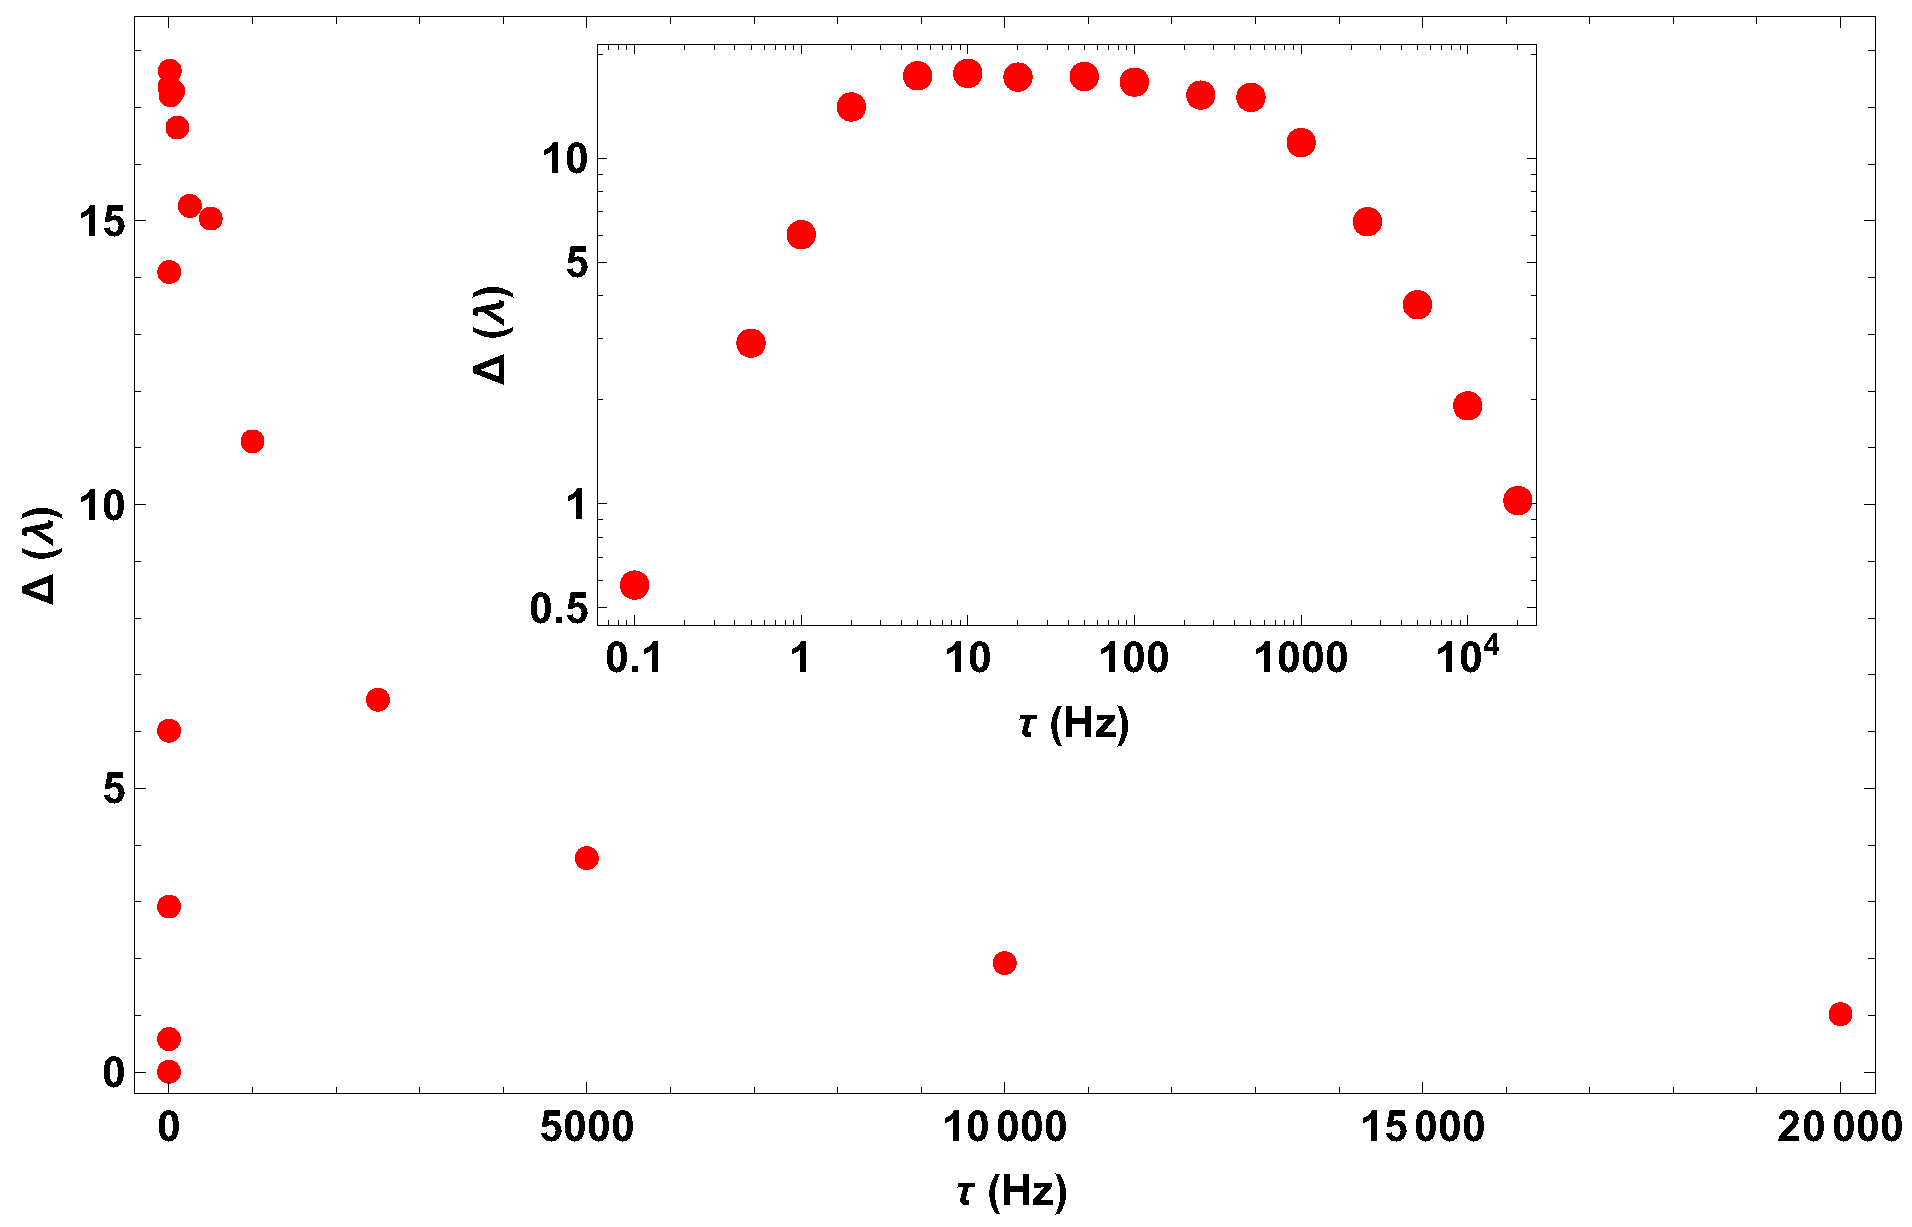
3. Discussion
4. Conclusions
Author Contributions
Funding
Conflicts of Interest
References
- Gubitz, G.; Schmidt, M.G. (Eds.) Chiral Separations. Methods and Protocols; Humana Press: New York, NY, USA, 2004. [Google Scholar]
- Canaguier-Durand, A.; Hutchison, J.A.; Genet, C.; Ebbesen, T.W. Mechanical separation of chiral dipoles by chiral light. New J. Phys. 2013, 15, 123037. [Google Scholar]
- Hayat, A.; Mueller, J.P.B.; Capasso, F. Lateral chirality-sorting optical forces. Proc. Natl. Acad. Sci. USA 2015, 112, 13190–13194. [Google Scholar] [CrossRef] [PubMed]
- Cameron, R.P.; Barnett, S.M.; Yao, A.M. Discriminatory optical force for chiral molecules. New J. Phys. 2014, 16, 013020. [Google Scholar] [CrossRef]
- Bradshaw, D.S.; Forbes, K.A.; Leeder, J.M.; Andrews, D.L. Chirality in Optical Trapping and Optical Binding. Photonics 2015, 2, 483–497. [Google Scholar] [CrossRef]
- Chen, H.; Liang, C.; Liu, S.; Lin, Z. Chirality sorting using two-wave-interference induced lateral optical force. Phys. Rev. A 2016, 93, 053833. [Google Scholar] [CrossRef]
- Chen, H.; Jiang, Y.; Wang, N.; Lu, W.; Liu, S.; Lin, Z. Lateral optical force on paired chiral nanoparticles in linearly polarized plane waves. Opt. Lett. 2015, 40, 5530–5533. [Google Scholar] [CrossRef]
- Tkachenko, G.; Brasselet, E. Optofluidic sorting of material chirality by chiral light. Nat. Commun. 2014, 5, 3577. [Google Scholar] [CrossRef] [PubMed]
- Cizmar, T.; Garces-Chavez, V.; Dholakia, K.; Zemanek, P. Optical conveyor belt for delivery submicron objects. Appl. Phys. Lett. 2005, 86, 174101. [Google Scholar] [CrossRef]
- Ruffner, D.B.; Grier, D.G. Optical conveyors: A class of active tractor beams. Phys. Rev. Lett. 2012, 109, 163903. [Google Scholar] [CrossRef] [PubMed]
- Fernandes, D.E.; Silveirinha, M.G. Optical tractor beam with chiral light. Phys. Rev. A 2015, 91, 061801. [Google Scholar] [CrossRef]
- Fernandes, D.E.; Silveirinha, M.G. Single-Beam Optical Conveyor Belt for Chiral Particles. Phys. Rev. Appl. 2016, 6, 014016. [Google Scholar] [CrossRef]
- Carretero, L.; Acebal, P.; Blaya, S. Chiral Rayleigh particles discrimination in dynamic dual optical traps. J. Quant. Spectrosc. Radiat. Transf. 2017, 201, 209–215. [Google Scholar] [CrossRef]
- Acebal, P.; Carretero, L.; Blaya, S. Design of an optical conveyor for selective separation of a mixture of enantiomers. Opt. Express 2017, 25, 32290–32304. [Google Scholar] [CrossRef]
- Reif, F. Fundamentals of Statistical and Thermal Physics; McGraw-Hill Book Company: Nong Grove, IL, USA, 1965. [Google Scholar]
- Lakhtakia, A.; Varadan, V.K.; Varadan, V.V. Effective properties of a sparse random distribution of non-interacting small chiral spheres in a chiral host medium. J. Phys. D Appl. Phys. 1991, 24, 1. [Google Scholar] [CrossRef]
- Zhao, Y.; Saleh, A.A.E.; Dionne, J.A. Enantioselective Optical Trapping of Chiral Nanoparticles with Plasmonic Tweezers. ACS Photonics 2016, 3, 304–309. [Google Scholar] [CrossRef]
- Saleh, B.E.A.; Teich, M.C. Fundamentals of Photonics; Wiley: Hoboken, NJ, USA, 1991. [Google Scholar]
- Carretero, L.; Acebal, P.; Garcia, C.; Blaya, S. Helical tractor beam: analytical solution of Rayleigh particle dynamics. Opt. Express 2015, 23, 20529–20539. [Google Scholar] [CrossRef] [PubMed]

© 2019 by the authors. Licensee MDPI, Basel, Switzerland. This article is an open access article distributed under the terms and conditions of the Creative Commons Attribution (CC BY) license (http://creativecommons.org/licenses/by/4.0/).
Share and Cite
Carretero, L.; Acebal, P.; Blaya, S. Optical Conveyor Belts for Chiral Discrimination: Influence of De-Phasing Parameter. Appl. Sci. 2019, 9, 1304. https://doi.org/10.3390/app9071304
Carretero L, Acebal P, Blaya S. Optical Conveyor Belts for Chiral Discrimination: Influence of De-Phasing Parameter. Applied Sciences. 2019; 9(7):1304. https://doi.org/10.3390/app9071304
Chicago/Turabian StyleCarretero, Luis, Pablo Acebal, and Salvador Blaya. 2019. "Optical Conveyor Belts for Chiral Discrimination: Influence of De-Phasing Parameter" Applied Sciences 9, no. 7: 1304. https://doi.org/10.3390/app9071304
APA StyleCarretero, L., Acebal, P., & Blaya, S. (2019). Optical Conveyor Belts for Chiral Discrimination: Influence of De-Phasing Parameter. Applied Sciences, 9(7), 1304. https://doi.org/10.3390/app9071304