Article

Numerical Analysis of a Catenary Mooring System Attached by Clump Masses for Improving the Wave-Resistance Ability of a Spar Buoy-Type Floating Offshore Wind Turbine

1
School of Civil Engineering and Mechanics, Huazhong University of Science and Technology, Wuhan 430074, China
2
Tokyo Institute of Technology, Department of Architecture and Building Engineering, Yokohama, Kanagawa 1528550, Japan
3
Department of Civil Engineering, School of Engineering, The University of Tokyo, 7-3-1, Hongo, Bunkyo-ku, Tokyo 1138656, Japan
*
Author to whom correspondence should be addressed.
Appl. Sci. 2019, 9(6), 1075; https://doi.org/10.3390/app9061075
Submission received: 25 January 2019 / Revised: 27 February 2019 / Accepted: 10 March 2019 / Published: 14 March 2019
(This article belongs to the Special Issue Offshore Wind Energy)

Abstract

:
The International Energy Agency (IEA), under the auspices of their Offshore Code Comparison Collaboration (OC3) initiative, has completed high-level design OC-3 Hywind system. In this system the wind turbine is supported by a spar buoy platform, showing good wave-resistance performance. However, there are still large values in the motion of surge degree of freedom (DOF). Addition of clump masses on the mooring lines is an effective way of reducing the surge motion. However, the optimization of the locations where the clump masses are added is still not clear. In this study, therefore, an in-house developed code is verified by comparing the results of the original OC3 model with those by FAST. The improvement of the performance of this modified platform as a function of the location of the clump masses has been examined under three regular waves and three irregular waves. In the findings of these examination, it was apparent that attaching clump masses with only one-tenth of the mass of the total mooring-line effectively reduces the wave-induced response. Moreover, there is an obvious improvement as the depth of the location where the clump masses mounted is increased.

Graphical Abstract

1. Introduction

Traditional energy sources such as oil and coal are not renewable, thus cause environmental pollution. Meanwhile, wind power is a clean and renewable source of energy. In recent decades, this type of energy has developed rapidly. It is estimated that by 2030, wind energy will provide about 20% of the world’s electricity demand. In particular, wind power is mainly concentrated on land, and onshore wind turbines are relatively mature. To obtain wind power with higher density, offshore wind power has become a major focus of the world’s research, especially in the field of wind energy. Compared with onshore wind, offshore wind has high wind speeds, low wind shear, low turbulence, and other significant advantages. Also, the cost involved in tapping this energy is relatively higher; the trends of wind farm construction—from land to sea, from shallow sea to deep sea, and from fixed foundation to floating platform—are obviously due to the higher wind energy output. There are many kinds of floating wind turbine foundation platforms. They include spar [1,2,3,4,5,6,7], Tension Leg Platform (TLP) [8,9], Semi-Submersible Platform [10,11,12,13,14,15], and so on. Among them, the spar platform has the advantages of a low center of gravity, high flexibility, and low cost. Still, there are some problems in the practical application. That is, the spar must withstand the wave and wind loads experienced during extreme storm conditions. In addition, the expected higher costs of construction and maintenance must be addressed [16]. A lot of research has been done to reduce the motions of the spar type platform [16,17,18,19,20,21,22,23], among which the study by Jonkman and Musial [24] applied several codes for the calculation of the motion of the OC3 Hywind spar platform, such as NREL FAST, ADAMS, HAWC2, etc. Most of the approaches seek to modify the platform structure [25,26,27,28]. For instance, Wang et al. [29] modified the spar-type platform by adding a heave plate. Their results showed that, compared with the original OC3-Hywind spar platform, the heave plate can effectively suppress the heave response of the spar platform. They also found that the viscous damping contributed by the heave plate is a major component of the total damping. Meanwhile, Chen et al. [30] presented a spar-type substructure integrated with the heave plates moored by the optimized mooring system. The dynamic response of the platform under different load conditions were performed using AQWA. The results indicated that both the dynamic response and the mooring tension are significantly improved relative to that of the original OC3 spar. At the same time, Hyunkyoung Shin et al. [31] presented a modified spar-type platform consisting of a main cylinder and four wider cylinders and with the mass, displacement, and pitch inertia similar to those of the OC3 Hywind with reasonable differences. The numerical results indicated that the motions of the modified spar-type floating offshore wind turbine (FOWT) in all of the modes were smaller than those of the OC3 Hywind FOWT, except in heave mode over 0.3 rad/s. Zheng et al. [32] suggested a state-of-the-art concept integrating a deep-water floating offshore wind turbine with a steel fish-farming cage (FOWT-SFFC). Aero-hydro-servo-elastic modeling and time domain simulations were carried out by FAST to examine the dynamic response of FOWT-SFFC for several environmental conditions. The results confirmed that hydrodynamic performance of FOWT-SFFC is much better than OC3-Hywind spar. Yu et al. [33] further proposed a cell spar platform based on the concept of OC3-Hywind spar platform and calculated the dynamic response under wind-wave loads by AQWA. On the basis of the cell spar platform, a floating wind turbine with additional heave plate was built to study the influence. The results indicated that the cell spar platform has better motion performance than the original OC3-Hywind spar platform. Meanwhile, Li et al. [34] presented a new design of a floating platform for wind turbines. They combined the characteristics of semi-submersible and spar, and conducted the numerical hydrodynamic simulation by FAST. The results showed that the new model makes an effective reduction of the motions compared with the OC3 spar. However, the modifications in the above research works to the original OC3-Hywind spar platform are still relatively large. Thus, they will increase the difficulty of the floating platform construction as well as the costs of construction and maintenance.
Adding clump masses on the mooring line is an effective way to improve the wave resistance ability of a spar buoy-type floating offshore wind turbine. Yuan et al. [35] proposed a hybrid mooring system with several clump weights and buoys, in which the Morison’s Equation was applied to calculate the hydrodynamic loads. In addition, the optimization of the position and volume of the buoys was carried out based on the examination of the tension of mooring line. Tore [36] studied the effects from the size of the clump weight and the position of the clump weight, in which the generalized Morison’s equation is used. Furthermore, the size and position of the clump masses have been optimized by examining the tension of the mooring line.
In order to model the interaction between the waves and the structures in a more accurate way, potential flow theory is adopted in the present research. The fatigue loads of the mooring line are also examined. The optimization of the location of the clump mass is based on the examination of the motion of the floating platform. A detailed comparison between the present research and that by Yuan et al. [35] and Tore [36] is given in Table 1.
In this paper, the structure of the OC3-Hywind spar platform remains unchanged. Only several clump masses are added at the mooring system. Each clump mass’s weight is only one-tenth that of the attached mooring line. This is not likely to increase the difficulty of the platform construction very much. Furthermore, the position of the clump masses is varied and the response of the models at three regular waves and three irregular waves is calculated through the in-house code. Section 2 will introduce the numerical theories adopted in our in-house code. After that, Section 3 will present the configurations of OC3 models with clump masses (OC3CM) and the load cases. Then, Section 4 will discuss the wind‒wave-induced motion and the stability of the proposed OC3CM model and compare it with the original OC3-Hywind spar. Finally, Section 5 will present the conclusions and future work.

2. Numerical Theories

The main difference between a floating wind turbine and an onshore wind turbine is that a floating wind turbine is subjected to the forces transmitted by the wave load and the mooring system. The aerodynamics section [37] is relatively mature, so it is described briefly. The theory calculating the hydrodynamics loads [38,39,40] and the theory of calculating mooring forces [40,41] applied in our code are described in detail in the following sub-sections.

2.1. Blade Element Momentum Theory

The aerodynamic load acting on the blade is usually solved using the blade element momentum theory. The axial thrust of the leaf at radius r is expressed as:
dT = 0.5 ρ B C n V 1 2 ( 1 a ) 2 c d r s i n 2 φ .
The torque is:
dM = 0.5 ρ B C t V 1 ( 1 a ) ω r ( 1 + a ) c r d r s i n φ c o s φ ,
where ρ is the air density, B is the number of the blades, V 1 is the wind speed, c is the leaf chord length, and φ is the relative flow incidence angle, which is the sum of the blade pitch angle and the angle of attack. C n is the coefficients for the normal force; C t is the coefficients for the thrust force.
C n = C l c o s φ + C d s i n φ ,
C t = C l s i n φ C d c o s φ ,
where C l is the lift coefficient of the airfoil, C d is the drag coefficient of the airfoil, a is the axial induction factor, and a is the tangential induction factor. The axial induction factor a and the tangential induction factor a can be calculated as follows:
a = B c ( C l c o s φ + C d s i n φ ) 8 π r s i n 2 φ + B c ( C l c o s φ + C d s i n φ ) ,
a = B c ( C l s i n φ C d c o s φ ) 8 π r s i n φ c o s φ B c ( C l s i n φ C d c o s φ ) .

2.2. Quasi-Static and Multi-Segment Theory

Quasi-static theory [40,41] is used to calculate the tension of mooring lines. For a single line between two fixed points, when no portion of the line rests on the seabed, the analytical equation is as follows:
x F ( F H , F V ) = F H ω { { l n [ F V F H + 1 + ( F V F H ) 2 ] l n [ F V ω L F H + 1 + ( F V ω L F H ) 2 ] } + F H L E A ,
z F ( F H , F V ) = F H ω [ 1 + ( F V F H ) 2 1 + ( F V ω L F H ) 2 ] + 1 E A ( F V L ω L 2 2 ) ,
where EA is the cross section axial stiffness, ω = gA ( ρ c ρ ) is the weight per unit length in the submerged fluid, ρ c is the cable density, ρ is the fluid density, and g is the acceleration due to gravity; F H   and   F V are the applied horizontal and vertical force at the fairlead, respectively; L is the upstretched line length; x F and z F are the cable profile in the horizontal and vertical planes at distance s along the line, respectively.
By using the multi-segmented theory, a mooring line can be divided into two segments. The first segment is from the vessel node to the location of clump masses, while the second segment is from the location of clump masses to the fixed node. Each of the segments is analyzed by the quasi-static theory and solved using the Newton‒Raphson method iteratively.

2.3. Potential Flow Theory

The research by Jonkman [38,42] suggested two theories for calculating the hydrodynamic loads. One is the Morison’s equation and the other is the potential flow theory. Morison’s equation is applicable for calculating the hydrodynamic loads on slender cylindrical structures when the effects of diffraction and radiation damping are negligible. In order to model the interaction between the waves and the structures in a more accurate way, the potential flow theory should be adopted, which is capable of considering the forces induced by both the diffraction and the radiation. Therefore, in the present study the potential flow theory is applied. By defining a potential function ϕ ( x ,   y ) , the governing equation for ϕ is:
2 ϕ = 0 ,
where ϕ / x = u , ϕ / y = v , and ϕ / z = w . u, v, and w are the velocity components of the flow fields in the Cartesian coordinates. After determining the boundary conditions at the free surface, the surface of the structures, and the sea bed, the potential function can be solved and the velocity distribution can be obtained. A more detailed introduction to the potential flow theory can be found in the study by Batchelor [43]. Then the forces acting on the floating structures can be determined as:
F W A P = F W + F H S + F R D + F A M ,
F A M = A M R P a p ,
F W = 1 N k = N 2 1 N 2 W [ k ] 2 π Δ t S ζ 2 s i d e d ( ω ) X ( ω , β ) | ω = k Δ ω e j 2 π k n N ,
F H S = ρ g V 0 δ 3 C H y d r o s t a s t i c x ,
F R D = 0 t K 1 ( t τ ) x ˙ ( τ ) d τ ,
where F W A P is the total loads at the reference point; F W is the incident-wave excitation force at reference point; F H S is the hydrostatic forces at the reference node; F R D is the radiation memory-effect force at the reference point; F A M is the total added mass forces from all contributions; A M R P is the added mass due to radiation at the reference point; a p is the linear acceleration of the structure; W [ k ] is Fourier transform of a white noise time series with unit variance; S ζ 2 s i d e d ( ω ) is the wave spectrum (P‒M spectrum in this paper); X ( ω , β ) is the wave-induced force array normalized per unit wave amplitude; ω is the frequency; β is the incident wave direction angle; ρ g V 0 δ 3 is the buoyancy and equals to the platform weight; V 0 is the volume of the immersed part of the platform; δ 3 is the component of the Kronecker‒Delta function; C H y d r o s t a s t i c is the hydrostatic-restoring matrix; x is the platform motions; t is time; K 1 is the radiation kernel from potential flow theory; and x ˙ ( τ ) is the platform velocity. In the in-house code, the code will use the given wave parameters and the selected wave numerical theory to perform wave kinematics calculations at the first step; secondly, the total added mass forces F A M and the hydrostatic forces F H S can be calculated by the initial motion state of the platform and the given related matrix; the incident-wave excitation force F W can be calculated by the P-M wave spectrum and the radiation memory-effect force F R D will be obtained by the platform initial velocity. Finally, substitute the forces at this moment into the equations of motion, and the motion of the platform will be obtained, and then substituting the obtained motion into the above formula. Continuously iterating like this, the total wave loads calculated by the potential flow theory can be obtained.

2.4. Equations of Motion

To calculate the dynamic response of floating platform in the time domain, the platform can be considered as a rigid body. The equations of motion [44] is expressed as follows:
( M + A ) X ¨ ( t ) + C X ˙ ( t ) + K X ( t ) = F W A P + F W i n d + F L i n e ,
where M is the mass matrix; A is the added mass matrix; C is the damping coefficient matrix; K is the hydrostatic restoring force matrix; F W i n d is the wind loads applied to the blades and tower; and F L i n e is the mooring tension. In the in-house code, the mooring tension F L i n e , the wind loads F W i n d and the total wave loads can be calculated using the given parameters as well as the initial motions of the platform. By substituting the force at this moment into the equation of motion, the motion state of the platform can be obtained. At the same time, the force at the next moment can be calculated by the obtained motions of the platform. Similar to the above, the motions of the platform can be obtained by continuously iterating like this. In addition, the rotor dynamics include the aerodynamic loads acting on the blades, the gravity loads, the inertial loads, and the counter-dynamic forces from the shaft. The nacelle dynamics have the forces from the impeller, the cladding load, the aerodynamic loads and the gravity loads. The tower dynamics includes aerodynamic loads, the forces from tower and nacelle, as well as the gravity loads. Simple schematics of each module in the in-house codes are shown in Figure 1.

3. Configurations of OC3CM Model
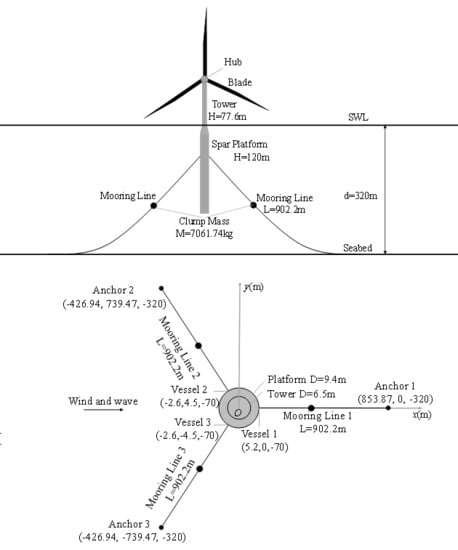
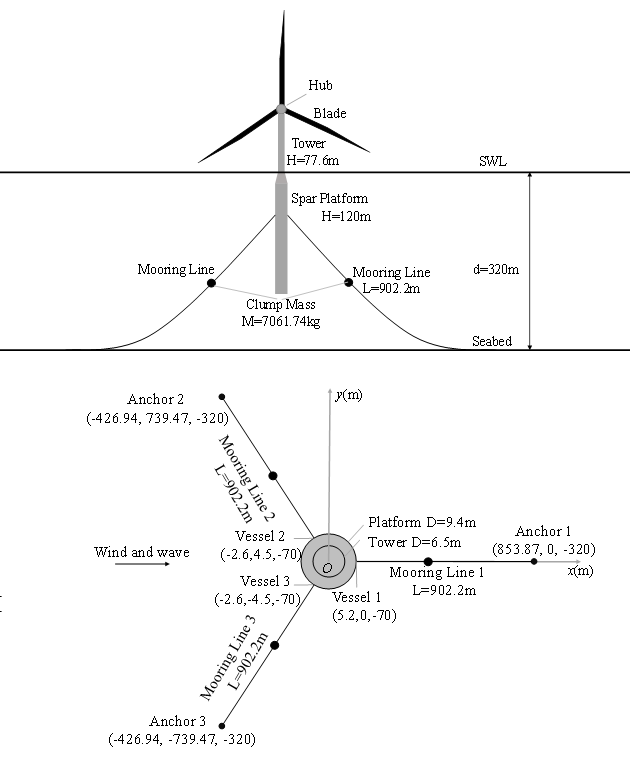
The configuration of the OC3CM model is shown in Figure 2. Figure 2a displays the front view of the OC3CM model, while Figure 2b illustrates the arrangement of the mooring system. The mooring line and locations of the clump masses will be described in detail in the following discussion.
Several specifications of the platform with reference to the inertial frame and the degrees of freedom (DOFs) are introduced here; x, y, and z represent the orthogonal axes of its reference frame. The xy plane designates the still water level, while the z axis directs upward along the centerline of the platform. The rigid body platform has six DOFs: surge, heave, sway, pitch, yaw, and roll. The following sections only examine three important displacements, surge, heave, and pitch. Table 2 shows the main parameters of the platform and the wind turbine.

3.1. OC3CM Models

The innovation of this paper is attaching clump masses on the mooring lines to reduce the response of the platform. After numerous experiments and analysis of the OC3CM models with clump masses of different weights and different locations, the influences of these differences on the platform response were found. The weight of the clump mass was set to be 7061.74 kg (one-tenth as heavy as the mooring line), 10,087.14 kg (one-seventh as heavy as the mooring line), 14,123.48 kg (one-fifth as heavy as the mooring line). It was found that the response of the platform is highly sensitive to the location of the clump masses, and the increase in the weight of clump masses can only reduce the motion of the platform in a very limited range. Based on the above trials, the weight of the clump masses is set to 7061.74 kg. Except for the additional clump masses, the other part of the structure remains the same as in the original OC3 model. In the present research, five different locations are examined. The properties of the mooring system are shown in Table 3, where P0 is the original model; LM is the distance from connecting locations to the anchor, that is also called fixed node. In addition, L is the length of mooring line, equaling 902.2 m; mCM is the weight of the clump masses, which is one-tenth the mass of the mooring line, equaling 70,109.96 kg.
The angle between the neighboring mooring lines is 120°. The shapes of the mooring lines of the original OC3 model and five OC3CM models are shown in Figure 3. From Figure 3, the changes of the shape of the mooring lines can be clearly identified. Compared with Figure 3a, the segment of the mooring line from the connection node to the vessel node is obviously straightened by the clump masses, which will increase the tension of the mooring line and should limit the motion of the platform in return. This inference will be examined in detail in later sections.

3.2. Load Cases

To investigate the performance of the OC3CM models, the dynamic motions of the above six models in different wave situations are calculated. Table 4 shows the load cases, where H is the individual wave height, T is the individual wave period in regular waves, Hs is the significant wave height, and Tp is the peak-spectral wave period in irregular waves. The airy wave theory is used in the regular wave, while the P‒M spectrum is used to generate irregular waves. Meanwhile, the water depth is 320 m and the water density is 1025 kg · m 3 .

4. Results and Discussions

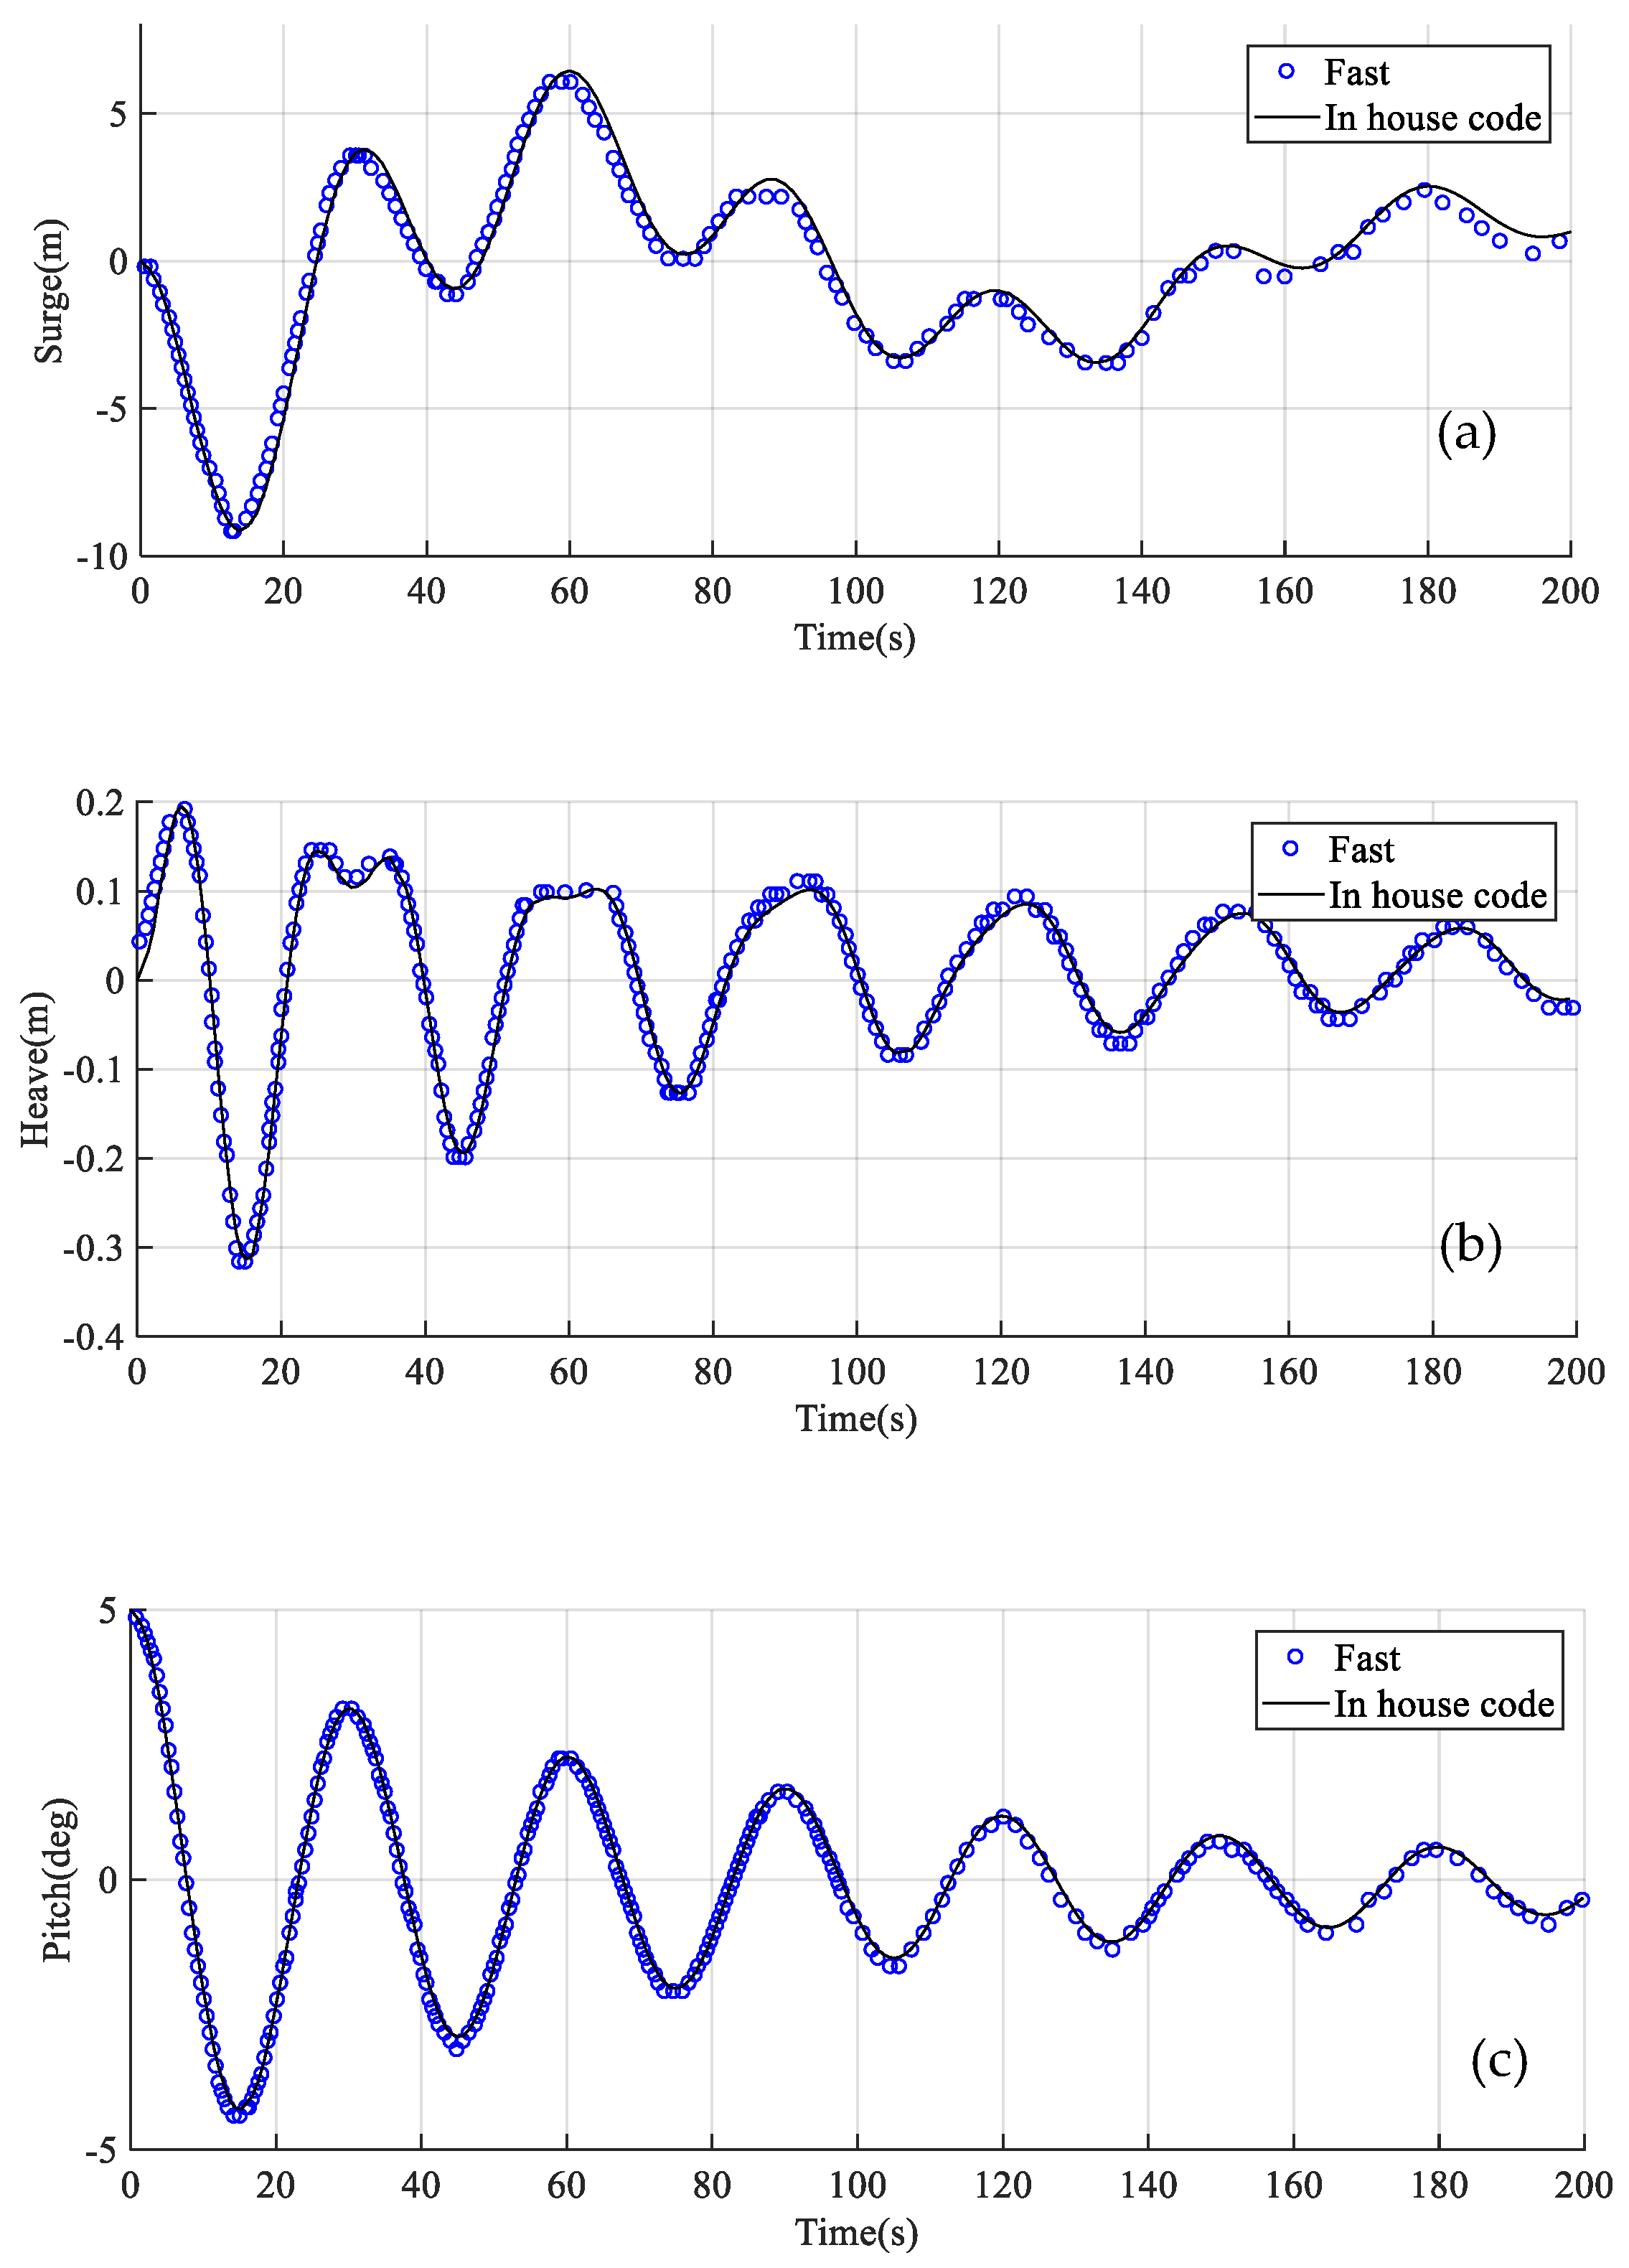
4.1. Validation of the Code

In order to verify the reliability of the code, the motion of the original OC3 model under the free decay condition is performed. Then, the results are compared with those from FAST. Given an initial pitch of the platform with a value of 5°, the model decays freely in still water until equilibrium. The details of settings of the verification case can be found in the study by Si et al. [45]. The surge, heave, and pitch motions are computed by both the in-house code and FAST. A comparison can be found in Figure 4, where the results from the in-house code are seen to be comparable with those from FAST. The maximum deviations for surge, heave, and pitch motions are about 6.7%, 4.2%, and 5.3%, respectively.

4.2. Regular Waves

To establish the initial position of the platform with the clump masses mounted, the free decay is first calculated for the original OC3 model. However, this is done with concentrated force (equal to the weight of the clump masses) added at the location where the clump masses are mounted. The free decay calculation with no wind and no waves lasted for 1200 s before the models reached the equilibrium position. After the free decay, the surge and pitch motions of the new models are all around 0, while the heave motion is around −1.3 m. Secondly, the OC3CM models are built at this equilibrium position to ensure that the initial state of the model is balanced. In the end, the motions of the OC3CM models under different load cases are calculated by the in-house code.
The surge, heave, and pitch motions of the platform in the time domain are shown in Figure 5, Figure 6 and Figure 7, respectively. In Figure 5, the surge motion of the OC3CM models is significantly smaller than in the original OC3 model. In particular, the peak surge motion of the original OC3 model is about 18 m before reaching its stable state and about 14 m after reaching the stable state. However, the peak surge motion of the OC3CM model is only about 13.5 m before reaching its stable state and about 10 m after achieving the stable state. Moreover, the surge motion of the OC3CM model P1 to the OC3CM model P5 is gradually reduced, indicating the more effectiveness of the clump masses when they are mounted at the location closer to the sea bed. However, it is necessary to point out that the clump masses cannot be located too close to the anchor point. Otherwise, they will make the connection node touch the seabed. As for the pitch motion, as shown in Figure 7, a decrease still occurs after the clump masses are added to the mooring lines. However, the decrease is not as obvious as in the surge direction, with no significant changes after moving the connection node from P1 to P5.
Figure 8, Figure 9 and Figure 10 illustrate the maximum, the minimum, and the averaged values, respectively, of the model motion from 600 s to 900 s. In Figure 8, the values of surge from the original OC3 model P0 to the OC3CM model P5 gradually reduce. The maximum and minimum values, as well as the averaged value of the surge of the original OC3 model P0 in load case 1, are 13.9 m, 10.7 m, and 12.3 m, respectively. Meanwhile, the correspondence of the OC3CM model P5 in case 3 is 10.1 m, 6.92 m, and 8.50 m. As inferred above, the clump masses are more effective when mounted closer to the sea bed and OC3CM model P5 can significantly reduce the average value of the surge by about 30.89%. This is considered a good improvement to the surge motion. Figure 9 illustrates significant changes to the values of heave from the original OC3 model P0 to the OC3CM model P5. In load case 1, the maximum heave motion of the original OC3 model P0 is 0.423 m, whereas that of the OC3CM model P5 is 0.41 m. In Figure 10, from the original OC3 model P0 to the OC3CM model P5, there are not many changes in the representative statistics.
Through the examination of the above figures and the representative statistics, the new model is considered to reduce the motions of the spar platform at a regular wave. This is especially evident when the value of the surge is reduced by about 30.89% even if there are no significant changes to the heave and pitch performance.

4.3. Irregular Waves

Similar to the calculation of the model under the regular wave, the time domain motions of the OC3CM model under the irregular waves are also solved by the code. The results are discussed in the frequency domain obtained by transforming the time domain signal to the frequency domain through Fast Fourier Transform [40]. Figure 11, Figure 12 and Figure 13 illustrate the frequency domain amplitude and the peak amplitude of the models at load cases 4, 5, and 6, respectively. Only the results in the low-frequency region are studied, which corresponds to the major contribution of the motion of the platform.
From Figure 11a, Figure 12a and Figure 13a, it can be found that the first peak of the surge amplitude appears at around 0.01 Hz. In the frequency interval 0–0.04 Hz, the surge amplitude of the OC3CM models is significantly smaller than the surge amplitude of the original OC3 model P0, and the surge amplitude of the OC3CM model P5 is found to be the smallest. Figure 11b, Figure 12b and Figure 13b show that the peak surge amplitude of the original OC3 model P0 is the largest, meanwhile, the peak surge amplitude of OC3CM model P1 to P4 are almost the same, but those values are smaller than that of the original OC3 model P0. In load case 4, the peak surge amplitude of the original OC3 model P0 is 1.43 m, while the peak surge amplitude of OC3CM model P5 is 0.88 m. This again illustrates that clump masses are more effective when they are mounted closer to the sea bed; in addition, it can be seen that the peak surge amplitude in the irregular wave situation can be reduced by about 38.4% by the OC3CM model P5.
Figure 11c, Figure 12c, and Figure 13c show that the first peak of the heave amplitude appears at around 0.01 Hz, and the amplitudes of the OC3CM models coincide well with that of the original OC3 model P0 in the frequency interval 0~0.04 Hz. From Figure 11d, Figure 12d and Figure 13d, it can be found that the peak surge amplitudes of original OC3 model P0 and the OC3CM models are staggered. However, those peak surge amplitudes are not very different from each other. In general, the OC3CM models can reduce the peak heave amplitude by 10%~17% in an irregular wave situation.
As shown in Figure 11e, Figure 12e, and Figure 13e, the first peak of the pitch amplitude appears at around 0.01 Hz, which is the same as that of the surge and heave motions. Figure 11f, Figure 12f, and Figure 13f show that the peak pitch amplitude gradually reduces from the original OC3 model P0 to the OC3CM model P5, even if the reduction is not obvious. Overall, the OC3CM models can reduce the peak heave amplitude by 12%~19% in an irregular wave situation.
In particular, the load cases have a significant impact on the motions of the model. By comparing Figure 11b, Figure 12b, and Figure 13b, it is evident that the higher the wave height, the larger the value of the surge. Similar conclusions can be drawn from other figures. In general, increasing the wave height and wind speed will make the value and amplitude of the motions of the OC3 model larger, as is expected.
From the above analysis, the new model can be said to reduce the motions of the spar platform at an irregular wave. In particular, the peak amplitude of the surge is reduced by about 38.4%, while the peak amplitude of heave and pitch are reduced by about 19% and 20%, respectively, by the OC3CM model P5.

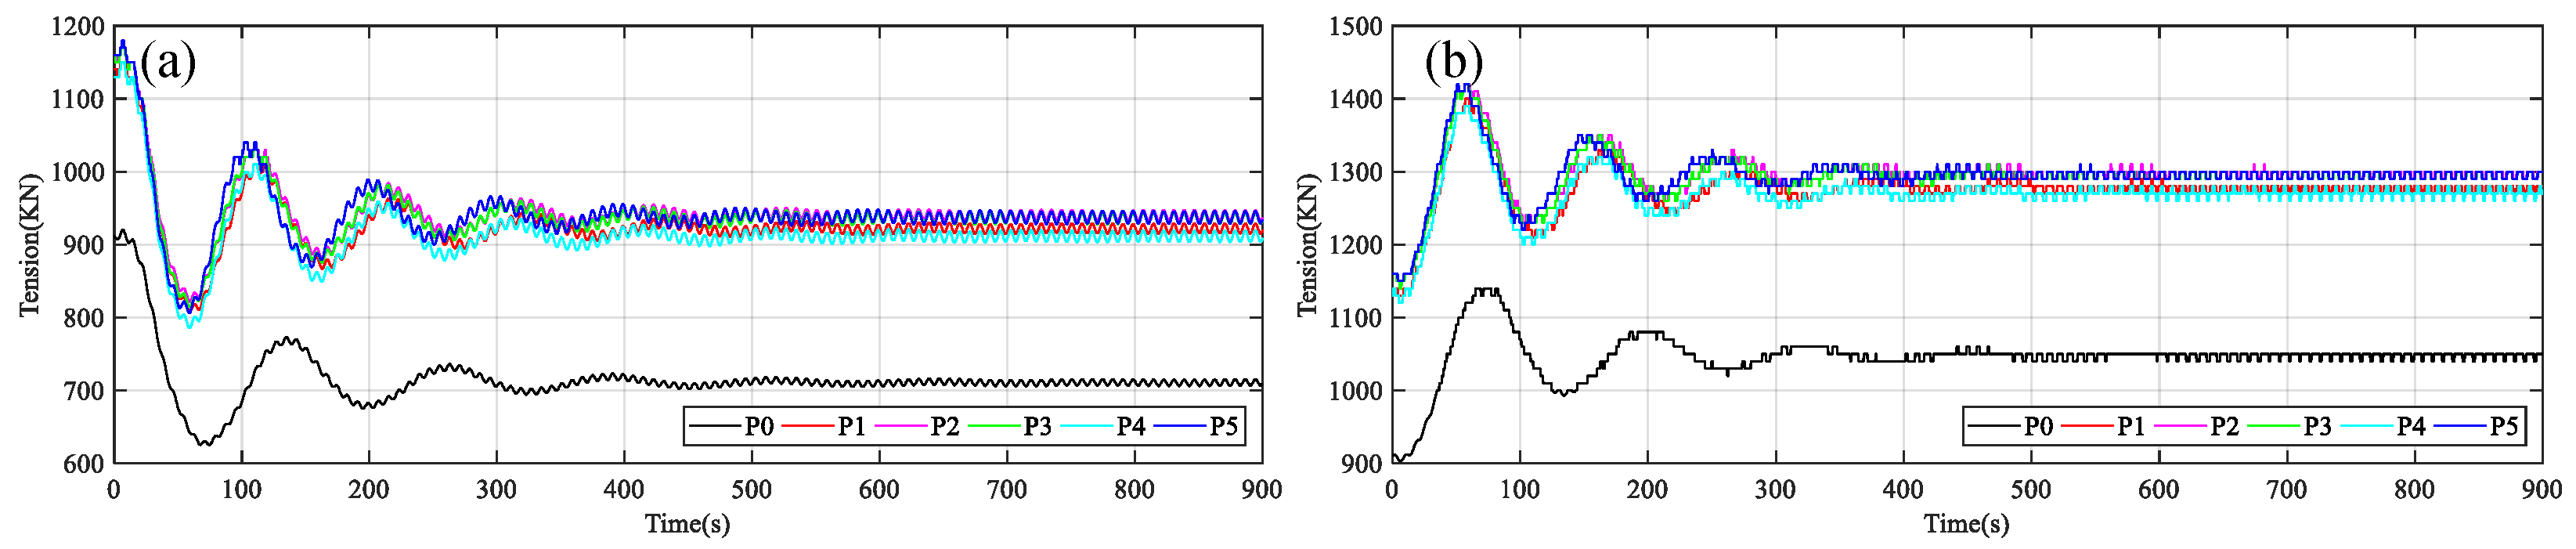
4.4. Fairlead Tension

When the clump masses are added on the mooring lines, the segment of the mooring line from the connection node to the vessel node will be obviously straightened, so the angle between these two segments will become smaller. In the vertical direction, the force provided by the fairlead tension is the sum of the gravity of the clump masses and the vertical force provided by the tension of the mooring line from the connection node to the anchor node. So when the gravity of the clump masses is added, the component force provided by the fairlead tension will be increased several-fold due to the small angle between the upper and lower segments of the mooring lines.
According to the above calculation and analysis, the motions of the spar platform are very limited, especially the surge. The fairlead tension of the mooring lines of original OC3 model P0 and the OC3CM models in regular waves are shown in Figure 14, Figure 15 and Figure 16.
As shown in the above section, fairlead 2 and fairlead 3 are symmetrically distributed and have an angle of 120 degrees. Therefore, the tension of fairlead 2 is considered to be equal to that of fairlead 3. Taking this into account, only the tension of fairlead 1 and fairlead 2 are presented in the figures. In Figure 14a, Figure 15a, and Figure 16a, the fairlead tension of the same model does not change much in different load cases, which means that changes in wind and wave loads make no significant difference to the fairlead tension. Figure 14a demonstrates that the curve of the original OC3 model P0 is obviously below the curves of the OC3CM models, whereas the tension of OC3CM model P1 to P5 is almost the same. At 0 s, there is a significant increase in the fairlead tension of the OC3CM models, which is brought about by the clump masses. Comparing Figure 14a,b, the trend of the curve can be analyzed. In the figures, it is evident that the tension of fairlead 1 has a dramatic change, eventually getting smaller. However, the tension of fairlead 1 is precisely the opposite, which can be explained by the platform gradually moving to anchor 1. As a result, mooring line 1 becomes slack, making mooring line 2 tense. In case 1, the fairlead 1 tension of the original OC3 model P0 is about 720 kN, while the fairlead 1 tension of the OC3CM model P5 is 957 kN at stable state. Additionally, the fairlead 2 tension and fairlead 3 tension of original OC3 model P0 are 1060 kN, while that of OC3CM model P5 is 1320 kN.
In order to calculate the fatigue load of the mooring line, the slope of the S‒N curve is set to 4 and the duration of the wave is set to 365 days. The results are shown in Figure 17. It can be seen that the fatigue loads of the mooring lines undergo obvious changes at different frequencies. The fatigue loads of the mooring lines for the OC3CM models P2 and P5 are found to be relatively small and insensitive to the change in the wave frequencies.
From the above analysis, it can be concluded that the clump masses will increase fairlead 1 tension by about 30% and fairlead 2 and 3 tension by about 24.5%. However, the position of the clump masses and the changes of wind and wave loads have no significant effect on the fairlead tension. These results verify that the segment of the mooring line from the connection node to the vessel node is obviously straightened by the clump masses, which will increase the tension of the mooring line. Thus, it should limit the motion of the platform in return.

5. Conclusions

In this paper, a new model based on the OC3-Hywind spar to support a 5-MW wind turbine is presented. The clump masses are attached to the catenary mooring system to further improve its wave-resistance ability. Following many calculations and analyses of the new models of different weight of clump masses and different position in the previous period, the influence of the mass and position of the clump masses on the response motion of the platform was determined. In addition, the change of the position of the clump masses was found to have an obvious influence on the response motion of the spar platform. Similarly, an increase in the mass of the clump masses will increase the heave of the spar platform and reduce the surge of the platform, but the impact on the surge is very small. Therefore, in this paper, the weight of the clump masses remained unchanged, with only the position of the clump masses changed to obtain five new models. The response motions of the five OC3CM models and the original OC3 model under six load cases were calculated by the codes. Also, the free decay experiment was performed to verify the accuracy of the codes. From the above analysis and discussion, several important conclusions can be drawn, as follows:
  • Through the comparison of the free decay test, it can be concluded that the code developed in-house is accurate, so it can be used for subsequent research on OC3 offshore wind turbines.
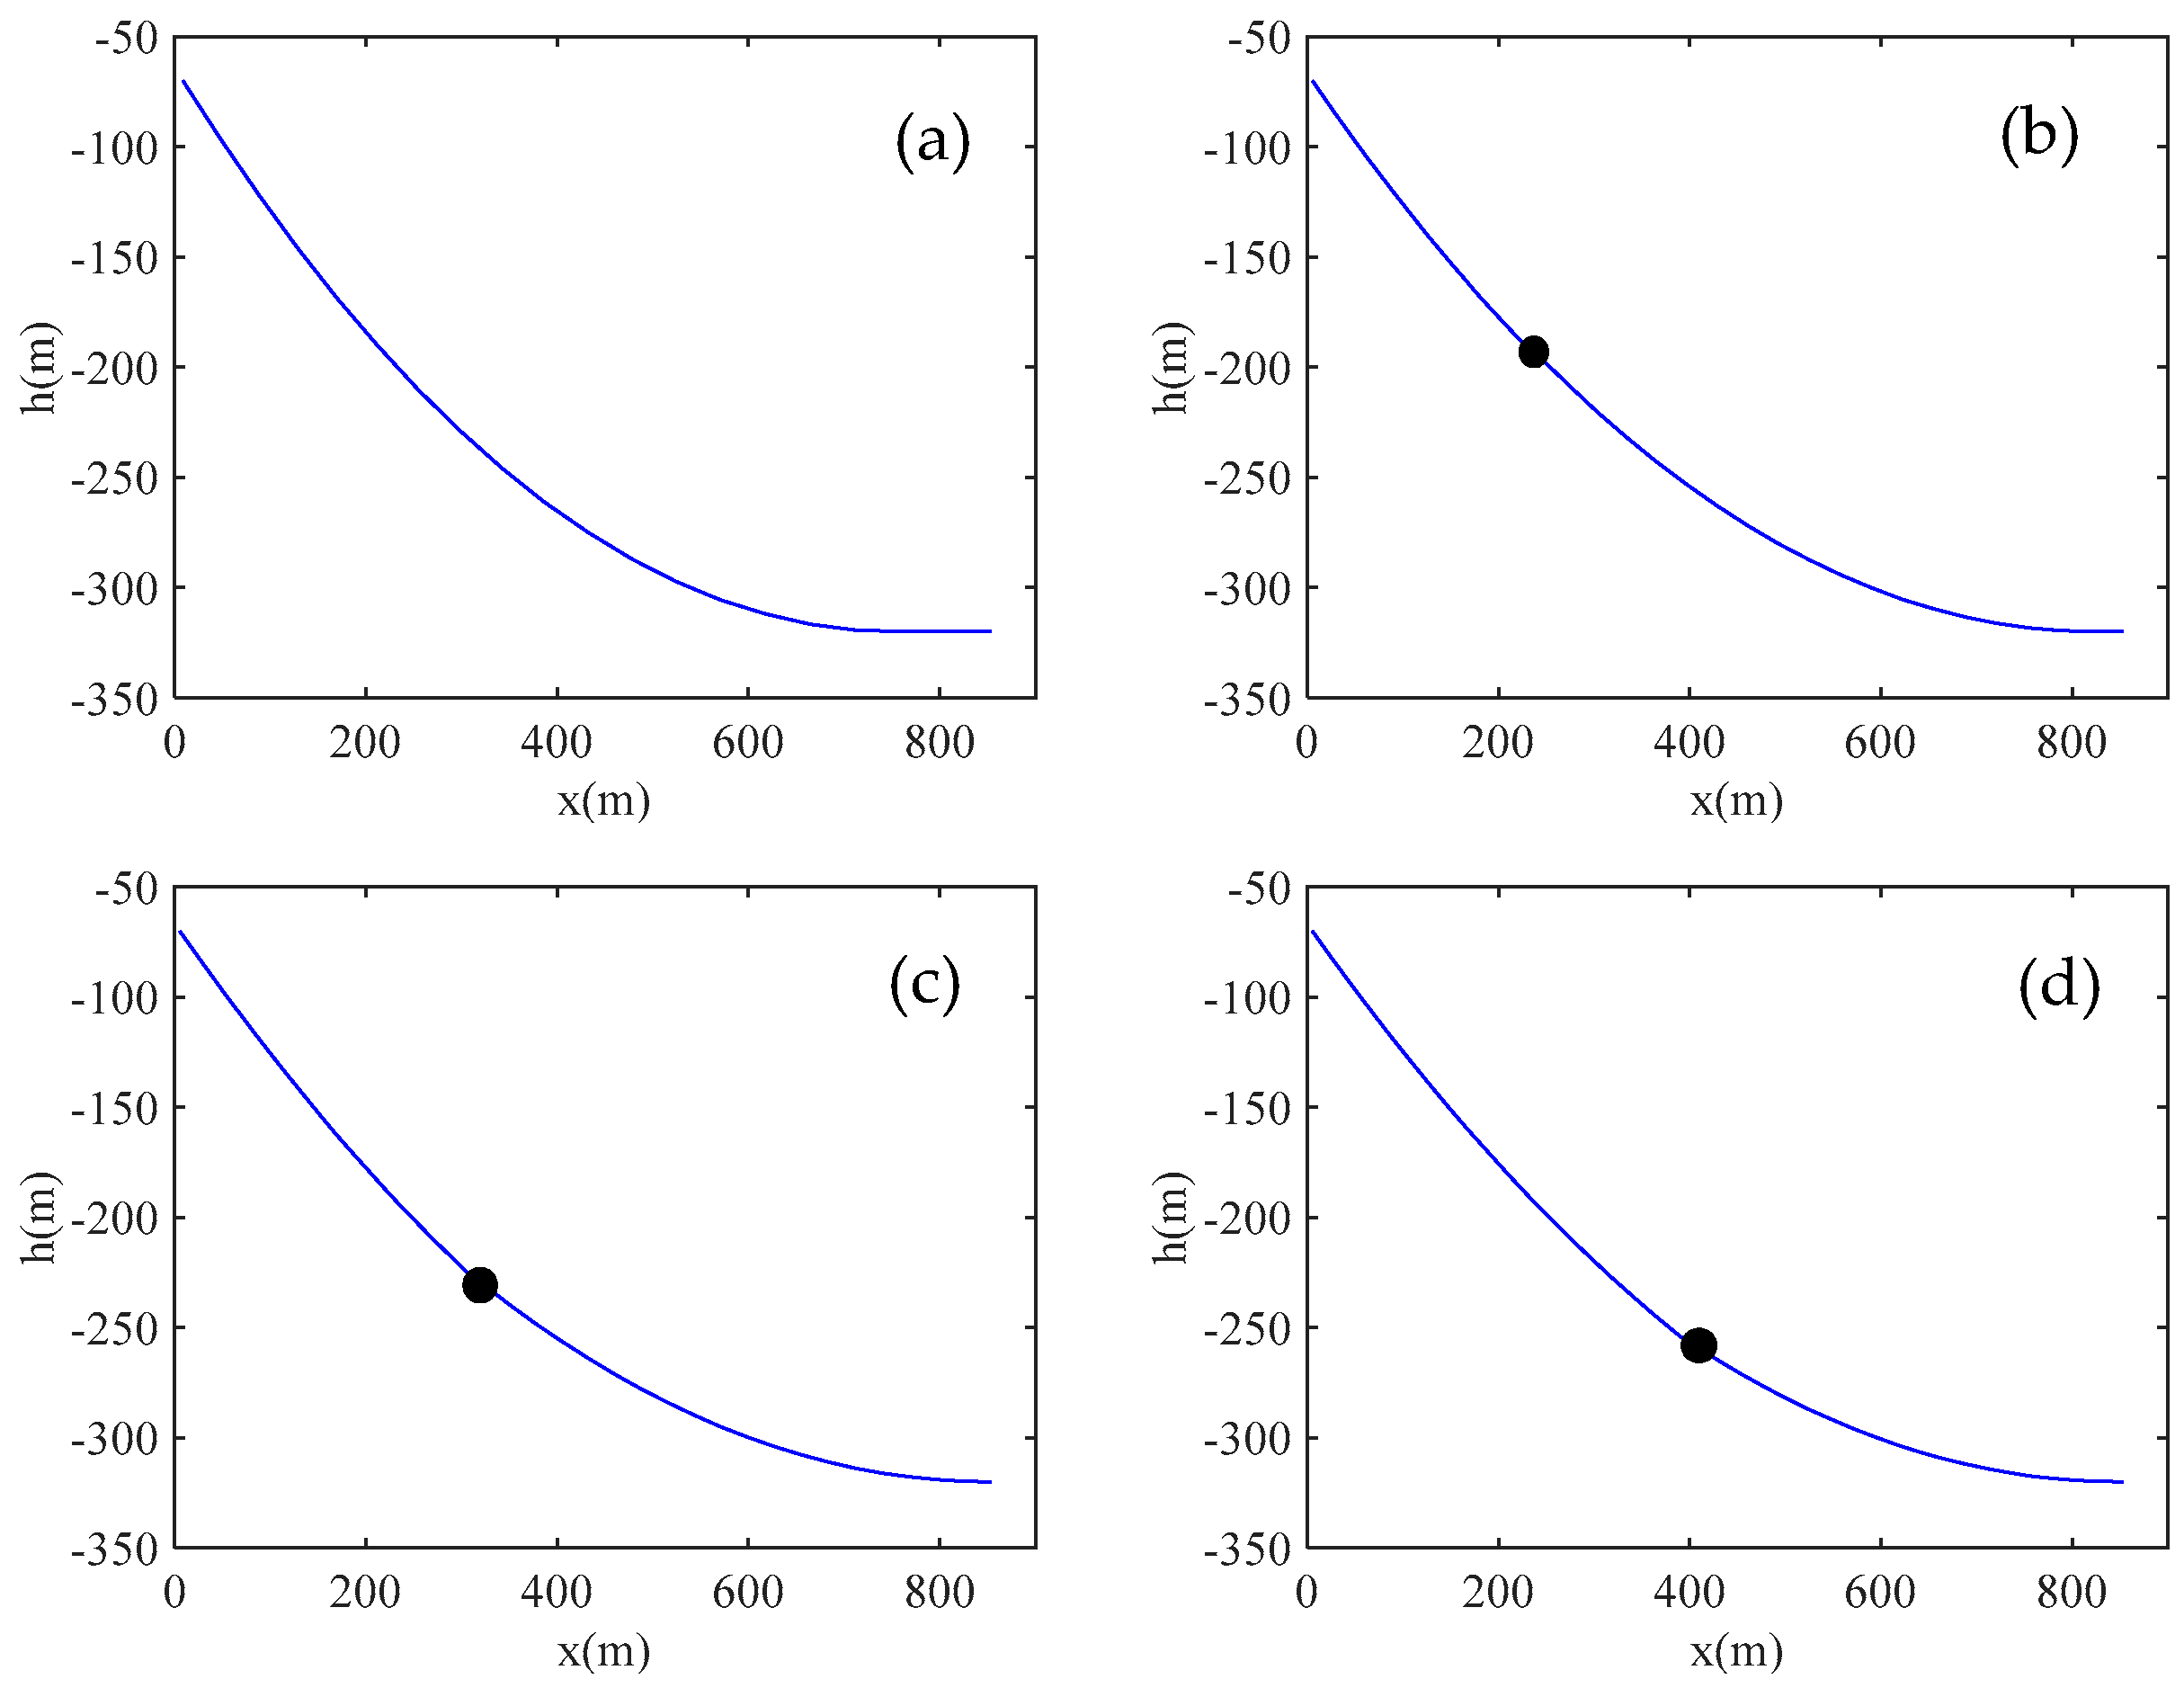
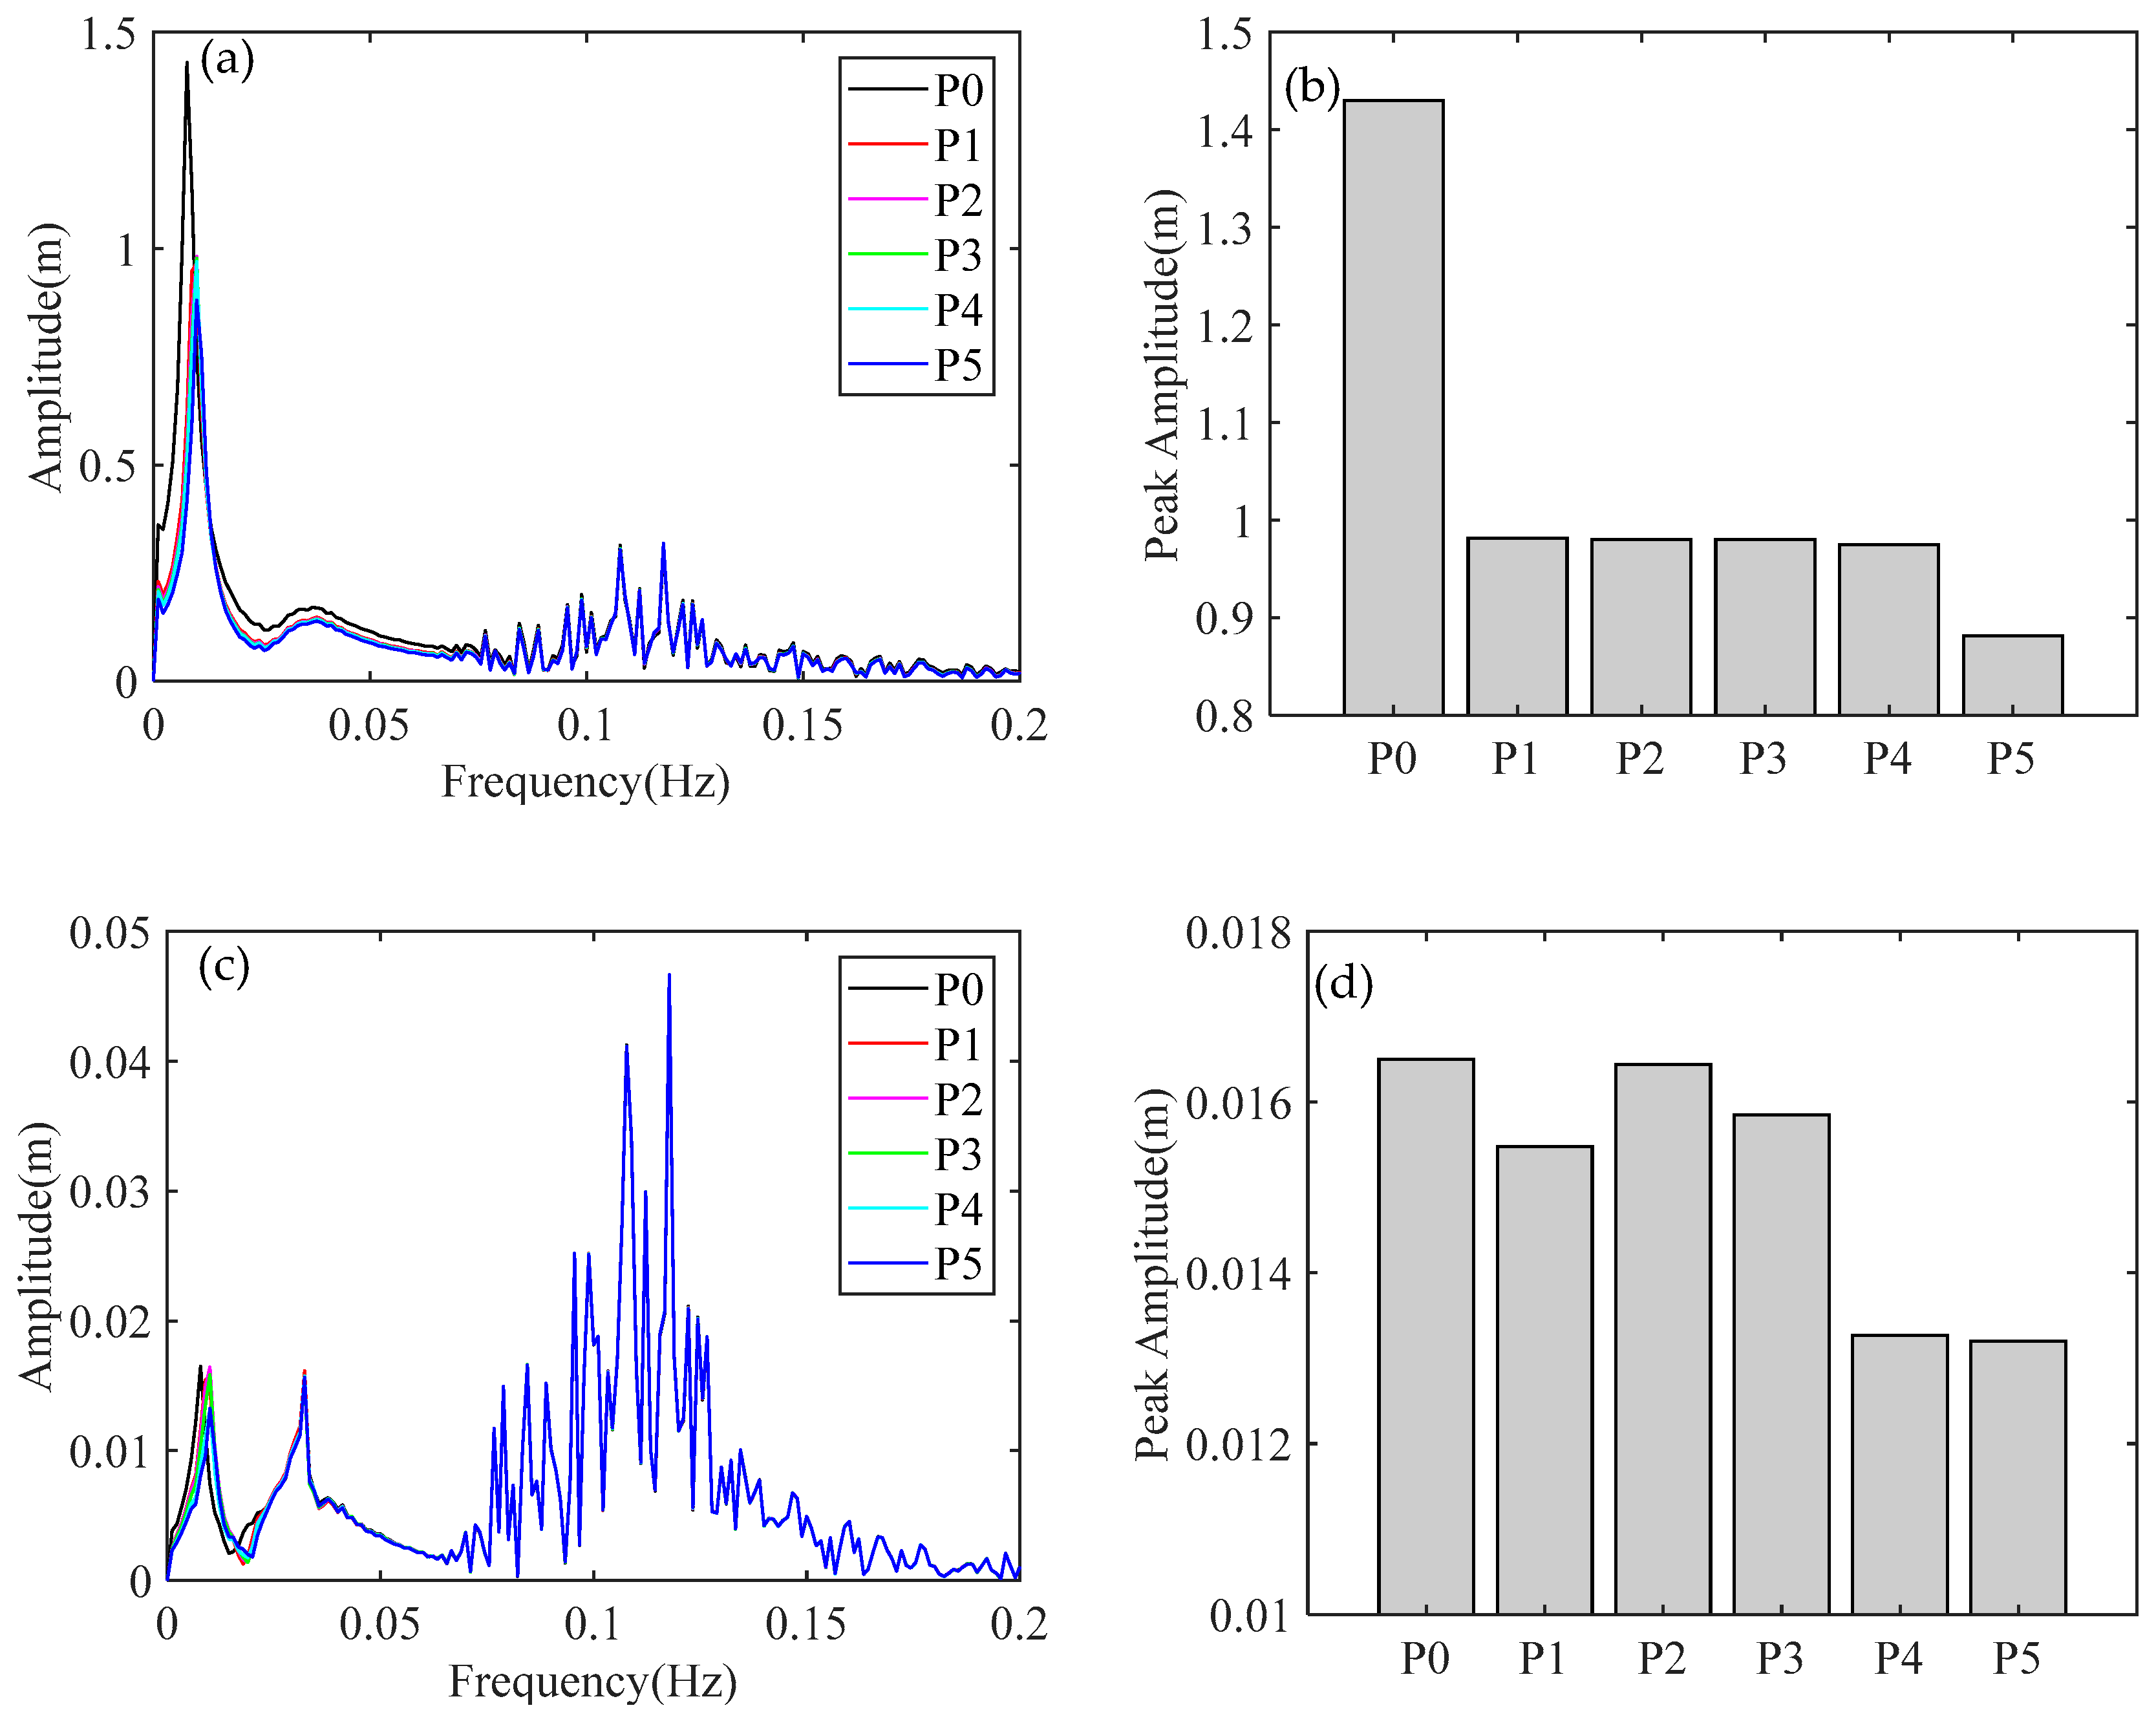
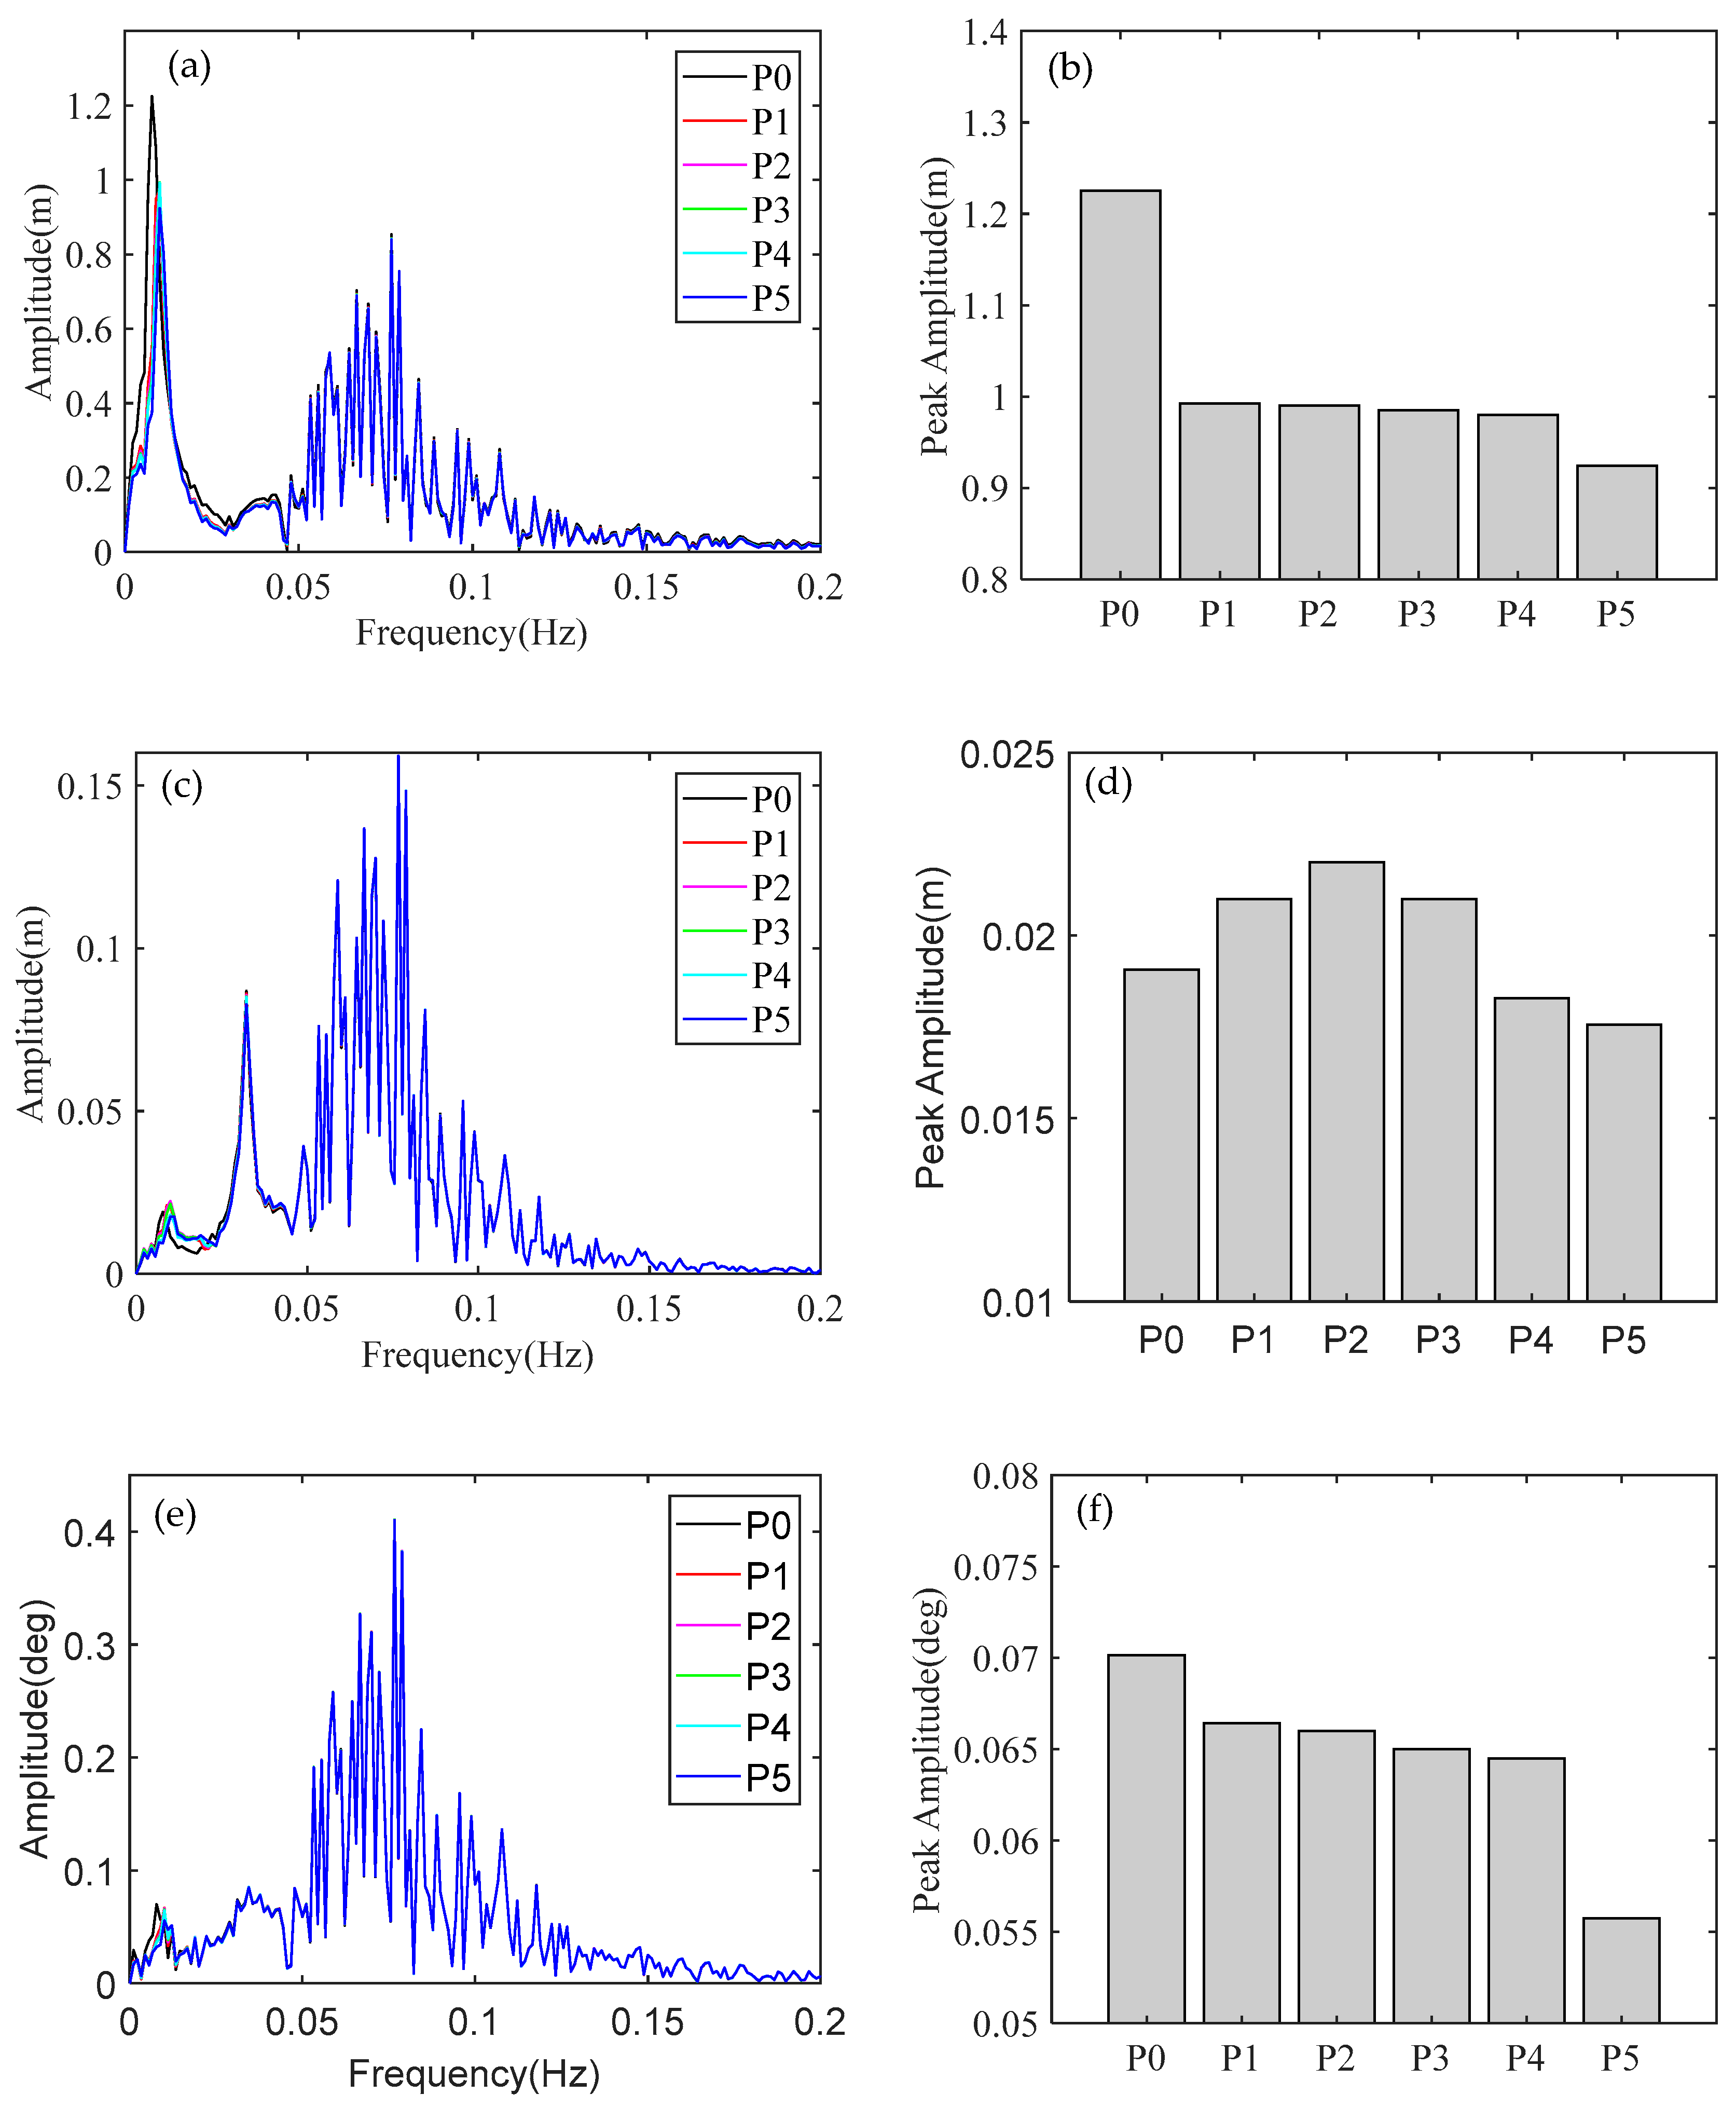
  • The OC3CM model can significantly reduce the surge of the spar platform at wind and wave loads, and the clump masses are more effective when they are mounted closer to the sea bed. However, it must be pointed out that the clump masses cannot be located too close to the anchor point, otherwise they will make the connection node touch the seabed. The best model is the OC3CM model P5, which can reduce the value of the surge by about 30.89% under a regular wave and reduce the peak amplitude of surge by about 38.4% under an irregular wave.
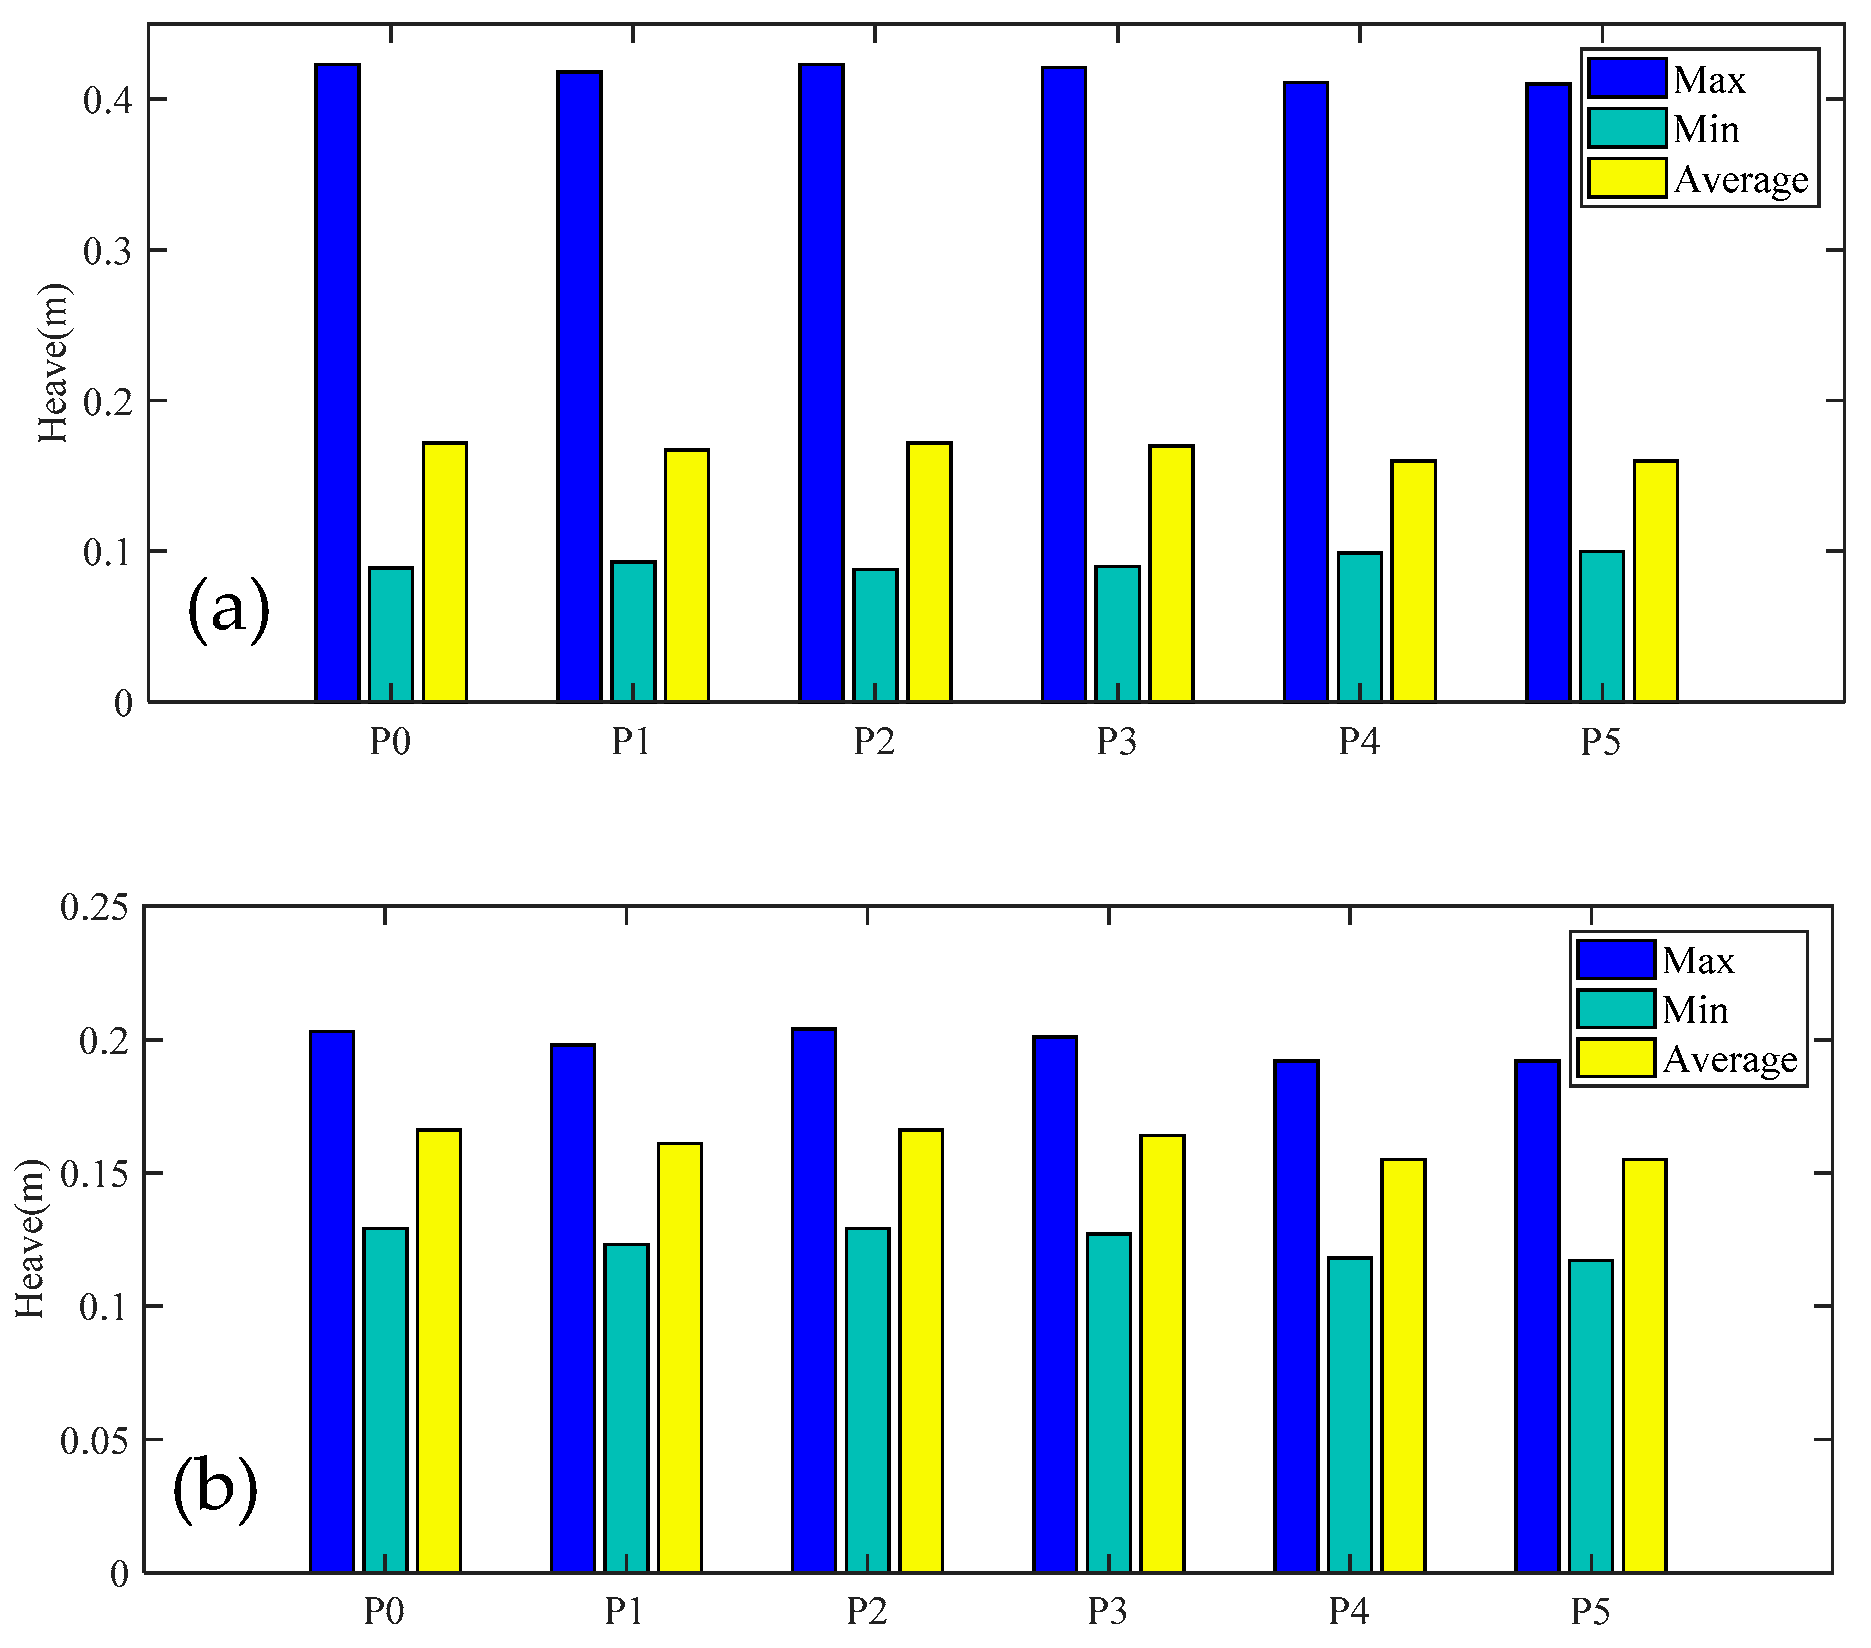
  • The OC3CM model has no significant effect on the heave of the spar platform under wind and regular wave loads; however, after adding the clump masses, the platform will settle about 1.3 m, but the impact is negligible compared to its draught depth of 120 m. In addition, the OC3CM model P5 induces a small change in the peak pitch amplitude, while the OC3CM model P5 can reduce the peak pitch amplitude and the peak heave amplitude by about 20% and 19%, respectively, in the wind and irregular wave load.
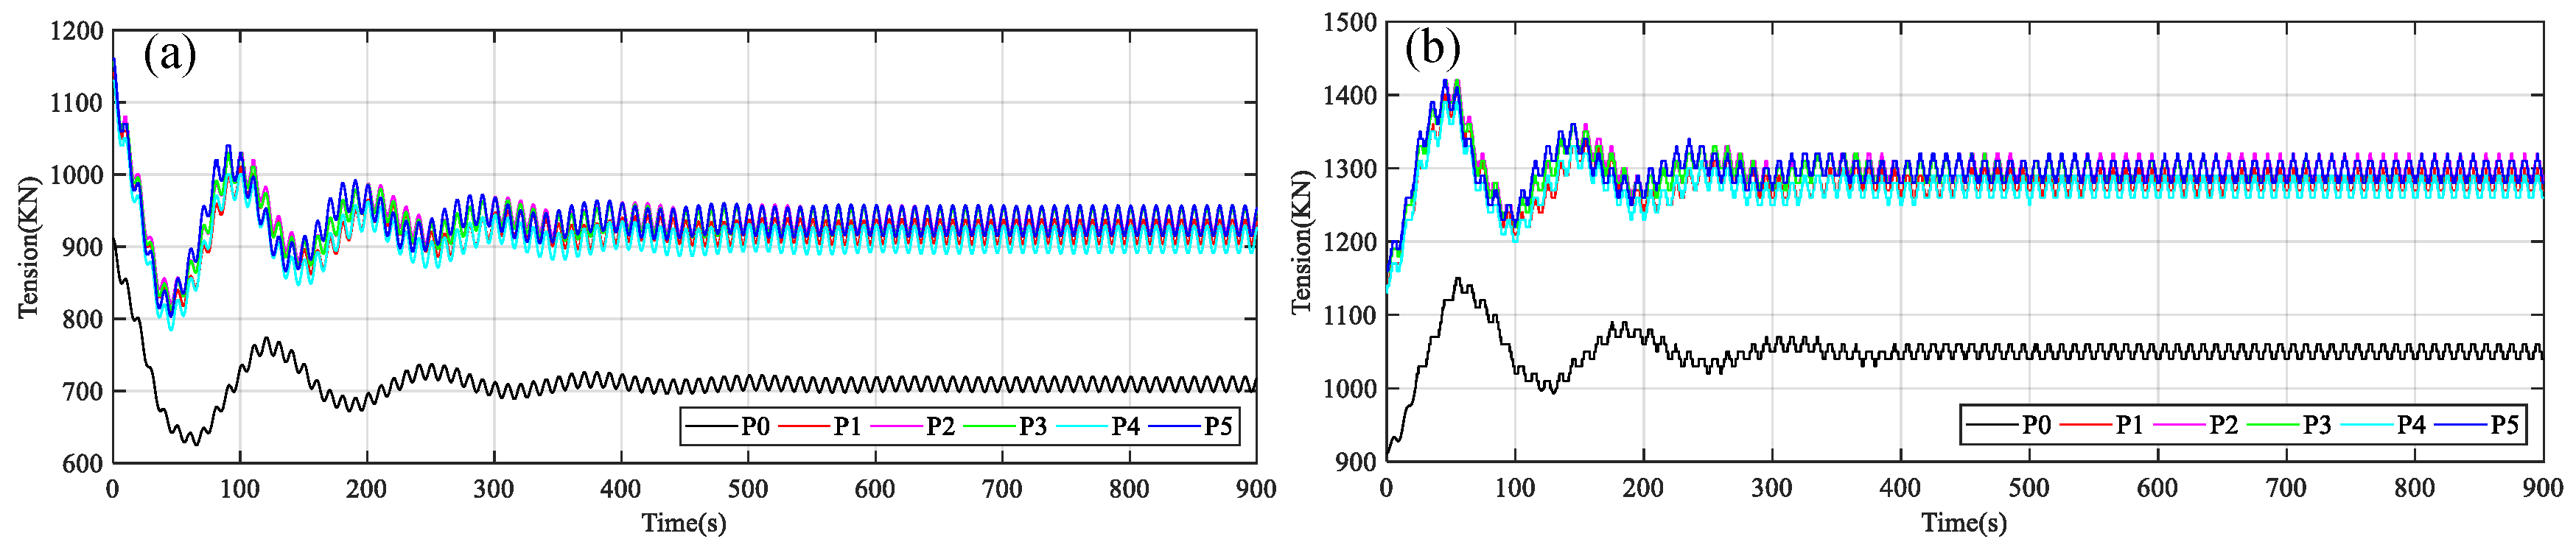
  • The clump masses will increase the fairlead 1 tension by about 30% and increase the fairlead 2 and 3 tensions by about 24.5%. However, the position of the clump masses and the changes of wind and wave loads indicate no significant effect on the fairlead tension. The segment of the mooring line from the connection node to the vessel node is obviously straightened by the clump masses. This will increase the tension of the mooring line and should, therefore, limit the motion of the platform. The affected frequency range makes a difference to the fatigue loads on the moorings, but the regularity is not obvious. At the same time, the fatigue loads of the OC3CM model P5 and P2 are relatively small.
  • This paper only intends to provide a way to reduce the response motions, regardless of its increased cost. In subsequent studies, the cost will be taken into consideration and the platform structure as well as the mooring system will be changed simultaneously. These changes are expected to make the OC3-Hywind have better performance under different environmental conditions and better economic benefits.

Author Contributions

Conceptualization, Z.L. and Y.T.; methodology, Y.T.; software, Y.T.; validation, Y.T.; formal analysis, Y.T.; writing—original draft preparation, Y.T.; writing—review and editing, Y.T. and Z.L.; supervision, Z.L.; guidance, Z.L.; coding, W.W. and G.Q.

Funding

The study is funded by the National Key Research and Development Plan of China (2016YFE0127900) and the National Natural Science Foundations of China (51608220).

Acknowledgments

The corresponding author sincerely thanks Huazhong University of Science and Technology for the support to this research and Zhenqing Liu for the guidance and help during this research.

Conflicts of Interest

The authors declare no conflict of interest.

Nomenclature

aAxial induction factor
a Tangential induction factor
a p Linear acceleration of the structure ( m · s 2 )
A M R P Added-mass due to radiation at the reference point
B Number of the blades
c Leaf chord length (m)
C H y d r o s t a s t i c Hydrostatic-restoring matrix
C n Coefficients for the normal force
C t Coefficients for the thrust force
EA Cross section axial stiffness (kN)
F A M Total added mass forces from all contributions (kN)
F H S Hydrostatic forces at the reference node (kN)
F L i n e Mooring tension (kN)
F R D Radiation memory-effect force at the reference point (kN)
F W Incident-wave excitation force at reference point (kN)
F W A P Total loads at the reference point (kN)
F W i n d Wind loads applied to the blades and tower (kN)
F H , F V Applied horizontal and vertical force at the fairlead, respectively (kN)
gAcceleration due to gravity ( m · s 2 )
KHydrostatic restoring force matrix
K 1 Radiation kernel from potential flow theory
LUpstretched line length (m)
S ζ 2 s i d e d ( ω ) Wave spectrum (P-M spectrum in this paper)
tTime (s)
V 0 Volume of the immersed part of the platform (m3)
V 1 Wind speed ( m · s 1 )
W [ k ] Fourier transform of a white noise time series with unit variance
ω Frequency (Hz)
xPlatform motions (m)
x ˙ ( τ ) Platform velocity ( m · s 1 )
x F , Cable profile in the horizontal planes at distance s along the line (m)
z F Cable profile in the vertical planes at distance s along the line (m)
X ( ω , β ) Wave-induced force array normalized per unit wave amplitude ( kN · m 1 )
δ 3 Component of the Kronecker‒Delta function
βIncident wave direction angle (degree)
AQWA Integrated Module Under ANSYS
CAES Compressed Air Energy Storage
DOF Degree of Freedom
FAST Fatigue, Aerodynamics, Structures, and Turbulence
FOWT Floating Offshore Wind Turbine
IEA The International Energy Agency
CM Clump masses
MSQS Multi-Segmented, Quasi-Static
NREL National Renewable Energy Laboratory
OC3 Offshore Code Comparison Collaboration
OC4 Offshore Code Comparison Collaboration Continuation
P-M Pierson and Moskowitz
RAO Response Amplitude Operator
RNA Rotor Nacelle Assembly
SFFC Steel Fish-Farming Cage
SWL Still Water Level
TLP Tension Leg Platform

References

  1. Madjid, K.; Torgeir, M. Feasibility of the Application of a Spar-type Wind Turbine at a Moderate Water Depth. Energy Procedia 2012, 24, 340–350. [Google Scholar] [Green Version]
  2. Hao, K.J.; Robertson, A.N.; Jonkman, J.; Driscoll, F.; Ng, E.Y.K. Building and Calibration of a Fast Model of the Sway Prototype Floating Wind Turbine. In Proceedings of the International Conference on Renewable Energy Research and Applications (ICRERA), Madrid, Spain, 20–23 October 2013. [Google Scholar]
  3. Sethuraman, L.; Venugopal, V. Hydrodynamic response of a stepped-spar floating wind turbine: Numerical modelling and tank testing. Renew. Energy 2013, 52, 160–174. [Google Scholar] [CrossRef]
  4. Utsunomiya, T.; Sato, T.; Matsukuma, H.; Yago, K. Experimental validation for motion of a spar-type floating offshore wind turbine using 1/22.5 scale model. In Proceedings of the ASME 2009 28th International Conference on Ocean, Offshore and Arctic Engineering, Osaka, Japan, 21–26 July 2009; pp. 951–959. [Google Scholar]
  5. Utsunomiya, T.; Nishida, E.; Sato, I. Wave response experiment on spar-type floating bodies for offshore wind turbine. In Proceedings of the 19th International Offshore and Polar Engineering Conference, Osaka, Japan, 21–26 July 2009. [Google Scholar]
  6. Roddier, D.C.; Cermelli, A.A.; Weinstein, A. WindFloat: A floating foundation for offshore wind turbines. J. Renew. Sustain. Energy 2010, 2. [Google Scholar] [CrossRef]
  7. Duan, F.; Hu, Z.Q.; Wang, J. Investigation of the VIMs of a spar-type FOWT using a model test method. J. Renew. Sustain. Energy 2016, 8. [Google Scholar] [CrossRef]
  8. Adam, F.; Myland, T.; Schuldt, B.; Großmann, J.; Dahlhaus, F. Evaluation of internal force superposition on a TLP for wind turbines. Renew. Energy 2014, 71, 271–275. [Google Scholar] [CrossRef]
  9. Vita, L.; Ramachandran, G.K.V.; Krieger, A.; Kvittem, M.I.; Merino, D.; Cross-Whiter, J.; Ackers, B.B. Comparison of Numerical Models and Verification Against Experimental Data, Using PelaStar TLP Concept. In Proceedings of the ASME 2015 34th International Conference on Ocean, Offshore and Arctic Engineering, St John’s, NL, Canada, 31 May–5 June 2015. [Google Scholar]
  10. Bulder, B.H.; Van, H.; Henderson, A.; Huijsmans, R.H.M.; Pierik, J.T.G.; Snijders, E.J.B.; Wijnants, G.H.; Wolf, M.J. Studie Naar Haalbaarheid van en Randvoorwaarden Voor Drijvende Offshore Windturbines; Drijfwind Project Report; TNO: Delft, The Netherlands, 2002. [Google Scholar]
  11. Karimirad, M.; Michailides, C. V-shaped semisubmersible offshore wind turbine: An alternative concept for offshore wind technology. Renew. Energy 2015, 83, 126–143. [Google Scholar]
  12. Paulsen, U.S.; Borg, M.; Madsen, H.A. Outcomes of the DeepWind conceptual design. Energy Procedia 2015, 80, 329–341. [Google Scholar]
  13. Bedon, G.; Paulsen, U.S.; Madsen, H.A.; Belloni, F.; Castelli, M.; Benini, E. Aerodynamic Benchmarking of the Deepwind Design. Energy Procedia 2015, 75, 677–682. [Google Scholar] [CrossRef] [Green Version]
  14. Beyer, F.; Choisnet, T.; Kretschmer, M.; Cheng, P.W. Coupled MBS-CFD Simulation of the Ideol Floating Offshore Wind Turbine Foundation Compared to Wave Tank Model Test Data. In Proceedings of the 25th (2015) International Ocean and Polar Engineering Conference, Kona (Big Island), HI, USA, 21–26 June 2015. [Google Scholar]
  15. Robertson, A.; Jonkman, J.; Masciola, M.; Song, H.; Goupee, A.; Coulling, A.; Luan, C. Definition of the Semisubmersible Floating System for Phase II of OC4; NREL/TP-5000-60601; National Renewable Energy Laboratory (NREL): Golden, CO, USA, 2014. [Google Scholar]
  16. Ai, N.; David, J.O.; Gretar, T. Nonlinear simulation of a spar buoy floating wind turbine under extreme ocean conditions. J. Renew. Sustain. Energy 2014, 6. [Google Scholar] [CrossRef]
  17. Chen, J.H.; Hu, Z.Q.; Duan, F. Comparisons of dynamical characteristics of a 5 MW floating wind turbine supported by a spar-buoy and a semi-submersible using model testing methods. J. Renew. Sustain. Energy 2018, 10. [Google Scholar] [CrossRef]
  18. Karimirad, M.; Gao, Z.; Moan, T. Dynamic Motion Analysis of Catenary Moored Spar Wind Turbine in Extreme Environmental Condition. In Proceedings of the European Offshore Wind 2009 Conference, Stockholm, Sweden, 14–16 September 2009. [Google Scholar]
  19. Driscoll, F.; Jonkman, J.; Robertson, A.; Sirnivas, S.; Skaare, B.; Nielsen, F.G. Validation of a fast model of the statoil-hywind demo floating wind turbine. Energy Procedia 2016, 94, 3–19. [Google Scholar] [CrossRef]
  20. Mahmudur, R.S.; Saiful, I.; Mohd, Z.J.; Zainah, I.; Rafiqul, M.I.; Nazmul, H. Hydrodynamic response of floating coupled spar in deep sea. In Proceedings of the 10th International Conference on Marine Technology (MARTEC 2016), Dhaka, Bangladesh, 9–10 December 2016. [Google Scholar]
  21. Shen, W.J. Numerical wind-tunnel simulation for Spar platform. AIP Conf. Proc. 2017, 1839. [Google Scholar] [CrossRef]
  22. Myhr, A.; Maus, K.J.; Nygaard, T.A. Experimental and computational comparisons of the OC3-hywind and tension-leg-buoy (TLB) floating wind turbine conceptual designs. In Proceedings of the 21st International Offshore and Polar Engineering Conference, Maui, HI, USA, 19–24 June 2011. [Google Scholar]
  23. Nielsen, F.G.; Hanson, T.D.; Skaare, B. Integrated dynamic analysis of floating offshore wind turbines. In Proceedings of the ASME 2006 25th International Conference on Ocean, Offshore and Arctic Engineering, Hamburg, Germany, 4–9 June 2006; pp. 671–679. [Google Scholar]
  24. Jonkman, J.; Musial, W. Offshore Code Comparison Collaboration (OC3) for IEA Wind Task 23 Offshore Wind Technology and Deployment; NREL/TP-5000-48191; National Renewable Energy Laboratory (NREL): Golden, CO, USA, 2010. [Google Scholar]
  25. Shin, H. Model Test of the OC3-Hywind Floating Offshore Wind Turbine. In Proceedings of the 21st International Offshore and Polar Engineering Conference, Maui, HI, USA, 19–24 June 2011. [Google Scholar]
  26. Ye, Z.; Zhou, W.; Zhang, P.; Li, C. Research on Structural Optimization Design of Spar Platform for Offshore Wind Turbine. J. Water Resour. Water Eng. 2018, 29, 156–162. [Google Scholar]
  27. Li, F.; You, Y.X.; Chen, K. Investigation on the Load Characteristics of Spar Platform with Spiral Strakes under Internal Solitary Waves. Chin. J. Hydrodyn. 2018, 33, 470–479. [Google Scholar]
  28. Zhang, H.H.; Zhang, H.X.; Yao, H.L. Numerical Simulation on the Hydrodynamics Forces of Spar Platform with Heave Plate. Chin. J. Hydrodyn. 2018, 33, 150–161. [Google Scholar]
  29. Wang, Y.Z.; Xu, X.P.; Liu, G.D. Analysis of Effect of Heave Plate on Vertical Motion Performance of Truss Spar Platform. China Pet. Mach. 2017, 45, 46–50. [Google Scholar]
  30. Chen, D.; Gao, P.; Huang, S.S.; Fan, K.; Zhuang, N.; Liao, Y.D. Dynamic response and mooring optimization of spar-type substructure under combined action of wind, wave, and current. J. Renew. Sustain. Energy 2017, 9. [Google Scholar] [CrossRef]
  31. Hyunkyoung, S.; Wooseob, L.; Kwangjin, J.; Jungtae, K. Model test and simulation of modified spar type floating offshore wind turbine with three catenary mooring lines. J. Renew. Sustain. Energy 2014, 6. [Google Scholar] [CrossRef]
  32. Zheng, X.Y.; Lei, Y. Stochastic Response Analysis for a Floating Offshore Wind Turbine Integrated with a Steel Fish Farming Cage. Appl. Sci. 2018, 8, 1229. [Google Scholar] [CrossRef]
  33. Yu, W.; Ding, Q.; Li, C.; Hao, W.X.; Zhou, H.J.; Zhang, K. Influence of Heave Plate on the Dynamic Response of a Floating Wind Turbine Platform. J. Chin. Soc. Power Eng. 2018, 38, 747–754. [Google Scholar]
  34. Li, A.J.; Tang, B.Y.; Yeung, C.R. Effects of second-order difference-frequency wave forces on a new floating platform for an offshore wind turbine. J. Renew. Sustain. Energy 2014, 6. [Google Scholar] [CrossRef]
  35. Yuan, Z.M.; Atilla, I.; Ji, C.Y. Numerical study on a hybrid mooring system with clump weights and buoys. Ocean. Eng. 2014, 88, 1–11. [Google Scholar] [CrossRef] [Green Version]
  36. Tore, H. Design Analysis and Optimisation of Mooring System for Floating wind Turbines. Master’s Thesis, Norwegian University of Science and Technology, Trondheim, Norway, 2014. [Google Scholar]
  37. Jonkman, J.M.; Hayman, G.J.; Jonlman, B.J.; Damiani, R.R.; Murray, R.E. AeroDyn v15 User’s Guide and Theory Manual; National Renewable Energy Laboratory (NREL): Golden, CO, USA, 2016. [Google Scholar]
  38. Jonkman, J.M.; Robertson, A.N.; Hayman, G.J. HydroDyn User’s Guide and Theory Manual; National Renewable Energy Laboratory (NREL): Golden, CO, USA, 2015. [Google Scholar]
  39. Jonkman, J. Definition of the Floating System for Phase IV of OC3; NREL/TP-500-47535; National Renewable Energy Laboratory (NREL): Golden, CO, USA, 2010. [Google Scholar]
  40. Jonkman, J.; Butterfield, S.; Musial, W.; Scott, G. Definition of a 5-MW Reference Wind Turbine for Offshore System Development; NREL/TP-500-38060; National Renewable Energy Laboratory (NREL): Golden, CO, USA, 2009. [Google Scholar]
  41. Masciola, M.; Jonkman, J.; Robertson, A.N. Implementation of a Multisegmented, Quasi-Static Cable Model. In Proceedings of the 23th International Ocean (Offshore) and Polar Engineering Conference, Anchorage, AK, USA, 30 June–5 July 2013. [Google Scholar]
  42. Jonkman, J. Dynamics Modeling and Loads Analysis of an Offshore Floating Wind Turbine; NREL/TP-500-41958; National Renewable Energy Laboratory (NREL): Golden, CO, USA, 2007. [Google Scholar]
  43. Batchelor, G.K. An Introduction to Fluid Dynamics; Cambridge University Press: Cambridge, UK, 1973; ISBN 0-521-09817-3. [Google Scholar]
  44. Wang, H.; Hu, Z.Q.; Meng, X.Y. Dynamic Performance Investigation of A Spar-Type Floating Wind Turbine Under Different Sea Conditions. China Ocean. Eng. 2018, 32, 256–265. [Google Scholar] [CrossRef]
  45. Si, Y.L.; Karimi, H.R.; Gao, H.J. Modeling and Parameter Analysis of the OC3-Hywind Floating Wind Turbine with a Tuned Mass Damper in Nacelle. J. Appl. Math. 2013, 2013, 679071. [Google Scholar] [CrossRef]
Figure 1. Modules in the in-house codes.
Applsci 09 01075 g001
Figure 2. Structure of the new model: (a) front view; (b) top view.
Applsci 09 01075 g002
Figure 3. Shape of mooring line with clump masses mounted at different locations: (a) P0, (b) P1, (c) P2, (d) P3, (e) P4, (f) P5.
Applsci 09 01075 g003aApplsci 09 01075 g003b
Figure 4. Dynamic response of the original OC3 model under the free decay condition calculated by the in-house developed code and FAST: (a) surge, (b) heave, and (c) pitch.
Applsci 09 01075 g004
Figure 5. Surge motion from 0 s to 900 s for (a) case 1, (c) case 2, and (e) case 3, and from 600 s to 900 s for (b) case 1, (d) case 2, and (f) case 3.
Applsci 09 01075 g005
Figure 6. Heave motion from 0 s to 900 s for (a) case 1, (c) case 2, and (e) case 3, and from 600 s to 900 s for (b) case 1, (d) case 2, and (f) case 3.
Applsci 09 01075 g006
Figure 7. Pitch motion from 0 s to 900 s for (a) case 1, (c) case 2, and (e) case 3, and from 600 s to 900 s for (b) case 1, (d) case 2, and (f) case 3.
Applsci 09 01075 g007
Figure 8. The maximum and minimum values and average values of surge motion from 600 s to 900 s for (a) case 1, (b) case 2, and (c) case 3.
Applsci 09 01075 g008
Figure 9. The maximum and minimum values and average values of heave motion from 600 s to 900 s for (a) case 1, (b) case 2, and (c) case 3.
Applsci 09 01075 g009aApplsci 09 01075 g009b
Figure 10. The maximum and minimum values and average values of pitch motion from 600 s to 900 s for (a) case 1, (b) case 2, and (c) case 3.
Applsci 09 01075 g010
Figure 11. Frequency domain amplitude at load case 4 for (a) surge, (c) heave, and (e) pitch, and the peak amplitudes for (b) surge, (d) heave, and (f) pitch.
Applsci 09 01075 g011aApplsci 09 01075 g011b
Figure 12. Frequency domain amplitude at load case 5 for (a) surge, (c) heave, and (e) pitch, and the peak amplitudes for (b) surge, (d) heave, and (f) pitch.
Applsci 09 01075 g012
Figure 13. Frequency domain amplitude at load case 6 for (a) surge, (c) heave, and (e) pitch, and the peak amplitudes for (b) surge, (d) heave, and (f) pitch.
Applsci 09 01075 g013
Figure 14. Fairlead tension in load case 1 for (a) fairlead 1, (b) fairlead 2.
Applsci 09 01075 g014
Figure 15. Fairlead tension in load case 2 for (a) fairlead 1, (b) fairlead 2.
Applsci 09 01075 g015
Figure 16. Fairlead tension in load case 3 for (a) fairlead 1, (b) fairlead 2.
Applsci 09 01075 g016
Figure 17. Fatigue loads of the mooring line in different load cases.
Applsci 09 01075 g017
Table 1. Comparison between the present research and that by Yuan [35] and Tore [36].
ResearchHydrodynamic TheoryPlatformDesignFatigue LoadFocusOptimized Parameter
Present studyPotential flow theorySpar Applsci 09 01075 i001YesOptimized position of the clump massesMotions of platform
Yuan’s study [30]Morison’s EquationSemi-submersible Applsci 09 01075 i002NoOptimized position and volume of the buoysTension of mooring line
Tore’s study [31]Generalized Morison’s EquationSpar Applsci 09 01075 i003NoOptimized size and position of the clump massesTension of mooring line
Table 2. Main properties of the OC3-Hywind model.
ItemValue
Rating5 MW
Rotor typeUpwind, 3 blades
Total draft below sea water level (SWL)120 m
Tower base above SWL10 m
Hub height above SWL90 m
Nacelle dimension (length, width, height)14.2 m, 2.3 m, 3.5 m
Platform diameter above taper6.5 m
Platform diameter below taper9.4 m
Rotor nacelle assembly (RNA) mass350,000 kg
Tower mass249,718 kg
Platform mass7,466,330 kg
Hub mass56,780 kg
Number of mooring lines3
Depth to fairleads below SWL70
Global coordinates of the anchor point 1(853.87 m, 0, −320 m)
Global coordinates of the fairlead point 1(5.2 m, 0, −70 m)
Mooring line diameter0.09 m
Mooring line mass density77.71 kg m−1
Table 3. Mooring system model properties.
ModelLMmCM
P000
P10.7L7061.74 kg
P20.6L7061.74 kg
P30.5L7061.74 kg
P40.4L7061.74 kg
P50.3L7061.74 kg
Note: P0 is the original model. LM is the distance from anchor. L is the length of mooring line, mCM is the mass of the clump masses.
Table 4. Settings of the load cases.
Load CasesH or Hs (m)T or Tp (s)Wind Speed (m/s)Wave
Case 16108Regular wave (Airy)
Case 22.5678Regular wave (Airy)
Case 3488Regular wave (Airy)
Case 46.78.68Irregular wave (P‒M)
Case 53.669.78Irregular wave (P‒M)
Case 69.1413.68Irregular wave (P‒M)

