A New Approach to the Study of Multi-Pass Welds–Microstructure and Properties of Welded 20-mm-Thick Superduplex Stainless Steel


Abstract
1. Introduction
2. Materials and Methods
2.1. Materials and Welding Experiments
2.2. Methodology to Study Multi-Pass Welds
2.3. Equipment and Testing
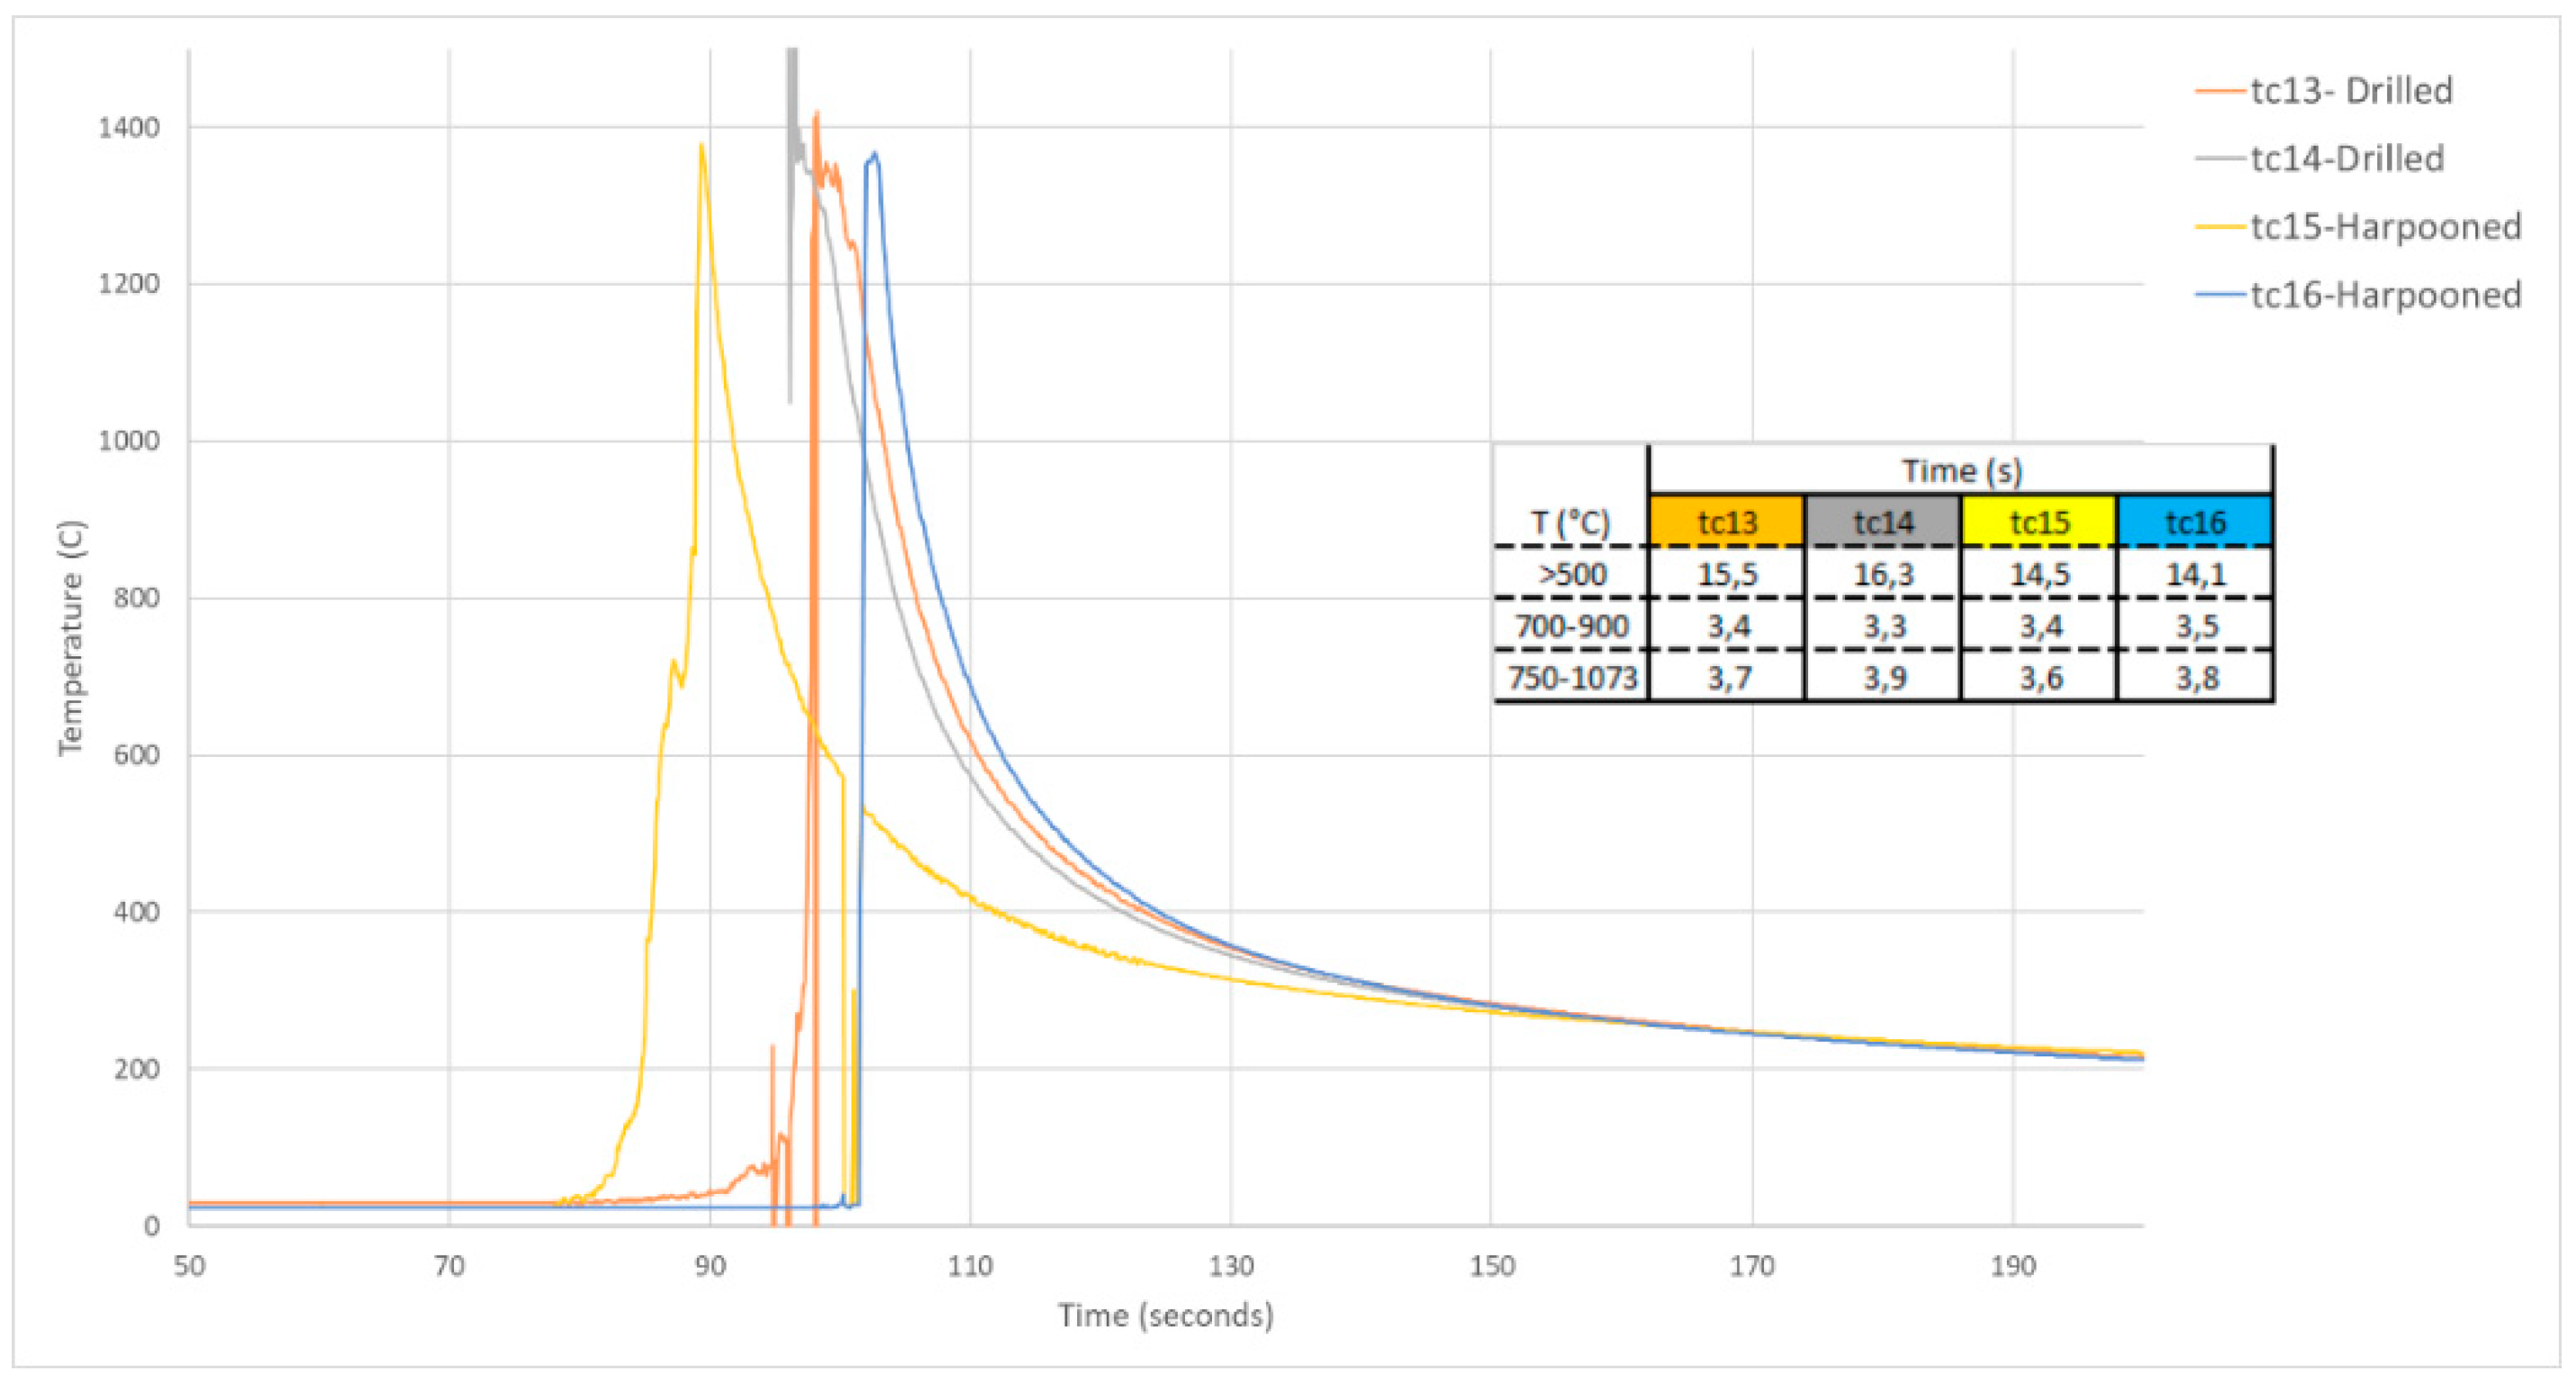
2.4. Evaluation of Thermal Cycles
3. Results
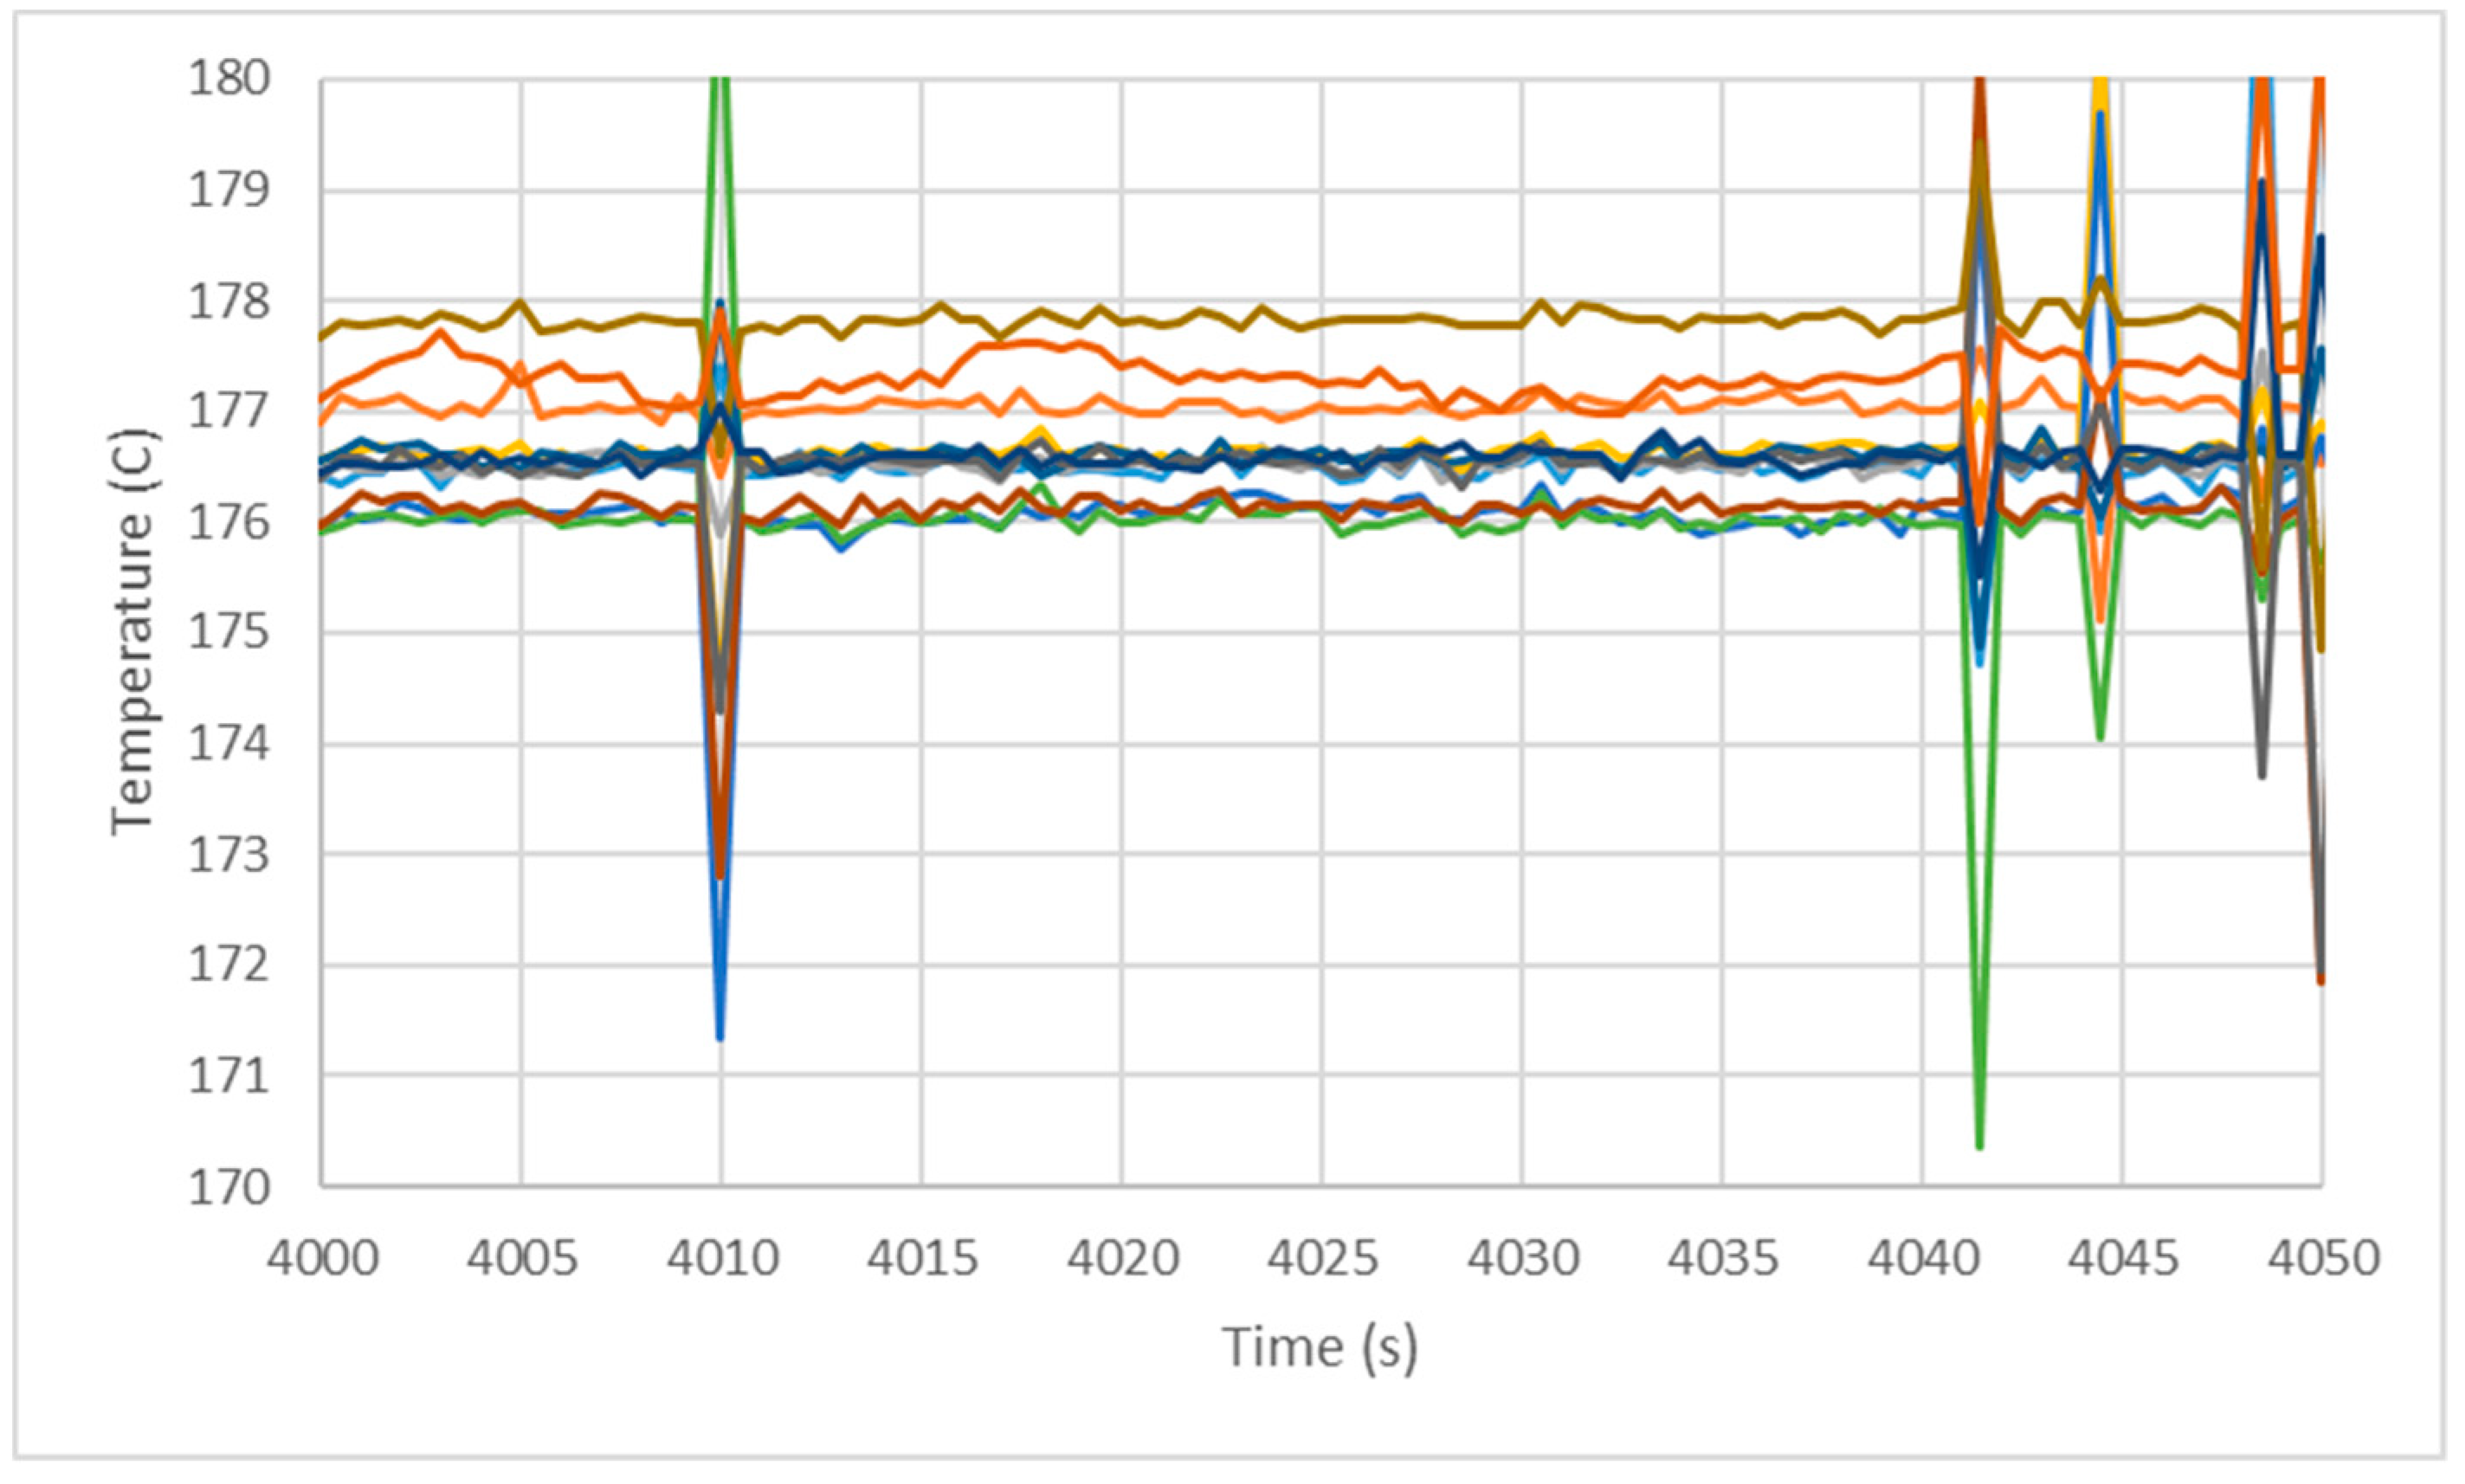
3.1. Reliability of Temperature Measurements
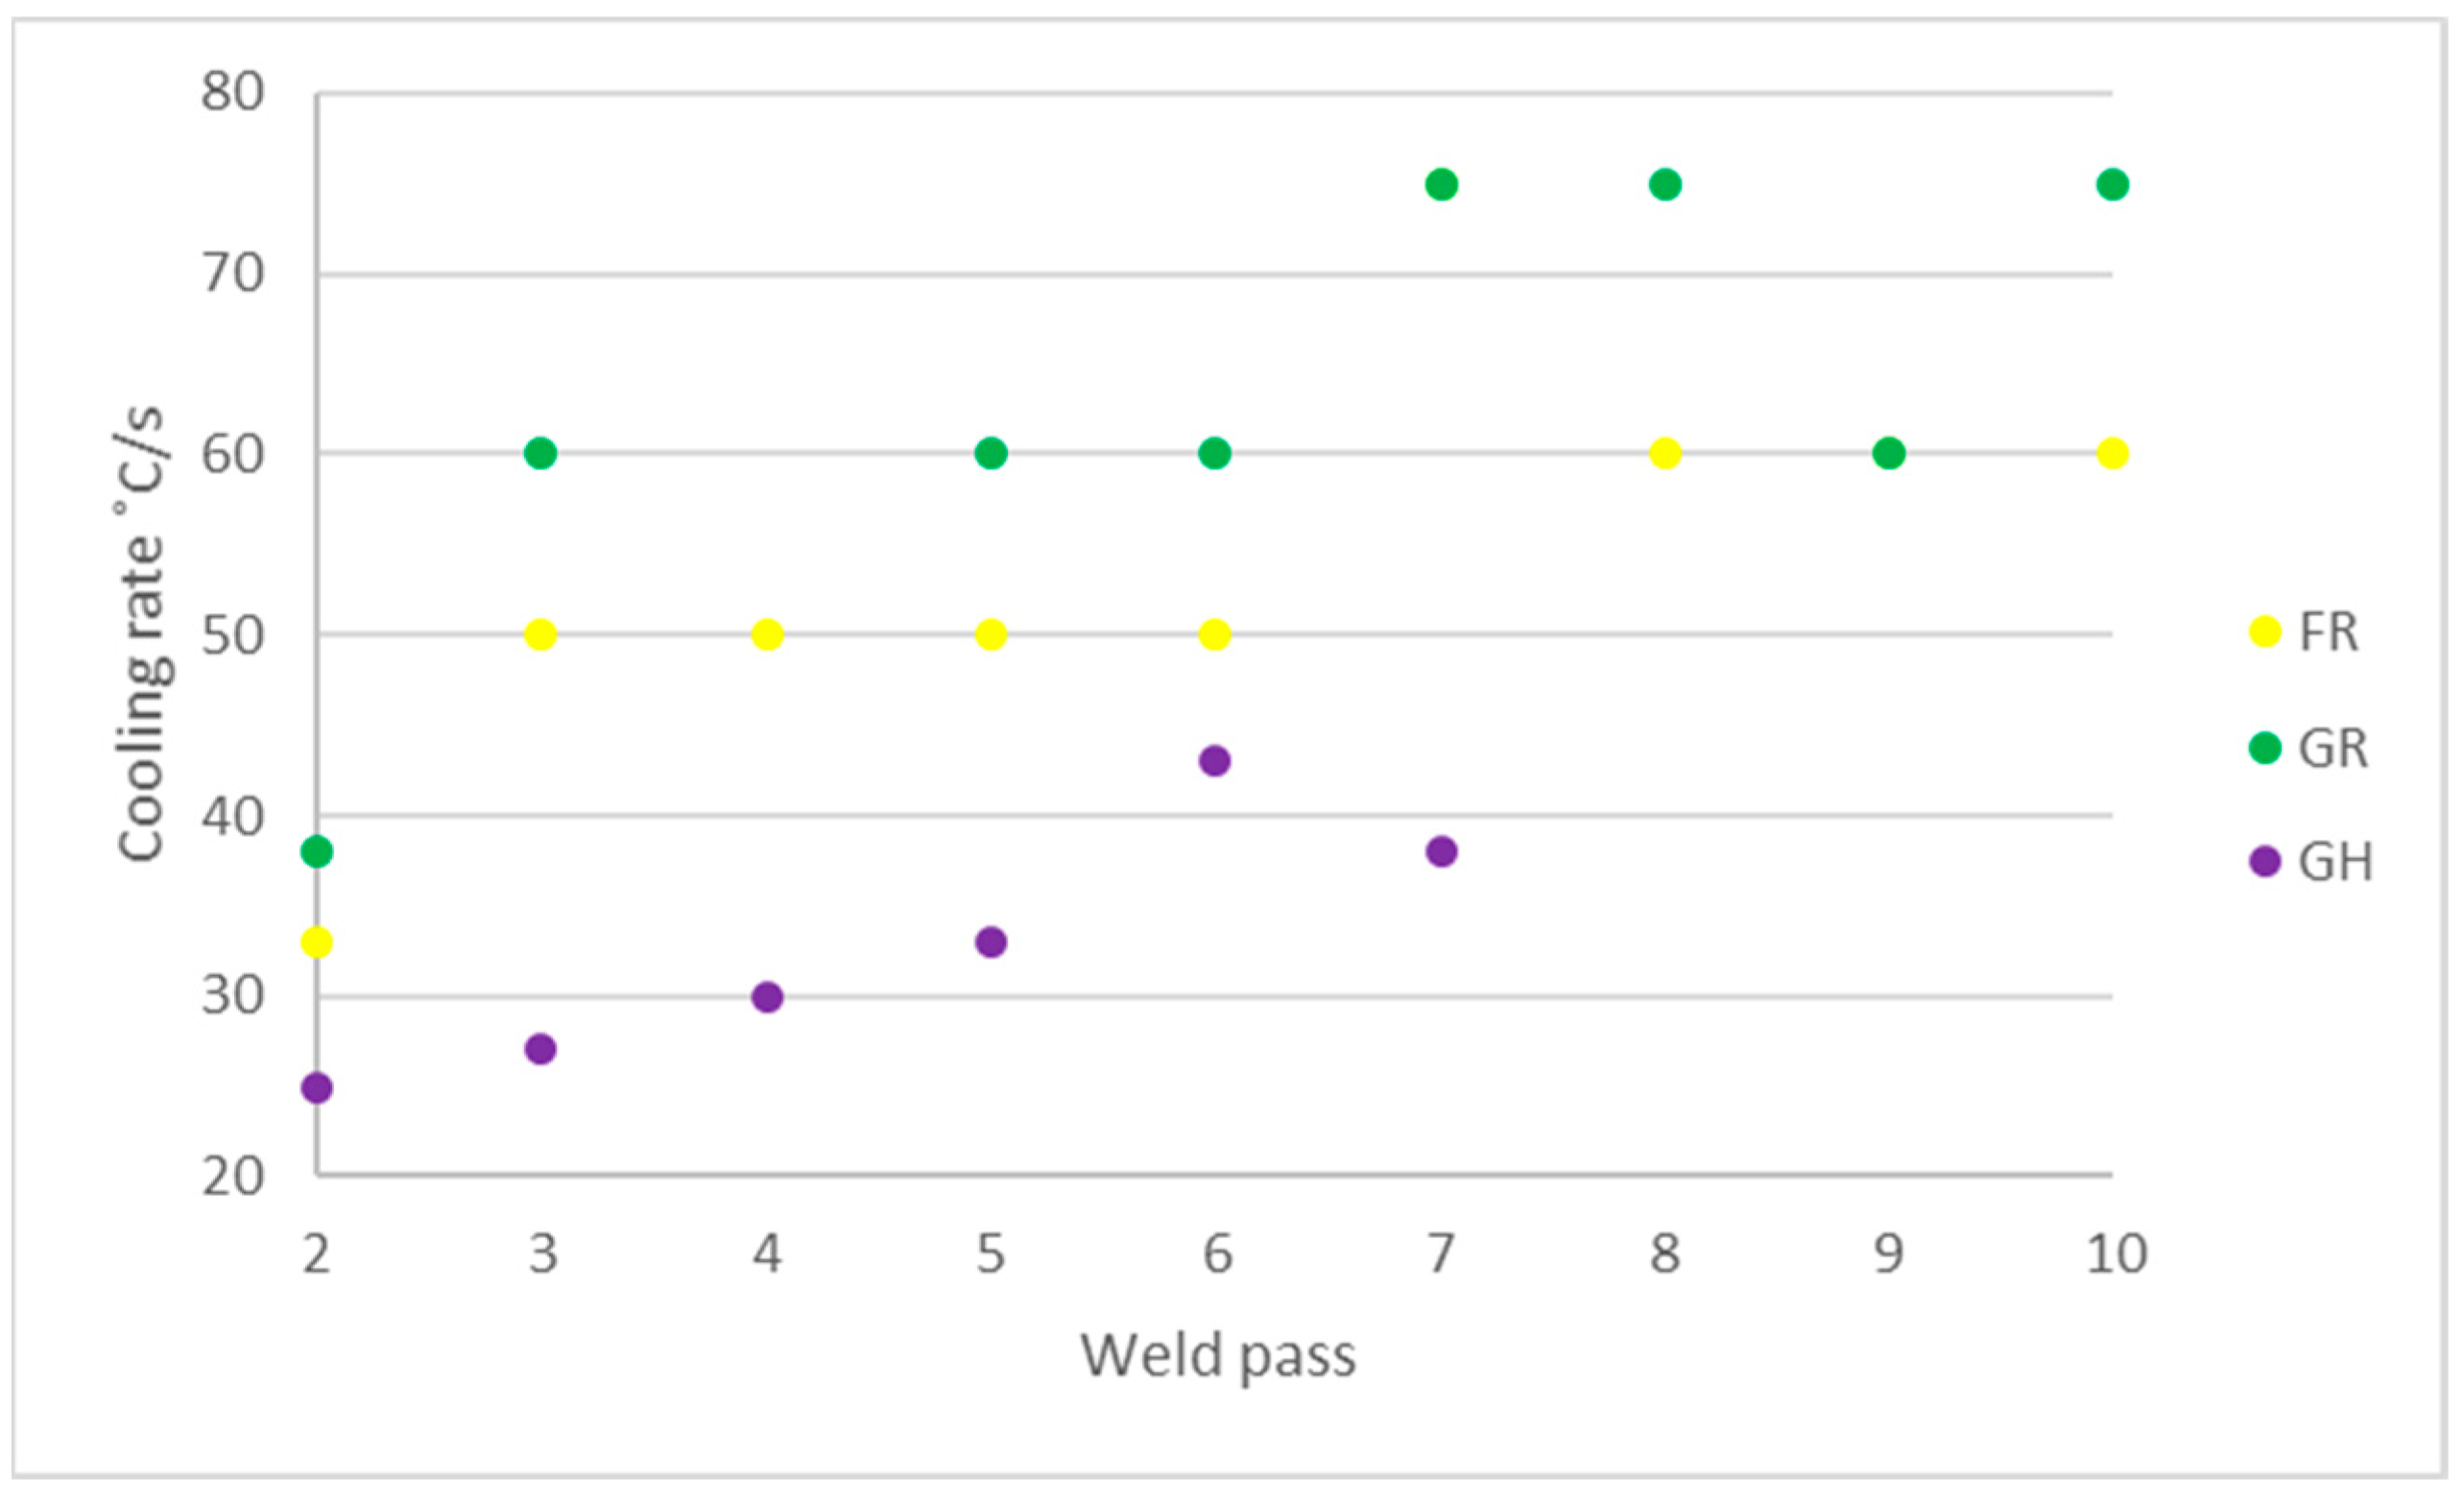
3.2. Cooling Rates
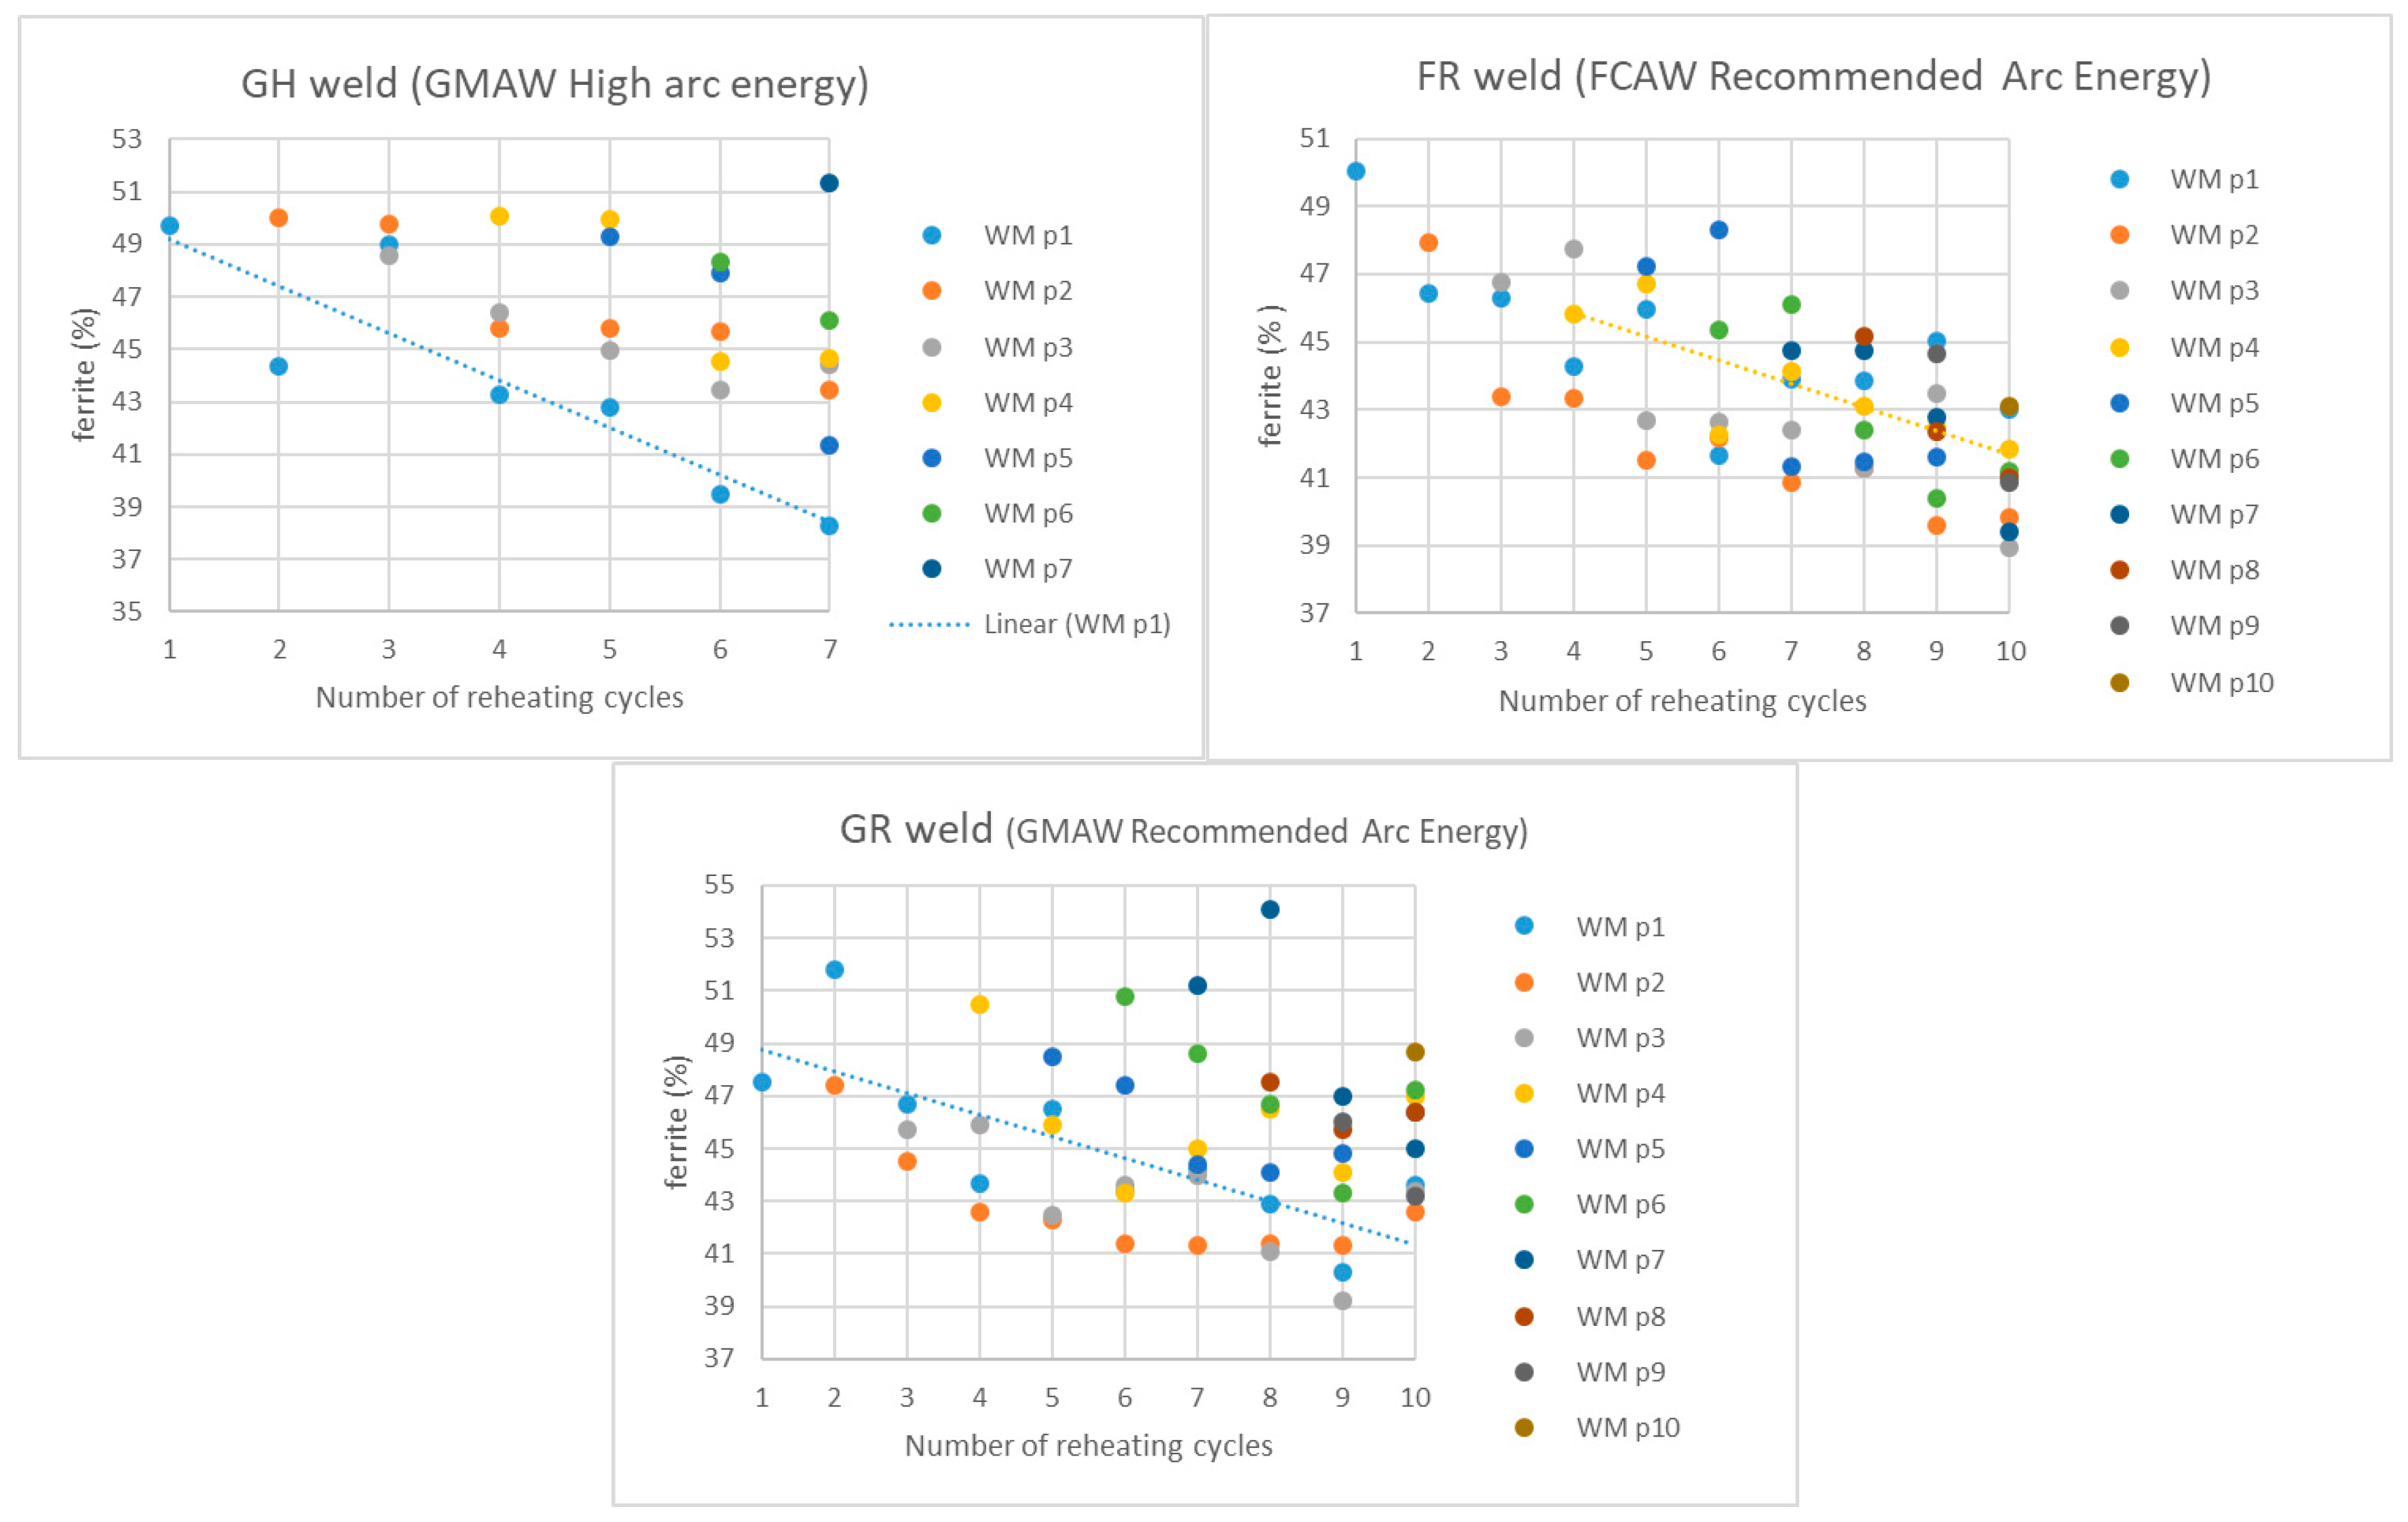
3.3. Phase Balance
3.4. Secondary Phases
3.5. The Welding Sequence Layout and the Thermal Cycles
3.6. Impact Toughness
3.7. Pitting Corrosion
4. Discussion
4.1. Methodology
4.2. Phases
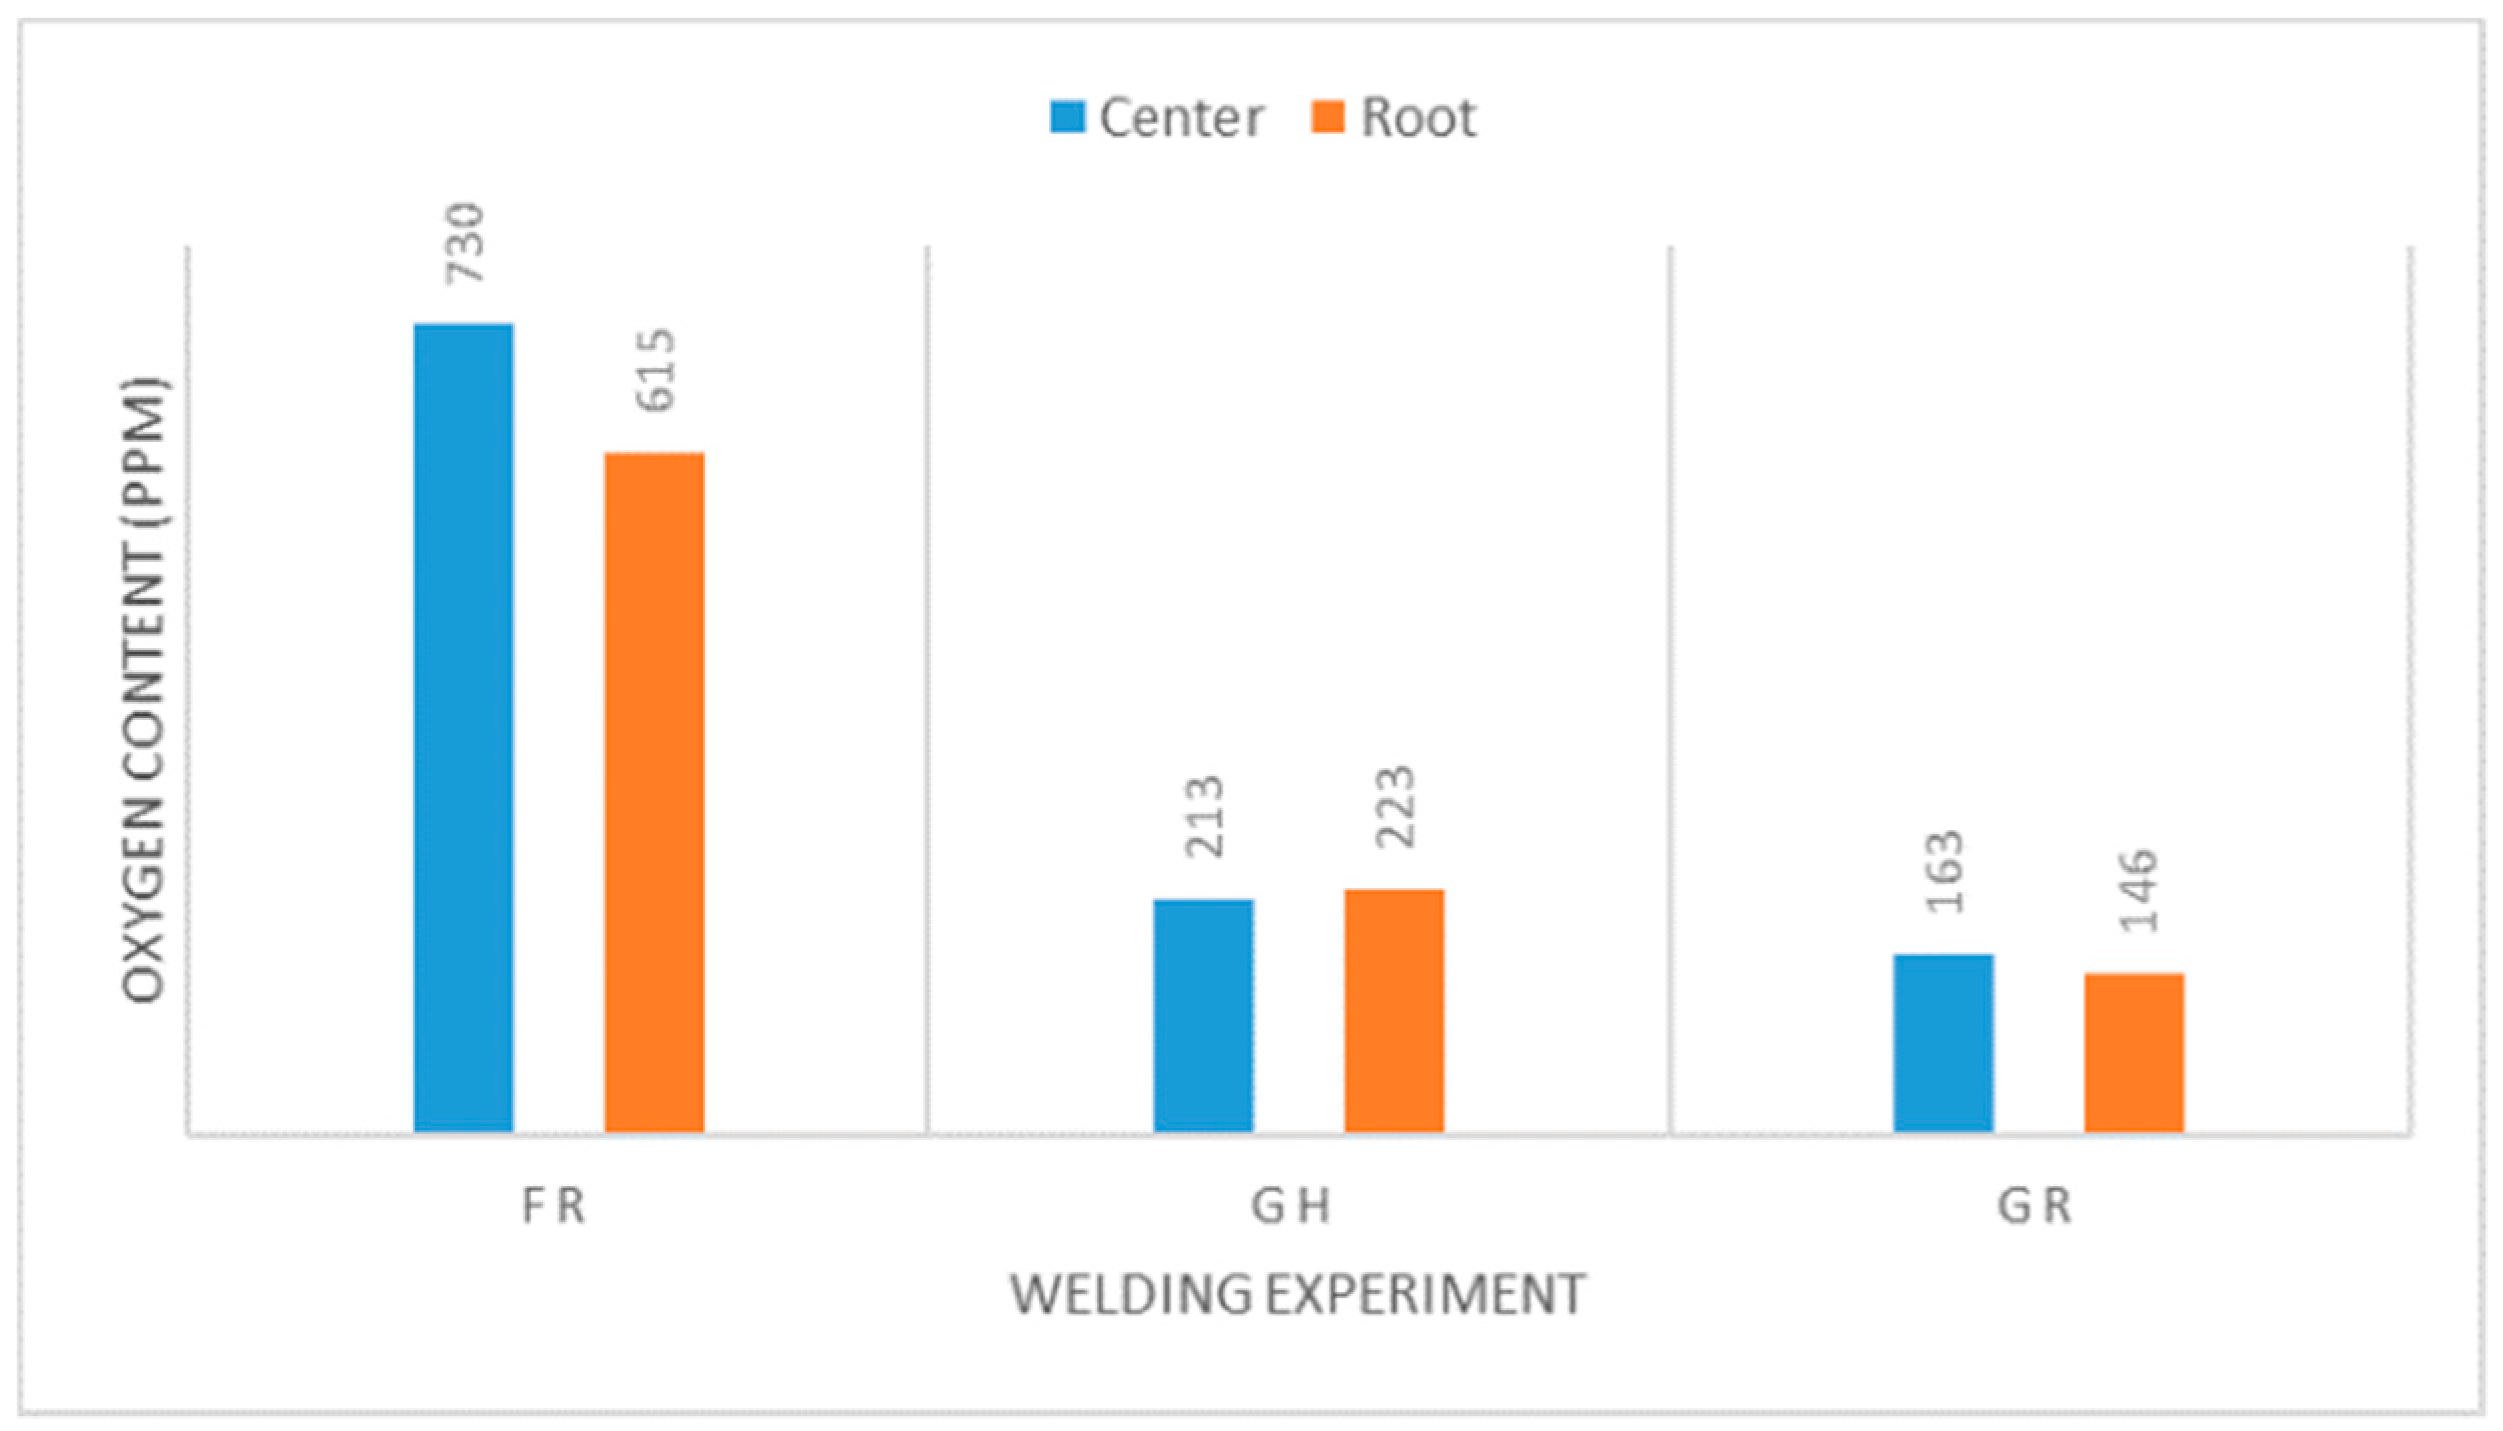
4.2.1. Ferrite
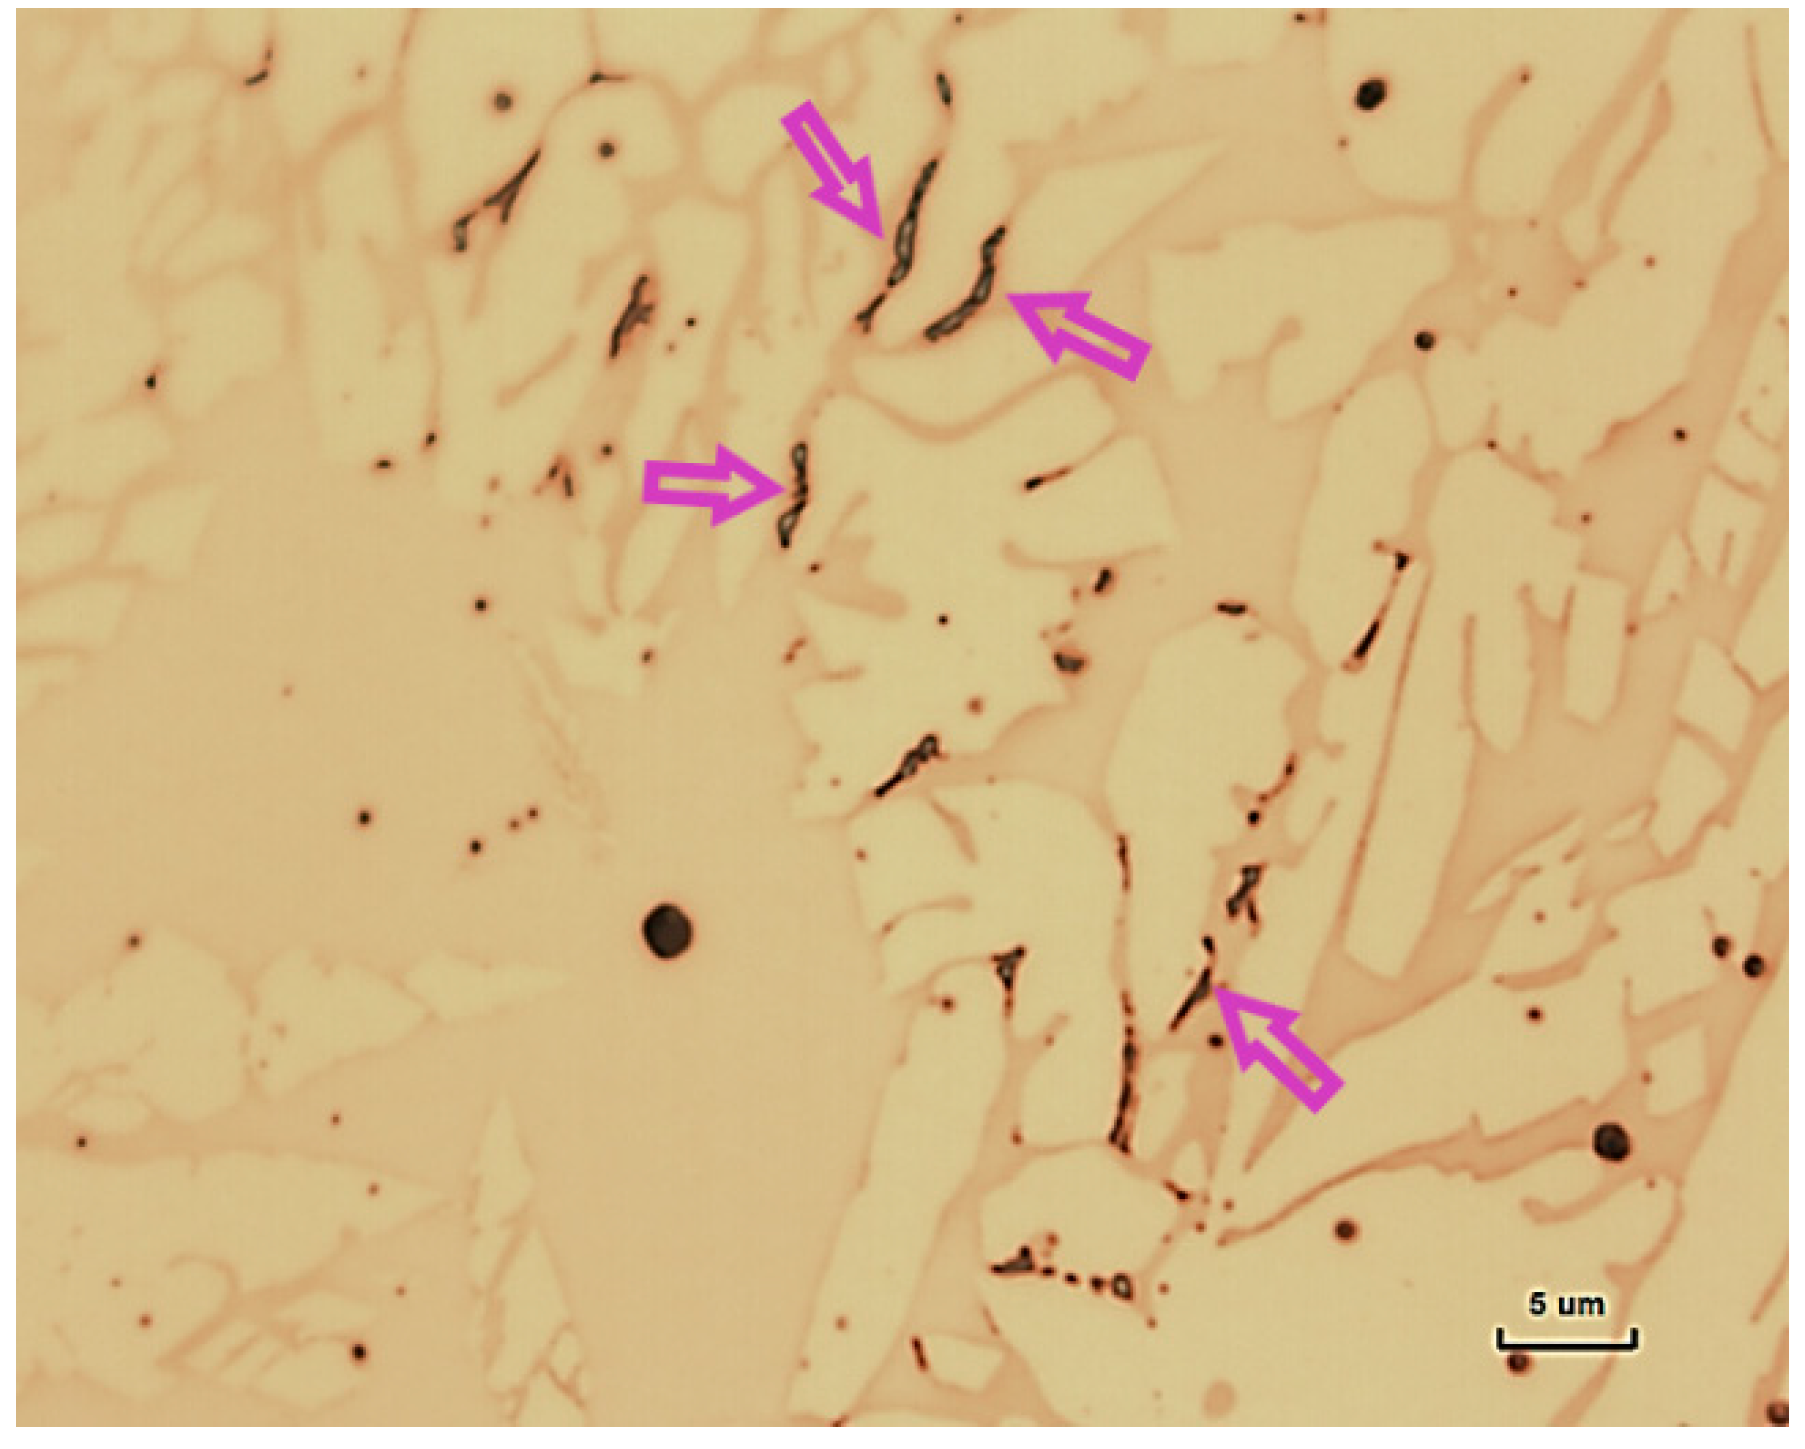
4.2.2. Nitrides
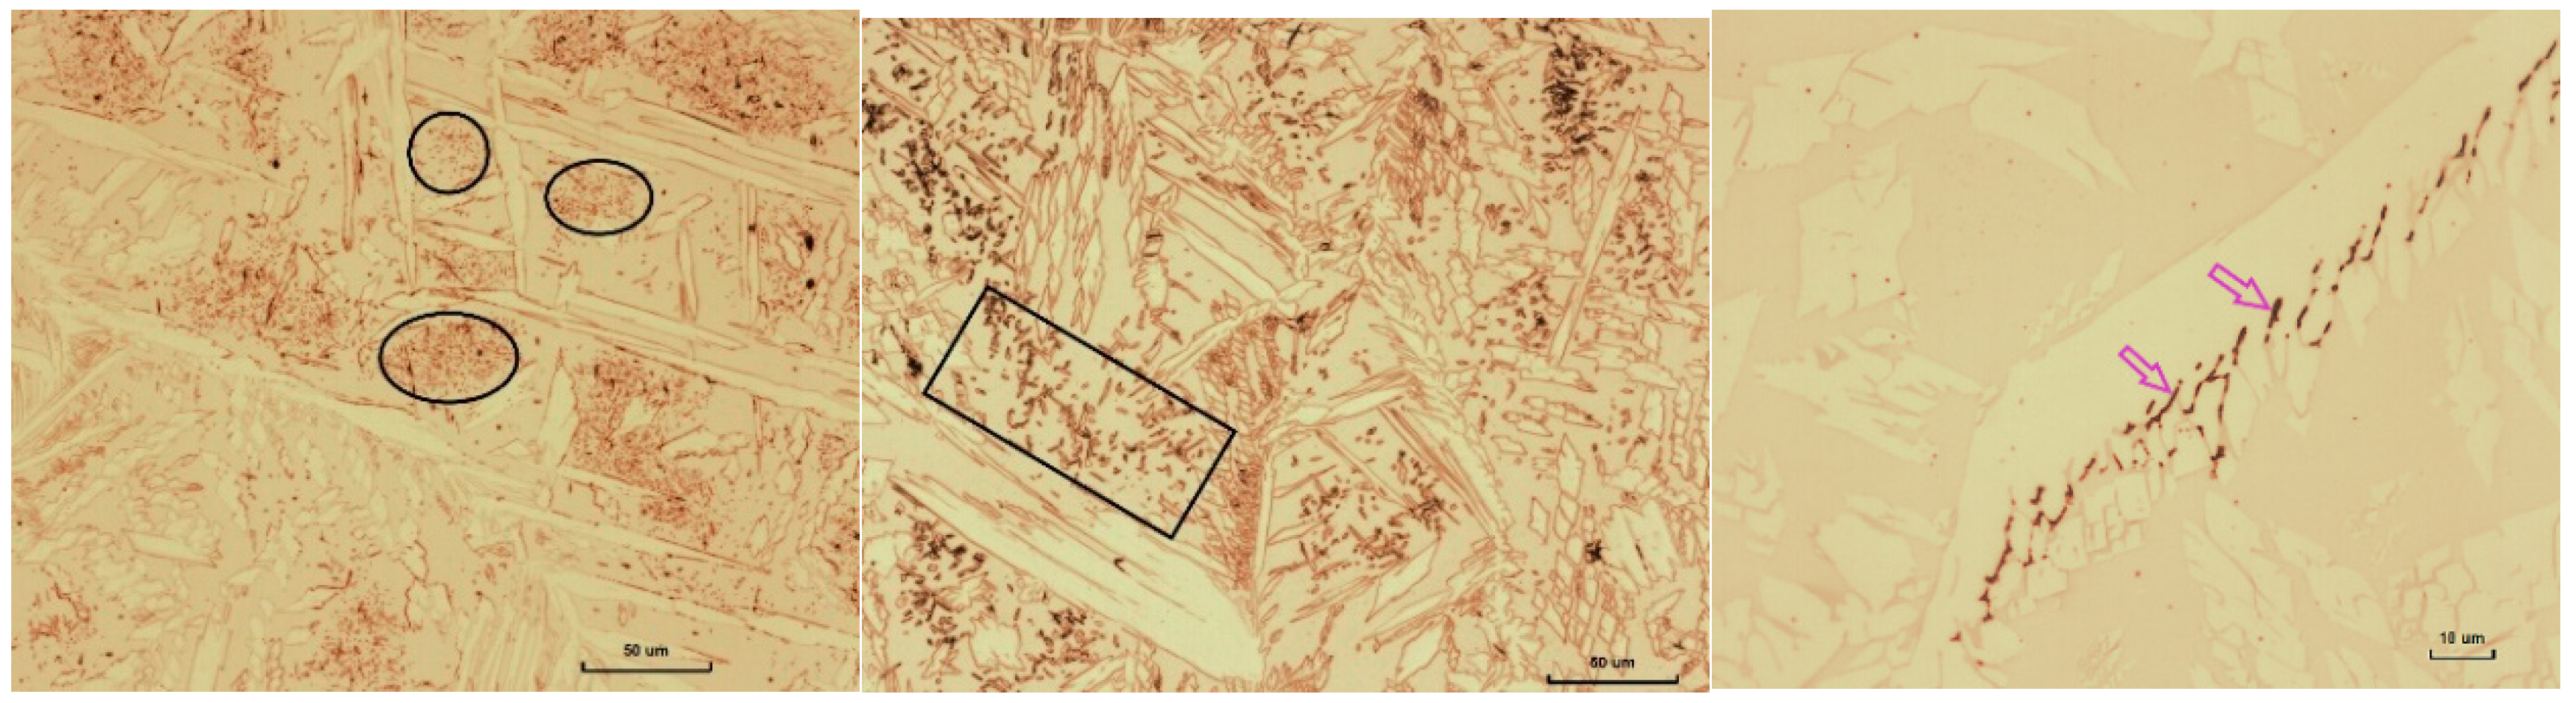
4.2.3. Secondary Austenite
4.2.4. σ-Phase
- (a)
- Locations for thermal recording and for metallographic inspection are different. The coupons for metallographic inspection were extracted from close to the end point of the weld, i.e. close to the downslope, whilst the thermal recording was done at the start of the weld.
- (b)
- It has been assumed that the temperatures registered locally and the cooling rates calculated are representative of the entire weld pass. However, in reality, there is a gradient in temperatures within the same weld pass, being the region close to the fusion boundary experiencing higher temperatures than the locations at a distance in the weld pass.
- (c)
- The σ-phase could form randomly along the longitudinal weld direction due to local compositional segregation, and the specific section evaluated might contain or might not contain σ-phase.
- (d)
- It might be that the kinetics to form σ-phase require longer times at lower temperatures than considered.
4.3. Properties
4.3.1. Toughness
4.3.2. Pitting Corrosion
4.4. Implications on Practical Welding
5. Conclusions
- Multi-pass 20 mm welds of superduplex plates were produced with GMAW and FCAW with recommended and higher arc energies accomplishing the impact toughness requirements.
- A new methodology for monitoring the thermal cycles and the microstructural evolution was shown to be successful and was consolidated.
- Reheating by subsequent passes caused a progressive increase in the austenite content of the weld metal.
- The cooling rate and not the time exposed at the critical temperature range is the key factor in the nitrides formation. However, when cooling rates are the same, larger ferrite grains enhanced the precipitation of nitrides, as it implied a longer distance for nitrogen to diffuse until reaching the austenite phase.
- A larger amount and concentration of secondary austenite and σ-phase was found for a larger number of subsequent passes in the immediate vicinity of a specific weld pass.
- Pitting corrosion preferentially initiated in locations with secondary austenite and σ-phase. However, when the weld metal was free from these secondary phases, the nitrides in the HAZ were the weakest location where pitting initiated.
- The results of this work have implications on practical welding for superduplex stainless steels: from the microstructural point of view, the current recommendations on maximum arc energy should be revised for large thickness weldments and the importance, of the welding sequence on the formation of secondary phases should be considered.
Author Contributions
Funding
Acknowledgments
Conflicts of Interest
References
- Charles, J. Duplex stainless steels, a review after DSS’07 held in Grado. In Proceedings of the Duplex Stainless Steel Conference, Maastricht, The Netherlands, 18–20 June 2007; 22p. [Google Scholar]
- Karlsson, L. Intermetallic Phase Precipitation in Duplex Stainless Steels and Weld Metals Metallurgy, Influence on Properties and Welding Aspects. Weld. World 1999, 43, 20–41. [Google Scholar]
- Karlsson, L.; Rigdal, S.; Pak, S. Effects of elemental distribution on precipitation behaviour and properties of duplex stainless steel weldments. In Proceedings of the Duplex Stainless Steel Conference, Venice, Italy, 17–20 October 2000. [Google Scholar]
- Valiente Bermejo, M.A.; Karlsson, L.; DebRoy, T. Influence of low energy laser welding on solidification and microstructure of austenitic stainless steel welds. In Proceedings of the NOLAMP-14 Conference, Göteborg, Sweden, 26–28 August 2013; pp. 3–14. [Google Scholar]
- Valiente Bermejo, M.A.; DebRoy, T.; Hurtig, K.; Karlsson, L.; Svensson, L.-E. Towards a map of solidification cracking risk in laser welding of austenitic stainless steels. Phys. Procedia 2015, 78, 230–239. [Google Scholar] [CrossRef]
- Hosseini, V.A.; Valiente Bermejo, M.A.; Gårdstam, J.; Hurtig, K.; Karlsson, L. Influence of multiple thermal cycles on microstructure of heat-affected zone in TIG-welded super duplex stainless steel. Weld. World 2016, 60, 233–245. [Google Scholar] [CrossRef]
- Hosseini, V.A.; Wessman, S.; Hurtig, K.; Karlsson, L. Nitrogen loss and effects on microstructure in multipass TIG welding of a super duplex stainless steel. Mater. Des. 2016, 98, 88–97. [Google Scholar] [CrossRef]
- Segerstark, A.; Andersson, J.; Svensson, L.-E. Evaluation of a temperature measurement method developed for laser metal deposition. Sci. Technol. Weld. Join. 2016, 22, 1–6. [Google Scholar] [CrossRef]
- How to Weld Duplex Stainless Steels; Document 10601EN-GB; Avesta Welding AB: Avesta, Sweden, 2006; 20p.
- Welding Guidelines for Duplex & Superduplex Stainless Steels; Metrode Products Ltd.: Chertsey, UK, 2005; 7p.
- Pettersson, C.-O.; Fager, S.-Å. Welding Practice for the Sandvik Duplex Stainless Steels SAF 2304, SAF 2205 and SAF 2507; Technical Document S-91-57; AB Sandvik Steel: Stockholm, Sweden, 1995; 15p. [Google Scholar]
- Valiente Bermejo, M.A.; Karlsson, L.; Svensson, L.-E.; Hurtig, K.; Rasmuson, H.; Frodigh, M.; Bengtsson, P. Effect of shielding gas on welding performance and properties of duplex and superduplex stainless steel welds. Weld. World 2015, 59, 239–249. [Google Scholar] [CrossRef]
- Valiente Bermejo, M.A.; Karlsson, L.; Svensson, L.-E.; Hurtig, K.; Rasmuson, H.; Frodigh, M.; Bengtsson, P. Effect of welding position on properties of duplex and superduplex stainless steel circumferential welds. Weld. World 2015, 59, 693–703. [Google Scholar] [CrossRef]
- Stützer, J.; Zinke, M.; Jüttner, S. Studies on the pore formation in super duplex stainless steel welds. Weld. World 2017, 61, 351–359. [Google Scholar] [CrossRef]
- Swedish Standards Institute. ISO 9016:2012. Destructive Tests on Welds in Metallic Materials—Impact Test—Test Specimen Location, Notch Orientation and Examination; Swedish Standards Institute: Stockholm, Sweden; 20p.
- ASTM International G48. Standard Test Methods for Pitting and Crevice Corrosion Resistance of Stainless Steels and Related Alloys by Use of Ferric Chloride Solution; ASTM International: West Conshohocken, PA, USA, 2011; 11p. [Google Scholar]
- ASTM International G150-99. Standard Test Method for Electrochemical Critical Pitting Temperature Testing of Stainless Steels; ASTM International: West Conshohocken, PA, USA, 2004; 13p. [Google Scholar]
- Nilsson, J.-O.; Chai, G. The physical metallurgy of DSS. In Proceedings of the Duplex Stainless Steel Conference, Beaune, France, 13–15 October 2010; pp. 369–390. [Google Scholar]
- Pettersson, N.; Wessman, S.; Hertzman, S.; Studer, A. High-Temperature Phase Equilibria of Duplex Stainless Steels Assessed with a Novel In-Situ Neutron Scattering Approach. Metall. Mater. Trans. 2017, 48, 1562–1571. [Google Scholar] [CrossRef]
- Standards Norway. NORSOK Standard M-601. Rev. 4, Welding and inspection of piping. 2004; 20p. [Google Scholar]
- Valiente Bermejo, M.A.; Hurtig, K.; Hosseini, V.A.; Karlsson, L.; Svensson, L.-E. Monitoring thermal cycles in multi-pass welding. In Proceedings of the 7th International Swedish Production Symposium (SPS-16), Lund, Sweden, 25–27 October 2016. [Google Scholar]
- Valiente Bermejo, M.A.; Hurtig, K.; Karlsson, L.; Svensson, L.-E. A step forward in understanding superduplex multi-pass welds by monitoring thermal cycles. In Proceedings of the 70th IIW Annual Assembly, Shanghai, China, 28 June 2017. [Google Scholar]
- Ramirez, A.J.; Brandi, S.D.; Lippold, J.C. Secondary austenite and chromium nitride precipitation in simulated heat affected zones of duplex stainless steels. Sci. Technol. Weld. Join. 2013, 9, 301–313. [Google Scholar] [CrossRef]
- Hosseini, V.A. Influence of Multiple Welding Cycles on Microstructure and Corrosion Resistance of a Super Duplex Stainless Steel. Licentiate Thesis, University West, Trollhättan, Sweden, 2016. [Google Scholar]
- Hosseini, V.A.; Karlsson, L.; Engelberg, D.; Wessman, S. Time-temperature-precipitation and property diagrams for super duplex stainless steel weld metals. Weld. World 2018, 62, 517–533. [Google Scholar] [CrossRef]
- Zhang, Z.; Jing, H.; Xu, L.; Han, Y.; Zhao, L. Investigation on microstructure evolution and properties of duplex stainless steel joint multi-pass welded by using different methods. Mater. Des. 2016, 109, 670–685. [Google Scholar] [CrossRef]
- Hosseini, V.A.; Hurtig, K.; Karlsson, L. Effect of multipass TIG welding on the corrosion resistance and microstructure of a super duplex stainless steel. Mater. Corros. 2017, 68, 405–415. [Google Scholar] [CrossRef]
- Hosseini, V.; Karlsson, L.; Wessman, S.; Fuertes, N. Effect of sigma phase morphology on the degradation of properties in a super duplex stainless steel. Materials 2018, 11, 933. [Google Scholar] [CrossRef] [PubMed]
- Yousefieh, M.; Shamanian, M.; Saatchi, A. Influence of step annealing temperature on the microstructure and pitting corrosion resistance of SDSS UNS S32760 welds. J. Mater. Eng. Perform. 2011, 20, 1678–1683. [Google Scholar] [CrossRef]
- Kobayashi, D.Y.; Wolynec, S. Evaluation of the low corrosion resistant phase formed during the sigma phase precipitation in duplex stainless steels. Mater. Res. 1999, 2, 239–247. [Google Scholar] [CrossRef]
- Nilsson, J.-O.; Karlsson, L.; Andersson, J.-O. Secondary austenite formation and its relation to pitting corrosion in duplex stainless steel weld metal. Mater. Sci. Technol. 1995, 11, 276–283. [Google Scholar] [CrossRef]


| Ref. | Welding Process | Arc Energy (kJ/mm) | Recorded Inter-Pass Temperature (°C) | Joint Prep. | Number of Weld Passes | |
|---|---|---|---|---|---|---|
| Root Pass (p1) | Pass 2 to Last Pass | |||||
| GR | GMAW | 1.5 | 1.2–1.3 | 80–100 | V with GTAW root | 10 |
| FR | FCAW | 1.5 | 1.1–1.3 | 80–100 | V with ceramic backing | 10 |
| GH | GMAW | 2.0 | 2.2 | 174–196 | V with ceramic backing | 7 |
| Designation | C | Si | Mn | P | S | Cr | Ni | Mo | Cu | N | W |
|---|---|---|---|---|---|---|---|---|---|---|---|
| 20 mm plate EN 1.4410, UNS S32750 | 0.012 | 0.38 | 0.76 | 0.023 | 0.001 | 25.1 | 6.91 | 3.82 | 0.22 | 0.29 | - |
| GTAW: AWS SFA5.9 ER2594 | 0.013 | 0.46 | 0.65 | 0.016 | 0.001 | 25.16 | 9.25 | 3.91 | 0.09 | 0.270 | 0.01 |
| GMAW: AWS SFA5.9 ER2594 | 0.015 | 0.40 | 0.61 | 0.014 | 0.001 | 25.23 | 9.22 | 4.04 | 0.09 | 0.260 | 0.04 |
| FCAW: AWS SFA5.22 E2594T1-4/-1 | 0.026 | 0.66 | 1.07 | 0.023 | 0.004 | 25.81 | 9.57 | 3.70 | 0.09 | 0.230 | 0.01 |
| Experiment | Section Investigated and Microstructural Features Observed | CPT * (°C) | Location of Pitting Initiation |
|---|---|---|---|
| GR | Section investigated includes Weld Pass 2 and HAZ. The weld metal showed very few nitrides but the HAZ contained extensive amounts of nitrides | 70.2 | In the HAZ |
| GH | Section investigated includes weld passes 2 and 3 and HAZ. The weld metal showed ɣ2 and σ-phase and the HAZ contained nitrides. | 73.2 | In the weld metal |
© 2019 by the authors. Licensee MDPI, Basel, Switzerland. This article is an open access article distributed under the terms and conditions of the Creative Commons Attribution (CC BY) license (http://creativecommons.org/licenses/by/4.0/).
Share and Cite
Valiente Bermejo, M.A.; Hurtig, K.; Eyzop, D.; Karlsson, L. A New Approach to the Study of Multi-Pass Welds–Microstructure and Properties of Welded 20-mm-Thick Superduplex Stainless Steel. Appl. Sci. 2019, 9, 1050. https://doi.org/10.3390/app9061050
Valiente Bermejo MA, Hurtig K, Eyzop D, Karlsson L. A New Approach to the Study of Multi-Pass Welds–Microstructure and Properties of Welded 20-mm-Thick Superduplex Stainless Steel. Applied Sciences. 2019; 9(6):1050. https://doi.org/10.3390/app9061050
Chicago/Turabian StyleValiente Bermejo, Maria Asuncion, Kjell Hurtig, Daniel Eyzop, and Leif Karlsson. 2019. "A New Approach to the Study of Multi-Pass Welds–Microstructure and Properties of Welded 20-mm-Thick Superduplex Stainless Steel" Applied Sciences 9, no. 6: 1050. https://doi.org/10.3390/app9061050
APA StyleValiente Bermejo, M. A., Hurtig, K., Eyzop, D., & Karlsson, L. (2019). A New Approach to the Study of Multi-Pass Welds–Microstructure and Properties of Welded 20-mm-Thick Superduplex Stainless Steel. Applied Sciences, 9(6), 1050. https://doi.org/10.3390/app9061050