Systematic Literature Review of Predictive Analysis Tools in Higher Education †
Abstract
1. Introduction
- RQ1: What are the most important purposes of using predictive algorithms in higher education, and how are they implemented?
- RQ2: Which are the most notable examples of early warning systems applied in higher education scenarios?
2. Methodology
2.1. Search Procedure
- early warning system
- predictive analy*
- predictive algorithm
- 1 OR 2 OR 3
- education
- university
- 4 AND 5 AND 6
- disaster
- medical
- health
- 7 AND NOT 8 AND NOT 9 AND NOT 10
2.2. Selection Process
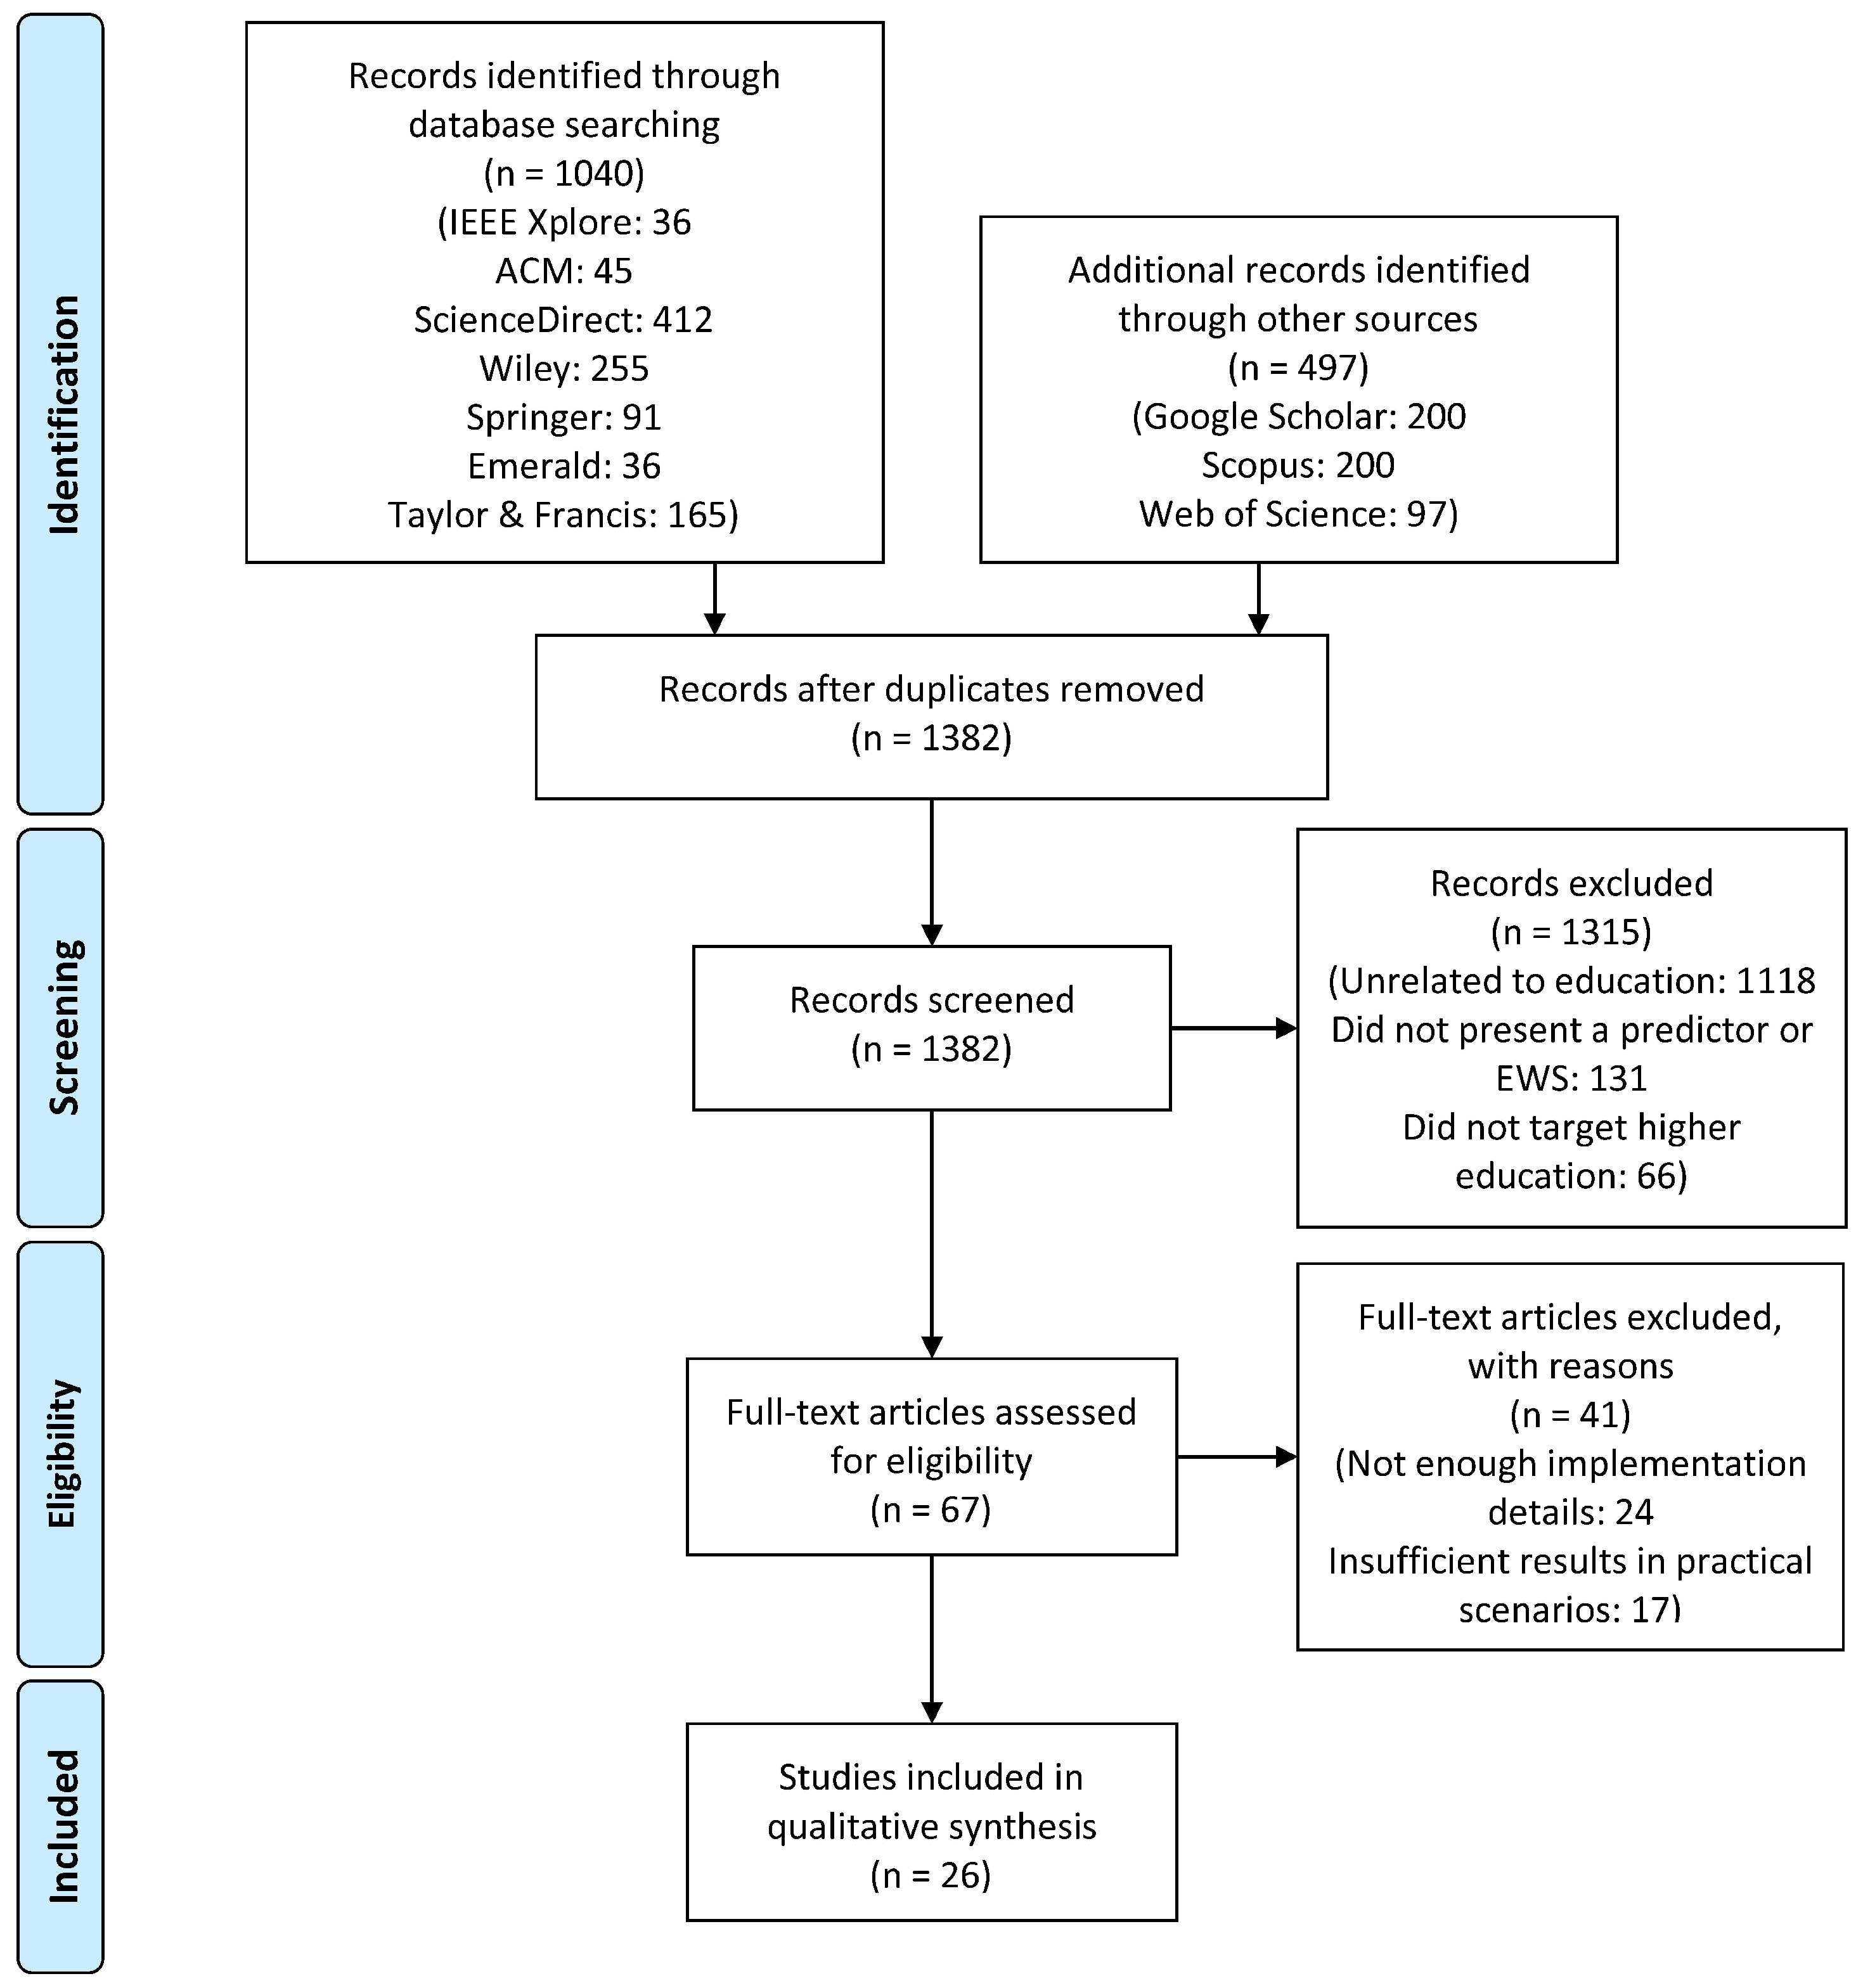
- The document is not related to the educational field (1118 papers).
- The document is related to education, but does not present the use of a predictive algorithm or EWS (111 papers).
- The document presents the use of a predictive algorithm or EWS in education, but in a context other than higher education (66 papers, most of them centered around massive open online courses (MOOCs)).
- Date on which the document was published.
- Problem that the predictor or EWS seeks to solve.
- The prediction goal of the algorithm or application (such as student grades or dropout likelihood).
- Types of data used as input.
- Technical aspects about the predictive algorithm or algorithms that the application uses.
- User collective that received the output information (most commonly either students or teachers).
- How the output information was presented to the end user.
- Specific higher education context where the tool was applied.
- Number of students that were involved in the study.
- Reliability of predictions made by the predictor or EWS.
- Evaluation of the application’s impact over the students.
- Any other unique aspect that differentiates the particular predictor or EWS from the rest.
- The document was missing important information about the predictor or EWS’s implementation, and inner workings (24 papers).
- The results of applying the predictor or EWS in real higher education scenarios were insufficient, nonexistent, or poorly detailed (17 papers).
3. Results
3.1. Predictors
3.2. Early Warning Systems
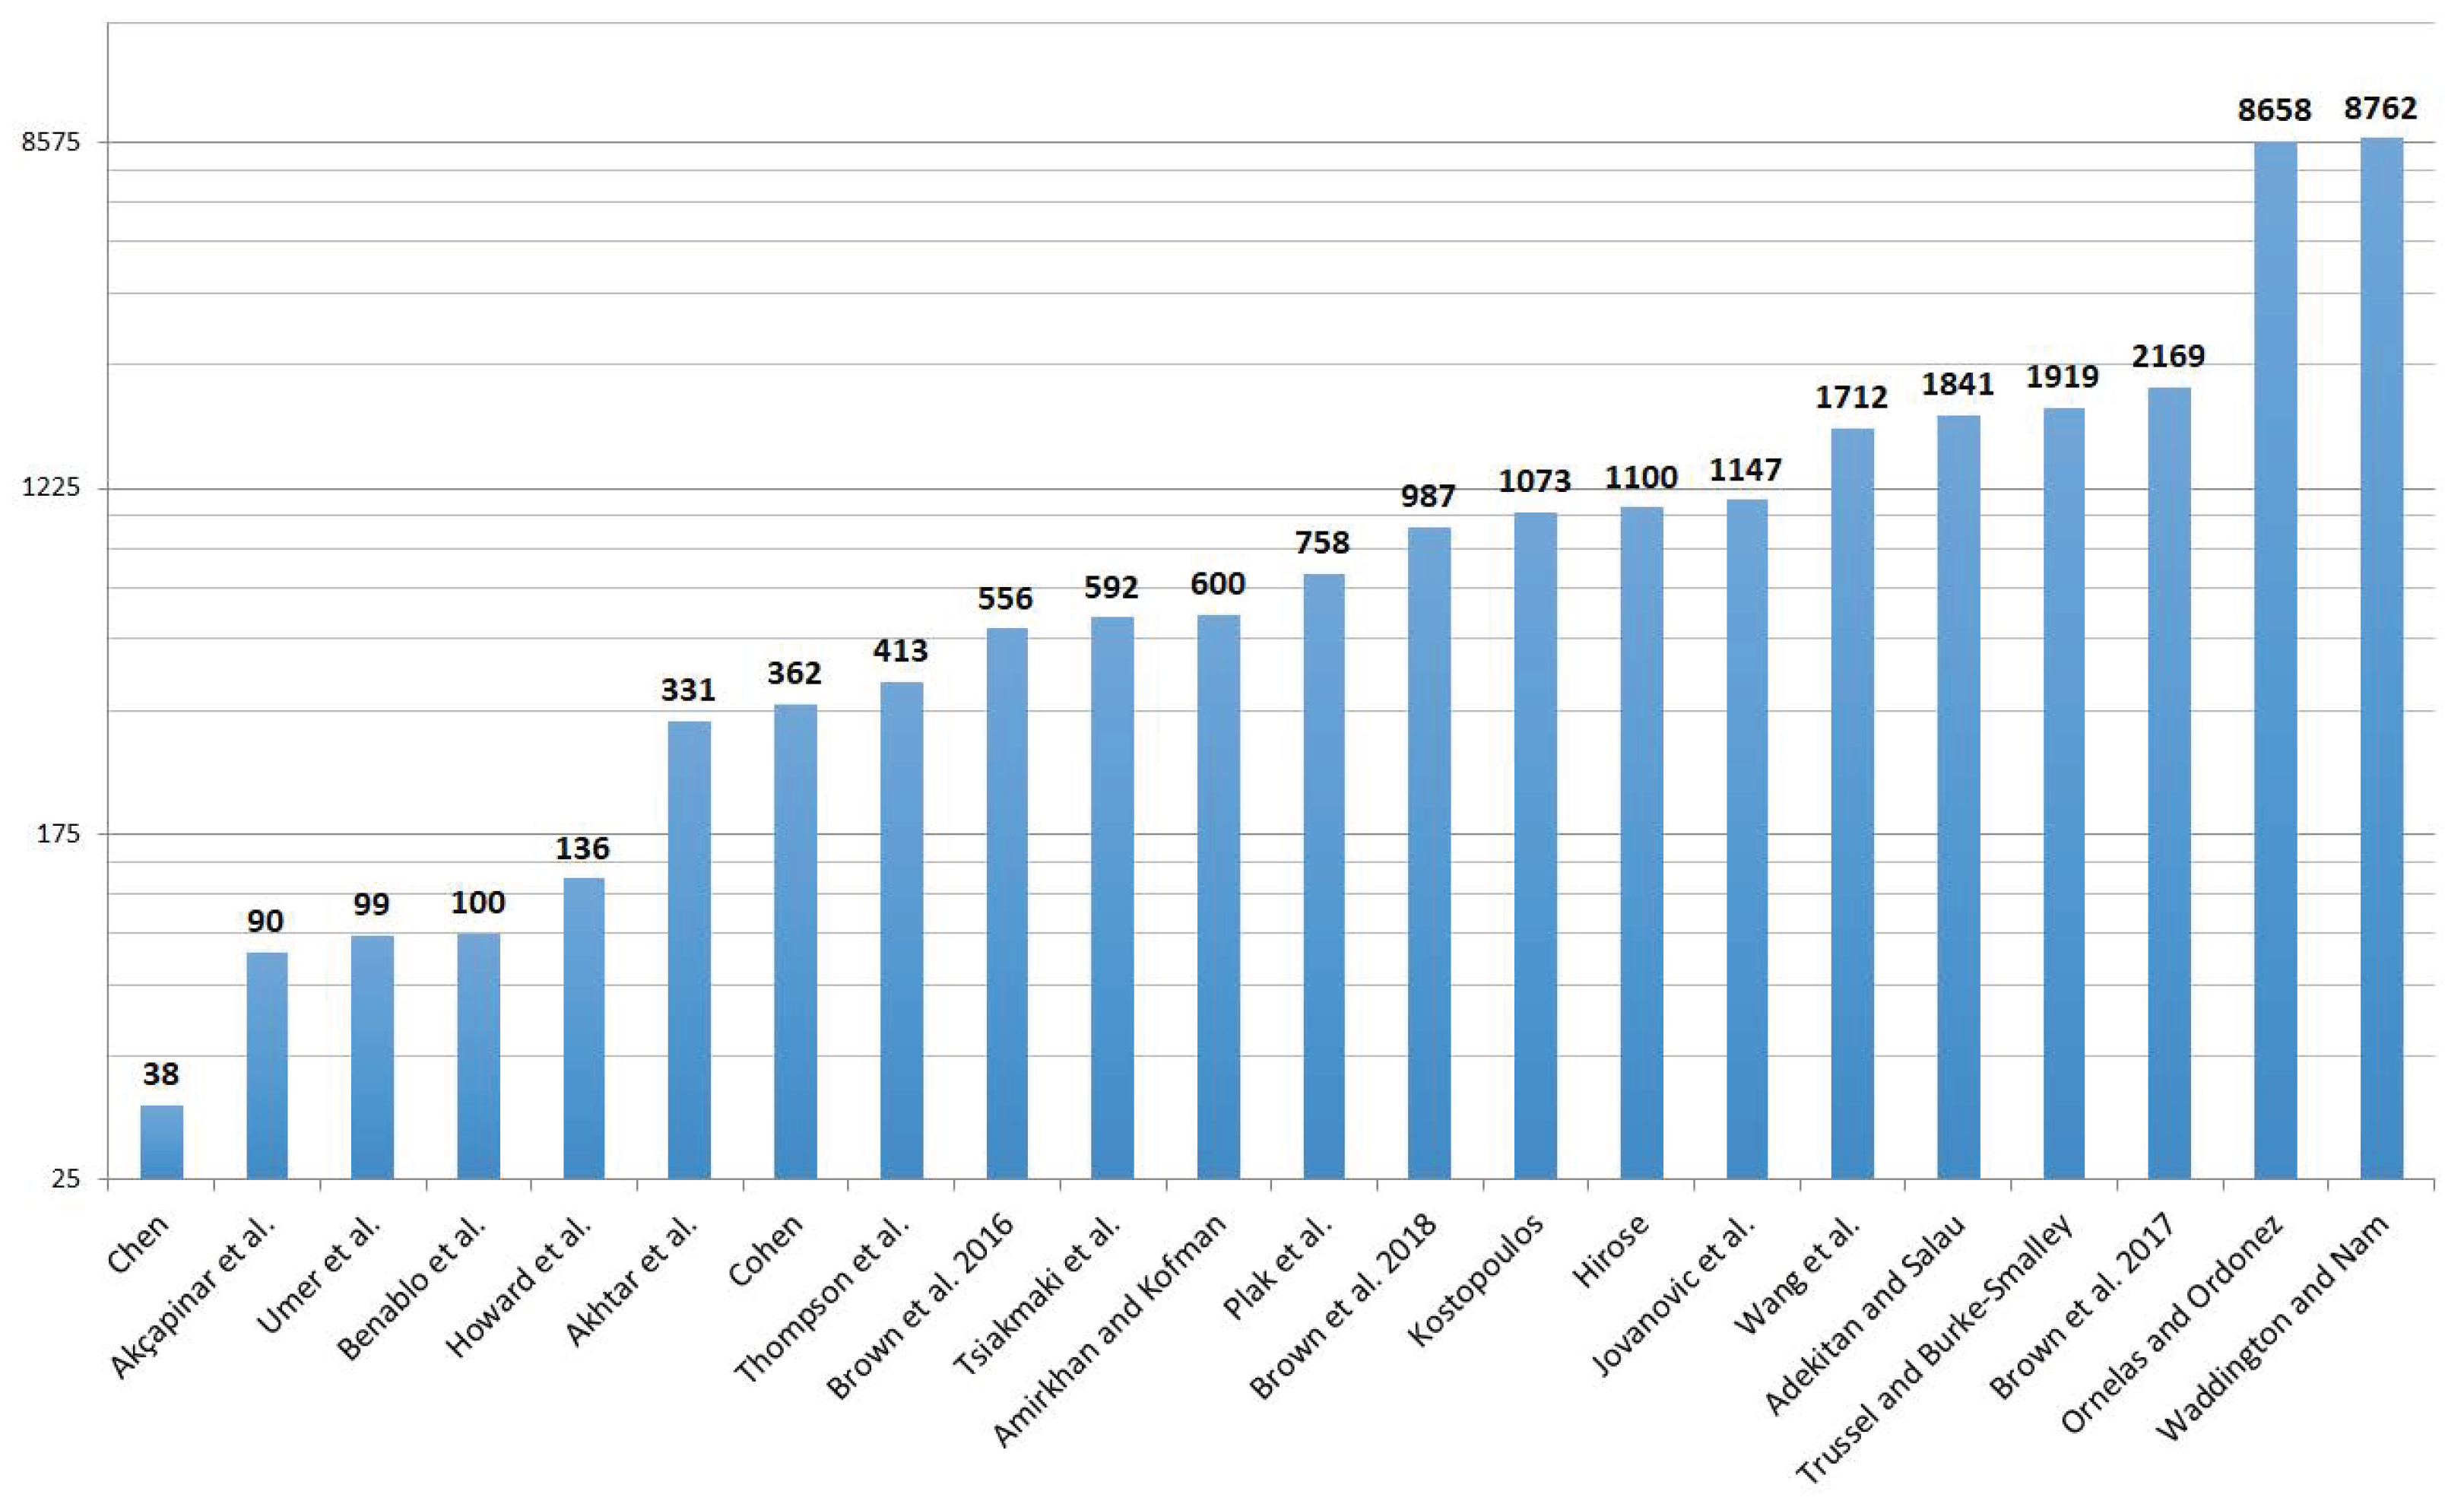
- Waddington and Nam added LMS resource use to the existing input data in Student Explorer [27]. This includes information on access to lecture notes and completion of assignments. This system was tested across 10 consecutive semesters, involving a total of 8762 students in an introductory chemistry course. The authors observed the existence of a significant correlation between resource use and the final grade obtained in the course, using logistic regression as analysis method. The activities that were most influential in the final grade were those related to exam preparation.
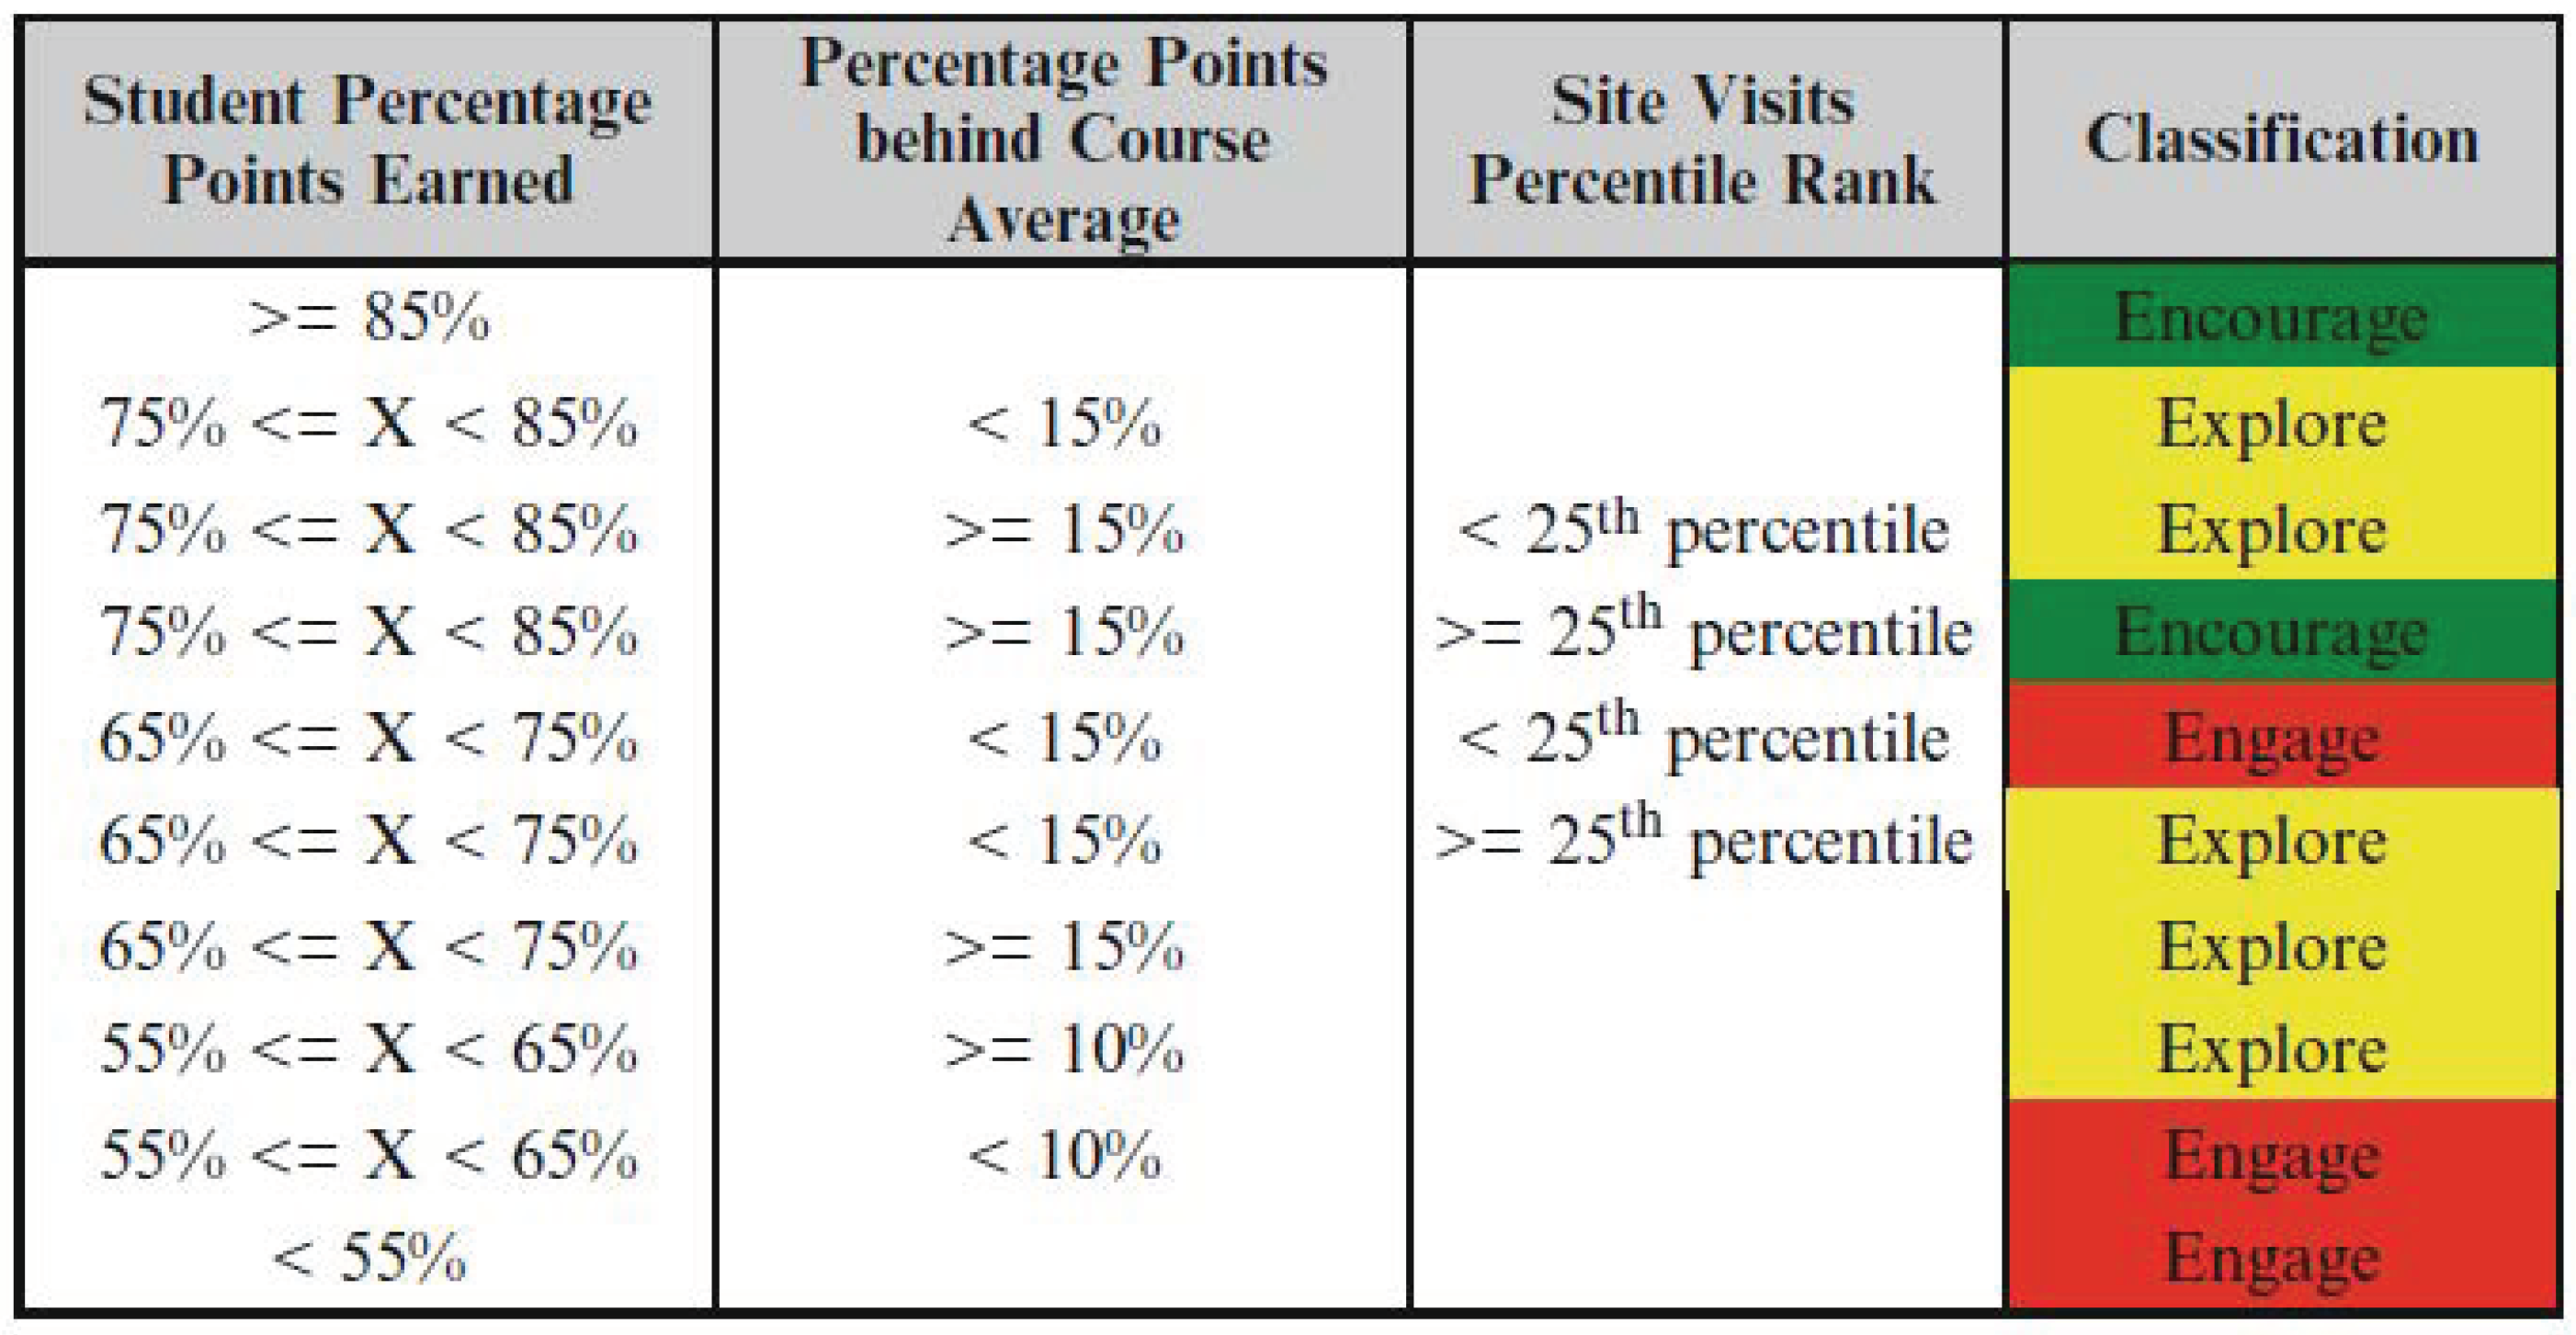
- Brown et al. performed multiple analytics studies with the help of Student Explorer, the first of which involved determining the reasons why students fall into a medium or high risk category [28]. This was done by using event history analysis techniques to determine the probability that a student enters one of the at-risk levels. This was tested over a population of 556 first-year students belonging to different study programs. As a result of this experiment, it was determined that the main reason students are classified into the “engage” level, or high risk, is underperformance in course tasks and exams. However, there was a wider array of circumstances that increased the odds of students falling into the “explore” category, or medium risk. These circumstances included being in large classes, sophomore level courses, and courses belonging to pure scientific degrees.
- A second study by Brown et al. investigated which were the best ways to help struggling students recover [29]. This study has some similarities with the previous one: this time, the authors used event history analysis to find out which intervention methods are the best for increasing the odds of students being removed from the at-risk levels. After experimenting with a population of 2169 first-year statistics students, they concluded that students at high risk benefited the most from better exam preparation, while those at medium risk required assistance in planning their study behaviors.
- Lastly, Brown et al. analyzed the effect of co-enrollment over student performance [30]. This study used binary logistic regression as the main analysis technique. The authors classified certain courses as “difficult”, according to the criterion of them having a higher amount of students classified as at-risk compared to most other courses. This extension of Student Explorer was implemented in an introductory programming course with 987 enrolled students. The authors determined that, given a specific focal course, students had a significantly higher chance of entering the “explore” or “engage” categories if they were enrolled in a “difficult” course at the same time.
4. Discussion
5. Conclusions
Author Contributions
Funding
Conflicts of Interest
Abbreviations
| BART | Bayesian Additive Regressive Trees |
| EWS | Early Warning System(s) |
| GBC | Gradient Boosting Classifier |
| GP | Gaussian Processes |
| GPA | Grade Point Average |
| KNN | K-Nearest Neighbors |
| LA | Learning Analytics |
| LADA | Learning Analytics Dashboard for Advisors |
| LASI | Learning Analytics Summer Institute |
| LDA | Linear Discriminant Analysis |
| MOOCs | Massive Open Online Courses |
| NB | Naïve Bayes |
| NN | Neural Network |
| OLS | Ordinary Least Squares |
| PCR | Principal Components Regression |
| PRISMA | Preferred Reporting Items for Systematic reviews and Meta-Analyses |
| RF | Random Forest |
| SEM | Structural Equation Modeling |
| STEM | Science, Technology, Engineering and Mathematics |
| SVM | Support Vector Machine |
Appendix A. Comparative Summary of Results
| Reference | Date | Type | Scenario/Context | Prediction Goal | Input Data | Algorithm(s) |
|---|---|---|---|---|---|---|
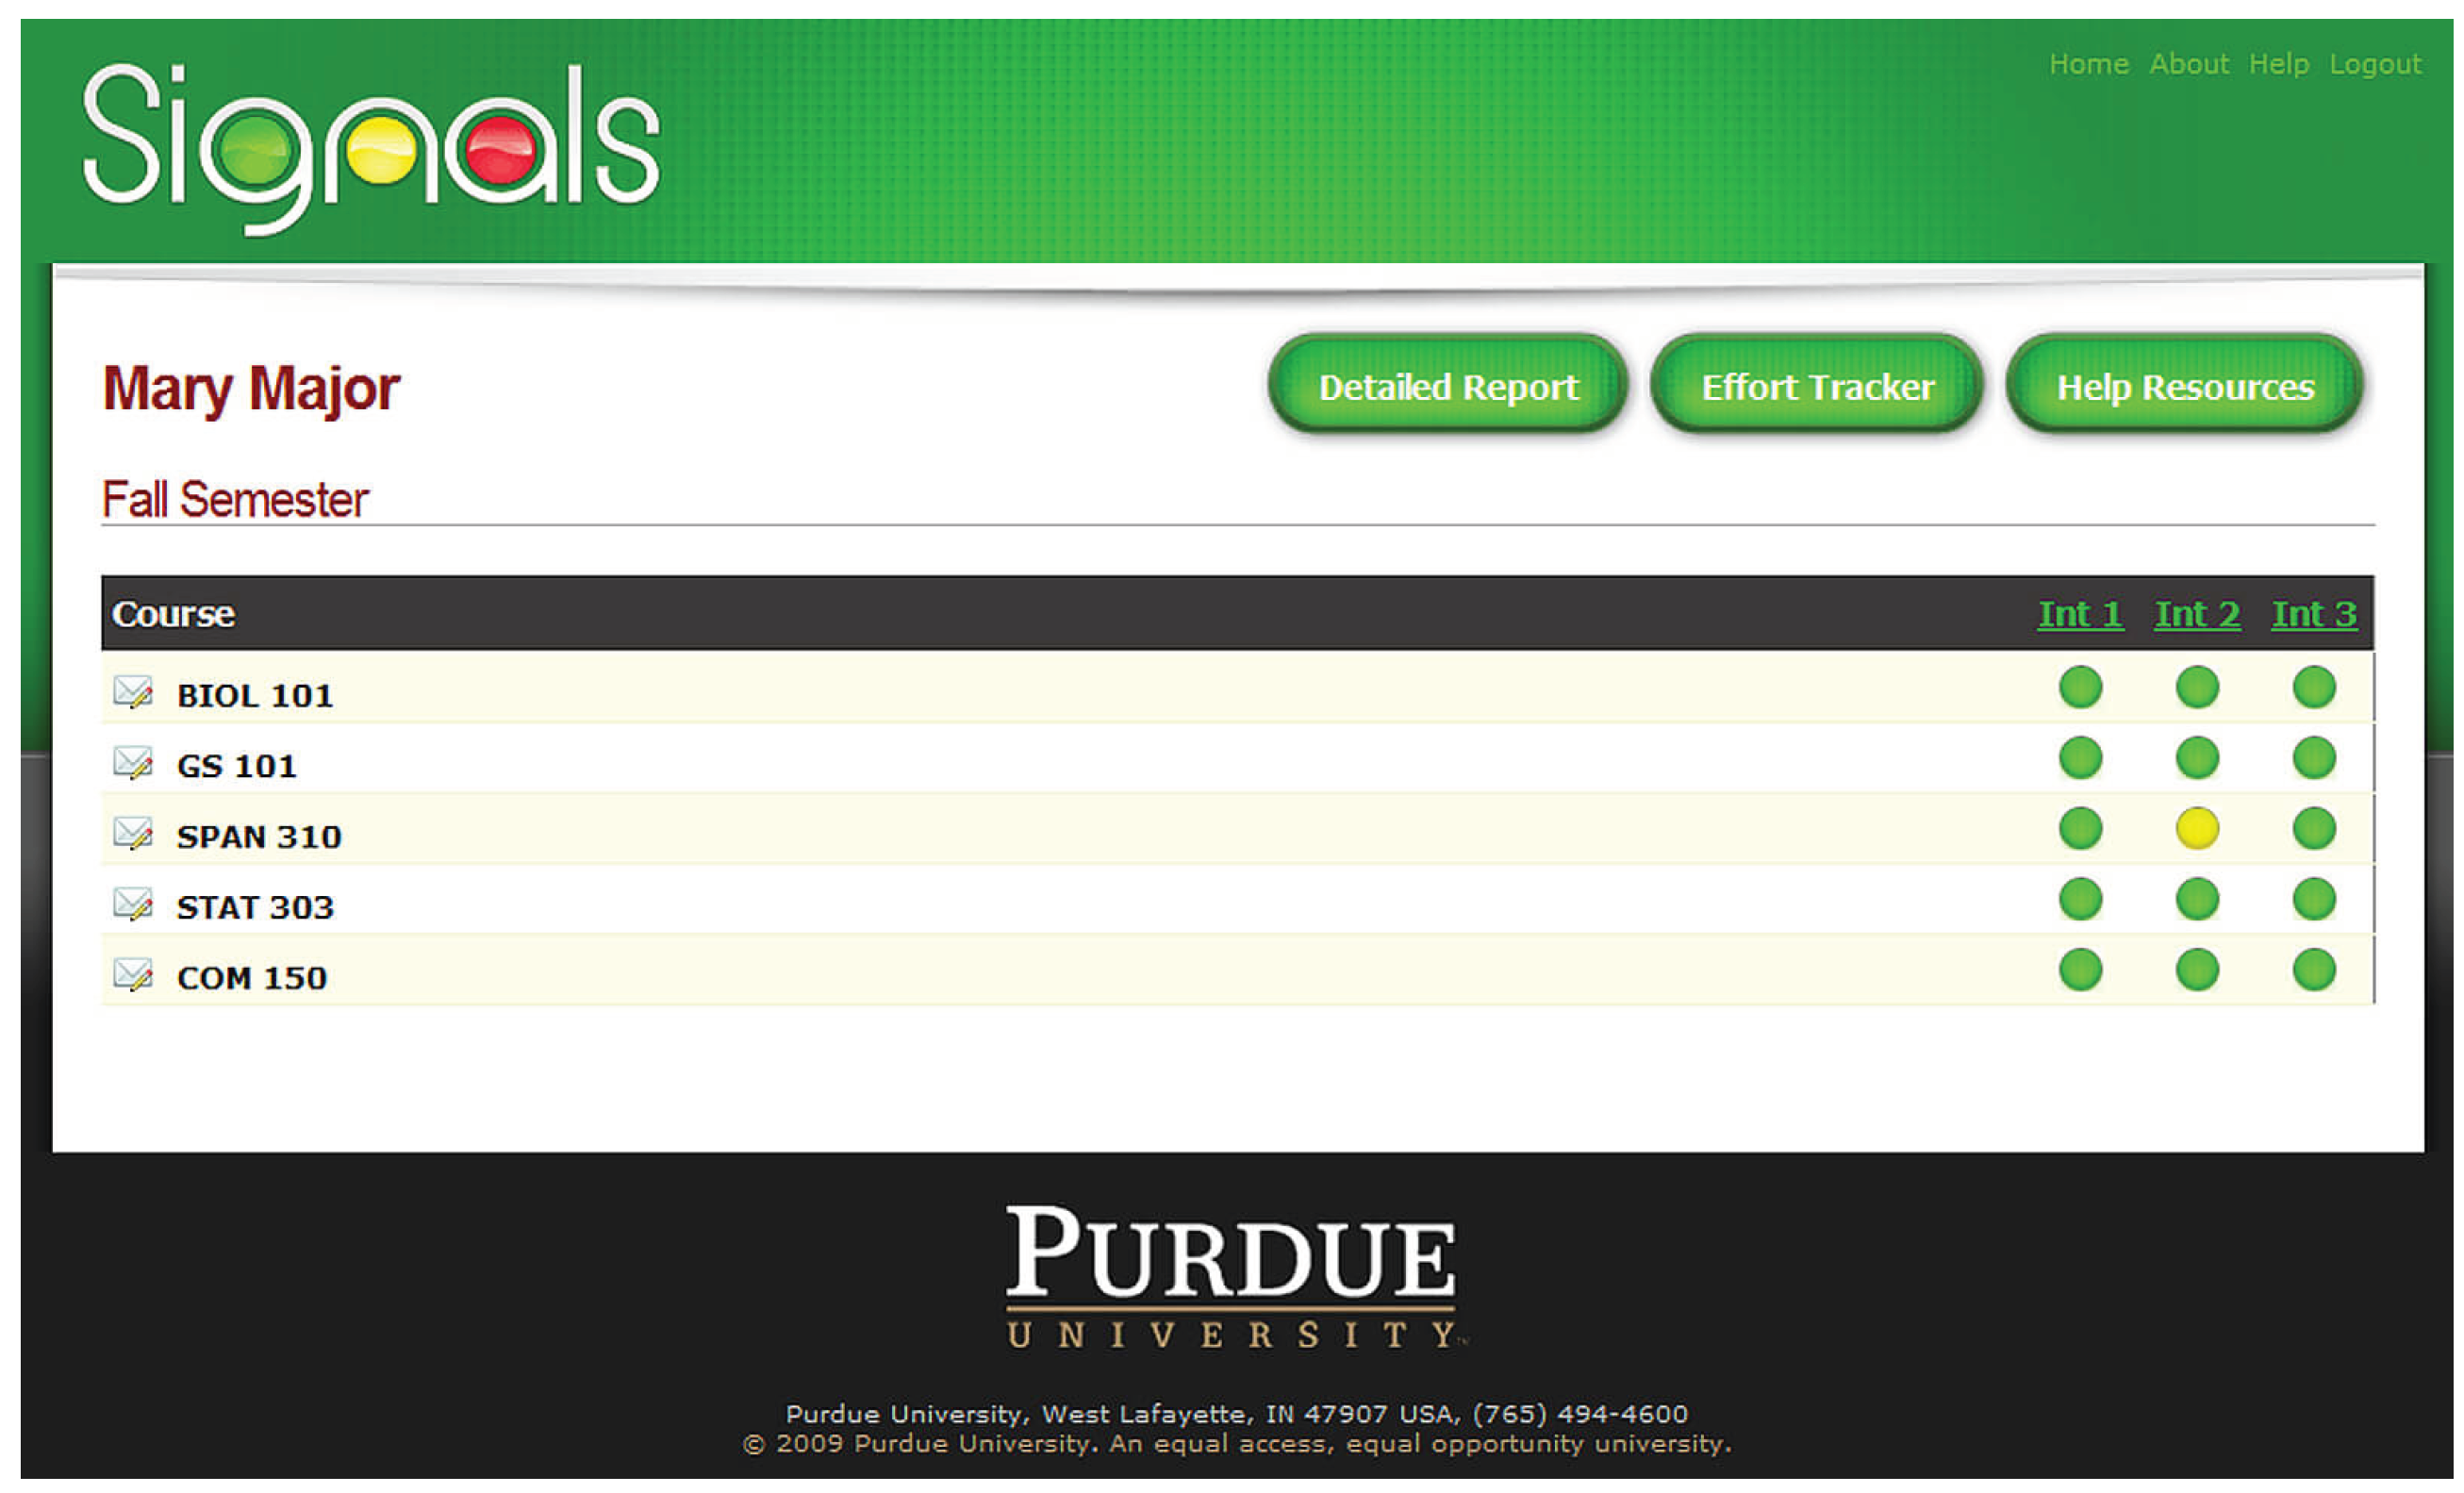
| Arnold and Pistilli [23] | April 2012 | EWS | Course Signals EWS, used in courses at Purdue University (USA), with a special focus on first year students. | Students’ risk of failing the course. | Obtained from the institutional LMS (Blackboard Vista): demographic information, performance and effort indicators, prior academic history. | “Student Success Algorithm”, producing a single score by weighting all input parameters [24]. |
| Chen [21] | May 2013 | Predictor | A group of 38 freshmen students from a Taiwanese university. | Final grade in the course. | Quality and quantity of the notes taken by students, both during and after lectures. | Hierarchical regression analysis. |
| Krumm et al. [26] | March 2014 | EWS | Student Explorer EWS, targeting STEM students at Maryland and California universities (USA). | Students’ risk of failing a course. | Performance and effort indicators from the institutional LMS. | Weighted aggregation of input data. |
| Waddington and Nam [27] | March 2014 | EWS | An extension of Student Explorer EWS. Tested with 8762 students enrolled in a chemistry course. | Final grade in a course. | Data used by the basic version of Student Explorer, plus use of academic resources in the LMS. | Multinomial logistic regression. |
| Brown et al. [28] | April 2016 | EWS | An extension of Student Explorer EWS. Tested with 556 students belonging to various first-year courses. | Data used by the basic version of Student Explorer, plus contextual information such as size of cohorts and specific STEM field of the degree. | Event history analysis. | |
| Schuck [16] | February 2017 | Predictor | Over 1000 higher education institutions in the USA. | Graduation rate, i.e. fraction of students that finish their degree within the intended number of years. | Crime and violence indicators in and around campus, provided by the US Department of Education and the National Center for Education Statistics. | Multivariate least squares regression. |
| Brown et al. [29] | March 2017 | EWS | An extension of Student Explorer EWS. Tested with 2169 students in a Statistics course. | Data used by the basic version of Student Explorer, plus type of interventions performed on struggling students. | Event history analysis. | |
| Akhtar et al. [32] | June 2017 | EWS | Laboratory sessions of computer-aided design courses at University of Surrey (England), with a sample size of 331 students. | Students’ risk of failing the course. | Attendance to class, location, and neighbors within the lab, time spent doing exercises. | ANOVA, Pearson correlation, linear regression. |
| Cohen [35] | October 2017 | EWS | A sample of 362 students of mathematics and statistics at an Israeli university. | Chance of dropping out of the course. | LMS activity: type, timing, and frequency of actions performed. | Mann–Whitney U test to prove a correlation between low student activity and a higher dropout chance. |
| Ornelas and Ordonez [10] | October 2017 | Predictor | 13 courses at Rio Salado Community College (USA), with a sample size of around 8700 students. | Students’ chance of obtaining a passing grade. | Engagement and performance indicators from the institutional LMS. | Naïve Bayesian classification. |
| Thompson et al. [11] | February 2018 | Predictor | An introductory biology course at Northern Kentucky University (USA), including 413 students. | Students’ chance of passing the course. | Results from Lawson’s Classroom Test of Scientific Reasoning and ACT Mathematics Test, taken before the start of the course. | Logistic regression. |
| Benablo et al. [12] | February 2018 | Predictor | 100 Information Technologies and Computer Science students in the Philippines. | Identification of underperforming students. | Student age, gender, academic standing and procrastination indicators: time spent using social networks and playing online games. | SVM, KNN, RF. SVM had the best performance. |
| Brown et al. [30] | March 2018 | EWS | An extension of Student Explorer EWS. Tested with 987 students in an introductory programming course. | Students’ risk of failing a course. | Data used by the basic version of Student Explorer, plus difficulty estimations of concurrent courses. | Binary logistic regression. |
| Howard et al. [33] | April 2018 | EWS | 136 students in a Practical Statistics course at University College Dublin (Ireland). | Final grade in the course. | Results of weekly tests, as well as demographic information and access to online course resources. | RF, BART, XGBoost, PCR, SVM, NN, Splines, KNN. BART had the best performance. |
| Hirose [15] | July 2018 | Predictor | Around 1100 calculus and algebra students in Japan. | Classification of students into “successful” and “not successful” categories. Estimation of students’ abilities using item response theory. | Results of weekly multiple-choice tests. | KNN classifier. |
| Tsiakmaki et al. [17] | July 2018 | Predictor | 592 Business Administration students in Greece. | Final grade in second semester courses. | Final scores of first semester subjects. | Linear regression, RF, instance-based regression, M5, SVM, GP, bootstrap aggregating. RF had the best performance. |
| Amirkhan and Kofman [22] | July 2018 | Predictor | 600 freshmen students at a major public university in the USA. | Prediction of performance and dropout probability. | Stress indicators obtained from mid-semester surveys, as well as demographic information. | Structural equation modeling, path analysis. |
| Trussel and Burke-Smalley [20] | November 2018 | Predictor | 1919 business students at a public university in Tennessee (USA). | Cumulative GPA at the end of the degree program and academic retention. | Demographic and socioeconomic attributes, performance in pre-college stage. | OLS regression, logistic regression. |
| Umer et al. [13] | November 2018 | Predictor | 99 students enrolled in an introductory mathematics module at an Australian university. | Earliest possible reliable identification of students at risk of failing the course. | Assignment results in a continuous assessment model, as well as LMS log data. | RF, Naïve Bayes, KNN, and LDA. RF had the best performance. |
| Wang et al. [34] | November 2018 | EWS | 1712 students from Hangzhou Normal University (China). | Risk assessment of students regarding dropout and delays in graduation. | Grades, attendance and engagement indicators, as well as records from the university library and dorm in order to monitor student habits. | Decision tree, artificial neural network, Naïve Bayes. Naïve Bayes had the best performance. |
| Gutiérrez et al. [31] | December 2018 | EWS | Learning Analytics Dashboard for Advisors (LADA) EWS, deployed in two universities: a European one and a Latin American one. | Students’ chance of passing a course. | Student grades, courses booked by a student, number of credits per course. | Multilevel clustering. |
| Adekitan and Salau [18] | February 2019 | Predictor | 1841 engineering students at a Nigerian higher education institution. | Final grade point average (GPA) over a five year program. | Cumulative GPA over the first three years of the degree. | Classifiers: NN, RF, decision tree, Naïve Bayes, tree ensemble, and logistic regression. Logistic regression had the best performance. Additionally, linear and quadratic regression models were tested. |
| Plak et al. [37] | March 2019 | EWS | EWS deployed at Vrije Universiteit in Amsterdam (Netherlands), tested with 758 students. | Identification of low-performing students. | Progress indicators, such as grades or obtained credits. | Generalized additive model. |
| Kostopoulos et al. [14] | April 2019 | Predictor | 1073 students in an introductory informatics module at a Greek open university. | Identification of students at risk of failing a course. | Student demographics and academic achievements; and LMS activity indicators. The data were divided into two views in order to use a co-training method. | Custom co-training method, using combinations of KNN, Extra Tree, RF, GBC, and NB as underlying classifiers. |
| Akcapinar et al. [36] | May 2019 | EWS | 90 students in an Elementary Informatics course at an Asian university. | Identification of students at risk of failing the course. | Data from the e-book management system BookRoll: book navigation, page highlighting and note taking. | Comparison of 13 different algorithms. RF had the best performance when using raw data. However, NB outperformed the rest when using categorical data. |
| Jovanovic et al. [19] | June 2019 | Predictor | First year engineering course at an Australian university using the flipped classroom model. Tested during three consecutive years, with a number of students ranging from 290 to 486 each year. | Final grade in the course. | Indicators of regularity and performance related to pre-class activities. These activities included videos with multiple choice questions as well as problem sequences. | Multiple linear regression. |
References
- Kempler, S.; Mathews, T. Earth Science Data Analytics: Definitions, Techniques and Skills. Data Sci. J. 2017, 16, 6. [Google Scholar] [CrossRef]
- Gandomi, A.; Haider, M. Beyond the hype: Big data concepts, methods, and analytics. Int. J. Inf. Manag. 2015, 35, 137–144. [Google Scholar] [CrossRef]
- Reid, B. Global early warning systems for natural hazards: Systematic and people-centred. Philos. Trans. R. Soc. A Math. Phys. Eng. Sci. 2006, 364, 2167–2182. [Google Scholar] [CrossRef]
- Bussiere, M.; Fratzscher, M. Towards a new early warning system of financial crises. J. Int. Money Financ. 2006, 25, 953–973. [Google Scholar] [CrossRef]
- Smith, M.E.B.; Chiovaro, J.C.; O’Neil, M.; Kansagara, D.; Quinones, A.; Freeman, M.; Motu’apuaka, M.; Slatore, C.G. Early Warning System Scores: A Systematic Review; VA Evidence-Based Synthesis Program Reports; Department of Veterans Affairs: Washington, DC, USA, 2014.
- Siemens, G. About: Learning Analytics & Knowledge: February 27–March 1, 2011 in Banff, Alberta. Available online: https://web.archive.org/web/20190112095031/https://tekri.athabascau.ca/analytics/ (accessed on 12 January 2019).
- Liz-Domínguez, M.; Caeiro-Rodríguez, M.; Llamas-Nistal, M.; Mikic-Fonte, F. Predictors and Early Warning Systems in Higher Education — A Systematic Literature Review. In Learning Analytics Summer Institute Spain 2019: Learning Analytics in Higher Education; LASI Spain 2019; CEUR: Vigo, Spain, 2019; pp. 84–99. [Google Scholar]
- Liberati, A.; Altman, D.G.; Tetzlaff, J.; Mulrow, C.; Gøtzsche, P.C.; Ioannidis, J.P.A.; Clarke, M.; Devereaux, P.J.; Kleijnen, J.; Moher, D. The PRISMA Statement for Reporting Systematic Reviews and Meta-Analyses of Studies That Evaluate Health Care Interventions: Explanation and Elaboration. PLoS Med. 2009, 6, e1000100. [Google Scholar] [CrossRef] [PubMed]
- Hwang, G.J.; Spikol, D.; Li, K.C. Guest Editorial: Trends and Research Issues of Learning Analytics and Educational Big Data. J. Educ. Technol. Soc. 2018, 21, 134–136. [Google Scholar]
- Ornelas, F.; Ordonez, C. Predicting Student Success: A Naïve Bayesian Application to Community College Data. Technol. Knowl. Learn. 2017, 22, 299–315. [Google Scholar] [CrossRef]
- Thompson, E.D.; Bowling, B.V.; Markle, R.E. Predicting Student Success in a Major’s Introductory Biology Course via Logistic Regression Analysis of Scientific Reasoning Ability and Mathematics Scores. Res. Sci. Educ. 2018, 48, 151–163. [Google Scholar] [CrossRef]
- Benablo, C.I.P.; Sarte, E.T.; Dormido, J.M.D.; Palaoag, T. Higher Education Student’s Academic Performance Analysis Through Predictive Analytics. In Proceedings of the 2018 7th International Conference on Software and Computer Applications, Kuantan, Malaysia, 8–10 February 2018; ACM: New York, NY, USA, 2018; pp. 238–242. [Google Scholar] [CrossRef]
- Umer, R.; Susnjak, T.; Mathrani, A.; Suriadi, S. A learning analytics approach: Using online weekly student engagement data to make predictions on student performance. In Proceedings of the 2018 International Conference on Computing, Electronic and Electrical Engineering (ICE Cube), Quetta, Pakistan, 12–13 November 2018; pp. 1–5. [Google Scholar] [CrossRef]
- Kostopoulos, G.; Karlos, S.; Kotsiantis, S.B. Multi-view Learning for Early Prognosis of Academic Performance: A Case Study. IEEE Trans. Learn. Technol. 2019, 12, 212–224. [Google Scholar] [CrossRef]
- Hirose, H. Success/Failure Prediction for Final Examination Using the Trend of Weekly Online Testing. In Proceedings of the 2018 7th International Congress on Advanced Applied Informatics (IIAI-AAI), Yonago, Japan, 8–13 July 2018; pp. 139–145. [Google Scholar] [CrossRef]
- Schuck, A.M. Evaluating the Impact of Crime and Discipline on Student Success in Postsecondary Education. Res. Higher Educ. 2017, 58, 77–97. [Google Scholar] [CrossRef]
- Tsiakmaki, M.; Kostopoulos, G.; Koutsonikos, G.; Pierrakeas, C.; Kotsiantis, S.; Ragos, O. Predicting University Students’ Grades Based on Previous Academic Achievements. In Proceedings of the 2018 9th International Conference on Information, Intelligence, Systems and Applications (IISA), Zakynthos, Greece, 23–25 July 2018; pp. 1–6. [Google Scholar] [CrossRef]
- Adekitan, A.I.; Salau, O. The impact of engineering students’ performance in the first three years on their graduation result using educational data mining. Heliyon 2019, 5, e01250. [Google Scholar] [CrossRef] [PubMed]
- Jovanovic, J.; Mirriahi, N.; Gašević, D.; Dawson, S.; Pardo, A. Predictive power of regularity of pre-class activities in a flipped classroom. Comput. Educ. 2019, 134, 156–168. [Google Scholar] [CrossRef]
- Trussel, J.M.; Burke-Smalley, L. Demography and student success: Early warning tools to drive intervention. J. Educ. Bus. 2018, 93, 363–372. [Google Scholar] [CrossRef]
- Chen, P.H. The Effects of College Students’ In-Class and After-Class Lecture Note-Taking on Academic Performance. Asia-Pacific Educ. Res. 2013, 22, 173–180. [Google Scholar] [CrossRef]
- Amirkhan, J.H.; Kofman, Y.B. Stress overload as a red flag for freshman failure and attrition. Contempor. Educ. Psychol. 2018, 54, 297–308. [Google Scholar] [CrossRef]
- Arnold, K.E.; Pistilli, M.D. Course Signals at Purdue: Using Learning Analytics to Increase Student Success. In Proceedings of the 2nd International Conference on Learning Analytics and Knowledge (LAK ’12), Vancouver, BC, Canada, 29 April–2May 2012; ACM: New York, NY, USA, 2012; pp. 267–270. [Google Scholar] [CrossRef]
- Arnold, K.E. Signals: Applying Academic Analytics. Educ. Q. 2010, 33, n1. [Google Scholar]
- Signals Tells Students How They’re Doing Even Before the Test. Available online: https://web.archive.org/web/20100717072052/http://news.uns.purdue.edu/x/2009b/090827ArnoldSignals.html (accessed on 17 July 2010).
- Krumm, A.E.; Waddington, R.J.; Teasley, S.D.; Lonn, S. A Learning Management System-Based Early Warning System for Academic Advising in Undergraduate Engineering. In Learning Analytics: From Research to Practice; Larusson, J.A., White, B., Eds.; Springer: New York, NY, USA, 2014; pp. 103–119. [Google Scholar] [CrossRef]
- Waddington, R.J.; Nam, S. Practice Exams Make Perfect: Incorporating Course Resource Use into an Early Warning System. In Proceedings of the Fourth International Conference on Learning Analytics and Knowledge (LAK ’14), Indianapolis, IN, USA, 24–28 March 2014; ACM: New York, NY, USA, 2014; pp. 188–192. [Google Scholar] [CrossRef]
- Brown, M.G.; DeMonbrun, R.M.; Lonn, S.; Aguilar, S.J.; Teasley, S.D. What and when: The Role of Course Type and Timing in Students’ Academic Performance. In Proceedings of the Sixth International Conference on Learning Analytics & Knowledge (LAK ’16), Edinburgh, UK, 25–29 April 2016; ACM: New York, NY, USA, 2016; pp. 459–468. [Google Scholar] [CrossRef]
- Brown, M.G.; DeMonbrun, R.M.; Teasley, S.D. Don’t Call It a Comeback: Academic Recovery and the Timing of Educational Technology Adoption. In Proceedings of the Seventh International Learning Analytics & Knowledge Conference (LAK ’17), Vancouver, BC, Canada, 13–17 March 2017; ACM: New York, NY, USA, 2017; pp. 489–493. [Google Scholar] [CrossRef]
- Brown, M.G.; DeMonbrun, R.M.; Teasley, S.D. Conceptualizing Co-enrollment: Accounting for Student Experiences Across the Curriculum. In Proceedings of the 8th International Conference on Learning Analytics and Knowledge (LAK ’18), Sydney, New South Wales, Australia, 7–9 March 2018; ACM: New York, NY, USA, 2018; pp. 305–309. [Google Scholar] [CrossRef]
- Gutiérrez, F.; Seipp, K.; Ochoa, X.; Chiluiza, K.; De Laet, T.; Verbert, K. LADA: A learning analytics dashboard for academic advising. Comput. Hum. Behav. 2018. [Google Scholar] [CrossRef]
- Akhtar, S.; Warburton, S.; Xu, W. The use of an online learning and teaching system for monitoring computer aided design student participation and predicting student success. Int. J. Technol. Des. Educ. 2017, 27, 251–270. [Google Scholar] [CrossRef]
- Howard, E.; Meehan, M.; Parnell, A. Contrasting prediction methods for early warning systems at undergraduate level. Internet Higher Educ. 2018, 37, 66–75. [Google Scholar] [CrossRef]
- Wang, Z.; Zhu, C.; Ying, Z.; Zhang, Y.; Wang, B.; Jin, X.; Yang, H. Design and Implementation of Early Warning System Based on Educational Big Data. In Proceedings of the 2018 5th International Conference on Systems and Informatics (ICSAI), Nanjing, China, 10–12 November 2018; pp. 549–553. [Google Scholar] [CrossRef]
- Cohen, A. Analysis of student activity in web-supported courses as a tool for predicting dropout. Educ. Technol. Res. Dev. 2017, 65, 1285–1304. [Google Scholar] [CrossRef]
- Akçapınar, G.; Hasnine, M.N.; Majumdar, R.; Flanagan, B.; Ogata, H. Developing an early-warning system for spotting at-risk students by using eBook interaction logs. Smart Learn. Environ. 2019, 6, 4. [Google Scholar] [CrossRef]
- Plak, S.; Cornelisz, I.; Meeter, M.; van Klaveren, C. Early Warning Systems for More Effective Student Counseling in Higher Education—Evidence from a Dutch Field Experiment. In Proceedings of the SREE Spring 2019 Conference, Washington, DC, USA, 6–9 March 2019; p. 4. [Google Scholar]
- Jovanovic, J.; Gasevic, D.; Dawson, S.; Pardo, A.; Mirriahi, N. Learning analytics to unveil learning strategies in a flipped classroom. Internet Higher Educ. 2017, 33. [Google Scholar] [CrossRef]
| Source | Results |
|---|---|
| IEEE Xplore Digital Library | 36 |
| ACM Digital Library | 45 |
| Elsevier (ScienceDirect) | 412 |
| Wiley Online Library | 255 |
| Springer (SpringerLink) | 91 |
| Emerald | 36 |
| Taylor & Francis | 165 |
| Google Scholar | ∼13,800 |
| Scopus | 956 |
| Web of Science | 97 |
| Prediction Goal | Type | Number Published |
|---|---|---|
| Risk of failing a course | Classification | 15 |
| Dropout risk | Classification | 3 |
| Grade prediction | Regression | 7 |
| Graduation rate | Regression | 1 |
| Input Data Type | Appearances in Studies |
|---|---|
| Student demographics and background | 6 |
| Student engagement and effort | 15 |
| Student performance and academic history | 19 |
| Course, degree or classroom characteristics | 4 |
| Others | 6 |
© 2019 by the authors. Licensee MDPI, Basel, Switzerland. This article is an open access article distributed under the terms and conditions of the Creative Commons Attribution (CC BY) license (http://creativecommons.org/licenses/by/4.0/).
Share and Cite
Liz-Domínguez, M.; Caeiro-Rodríguez, M.; Llamas-Nistal, M.; Mikic-Fonte, F.A. Systematic Literature Review of Predictive Analysis Tools in Higher Education. Appl. Sci. 2019, 9, 5569. https://doi.org/10.3390/app9245569
Liz-Domínguez M, Caeiro-Rodríguez M, Llamas-Nistal M, Mikic-Fonte FA. Systematic Literature Review of Predictive Analysis Tools in Higher Education. Applied Sciences. 2019; 9(24):5569. https://doi.org/10.3390/app9245569
Chicago/Turabian StyleLiz-Domínguez, Martín, Manuel Caeiro-Rodríguez, Martín Llamas-Nistal, and Fernando A. Mikic-Fonte. 2019. "Systematic Literature Review of Predictive Analysis Tools in Higher Education" Applied Sciences 9, no. 24: 5569. https://doi.org/10.3390/app9245569
APA StyleLiz-Domínguez, M., Caeiro-Rodríguez, M., Llamas-Nistal, M., & Mikic-Fonte, F. A. (2019). Systematic Literature Review of Predictive Analysis Tools in Higher Education. Applied Sciences, 9(24), 5569. https://doi.org/10.3390/app9245569


