Article

Integrated Procedure for Monitoring and Assessment of Linear Infrastructures Safety (I-Pro MONALISA) Affected by Slope Instability

1
SINTEMA Engineering srl, Spin-Off Federico II University of Napoli, 80138 Napoli NA, Italy
2
Department of Earth, Environmental and Resources Sciences, Federico II University of Napoli, 80126 Napoli NA, Italy
3
Telematic University Pegaso, 80100 Napoli NA, Italy
4
Department of Civil, Architectural and Environmental Engineering, Federico II University of Napoli, 80125 Napoli NA, Italy
*
Author to whom correspondence should be addressed.
Appl. Sci. 2019, 9(24), 5535; https://doi.org/10.3390/app9245535
Submission received: 27 November 2019 / Revised: 11 December 2019 / Accepted: 12 December 2019 / Published: 16 December 2019
(This article belongs to the Special Issue Mapping and Monitoring of Geohazards)

Abstract

:
The occurrence of geological events such as landslides is one of the main causes of damage along linear infrastructures: Damage to transport infrastructures, as roads, bridges, and railways, can restrict their optimal functions and contribute to traffic accidents. The frequent and accurate monitoring of slope instability phenomena and of their interaction with existing man-made infrastructures plays a key role in risk prevention and mitigation activities. In this way, the use of high-resolution X-band synthetic aperture radar (SAR) data, characterized by short revisiting times, has demonstrated to be a powerful tool for a periodical noninvasive monitoring of ground motion and superstructure stability, aimed at improving the efficiency of inspection, repairing, and rehabilitation efforts. In the present work, we suggest a semiautomatic GIS approach, which, by using satellite radar interferometry data and results of geomorphological field survey integrated in a qualitative vulnerability matrix, allows to identify sections with different levels of damage susceptibility, where detailed conventional in situ measurements are required for further analysis. The procedure has been tested to investigate landslide-induced effects on a linear infrastructure in Campania Region (Italy), the Provincial Road “P.R. 264”, which is affected, along its linear development, by several slope instabilities. COSMO-SkyMed interferometric products, as indicator of ground kinematics, and results of in situ damage survey, as indicator of consequences, have been merged in a qualitative 4 × 4 matrix, thus obtaining a vulnerability zoning map along a linear infrastructure in January 2015. Furthermore, an updating of landslide inventory map is provided: In addition to 24 official landslides pre-mapped in 2012, 30 new events have been identified, and corresponding intensity and state of activity has been detected.

1. Introduction

The Italian infrastructures network (roads, highways, and railways) represents a connection system of outstanding importance for social and economic life of the whole country: Actually, the total length of road network is about 59,000 km and includes 1300 tunnels, 7000 overpasses, and 17,000 bridges.
Transportation infrastructure plays a significant role in the success of every nation’s economy: In particular, road transport is the primary means of national transportation, so maintaining a reliable and durable road infrastructure is essential to economic growth and social development.
Moreover, Italy is a country strongly affected by natural hazards, such as landslides [1], which often are cause of deaths, injured and physical damage to private and public properties. Among these, slow-moving landslides, generating deformation, cracks and local failures to road surface, are responsible for considerable economic losses [2].
For this reason, an effective monitoring system, performed by using an onsite network of sensors and instruments, should be required during the exercise phase to support control and management activities by owners and authorities. Actually, monitoring and control of the Italian infrastructures is instead demanded to technicians and maintenance teams who detect, by means of visual control, anomalies and failures which could represent a critical condition for users.
Such approach, besides representing a relevant rate of owner’s annual budget, could not be effective because of the long time-lapse between in situ data collection and information transfer to the operating center. Indeed, a complete monitoring system should include also accelerometers, levelling, total station surveying, laser scanning, GNSS (Global Navigation Satellite System) technologies to control deformation of structures, wireless sensors to detect deterioration of materials, and gauges to monitor stresses of structural elements [3,4,5]. However, it is important to highlight that punctual measurements, carried out at specific points of interest, even though they are without any reasonable doubt accurate and reliable, could represent a limited and only partial information to fully characterize and analyze a potential infrastructure damage and can be highly expensive if a high density of measurements suitable for wide-scale infrastructure monitoring is required.
Recently, remote controlled Unmanned Aerial Vehicles (UAV) have been widely accepted among the scientific community as platforms for implementing monitoring and inspection procedures. Equipped with high definition photo and video cameras, UAV systems can fly autonomously following a preprogrammed flight path or remotely controlled by a navigator. They provide a safe method for remotely performing visual inspections and inventorying of damage and failures along linear infrastructures: Furthermore, the possibility of geo-referencing of images suggests an efficient displacement detection of structures based on photogrammetric methods. In spite of all benefits, UAVs have some essential limitations, due to short flight time, high sensitivity to changes in the weather conditions, unexpected flight situations (occurrence of obstacle, failures of GPS signal).
The need of an effective and quasi real time approach for monitoring of these man-made infrastructures, finds in the application of modern remote sensing techniques a valid response with a good cost/benefit ratio. Satellite-based monitoring systems, based on the use of radar images, may offer a feasible source of independent information products to support infrastructures health assessments. As a matter of fact, such technique can be effectively used to detect surface movements both of infrastructures and surrounding areas [6].
In recent years, remote sensing methodologies for Earth observation have gained more and more attention and appreciation, also consolidated by good results, so far achieved as tools for the monitoring of a wide range of deformation phenomena occurring on Earth’s surface [7,8,9,10,11,12,13,14,15,16,17]. Remote sensing tools, indeed, have become rapidly one of the most important and valuable methods for the prevention and investigation of instabilities, thanks to their rapidity of acquisition, the easy management of the data and for the relative low costs as well. Among them, Differential SAR Interferometry (DInSAR) is widely implemented both for research aims and for commercial use, because it enables to obtain displacement velocity maps and time series of wide areas with sub-centimeter accuracy. In the last decade, also monitoring of linear infrastructures is strongly enabled and advisable by using DInSAR technique, thanks to the availability of historical images since 1992 and to a very high resolution and shortened revisiting time of the most recent satellite missions [18,19,20,21,22,23,24]. In particular, the launch of SAR sensors which operate at 3 cm wavelength in X-band, i.e., COSMO-SkyMed, covering wide areas (40 × 40 km) with higher spatial resolution (3 × 3 m) and reduced revisiting time (4–16 days), has enhanced DInSAR capability for displacement monitoring to an early detection of problems that might affect the linear infrastructure.
In this work, a general approach to investigate preliminary cause–effect relationship, as indicator of vulnerability of linear infrastructures affected by slope instability, has been provided. The aim is to exploit the availability of very high-resolution satellite data, integrated with results of field campaigns to investigate, through a qualitative matrix-based approach, the vulnerability of linear infrastructures affected by geological events. The Integrated Procedure for MONitoring and Assessment of Linear Infrastructure SAfety (I-Pro MONALISA) is a semiautomatic GIS tool, using DInSAR and geomorphological data, combined with results of in situ surveys, to identify, along linear infrastructure, sections characterized by different levels of vulnerability. It represents a very fast tool, which may, in a preliminary and wide-area analysis, reduce costs and time of investigation, supporting public administrations in planning maintenance and rehabilitation activities for those areas affected by landslides interacting with linear infrastructures.
The paper is organized as follows: I-Pro MONALISA tool is described in detail in Section 2, by defining input, procedure, and output; in Section 3 the test-area used to calibrate the proposed approach is introduced; DInSAR dataset and available information surveyed by field campaigns, as well as a discussion of the outcomes are described in Section 4 and in Section 5; finally, Section 6 summarizes the main conclusions of the paper.

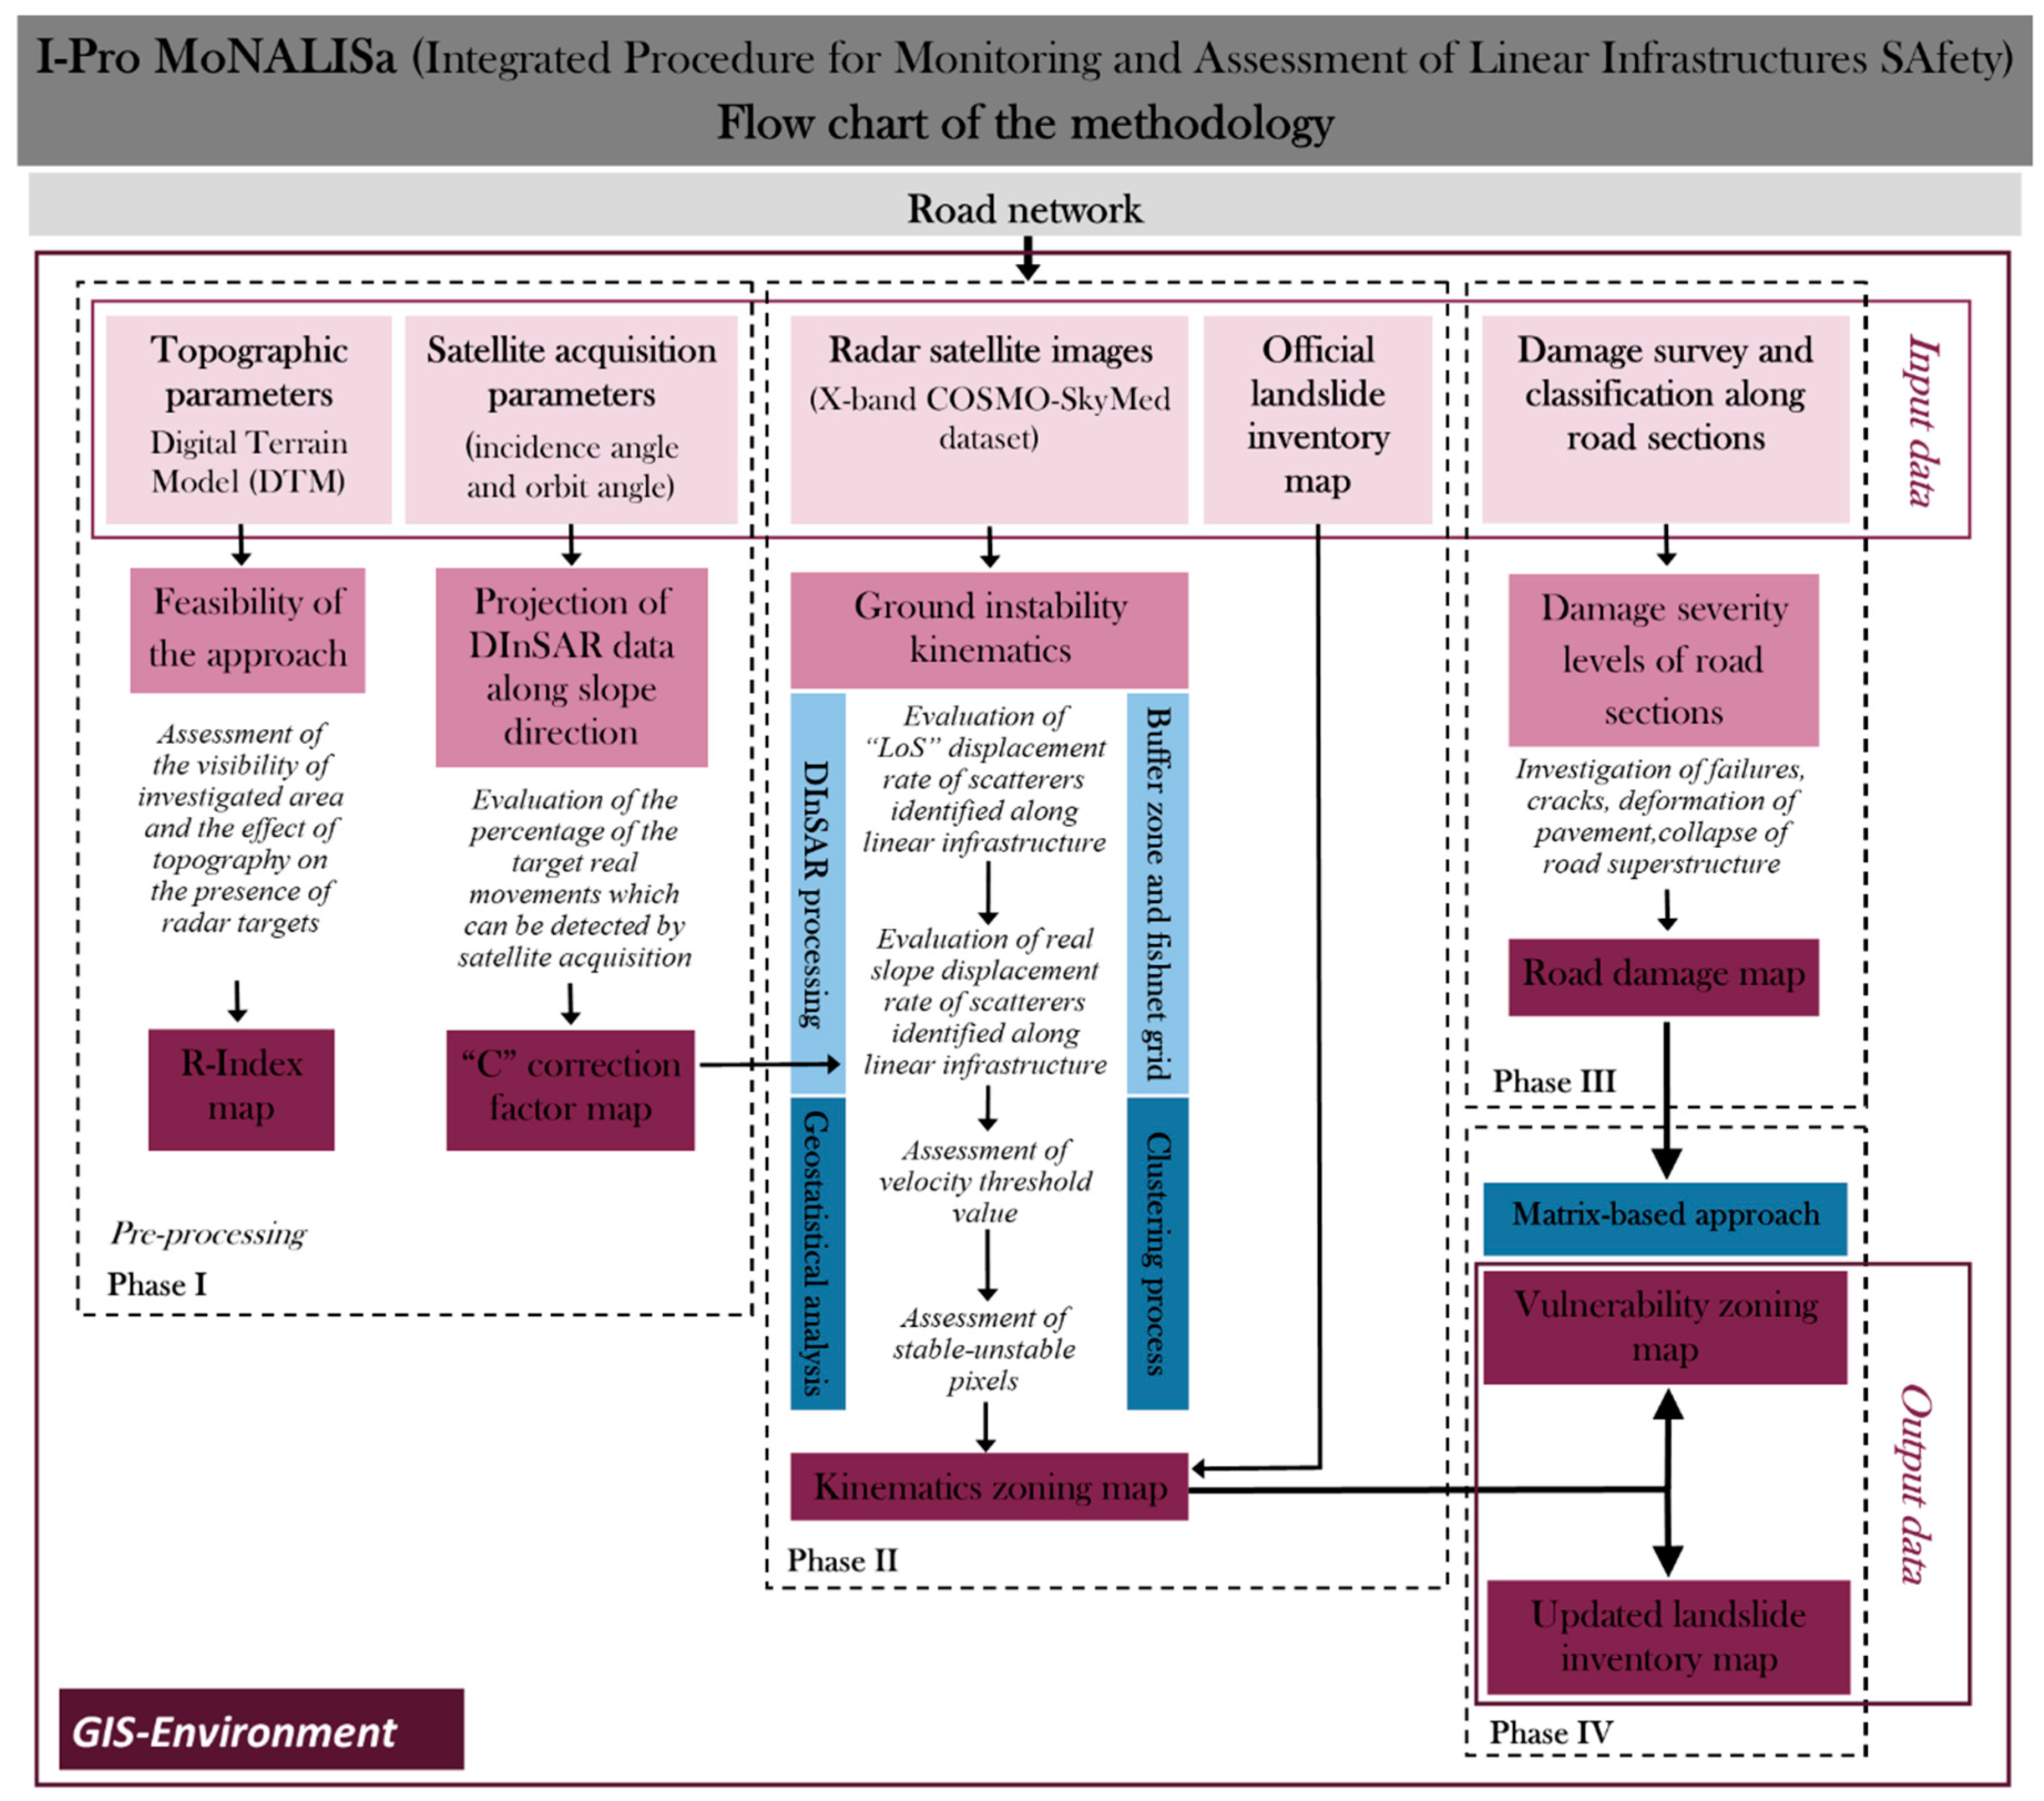
2. I-PRO MONALISA: A New Semiautomatic GIS Approach

Vulnerability assessment, meant as detection of the potential physical losses induced by ground movements, represents a basic step in landslides risk quantification activities. According to the glossary of risk-assessment terms of the International Society of Soil Mechanics and Geotechnical Engineering, physical vulnerability refers to the degree of loss of a given element or set of elements within the area affected by the landslide hazard.
Nowadays, no standard methodology for vulnerability assessment exists: Different approaches to assess vulnerability of exposed elements, associated to landslide processes, have been described in literature [25,26,27,28,29,30,31,32,33,34], each one characterized by its own peculiarity, obviously with differences in the final results.
Consequences can be expressed quantitatively and qualitatively. A quantitative approach can estimate the expected degree of loss to a given exposed element by using a numeric rating scale ranging from 0 (no loss) to 1 (total loss), while the qualitative approach is based on the experience of experts and the use of terms as “low, moderate, high”, thus it can include potentially subjective description of the likelihood term.
In this paper, dealing with a large-area analysis, at small scale of representation (up to 1:25,000), we propose a qualitative vulnerability matrix which, combining landslide kinematic and damage severity, can be used as an initial screening process to identify, very quickly, sections along linear infrastructure, with different levels of vulnerability.
The matrix-based approach [27,35,36,37] is the most practical one as a basis for spatial analyses, where different vulnerability levels can be detected as changes in the classes within the matrix. Vulnerability matrices represent a useful tool in cases of limited data for the identification of the most critical areas where more detailed analysis is required. However, operator-dependency of the method is very high: The assessment of damage severity degree, in fact, may be different among experts. The popularity of vulnerability matrices is based on the qualitative nature of results and the use of expert judgement to evaluate empirical data. For this reason, repeatability and comparison possibilities of results in different contexts are limited.
The approach here proposed is developed according to the flowchart shown in Figure 1: It is based on a logical structure which takes into account the vulnerability key factors: The movement kinematics and the characterization of the exposed elements.
To characterize landslide kinematics, knowledge of landslide inventory mapping, including location, boundary, and state of activity, has been taken into account, while the surveying and classification of landslide-induced damage level can be used as a convenient indicator of performance of road superstructure.
The following four main steps were implemented in an open source semiautomatic GIS routine, a key tool to facilitate the input, storage, analysis, integration, and output of spatial data which can help a real time decision making and strategic planning for effective risk management.
I. Preprocessing
To evaluate the feasibility of this approach over the area under investigation, a preprocessing step is required: Therefore, it is important to verify whether the acquisition of SAR images to assess intensity of instability phenomena, is affected by geometric and radiometric distortions. To estimate the visibility of an investigated area and the effect of topography on the presence of radar targets, the R-Index map [38,39] is generated starting from Digital Terrain Model (DTM) and geometric parameters of satellite orbit (incidence angle and orbit angle). The maximum value of the R-Index, equal to 1, corresponding to the best geometry detectable by the satellite, occurs when the slope is parallel to the ‘Line of Sight’ (LoS). On the other hand, the smaller the R-index, the more difficult it will be to detect PS. The extreme case is when R value is less than 0.4 and it tends to be 0. This is the case of the foreshortening effect, when no PS can be detected. The layover effect and the shadow effect occur when R-index is negative and no PS can be detected.
Furthermore, since SAR data are measured just along the LoS direction, a projection of these measurements along the direction of the maximum slope can be performed following the procedures proposed by [40] and subsequently by [41,42,43]. For each available point, the real displacement along slope direction is obtained by means of the “C” correction factor depending on satellite acquisition parameters (incidence angle and orbit angle), as well as topographic parameters (terrain slope and facing). The “C” factor represents the percentage of the target real movements which can be detected by satellite acquisition with a specific geometry of acquisition.
II.  Detection of ground instability kinematics
To characterize kinematics of slope instability phenomena, starting from geological and geomorphological settings, and available landslide inventory maps, a knowledge of the main characteristics, such as velocity and boundary, is required. In particular, as to define landslide intensity parameter, the mean displacement annual rate measured in the last year through the processing of SAR images has been taken into account.
The procedure to detect landslides kinematics interacting with linear infrastructures is developed according to the following phases:
(a)
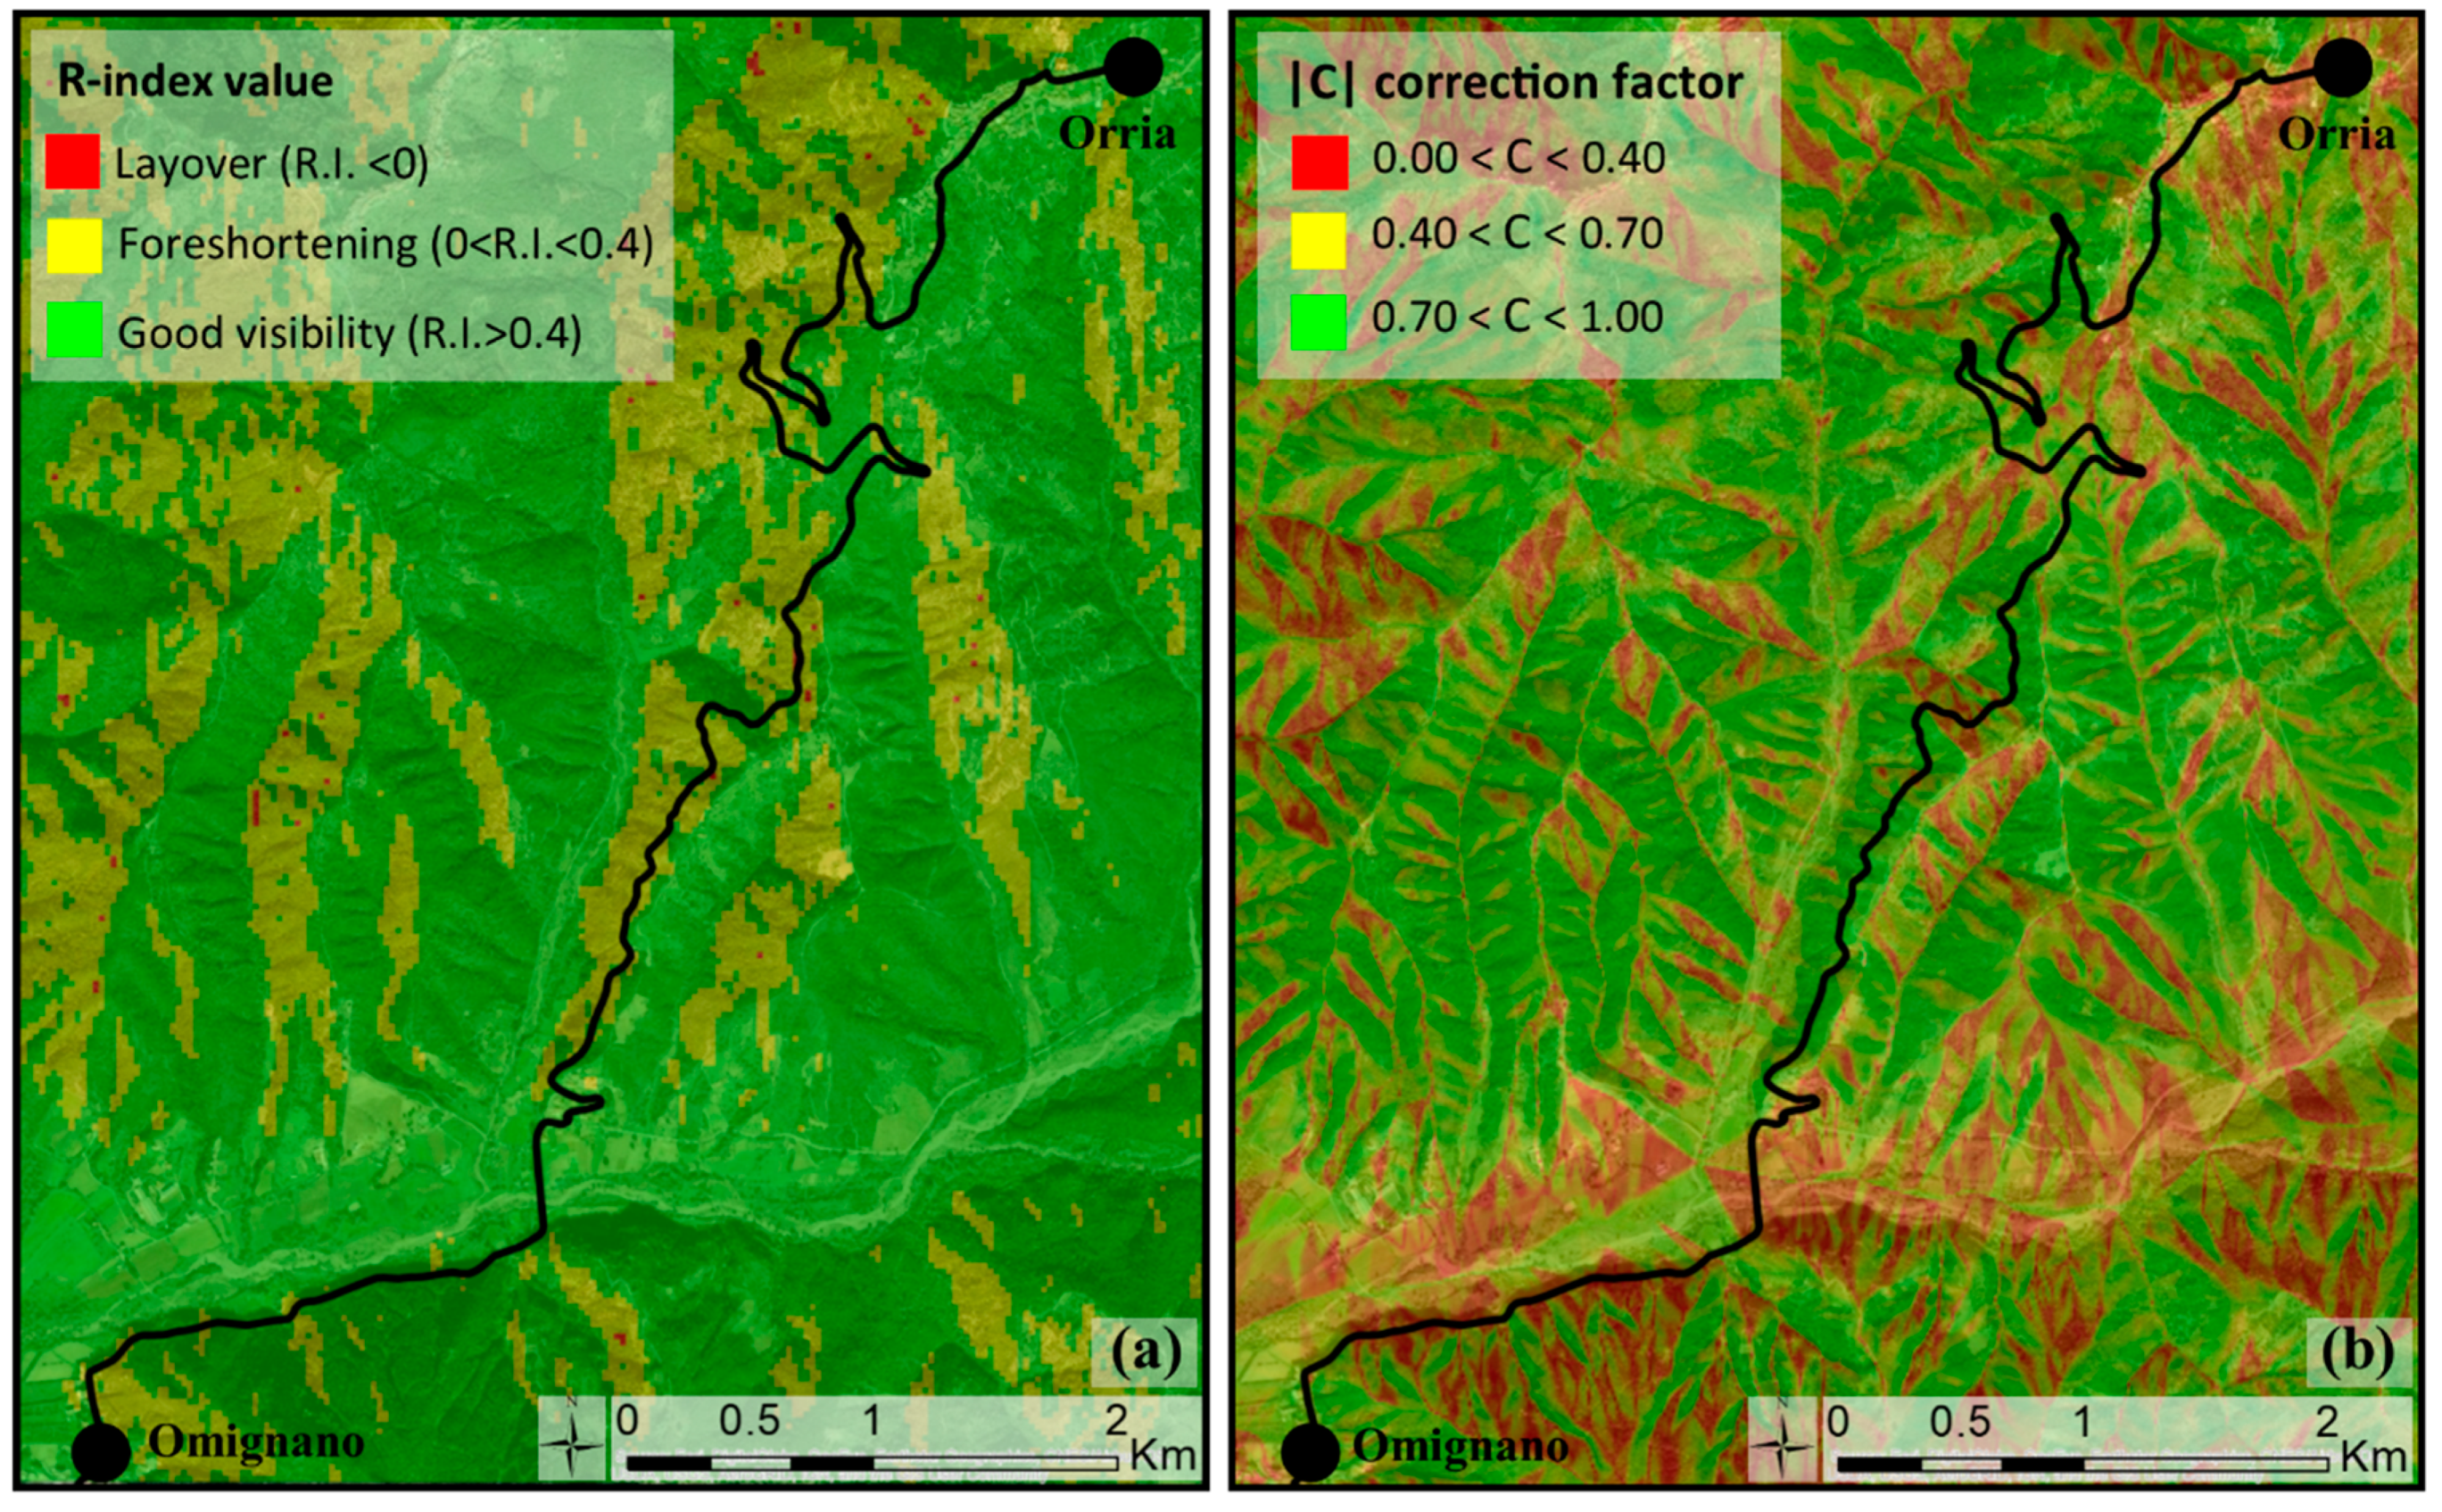
DInSAR processing: SAR images dataset has been processed by means of Coherence Pixels Technique [44]. The analysis has been carried out by exploiting the Temporal Sublook Coherence (TSC) approach [45] for pixel selection. Such technique (CPT-TSC), based on the analysis of phase difference in interferometric stacks, identifies reliable scatterers by measuring their multitemporal coherence related to the phase stability. The interferograms, defined as the phase difference between two different acquisitions, are generated to further reduce decorrelation effects associated with possible coherence losses, typically due to topographic distortions, atmospheric patterns, and radiometric distortions. The exploitation of DInSAR methods, using multi-temporal stacks of SAR images, allows to remove all these contributions and to isolate the phase related to the displacement occurring between the two acquisitions. As a result, displacement annual rate and time series along ‘LoS’ direction of each identified scatterer have been obtained. Subsequently, the real slope displacement is calculated through the ratio between ‘LoS’ value and “C” correction factor;
(b)
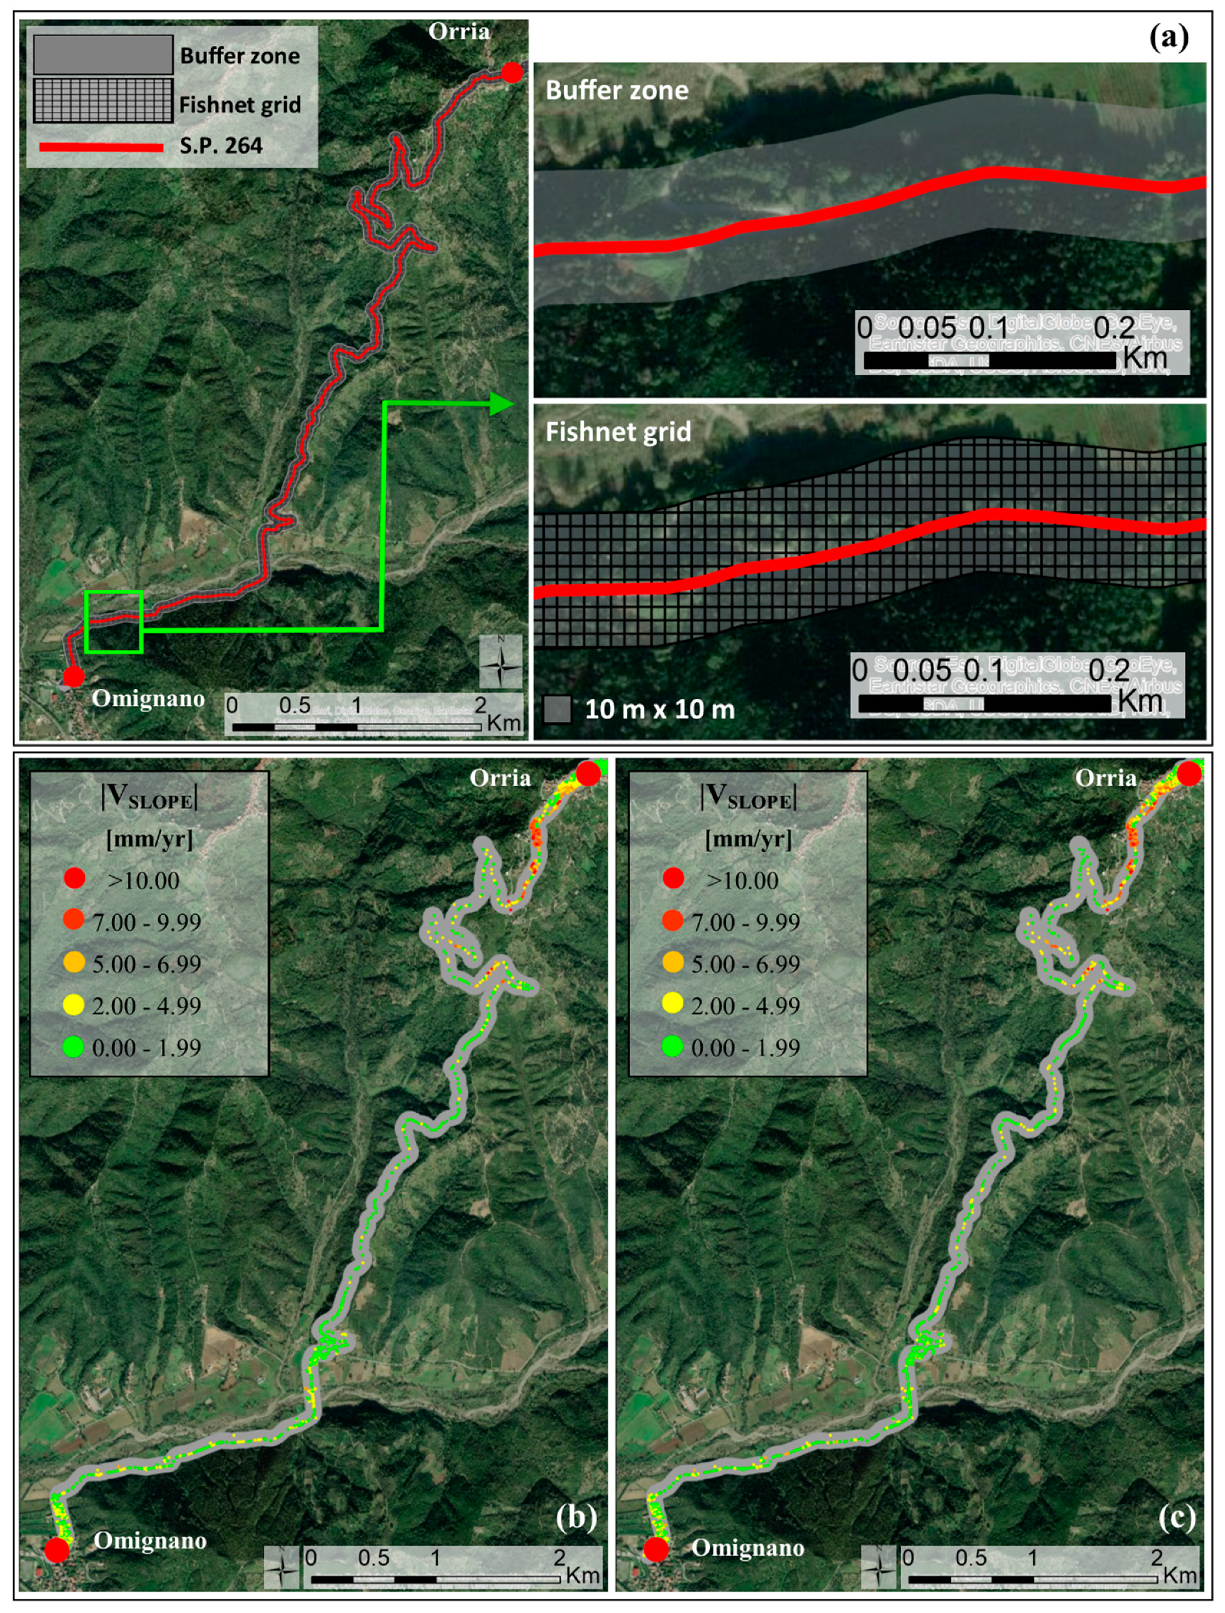
creation of a “buffer” zone and a “fishnet” grid: A buffer zone has been created along the linear infrastructure defined from the available digital topographic map and only scatterers identified within such area have been considered to investigate landslides intensity also in the surrounding areas; furthermore, inside it a “fishnet” grid with pixel size depending on the spatial resolution of interferometric products, has been implemented;
(c)
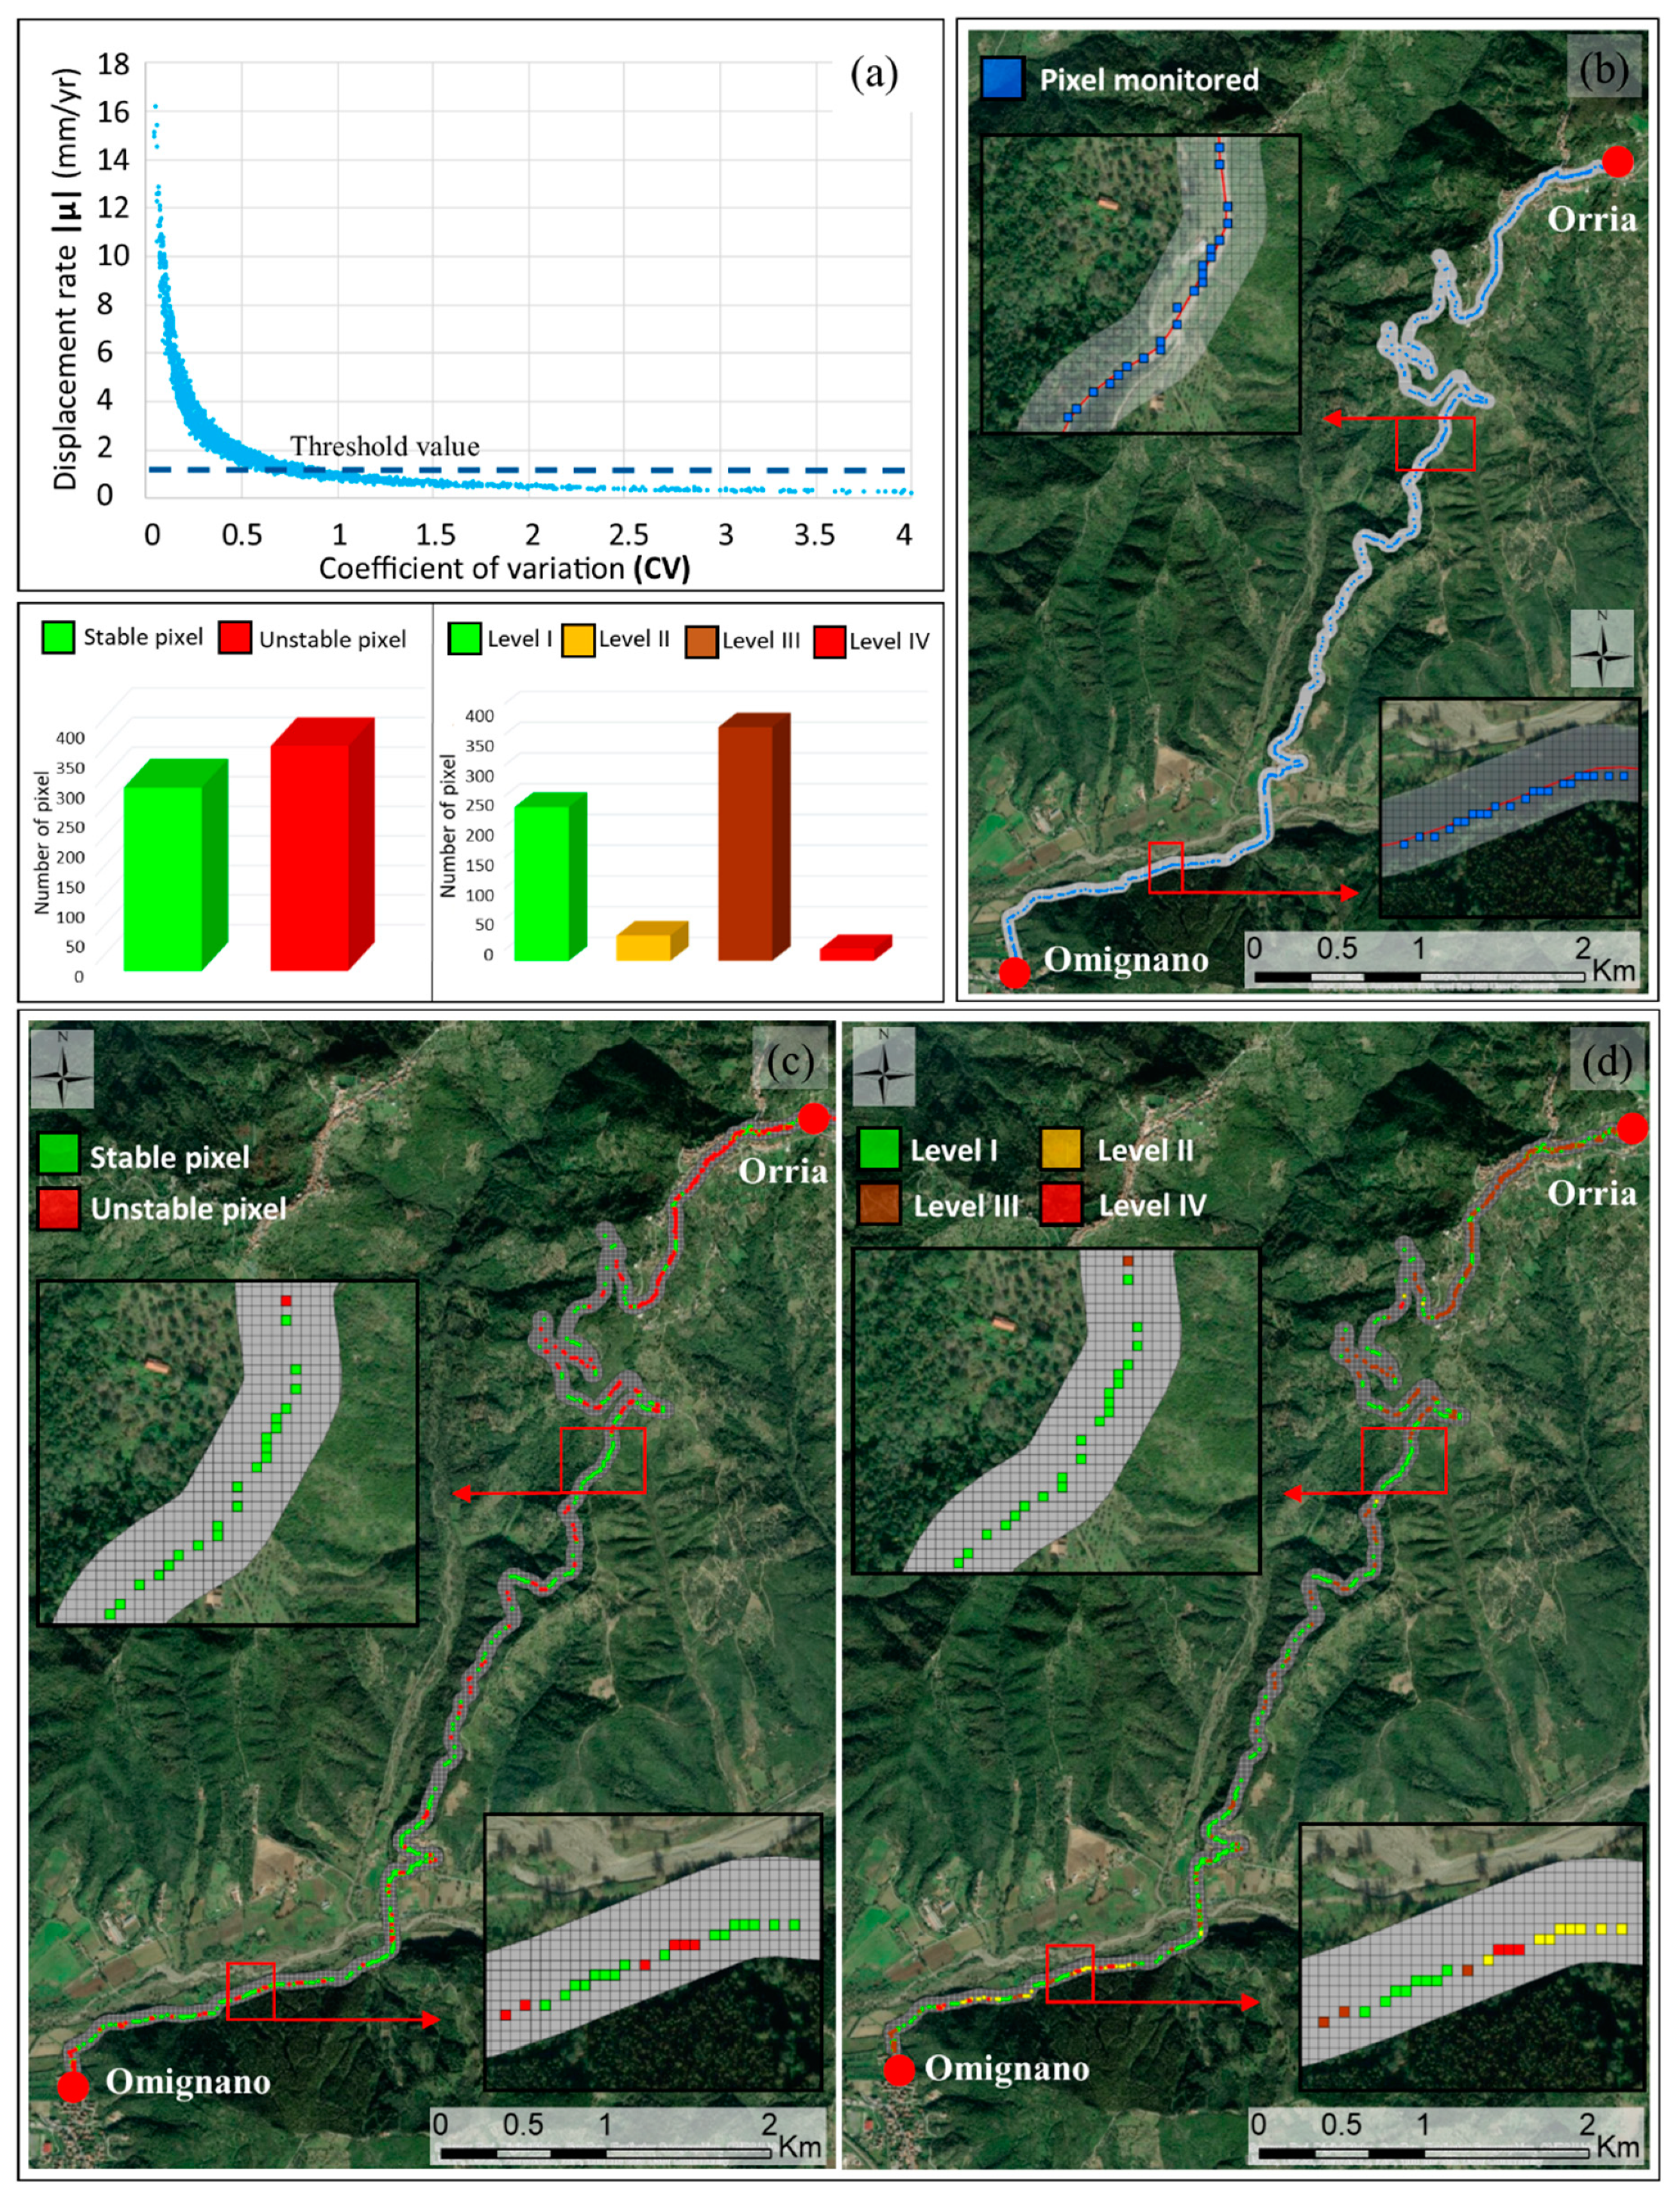
geostatistical analysis: Post-processing of SAR data is a crucial step for the identification of the anomalous areas [46]. Aimed to discriminate stable from unstable targets, a displacement rate threshold has been assessed by calculating a coefficient of variation (CV) of each target, given by the ratio between the standard deviation σ and the mean velocity module |μ|, for all selected scatterers identified inside the buffer zone. From the analysis of the CV distribution it is possible to detect velocity threshold as a value for which standard deviation is higher than the mean velocity value [20]. The comparison of velocity threshold value with the movement rate of each radar target identified inside the fishnet grid provides scatterers which can be considered unstable;
(d)
cluster analysis: As for the optimization of the results, a clustering process is also very useful. DInSAR processing results, in fact, consist of a high amount of points related to a deformation measurement: Such post-processing allows to identify, within fishnet grid, possible “anomalous” areas where similar displacement rate values tend to be clustered, by defining an “Homogeneity Index” (HI) which is the ratio between the number of moving targets and the total number of targets within each pixel of fishnet. Only pixels of fishnet grid with at least the 50% of “moving” targets inside have been considered as unstable, thus obtaining a map of stable/unstable pixels [20];
(e)
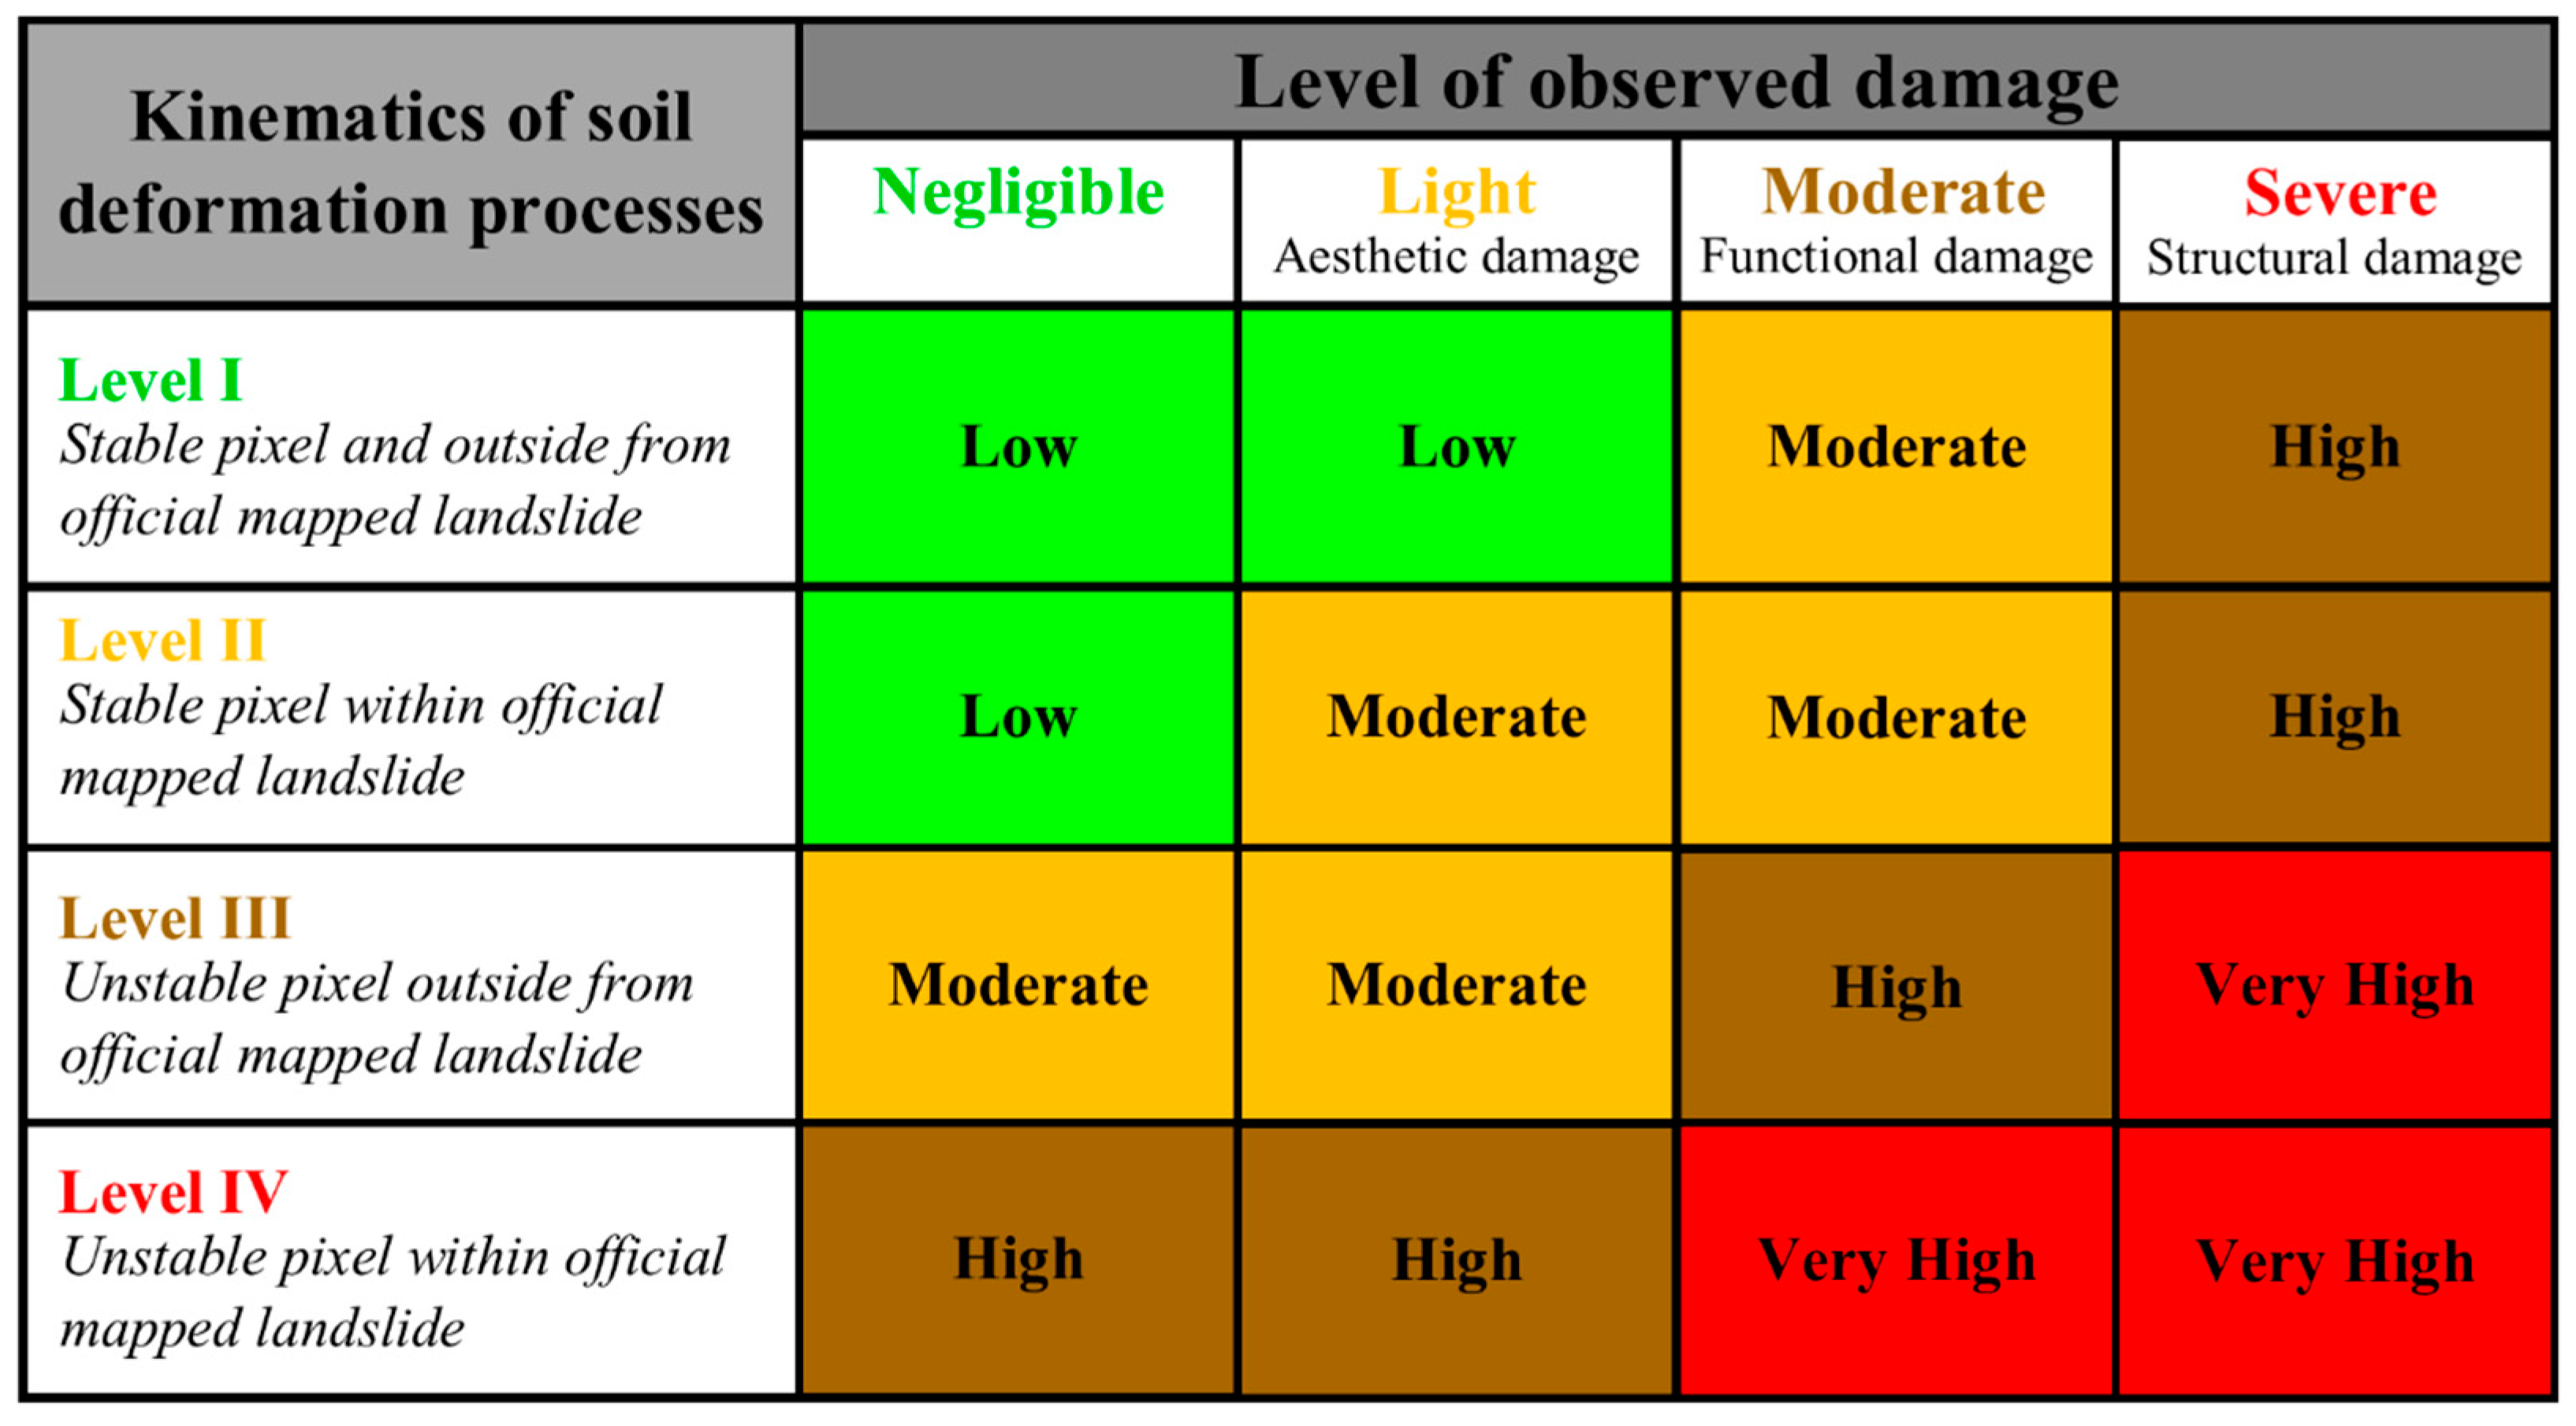
definition of “kinematics” zoning map: Finally, the integration of existing landslides inventory map and results of “cluster” analysis permits to identify, using a colour-based coding, pixels along linear infrastructure showing different kinematics. Four different levels characterized by a growing critical behavior can be defined:
-
Level I (green color): Pixel stable and outside from the officially mapped landslide;
-
level II (yellow color): Pixel stable within the officially mapped landslide;
-
level III (orange color): Pixel unstable and outside from the officially mapped landslide;
-
level IV (red color): Pixel unstable and within the officially mapped landslide.
III. Characterization of damage along linear infrastructures
Landslide-induced damage can be considered as a movement indicator to assess the spatial and temporal evolution of the infrastructure vulnerability. Displacements of the road surface induced by ground instability over time are cause of cracks occurrence on structural and non-structural elements.
A detailed approach for the surveying and classification of damage plays a key role in the strategy to better delineate mass-movement boundaries and state of activity, by categorizing its detectable impacts on the ground, as well as to improve knowledge of the instability, to avoid repeated occurrences and to plan mitigation measures.
Several studies investigate and suggest damage classification of infrastructures affected by landslides [26,47,48]; ref [49] propose a qualitative approach in landslide risk analysis and distinguish the following types of damage:
-
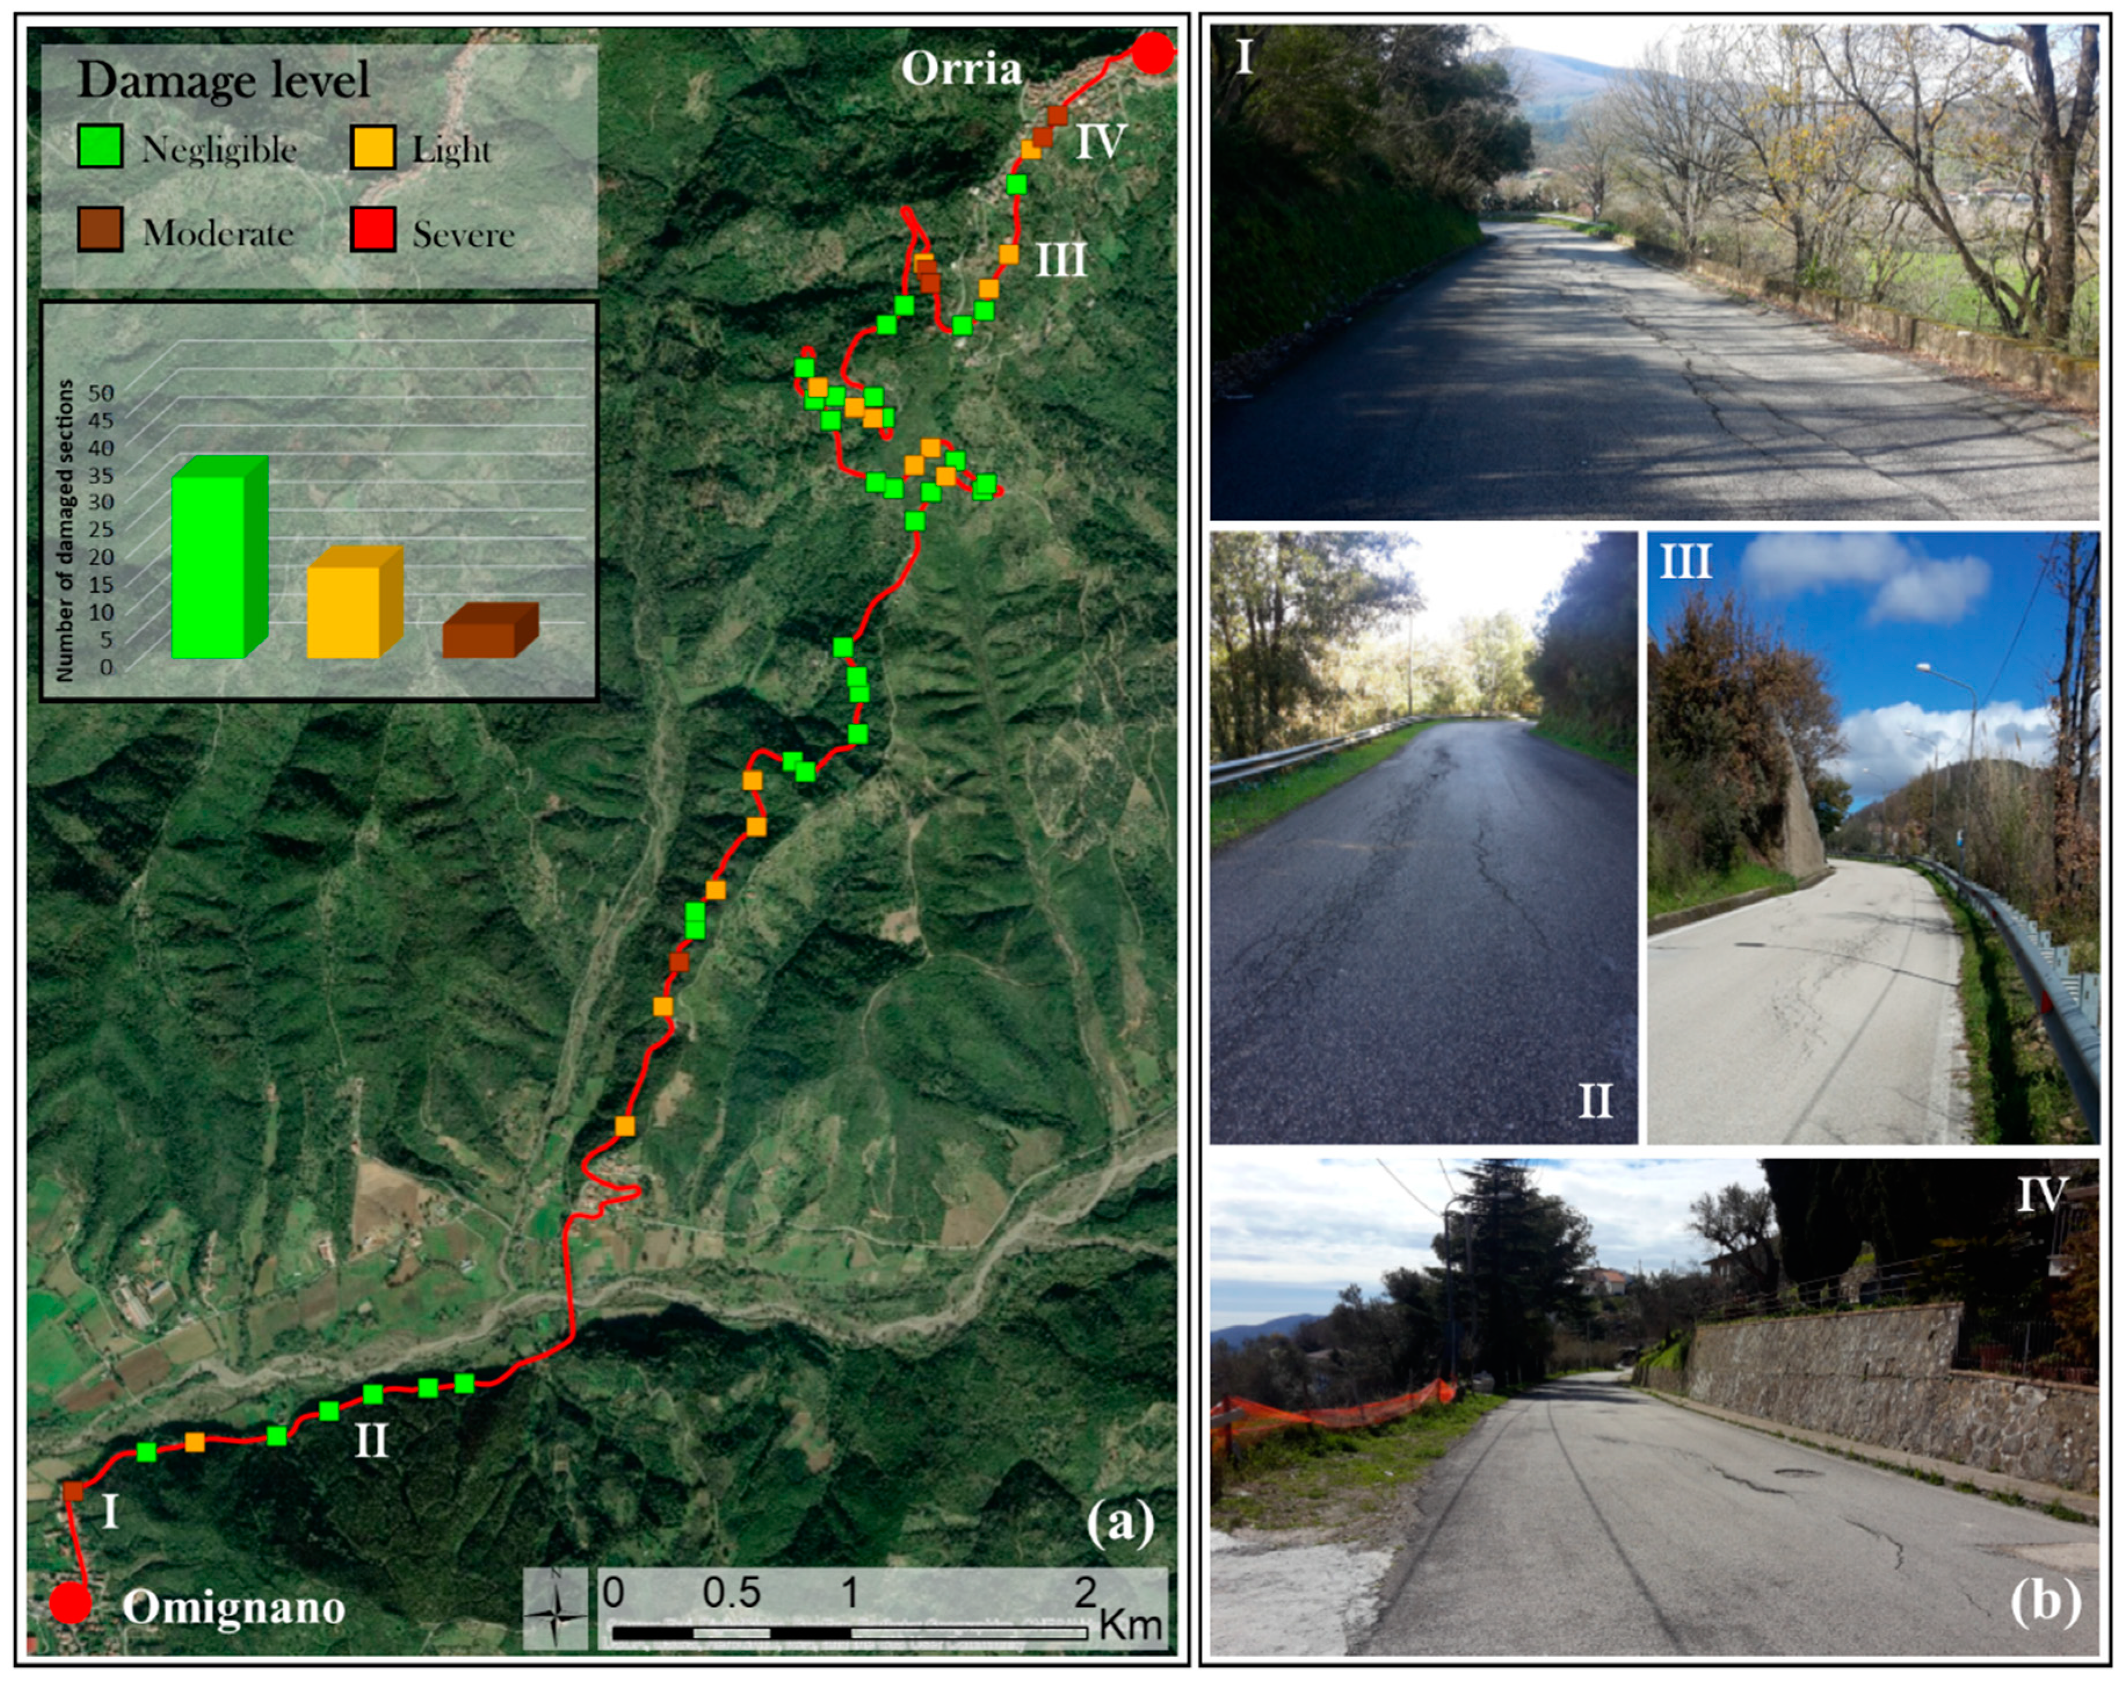
Negligible damage: No crack and deformation or isolated hairline cracks have been observed on pavement surface;
-
aesthetic (or light) damage: Limited small cracks, local roughness, and distortions occurred to road surface. The functionality of roads is not compromised and damage can be repaired, rapidly and at low cost;
-
Functional (moderate) damage: Diffuse cracking, severe deformations of pavement, possible partial collapse of superstructure. The functionality of the infrastructure is partially compromised and damage takes time and large resources to be fixed;
-
structural (or severe) damage: Structural failures, dangerous deformation, and total collapse of road superstructure occur. Transportation routes are severely or completely damaged and require extensive work to be rebuilt.
Classification of damage degree along linear infrastructure can be obtained through a detailed field survey; subsequently, this information has to be implemented in a GIS environment, thus providing a map of damaged sections with different level of severity.
IV. Identifying sections with different level of vulnerability
The two obtained datasets, represented by “kinematics” zoning map and damage map, as indicators respectively of ground instability intensity and linear infrastructure response, are merged in a qualitative 4 × 4 vulnerability matrix with a different value threshold of vulnerability, which provides a preliminary zoning map of different “vulnerable sections”. In particular, once the two datasets have been separately analyzed, the new matrix, by means of four different vulnerability levels, allows to characterize current damage susceptibility to ground movements (Figure 2).
It is important to highlight that such analysis can be performed only for pixels of fishnet in which satellite and damage data are available, in order to characterize both kinematics of ground movement.
According to such criterion, qualitative suggestions regarding intervention measures suitable to the different vulnerability levels can be provided:
-
“Low” vulnerability level: Acceptable. A periodical monitoring of ground kinematics and a control of in situ conditions can be recommended. No mitigation options need to be considered;
-
“Moderate” vulnerability level: May be tolerable. A periodical monitoring and controlling slope stability and in situ conditions with a higher frequency can be required and planning treatment options may be defined to maintain or reduce vulnerability;
-
“High” vulnerability level: A detailed investigation, planning, and implementation of measures to vulnerability reduction is required;
-
“Very High” vulnerability level: An extensive and detailed investigation and an expensive planning of stabilization measures are essential to reduce vulnerability to acceptable levels. Linear infrastructure could be useless.

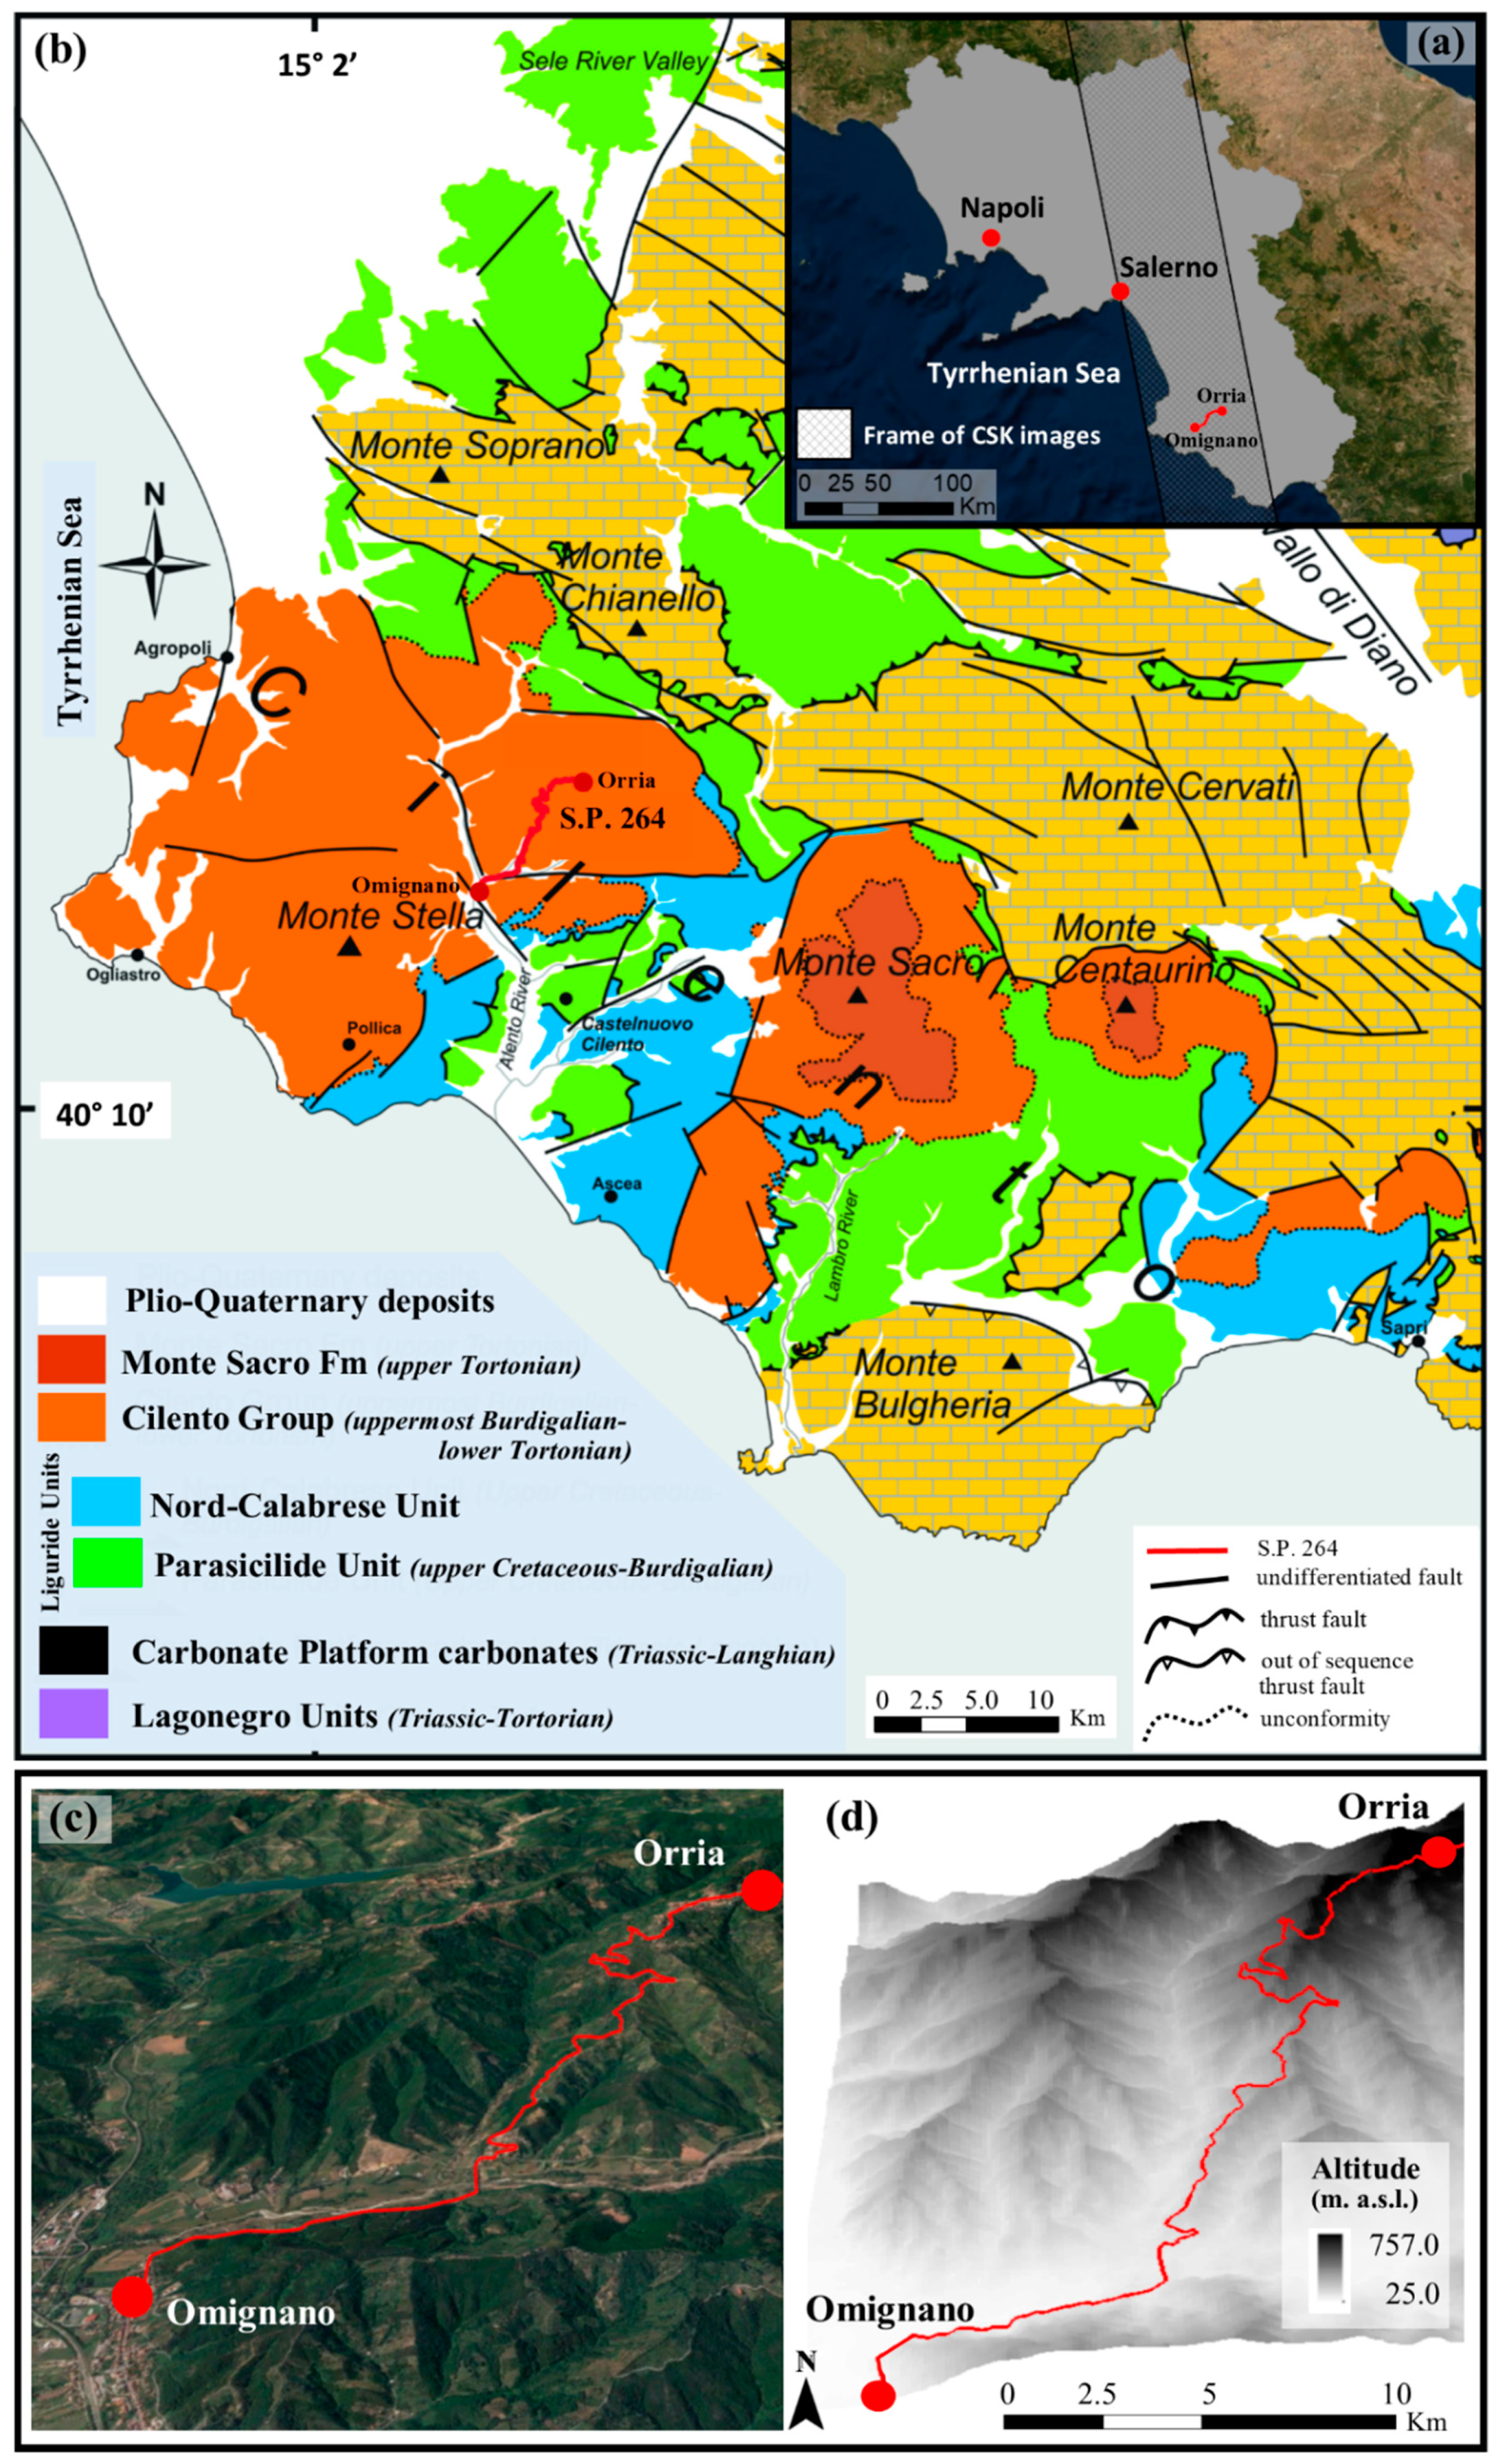
3. The Case Study of “P.R. 264” Linear Infrastructure

“I-PRO MONALISA” tool has been tested to investigate vulnerability of a part of Provincial Road “P.R. 264”, located in the Cilento, Vallo di Diano and Alburni National Park, in Salerno Province, southern Campania region (Italy). About 15 km long, the considered section of road overpasses three different villages: Omignano, Orria, and Salento. The study area is one of the most interesting in the Campania region, combining peculiar geological characteristics with valuable natural resources and different lithologic, structural, hydrogeologic, and geomorphologic settings (Figure 3).
In regards to tectonic setting, Cilento-Vallo di Diano and Alburni National Park belongs to the Southern Apennines fold and thrust belt, which developed between late Cretaceous and Pleistocene as a consequence of the interaction between the European and the African plates and of the spreading of the Tyrrhenian oceanic basin [50]. Due to the long time and complex lithogenetic and orogenetic history, several litho-stratigraphical units, in the form of nappes and/or irregular sequences can be distinguished. The study area is located along the Alento river valley where the main outcrops are represented by lithotypes of Sicilide Units and North Calabrian Units (Mesozoic-Tertiary) [51]; they are made up prevailingly of marly calcarenites, calcilutites, clays, often siliceous, sandy clays, sandstones, and conglomerates which had been sedimented in terrigenous basinal domains. In the area arenites mainly crops out intercalated with argillites and siltstones, called Pollica Formation, commonly weathered at the outcrop. Further, the investigated area is almost continuously overlaid by a heterogeneous debris cover, consisting of arenaceous and conglomeratic blocks of different sizes, in a silty-clayey matrix.
In regards to geomorphological setting, the test site is characterized by hilly morphologies with low-medium gradient slopes, widely affected by several erosional and gravitational phenomena: Among them, landslides hold a top-rank position. The lithological and hydrogeological differences of involved terrains are among the main factors predisposing to instability: Their lithological and structural features result in a poor mechanical strength and, thus, in a high ratio between the mobilized and the available shear resistance, even in the case of low angle slopes.
As shown in the official landslide map (Figure 4) provided by Hydro-geomorphological Setting Plan (HSP) of South Campania River Basin Authority in 2012, 24 landslides have been surveyed as interacting with a 100 m buffer zone along “P.R. 264” and classified as translational/rotational slides, slow moving flows, and debris flows. Moreover, in regards to the state of activity, in 2012, 22 landslides phenomena were classified as dormant and two as active. Due to the low seismicity of the area, local reactivations are usually triggered by intense and continuous rainfall, as demonstrated by damage occurrence in the limited portion of landslide boundary.

4. Results

As mentioned in paragraph 2, according to the proposed approach, a preprocessing step was performed: Firstly, the R-Index map (Figure 5a) has been generated to investigate the presence of radar targets along “P.R. 264”. In particular, having acquired satellite images along ascending orbit, visibility of the interested area in such geometry has been analyzed. Such analysis was generated starting from a 10 × 10 m DTM and geometric parameters of satellite acquisition (incidence angle: 30° and orbit angle: 10°).
As it is possible to note in R-Index maps, a good visibility and thus a high density of scatterers could be obtained by ascending images. Therefore, along most of the linear infrastructure, the R-index value is higher than 0.4, thus confirming a good detectable geometry.
Moreover, the map of “C” correction factor (Figure 5b), representing the percentage of target real movements which can be detected by interferometric products, has been obtained as a function of DTM, satellite acquisition parameters above-mentioned, and topographic parameters (terrain slope and aspect). It is worthwhile to highlight that, along the P.R. 264 linear infrastructure, the factor C shows positive values and most of them range from 0.7 to 1.0.
Subsequently, in order to characterize ground movement kinematics, 52 Very High Resolution (VHR) (StripMap, up to 3 m resolution) COSMO-SkyMed ascending images, acquired in time-span 25 January 2012–01 January 2015, have been processed by means of the ‘SUBSOFT’ software. The SUBSOFT processor has been developed by the Remote Sensing Lab of the Universitat Politecnica de Catalunya of Barcelona, Spain, using the CPT-TSC approach. To detect scatterers with high phase quality, only the interferograms whose image pairs had spatial and temporal baselines lower than fixed values, have been selected. In detail, 250 m and 250 days, respectively, have been fixed.
Furthermore, owing to the need to have a sufficient number of targets covering the entire study area, and to display at the same time a good phase standard deviation of approximately 20°, corresponding to a displacement standard deviation of 1.5 mm, a threshold value of coherence equal to 0.75 has been set. As a result, mean displacement velocity, annual displacement velocity, and displacement time series of identified scatterers, measured along the line of sight (LoS), have been obtained. The real slope displacement of each target, which can be considered as a quantitative evaluation of the projection of VLOS along the local slope is calculated by the ratio between ‘LoS’ value and the “C” correction factor calculated for the corresponding pixel.
The high spatial resolution of COSMO-SkyMed data (3 × 3 m) and the high density of points of measurement regarded allows to reduce the level of uncertainties and error (equal to about ± 1.5 mm/yr for linear velocity and about ± 4.0 mm for single displacement).
The main characteristics of the used SAR data, C factor values, and V-SLOPE (velocity along the slope) range measurements are shown in Table 1. It is important to highlight that, to detect intensity of ground instability phenomena in the surrounding areas and induced deformations of road surface, a 100 m buffer-distance along the linear infrastructure has been created, and inside it a fishnet grid with pixel size of 10 × 10 m has been implemented. Only scatterers selected within such area have been considered: About 1876 targets have been identified by CPT processing with an average of more than 600 PS/km2. Maps of absolute value of displacement rates along slope direction in the analyzed period (January 2012–January 2015) and in the last year (2014) are shown in Figure 6.
It is worth to point out that scatterers localized within the considered area correspond to man-made features, such as road surface, buildings, retaining walls, and electricity pylons.

4.1. Assessment of Ground Instability Kinematics by Available Landslide Inventory Map and Satellite Interferometric Products

As established in the second step of the proposed approach, displacement rate of interferometric products measured in the last year (Figure 6c) has been taken into account to investigate kinematics of ground instability phenomena, in January 2015. Interferometric products highlighted the occurrence of very slow-moving phenomena, with annual displacement velocities in the order of some mm/year. In fact, the maximum displacement rate in the last year is about 18 mm/year.
A geostatistical cluster analysis of identified targets was performed to select stable and unstable pixels (Figure 7). Firstly, to define the threshold value discriminating stable from unstable targets, the distribution of the modulus of velocities along slope direction versus their coefficient of variation (CV), given by the ratio between the standard deviation σ and the velocity modulus |μ|, for all selected scatterers, has been considered. The threshold value determined is about 2 mm/year and corresponds to a value for which standard deviation is higher than mean velocity value (positive correlation coefficient, CV ≥ 1) (Figure 7a). The comparison between displacement velocity threshold value and velocities measured in the last year (2014) for each target, highlighted that about 48% out of 1876 targets recorded within the considered buffer area was classified as unstable.
It should be noted that such analysis is feasible only for pixels inside which at least one target has been identified. About 690 pixels within the fishnet grid could be monitored by using satellite products (Figure 7b): Most of them are located on a linear infrastructure pavement, while a few pixels have been identified in the surrounding areas characterized by the presence of diffuse vegetation.
Subsequently, the clustering process based on Homogeneity Index definition, allowed to identify anomalous and unstable pixels, defined as the ones with at least 50% of “unstable” targets inside them (HI ≥ 0.5) (Figure 7c). About 380 pixels were classified as unstable, while 310 as stable.
Finally, the integration of existing HSP landslide inventory map (Figure 4) and of stable/unstable pixels map (Figure 7c) provided, for each detectable pixel, a corresponding kinematics level in January 2015 (Figure 7d).

4.2. In Situ Damage Survey

Survey of damage occurred along the analyzed part of “P.R. 264” has been done through field campaigns performed during the period November 2014–January 2015, according to the approach proposed by Cardinali et al. (2002). In detail, 54 sections covering about 150 pixels of fishnet grid, characterized by damage occurrence, have been surveyed (Figure 8): Among these, 32 showed a negligible level with isolated hairline cracks, 16 showed a light level with limited small cracks or local distortions of road surface, six were characterized by a moderate damage degree with diffuse open cracking and severe deformations of superstructure. In the other parts of “P.R. 264”, no damage has been recorded.

4.3. Vulnerability Zoning Map

The proposed matrix-based approach provided a vulnerability zoning map in January 2015 by combining, for each pixel, information on ground instability kinematics and damage level. It should be highlighted that such analysis is feasible only for pixels inside which both data were available. “P.R. 264” vulnerability map defines a “priority action” zoning map, identifying sections along linear infrastructure characterized by different levels of damage susceptibility. As shown in Figure 9, out of 690 pixels examined, 392 pixels showed a low vulnerability level, 222 a moderate level, and 75 a high level. No pixel is characterized by a very high vulnerability condition.
A good correspondence among landslides intensity, damage occurred, and vulnerability distribution, as indicator of a preliminary cause–effect relationship, has been obtained. In the considered test area, slow moving landslides interacting with “P.R. 264”, characterized by low displacement rate (in the order of some mm/year), generally induced low and medium vulnerability levels. Occurred movements commonly caused light deformations and limited small cracks on road surface. It can be noticed that only annual displacement rates higher than 20 mm/year caused a moderate and high vulnerability level. In the latter case the functionality of the infrastructure is partially were compromised and detailed geological and geotechnical analyses are required to urgently plan stabilization measures (Figure 9b).

5. Discussion

The cross-comparison of interferometric products, in situ damage survey results, and available HSP landslide inventory map showed a good correspondence between cause (landslide-induced movement) and effect (damage along road surface), leading at identifying sections along linear infrastructure characterized by different damage susceptibility.
Furthermore, a significant advantage of the proposed approach is that it enabled to identify new ground instability phenomena, thus obtaining a new landslide inventory map updated to January 2015. High density of COSMO-SkyMed data allowed to investigate deformations along the whole linear infrastructure development. Therefore, all 24 historical landslides interacting with “P.R. 264”, mapped by Hydro-geomorphological Setting Plan (HSP) of South Campania River Basin Authority in 2012, are covered by interferometric measurements; in addition, starting from topographic and stable/unstable pixels maps, results of geomorphological field campaigns detected 30 new events (Figure 10a). To this purpose, the distribution of unstable pixels along linear infrastructure, as an indicator of ground movement occurrence, facilitates the identification of anomalous zones where on- site checks and surveys have been carried out in order to validate all the information performed through satellite radar interpretation. Damage on road pavement, on surrounding buildings and infrastructures, and other geomorphological indicators and features induced by ground instability, allowed to define the boundary of new mapped phenomena. No landslide detected through interferometric measurements, but not identified in the field, has been mapped; instead, one landslide movement not identified by satellite data, but surveyed in the field, has been mapped. Such event, undetected by the satellite, mostly occurred in the surrounding vegetated area of P.R. 264, where no scatterers have been identified.
The updated map contains not only the new instability phenomena investigated through both satellite data and field surveys, but also the updated information concerning the state of activity of both the new and historical landslides (Figure 10b). Indeed, the satellite in situ data engineering-geological inter-comparison allowed to classify as active the new 30 mapped phenomena (areas affected by new landslides in January 2015): moreover, over out of 24 historical landslides (HSP, 2012), 14 reactivations (areas classified as dormant in 2012 affected by likely local reactivations) and 10 phenomena characterized by a continuous landslide activity (eight dormant and two active in 2012) have been assessed.
The study of the “P.R. 264” vulnerability through the proposed procedure has led to interesting results, also considering the fact that this is one of the first applications using “I-Pro MONALISA” tool. It is worth to recall that such approach represents an engineering inter-comparison of both the satellite analysis and the field survey results combined with available geological information, thanks to the total absence of shared and mutual influences in drafting the maps shown in Figure 7 and Figure 8. Ground instability kinematics and damage survey data should be carried out separately, and after merged to update available landslide inventory map and to investigate road vulnerability, as output.
The results of our study confirm that differential radar interferometry technique can be conveniently used to control the behavior of linear infrastructures affected by ground instability phenomena over large areas. It should be clearly stated that satellite measurements never give directly structural information, but combined with on-site information, such as damage, construction typology, and materials, contribute to a qualitative assessment of road health and performance (Table 2).

6. Conclusions

I-Pro MONALISA may help in the identification and characterization of the road stretches affected by different level of vulnerability, allowing to detect movements from slow to very slow, notoriously difficult to be recognized by direct observation. Furthermore, temporal measurement frequency (8–16 days) of COSMO-SkyMed constellation permits firstly to periodically update landslide inventory map and subsequently to control structural condition of road surface, thus developing a quasi-real time monitoring system.
High spatial resolution (3 × 3 m) of these radar images provides highly accurate vulnerability information at a single section of analysis: Vulnerability map, as a final result, defines a priority action zoning map, identifying anomalous areas characterized by a high level of damage susceptibility which require site-specific monitoring.
Therefore, by means of I-Pro MoNaLISa we can identify different purposes such as:
(a) Directing technician verification in situ, (b) planning of maintenance and rehabilitations, (c) structural health assessments, (d) emergency management, (e) users and travelers’ information. Such kind of system would represent a great innovation in the actual Italian control system, based on visual inspections for the anomalies detection, demanded to technicians.
I-Pro MoNaLISa aims at reducing the long time-lapse between in situ data collection and information transfer to the operation center, being based on a database of critical sections that the technicians can implement in situ quasi real time; furthermore, not requesting any direct contact with the infrastructure, such system can eliminate the necessity of lane closure and traffic disruption or the preparation of the structure before the acquisition. In the last years, early response systems improvement turns out to be a key topic to avoid heavy social and economic consequences of possible failures.

Author Contributions

Conceptualization, D.I. and D.D.M.; Methodology D.D.M. and D.I.; Validation P.M.; Writing—original draft preparation D.I. and P.M.; Writing—review and editing D.C. and A.S.d.S.; Supervision D.C. and M.R.

Funding

This research received no external funding.

Acknowledgments

Many thanks are due to DARES technology for the support to DInSAR elaborations. The project was carried out using CSK® Products, © of ASI, delivered under a license to use by ASI. The authors are grateful to the precious support given by the anonymous reviewers for their valuable observations and suggestions to improve the quality of the paper.

Conflicts of Interest

The authors declare no conflict of interest.

References

  1. Istituto di Ricerca per la Protezione Idrogeologica (IRPI), del Consiglio Nazionale delle Ricerche (CNR). Periodical Report about Landslide and Flood Hazard to Italian People; Institute for Environmental Protection and Research (ISPRA): Perugia, Italy, 2018. (In Italian)
  2. Martino, S.; Bozzano, F.; Caporossi, P.; D’Angiò, D.; Della Seta, M.; Esposito, C.; Fantini, A.; Fiorucci, M.; Giannini, L.M.; Iannucci, R.; et al. Impact of landslides on transportation routes during the 2016–2017 Central Italy seismic sequence. Landslides 2019, 16, 1221–1241. [Google Scholar] [CrossRef]
  3. Brownjohn, J.M. Structural health monitoring of civil infrastructure. Philos. Trans. R. Soc. Lond. Math. Phys. Eng. Sci. 2007, 365, 589–622. [Google Scholar] [CrossRef] [PubMed] [Green Version]
  4. Sousa, J.J.; Bastos, L. Multi-temporal SAR interferometry reveals acceleration of bridge sinking before collapse. Nat. Hazards Earth Syst. Sci. 2013, 13, 659–667. [Google Scholar] [CrossRef]
  5. Dragos, K.; Smarsly, K. Decentralized infrastructure health monitoring using embedded computing in wireless sensor networks. In Dynamic Response of Infrastructure to Environmentally Induced Loads; Springer: Cham, Switzerland, 2017; pp. 183–201. [Google Scholar]
  6. Fornaro, G.; Reale, D.; Verde, S. Potential of SAR for monitoring transportation infrastructures: An analysis with the multi-dimensional imaging technique. J. Geophys. Eng. 2012, 9, S1–S9. [Google Scholar] [CrossRef]
  7. Novellino, A.; Cigna, F.; Sowter, A.; Syafiudin, M.F.; Di Martire, D.; Ramondini, M.; Calcaterra, D. Intermittent small baseline subset (ISBAS). SAR analysis to monitor landslides in Costa della Gaveta, Southern Italy 2015. In Proceedings of the IEEE International Geoscience and Remote Sensing Symposium, IGARSS, Milan, Italy, 26–31 July 2015; pp. 3536–3539. [Google Scholar]
  8. Casagli, N.; Cigna, F.; Bianchini, S.; Hölbling, D.; Füreder, P.; Righini, G.; Del Conte, S.; Friedl, S.; Schneiderbauer, C.; Iasio, C.; et al. Landslide mapping and monitoring by using radar and optical remote sensing: Examples from the EC-FP7 project SAFER. Remote Sens. Appl. Soc. Environ. 2016, 4, 92–108. [Google Scholar] [CrossRef] [Green Version]
  9. Tomás, R.; Li, Z. Earth observations for geohazards: Present and future challenges. Remote Sens. 2017, 9, 194. [Google Scholar] [CrossRef] [Green Version]
  10. Zhang, Y.; Meng, X.; Jordan, C.; Novellino, A.; Dijkstra, T.; Chen, G. Investigating slow-moving landslides in the Zhouqu region of China using InSAR time series. Landslides 2018, 15, 1299–1315. [Google Scholar] [CrossRef]
  11. Costantini, M.; Zhu, M.; Huang, S.; Bai, S.; Cui, J.; Minati, F.; Vecchioli, F.; Jin, D.; Hu, Q. Automatic detection of building and infrastructure instabilities by spatial and temporal analysis of InSAR measurements. In Proceedings of the IGARSS 2018-2018 IEEE International Geoscience and Remote Sensing Symposium, Valencia, Spain, 22–27 July 2018; pp. 2224–2227. [Google Scholar]
  12. Pappalardo, G.; Mineo, S.; Angrisani, A.C.; Di Martire, D.; Calcaterra, D. Combining field data with infrared thermography and DInSAR surveys to evaluate the activity of landslides: The case study of Randazzo Landslide (NE Sicily). Landslides 2018, 15, 2173–2193. [Google Scholar] [CrossRef]
  13. Confuorto, P.; Di Martire, D.; Infante, D.; Novellino, A.; Papa, R.; Calcaterra, D.; Ramondini, M. Monitoring of remedial works performance on landslide-affected areas through ground- and satellite-based techniques. Catena 2019, 178, 77–89. [Google Scholar] [CrossRef]
  14. Pastor, J.L.; Tomás, R.; Lettieri, L.; Riquelme, A.; Cano, M.; Infante, D.; Ramondini, M.; Di Martire, D. Multi-Source Data Integration to Investigate a Deep-Seated Landslide Affecting a Bridge. Remote Sens. 2019, 11, 1878. [Google Scholar] [CrossRef] [Green Version]
  15. Wasowski, J.; Pisano, L. Long-term InSAR, borehole inclinometer, and rainfall records provide insight into the mechanism and activity patterns of an extremely slow urbanized landslide. Landslides 2019, 1–13. [Google Scholar] [CrossRef]
  16. Grebby, S.; Orynbassarova, E.; Sowter, A.; Gee, D.; Athab, A. Delineating ground deformation over the Tengiz oil field, Kazakhstan, using the Intermittent SBAS (ISBAS) DInSAR algorithm. Int. J. Appl. Earth Obs. Geoinf. 2019, 81, 37–46. [Google Scholar] [CrossRef]
  17. Gee, D.; Sowter, A.; Grebby, S.; de Lange, G.; Athab, A.; Marsh, S. National geohazards mapping in Europe: Interferometric analysis of the Netherlands. Eng. Geol. 2019, 256, 1–22. [Google Scholar] [CrossRef]
  18. Poreh, D.; Iodice, A.; Riccio, D.; Ruello, G. Railways’ stability observed in Campania (Italy) by InSAR data. Eur. J. Remote Sens. 2016, 49, 417–431. [Google Scholar] [CrossRef] [Green Version]
  19. Tessitore, S.; Di Martire, D.; Calcaterra, D.; Infante, D.; Ramondini, M.; Russo, G. Multitemporal synthetic aperture radar for bridges monitoring. In Remote Sensing Technologies and Applications in Urban Environments II; 104310C; International Society for Optics and Photonics: Bellingham, DC, USA, 2017; Volume 10431. [Google Scholar]
  20. Infante, D.; Di Martire, D.; Confuorto, P.; Tessitore, S.; Ramondini, M.; Calcaterra, D. Differential SAR interferometry technique for control of linear infrastructures affected by ground instability phenomena. Int. Arch. Photogramm. Remote Sens. Spat. Inf. Sci. ISPRS Arch. 2018, 42, 251–258. [Google Scholar] [CrossRef] [Green Version]
  21. Peduto, D.; Korff, M.; Nicodemo, G.; Marchese, A.; Ferlisi, S. Empirical fragility curves for settlement-affected buildings: Analysis of different intensity parameters for seven hundred masonry buildings in The Netherlands. Soils Found. 2019, 59, 380–397. [Google Scholar] [CrossRef]
  22. Infante, D.; Di Martire, D.; Confuorto, P.; Tessitore, S.; Tòmas, R.; Calcaterra, D.; Ramondini, M. Assessment of building behavior in slow-moving landslide-affected areas through DInSAR data and structural analysis. Eng. Struct. 2019, 199, 109638. [Google Scholar] [CrossRef] [Green Version]
  23. Milillo, P.; Giardina, G.; Perissin, D.; Milillo, G.; Coletta, A.; Terranova, C. Pre-Collapse Space Geodetic Observations of Critical Infrastructure: The Morandi Bridge, Genoa, Italy. Remote Sens. 2019, 11, 1403. [Google Scholar] [CrossRef] [Green Version]
  24. Tomás, R.; Pagán, J.I.; Navarro, J.A.; Cano, M.; Pastor, J.L.; Riquelme, A.; Cuevas-González, M.; Crosetto, M.; Barra, A.; Monserrat, O.; et al. Semi-automatic identification and pre-screening of geological–geotechnical deformational processes using persistent scatterer interferometry datasets. Remote Sens. 2019, 11, 1675. [Google Scholar]
  25. Fell, R. Landslide risk assessment and acceptable risk. Can. Geotech. J. 1994, 31, 261–272. [Google Scholar] [CrossRef]
  26. Leone, F.; Asté, J.P.; Leroi, E. Vulnerability assessment of elements exposed to mass-movement: Working toward a better risk perception. In Landslides; Senneset, K., Ed.; Balkema, A.A. Publishers: Rotterdam, The Netherlads, 1996; pp. 263–269. [Google Scholar]
  27. Amatruda, G.; Bonnard, C.; Castelli, M.; Forlati, F.; Giacomelli, L.; Morelli, M.; Paro, L.; Piana, F.; Pirulli, M.; Polino, R.; et al. A key approach: The imiriland project method. In Identification and Mitigation of Large Landslide Risks in Europe. Advances in Risk Assessment; Bonnard, C.H., Forlati, F., Scavia, C., Eds.; Balkema, A.A. Publishers: Rotterdam, The Netherlads, 2004; pp. 13–43. [Google Scholar]
  28. Van Westen, C.J. Geo-information tools for landslide risk assessment: An overview of recent developments. In Landslides: Evaluation and Stabilization, Proceedings of Ninth International Symposium on Landslides, Rio De Janeiro, Brazil, 28 June–2 July 2004; Lacerda, W., Ehrlich, M., Fontoura, S.A.B., Sayão, A.S.F., Eds.; Balkema, A.A. Publishers: Rotterdam, The Netherlads, 2004; Volume 1, pp. 39–56. [Google Scholar]
  29. Negulescu, C.; Foerster, E. Parametric studies and quantitative assessment of the vulnerability of a RC frame building exposed to differential settlements. Nat. Hazards Earth Syst. Sci. 2010, 10, 1781–1792. [Google Scholar] [CrossRef] [Green Version]
  30. Pitilakis, K.; Fotopoulou, S.D. Fragility curves for reinforced concrete buildings to seismically triggered slow-moving slides. Soil Dyn. Earthq. Eng. 2013, 48, 143–161. [Google Scholar] [CrossRef]
  31. Mavrouli, O.; Fotopoulou, S.; Pitilakis, K.M.; Zuccaro, G.; Corominas, J.; Santo, A.; Cacace, F.; De Gregorio, D.; Di Crescenzo, G.; Foerster, E.; et al. Vulnerability assessment for reinforced concrete buildings exposed to landslides. Bull. Eng. Geol. Environ. 2014, 73, 265–289. [Google Scholar] [CrossRef]
  32. Ferlisi, S.; Peduto, D.; Gullà, G.; Nicodemo, G.; Borrelli, L.; Fornaro, G. The use of DInSAR data for the analysis of building damage induced by slow-moving landslides. In Engineering Geology for Society and Territory—Landslide Processes; Lollino, G., Giordan, D., Crosta, G.B.J., Corominas, J., Azzam, R., Wasowski, J., Sciarra, N., Eds.; Springer International Publishing: Berlin, Germany, 2015; Volume 2, pp. 1835–1839. [Google Scholar]
  33. Peduto, D.; Nicodemo, G.; Maccabiani, J.; Ferlisi, S.; D’Angelo, R.; Marchese, A. Investigating the behaviour of buildings with different foundation types on soft soils: Two case studies in the Netherlands. Procedia Eng. 2016, 158, 529–534. [Google Scholar] [CrossRef] [Green Version]
  34. Del Soldato, M.; Bianchini, S.; Calcaterra, D.; De Vita, P.; Di Martire, D.; Tomás, R.; Casagli, N. A new approach for landslide-induced damage assessment. Geomat. Natl. Hazards Risk 2017, 8, 1524–1537. [Google Scholar] [CrossRef]
  35. Dai, F.C.; Lee, C.F.; Ngai, Y.Y. Landslide risk assessment and management: An overview. Eng. Geol. 2002, 64, 65–87. [Google Scholar] [CrossRef]
  36. Corominas, J.; van Westen, C.; Frattini, P.; Cascini, L.; Malet, J.P.; Fotopoulou, S.; Catani, F.; Van Den Eeckhaut, M.; Mavrouli, O.; Agliardi, F.; et al. Recommendations for the quantitative analysis of landslide risk. Bull. Eng. Geol. Environ. 2014, 73, 209–263. [Google Scholar] [CrossRef]
  37. Infante, D.; Confuorto, P.; Di Martire, D.; Ramondini, M.; Calcaterra, D. Use of DInSAR Data for Multi-level Vulnerability Assessment of Urban Settings Affected by Slow-moving and Intermittent Landslides. Procedia Eng. 2016, 158, 470–475. [Google Scholar] [CrossRef] [Green Version]
  38. Notti, D.; Davalillo, J.C.; Herrera, G.; Mora, O. Assessment of the performance of X-band satellite radar data for landslide mapping and monitoring: Upper Tena Valley case study. Nat. Hazards Earth Syst. Sci. 2010, 10, 1865–1875. [Google Scholar] [CrossRef]
  39. Notti, D.; Herrera, G.; Bianchini, S.; Meisina, C.; García-Davalillo, J.C.; Zucca, F. A methodology for improving landslide PSI data analysis. Int. J. Remote Sens. 2014, 35, 2186–2214. [Google Scholar]
  40. Colesanti, C.; Wasowski, J. Investigating landslides with spaceborne Synthetic Aperture Radar (SAR) interferometry. Eng. Geol. 2006, 88, 173–199. [Google Scholar] [CrossRef]
  41. Plank, S.; Singer, J.; Minet, C.; Thuro, K. Pre-survey suitability evaluation of the differential synthetic aperture radar interferometry method for landslide monitoring. Int. J. Remote Sens. 2012, 33, 6623–6637. [Google Scholar] [CrossRef]
  42. Bianchini, S.; Herrera, G.; Mateos, R.; Notti, D.; Garcia, I.; Mora, O.; Moretti, S. Landslide activity maps generation by means of persistent scatterer interferometry. Remote Sens. 2013, 5, 6198–6222. [Google Scholar] [CrossRef] [Green Version]
  43. Herrera, G.; Gutierrez, F.; García-Davalillo, J.C.; Guerrero, J.; Notti, D.; Galve, J.P.; Fernández-Merodo, J.; Cooksley, G. Multi-sensor advanced DInSAR monitoring of very slow landslides: The Tena Valley case study (Central Spanish Pyrenees). Remote Sens. Environ. 2013, 128, 31–43. [Google Scholar] [CrossRef]
  44. Mora, O.; Mallorquí, J.J.; Broquetas, A. Linear and nonlinear terrain deformation maps from a reduced set of interferometric SAR images. IEEE Trans. Geosci. Remote Sens. 2003, 41, 2243–2253. [Google Scholar] [CrossRef]
  45. Iglesias, R.; Mallorqui, J.J.; Monells, D.; Lopez-Martinez, C.; Fabregas, X.; Aguasca, A.; Gili, J.A.; Corominas, J. PSI Deformation Map Retrieval by means of Temporal Sublook Coherence on Reduced Sets of SAR Images. Remote Sens. 2015, 7, 530–563. [Google Scholar] [CrossRef] [Green Version]
  46. Meisina, C.; Zucca, F.; Notti, D.; Colombo, A.; Cucchi, A.; Savio, G.; Giannico, C.; Bianchi, M. Geological interpretation of PSInSAR data at regional scale. Sensors 2008, 8, 7469–7492. [Google Scholar] [CrossRef] [Green Version]
  47. Moulton, L.K. Tolerable Movement Criteria for Highway Bridges; Report No. Fhwa/Rd-85/107; Federal Highway Administration: Washington, DC, USA, 1985.
  48. Keller, S.; Atzl, A. Mapping natural hazard impacts on road infrastructure—the extreme precipitation in Baden-Württemberg, Germany, June 2013. Int. J. Disaster Risk Sci. 2014, 5, 227–241. [Google Scholar] [CrossRef] [Green Version]
  49. Cardinali, M.; Reichenbach, P.; Guzzetti, F.; Ardizzone, F.; Antonini, G.; Galli, M.; Cacciano, M.; Castellani, M.; Salvati, P. A geomorphological approach to the estimation of landslide hazards and risks in Umbria, Central Italy. In Natural Hazards and Earth System Science; Copernicus Publications on behalf of the European Geosciences Union: Göttingen, Germany, 2002; Volume 2, pp. 57–72. [Google Scholar]
  50. D’Argenio, B.; Pescatore, T.; Scandone, P. Structural Pattern of the Campanian-Lucania Apennines. Structural model of Italy. Quad. Della Ric. Sci. 1975, 90, 313–327. (In Italian) [Google Scholar]
  51. Bonardi, G.; D’Argenio, B.; Perrone, V. Carta geologica dell’Appennino Meridionale. In Proceedings of the 74th Congresso della Società Geologica d’Italia, Sorrento, Italian, 13–17 September 1988. [Google Scholar]
  52. Vitale, S.; Ciarcia, S.; Mazzoli, S.; Zaghloul, M.N. Tectonic evolution of the ‘Liguride’ accretionary wedge in the Cilento area, southern Italy: A record of early Apennine geodynamics. J. Geodyn. 2011, 51, 25–36. [Google Scholar] [CrossRef] [Green Version]
Figure 1. Flow chart of the proposed methodology.
Applsci 09 05535 g001
Figure 2. “Slope instability kinematics-surveyed damage level” matrix for vulnerability assessment of linear infrastructures.
Applsci 09 05535 g002
Figure 3. Location of “P.R. 264” linear infrastructure in Campania Region (a), in the geological sketch map of the Cilento area (b) (modified from [52]) and its reference on the orthophoto map (c) and on a Digital Terrain Model (DTM) (d).
Applsci 09 05535 g003
Figure 4. Official landslide inventory (a) and state of activity (b) maps interacting with buffer zone along P.R. 264 (modified from Hydro-geomorphological Setting Plan of South Campania River Basin Authority, 2012).
Applsci 09 05535 g004
Figure 5. R-Index (a) and “C” factor (b) maps for ascending track.
Applsci 09 05535 g005
Figure 6. Example of buffer zone and fishnet grid (a) along a section of “P.R. 264” and displacement velocity maps along slope direction of targets identified by COSMO-SkyMed ascending images into buffer zone: In the period January 2012–January 2015 (b) and in 2014 (c).
Applsci 09 05535 g006
Figure 7. Detection of ground instability kinematics in January 2015: V-slope versus CV distribution of the interferometric population for identification of velocity threshold discriminating stable from unstable targets (a); map of pixels which can be monitored (b), map of stable/unstable pixels (c) and kinematics zoning map (d).
Applsci 09 05535 g007
Figure 8. Damage map (a) and examples (b) of failures occurred along “P.R. 264” surveyed in the period November 2014–January 2015.
Applsci 09 05535 g008
Figure 9. Vulnerability map of “P.R. 264” (a) and examples of some road sections that showed different vulnerability level (b).
Applsci 09 05535 g009
Figure 10. Updated HSP landslide inventory (a) and state of activity (b) maps along “P.R. 264” at January 2015.
Applsci 09 05535 g010
Table 1. Main parameters of used SAR dataset.
SatelliteCOSMO-SkyMed (ASI Agency)
Microwave bandX
Acquisition modeAscending
Incidence angle (°)29.34
Revisiting time (days)16
Temporal span25 January 2012–01 January 2015
Number of scenes52
Cell resolution in azimuth and range (m)3 × 3
Processing approachCPT-TSC
PS density (PS/km2)~600
Measurement precision:
-linear velocity±1.5 mm/yr
-single displacement±4.0 mm
-geolocation (x,y,z)±1.5 m
Correction factor |C|(0.0, +1.0)
V-SLOPE PS data velocity range (mm/year)(−14.5, +3.8)
Table 2. Results of matrix-based approach for vulnerability assessment of P.R. 264 linear infrastructure.
P.R. 264 Section TypologyFull-Benched/Cut and -Fill Road
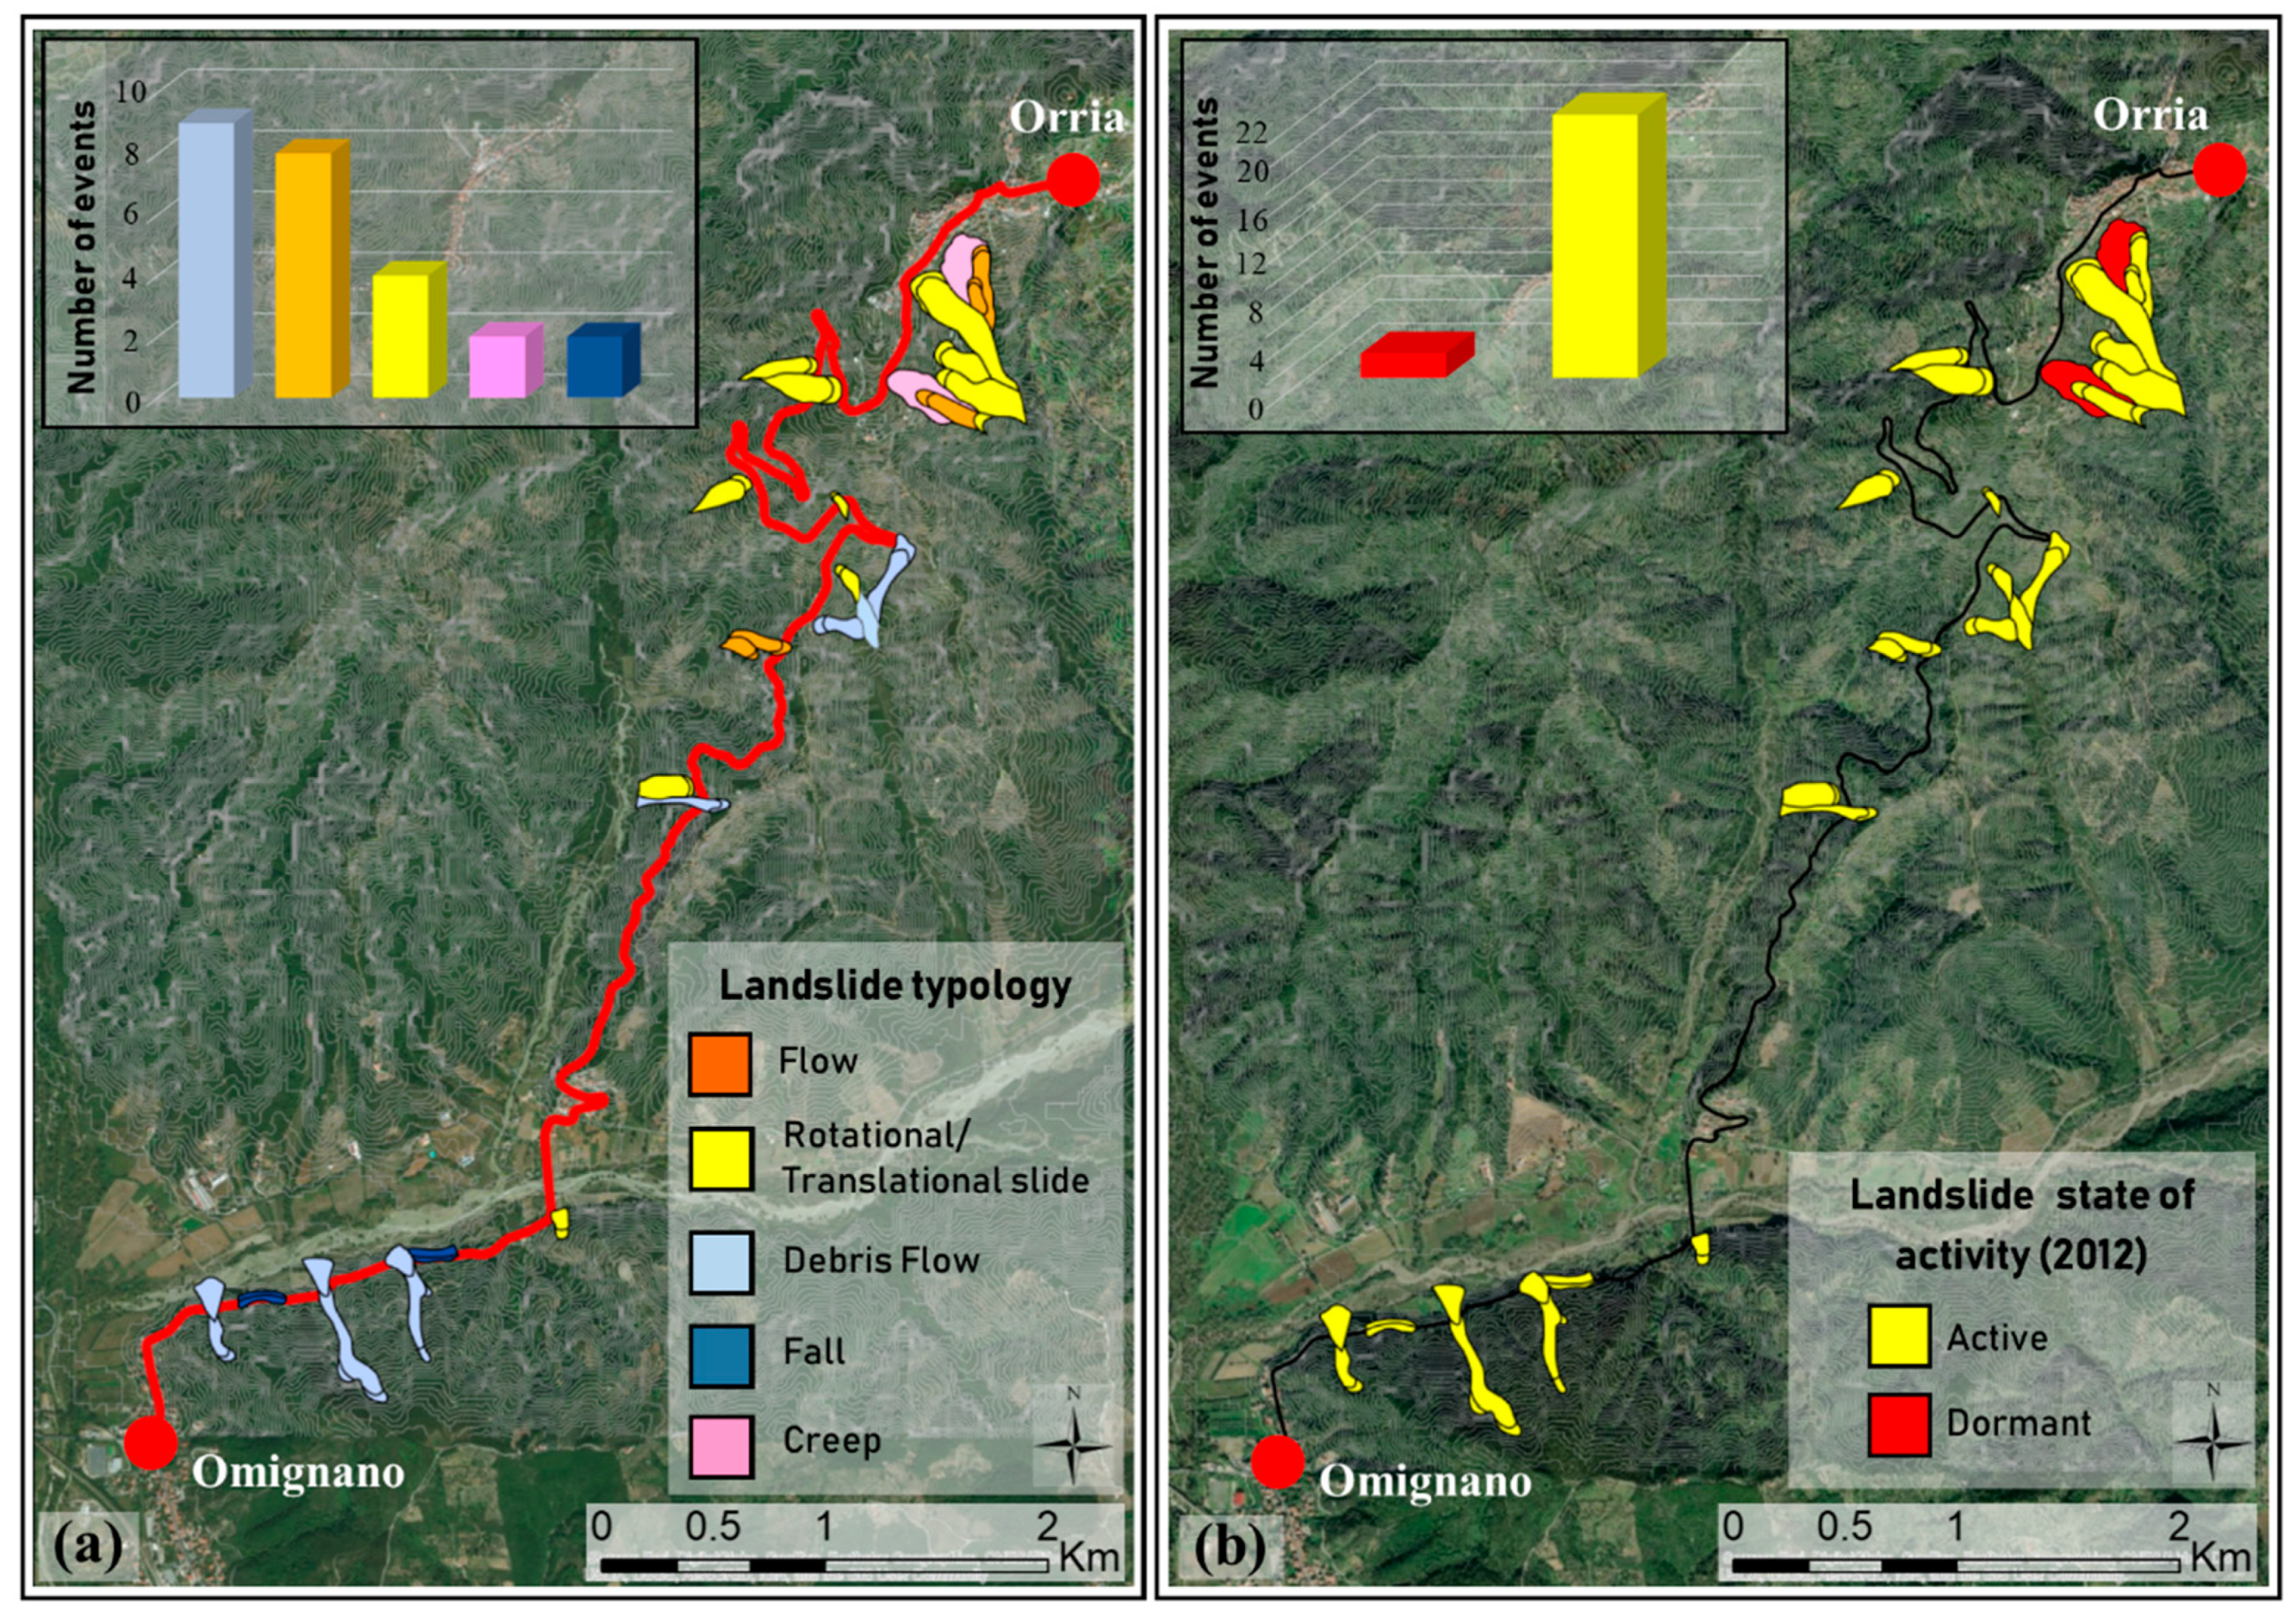
Official mapped landslides
HSP of South Campania River Basin Authority in 2012
24
Typology: 8 (debris flow) -8 (flow) - 4 (rotational-
translational slide) - 2 (fall) - 2 (creep)
State of activity: 22 (dormant) - 2 (active)
Damage survey
(November 2014–January 2015)
54 road sections (180 pixels of fishnet grid)
32 (negligible) - 16 (light) – 6 (moderate)
DInSAR analysisMonitored pixels690
Number of stable pixels
Number of unstable pixels
|Velocity threshold| = 2 mm/year
310
380
Terrain kinematics (number of pixels)250 (level I)
41 (level II)
380 (level III)
19 (level IV)
Vulnerability assessment 393 pixels (low degree)
222 pixels (moderate degree)
75 pixels (high degree)
Updated landslides inventory map (January 2015) 30 new landslides - state of activity: active
24 official mapped landslides:
-14 reactivations (dormant in 2012, active in 2015)
-10 continuous state of activity (8 dormant and 2 active both in 2012 and in 2015)

