Broadband Time Domain Diffuse Optical Reflectance Spectroscopy: A Review of Systems, Methods, and Applications

 ,
,  ,
,  , and
, and
Abstract
1. Introduction
- Physics of photon migration,
- Broadband TD-DOS Instrumentation,
- Analysis methods of TD-DOS,
- Applications,
- Future prospects.
2. Physics of Time Domain Diffuse Optical Spectroscopy (TD-DOS)
3. Instrumentation/Technology for Broadband TD-DOS
4. Analysis
4.1. Analytical Models
4.2. Numerical Models
4.3. Stochastic Models
4.4. Perturbative Approaches
4.5. Multivariate Approach
4.6. Final Considerations
5. Applications
5.1. Characterization of Absorbers/Tissue Constituents
5.2. In Vivo Characterization of Biological Tissues
5.3. Wood
5.4. Food
5.5. Pharmaceuticals
5.6. Standardization and Performances Assessment
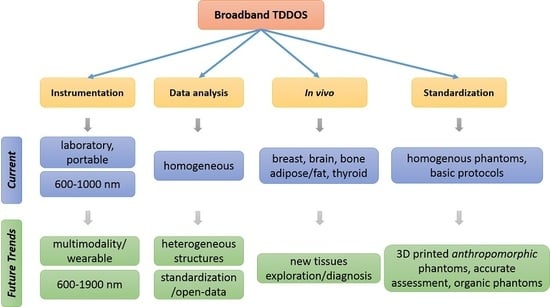
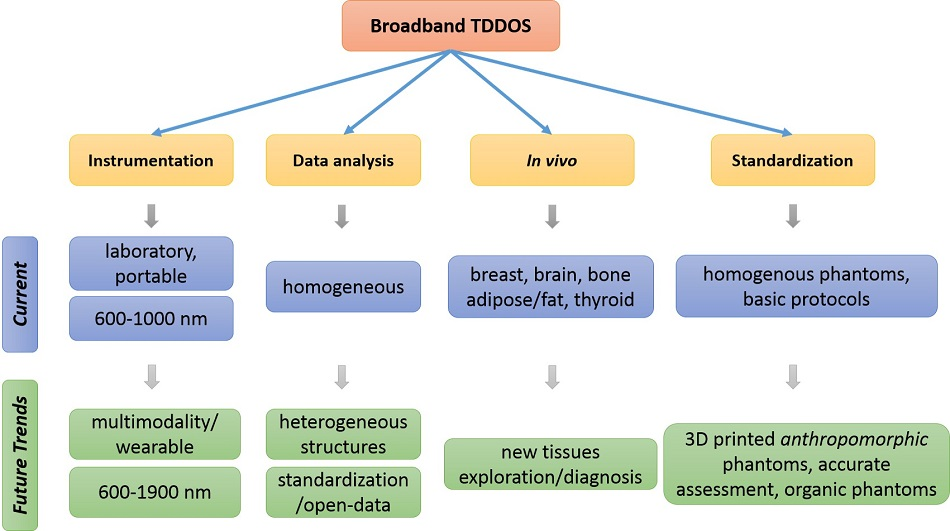
6. Future Outlook
7. Summary and Conclusions
Author Contributions
Funding
Acknowledgments
Conflicts of Interest
References
- Durduran, T.; Choe, R.; Baker, W.B.; Yodh, A.G. Diffuse optics for tissue monitoring and tomography. Rep. Prog. Phys. 2010, 73, 076701. [Google Scholar] [CrossRef] [PubMed]
- Nicolaï, B.M.; Defraeye, T.; de Ketelaere, B.; Herremans, E.; Hertog, M.L.A.T.M.; Saeys, W.; Torricelli, A.; Vandendriessche, T.; Verboven, P. Nondestructive Measurement of Fruit and Vegetable Quality. Annu. Rev. Food Sci. Technol. 2014, 5, 285–312. [Google Scholar] [CrossRef] [PubMed]
- Nicholson, P.H.F.; Lowest, G.; Langton, C.M.; Dequeker, J.; van der Perre, G. A comparison of time-domain and frequency-domain approaches to ultrasonic velocity measurement in trabecular bone. Phys. Med. Biol. 1996, 41, 2421. [Google Scholar] [CrossRef] [PubMed]
- Isler, H.; Schenk, D.; Bernhard, J.; Kleiser, S.; Scholkmann, F.; Ostojic, D.; Kalyanov, A.; Ahnen, L.; Wolf, M.; Karen, T. Absorption spectra of early stool from preterm infants need to be considered in abdominal NIRS oximetry. Biomed. Opt. Express 2019, 10, 2784–2794. [Google Scholar] [CrossRef] [PubMed]
- Wang, H.; Peng, J.; Xie, C.; Bao, Y.; He, Y. Fruit quality evaluation using spectroscopy technology: A review. Sensors (Switzerland) 2015, 15, 11889–11927. [Google Scholar] [CrossRef] [PubMed]
- Dinish, U.S.; Wong, C.L.; Sriram, S.; Ong, W.K.; Balasundaram, G.; Sugii, S.; Olivo, M. Diffuse Optical Spectroscopy and Imaging to Detect and Quantify Adipose Tissue Browning. Sci. Rep. 2017, 7, 41357. [Google Scholar] [CrossRef]
- Durduran, T.; Yodh, A.G. Diffuse correlation spectroscopy for non-invasive, micro-vascular cerebral blood flow measurement. Neuroimage 2014, 85 Pt 1, 51–63. [Google Scholar] [CrossRef]
- Gibson, A.P.; Hebden, J.C.; Arridge, S.R. Recent advances in diffuse optical imaging. Phys. Med. Biol. 2005, 50, R1. [Google Scholar] [CrossRef]
- Dehghani, H.; Nivasan, S.S.; Pogue, B.W.; Gibson, A. Numerical modelling and image reconstruction in diffuse optical tomography. Philos. Trans. R. Soc. A Math. Phys. Eng. Sci. 2009, 367, 3073–3093. [Google Scholar] [CrossRef]
- Zhao, H.; Cooper, R.J. Review of recent progress toward a fiberless, whole-scalp diffuse optical tomography system. Neurophotonics 2017, 5, 011012. [Google Scholar] [CrossRef]
- Zakharov, P.; Talary, M.S.; Caduff, A. A wearable diffuse reflectance sensor for continuous monitoring of cutaneous blood content. Phys. Med. Biol. 2009, 54, 5301–5320. [Google Scholar] [CrossRef] [PubMed]
- Torricelli, A.; Contini, D.; Pifferi, A.; Caffini, M.; Re, R.; Zucchelli, L.; Spinelli, L. Time domain functional NIRS imaging for human brain mapping. Neuroimage 2014, 85 Pt 1, 28–50. [Google Scholar] [CrossRef]
- Taroni, P.; Paganoni, A.M.; Ieva, F.; Pifferi, A.; Quarto, G.; Abbate, F.; Cassano, E.; Cubeddu, R. Non-invasive optical estimate of tissue composition to differentiate malignant from benign breast lesions: A pilot study. Sci. Rep. 2017, 7, 40683. [Google Scholar] [CrossRef] [PubMed]
- Lange, F.; Tachtsidis, I. Clinical brain monitoring with time domain NIRS: A review and future perspectives. Appl. Sci. 2019, 9, 1612. [Google Scholar] [CrossRef]
- Svensson, T.; Swartling, J.; Taroni, P.; Torricelli, A.; Lindblom, P.; Ingvar, C.; Andersson-Engels, S. Characterization of normal breast tissue heterogeneity using time-resolved near-infrared spectroscopy. Phys. Med. Biol. 2005, 50, 2559–2571. [Google Scholar] [CrossRef]
- Delpy, D.T.; Cope, M. Quantification in Tissue Near—Infrared Spectroscopy. Philos. Trans. R. Soc. Lond. Ser. B Biol. Sci. 1997, 352, 649–659. [Google Scholar] [CrossRef]
- Kienle, A.; Forster, F.K.; Hibst, R. Influence of the phase function on determination of the optical properties of biological tissue by spatially resolved reflectance. Opt. Lett. 2001, 26, 1571–1573. [Google Scholar] [CrossRef]
- Liu, H.; Boas, D.A.; Zhang, Y.; Yodh, A.G.; Chance, B. Determination of optical properties and blood oxygenation in tissue using continuous NIR light. Phys. Med. Biol. 1995, 40, 1983–1993. [Google Scholar] [CrossRef]
- Scholkmann, F.; Kleiser, S.; Metz, A.J.; Zimmermann, R.; Pavia, J.M.; Wolf, U.; Wolf, M. A review on continuous wave functional near-infrared spectroscopy and imaging instrumentation and methodology. Neuroimage 2014, 85 Pt 1, 6–27. [Google Scholar] [CrossRef]
- Durduran, T.; Choe, R.; Culver, J.P.; Zubkov, L.; Holboke, M.J.; Giammarco, J.; Chance, B.; Yodh, A.G. Bulk optical properties of healthy female breast tissue. Phys. Med. Biol. 2002, 47, 2847. [Google Scholar] [CrossRef]
- Pifferi, A.; Farina, A.; Torricelli, A.; Quarto, G.; Cubeddu, R.; Taroni, P. Review: Time-domain broadband near infrared spectroscopy of the female breast: A focused review from basic principles to future perspectives. J. Near Infrared Spectrosc. 2012, 20, 223–235. [Google Scholar] [CrossRef]
- Pifferi, A.; Torricelli, A.; Taroni, P.; Comelli, D.; Bassi, A.; Cubeddu, R. Fully automated time domain spectrometer for the absorption and scattering characterization of diffusive media. Rev. Sci. Instrum. 2007, 78, 053103. [Google Scholar] [CrossRef] [PubMed]
- Konugolu Venkata Sekar, S.; Mora, A.D.; Bargigia, I.; Martinenghi, E.; Lindner, C.; Farzam, P.; Pagliazzi, M.; Durduran, T.; Taroni, P.; Pifferi, A.; et al. Broadband (600–1350 nm) Time-Resolved Diffuse Optical Spectrometer for Clinical Use. IEEE J. Sel. Top. Quantum Electron. 2016, 22, 7100609. [Google Scholar] [CrossRef]
- Pogue, B.W.; Patterson, M.S. Frequency-domain optical absorption spectroscopy of finite tissue volumes using diffusion theory. Phys. Med. Biol. 1994, 39, 1157–1180. [Google Scholar] [CrossRef]
- Choe, R.; Putt, M.E.; Carlile, P.M.; Durduran, T.; Giammarco, J.M.; Busch, D.R.; Jung, K.W.; Czerniecki, B.J.; Tchou, J.; Feldman, M.D.; et al. Optically measured microvascular blood flow contrast of malignant breast tumors. PLoS ONE 2014, 9. [Google Scholar] [CrossRef]
- Pifferi, A.; Torricelli, A.; Taroni, P.; Bassi, A.; Chikoidze, E.; Giambattistelli, E.; Cubeddu, R. Optical biopsy of bone tissue: A step toward the diagnosis of bone pathologies. J. Biomed. Opt. 2004, 9, 474–481. [Google Scholar] [CrossRef]
- Taroni, P.; Pifferi, A.; Salvagnini, E.; Spinelli, L.; Torricelli, A.; Cubeddu, R. Seven-wavelength time-resolved optical mammography extending beyond 1000 nm for breast collagen quantification. Opt. Express 2009, 17, 15932–15946. [Google Scholar] [CrossRef]
- Tromberg, B.J.; Pogue, B.W.; Paulsen, K.D.; Yodh, A.G.; Boas, D.A.; Cerussi, A.E. Assessing the future of diffuse optical imaging technologies for breast cancer management. Med. Phys. 2008, 35, 2443–2451. [Google Scholar] [CrossRef]
- Konugolu Venkata Sekar, S.; Pagliazzi, M.; Negredo, E.; Martelli, F.; Farina, A.; Mora, A.D.; Lindner, C.; Farzam, P.; Pérez-Álvarez, N.; Puig, J.; et al. In Vivo, Non-Invasive Characterization of Human Bone by Hybrid Broadband (600–1200 nm) Diffuse Optical and Correlation Spectroscopies. PLoS ONE 2016, 11, e0168426. [Google Scholar] [CrossRef]
- Zouaoui, J.; di Sieno, L.; Hervé, L.; Pifferi, A.; Farina, A.; Mora, A.D.; Derouard, J.; Dinten, J.-M. Quantification in time-domain diffuse optical tomography using Mellin-Laplace transforms. Biomed. Opt. Express 2016, 7, 4346. [Google Scholar] [CrossRef]
- Bale, G.; Mitra, S.; Meek, J.; Robertson, N.; Tachtsidis, I. A new broadband near-infrared spectroscopy system for in-vivo measurements of cerebral cytochrome-c-oxidase changes in neonatal brain injury. Biomed. Opt. Express 2014, 5, 3450–3466. [Google Scholar] [CrossRef] [PubMed]
- Pham, T.H.; Coquoz, O.; Fishkin, J.B.; Anderson, E.; Tromberg, B.J. Broad bandwidth frequency domain instrument for quantitative tissue optical spectroscopy. Rev. Sci. Instrum. 2000, 71, 2500. [Google Scholar] [CrossRef]
- Svensson, T.; Alerstam, E.; Khoptyar, D.; Johansson, J.; Folestad, S.; Andersson-Engels, S. Near-infrared photon time-of-flight spectroscopy of turbid materials up to 1400 nm. Rev. Sci. Instrum. 2009, 80. [Google Scholar] [CrossRef] [PubMed]
- Yazdi, H.S.; O’Sullivan, T.D.; Leproux, A.; Hill, B.; Durkin, A.; Telep, S.; Lam, J.; Yazdi, S.S.; Police, A.M.; Carroll, R.M.; et al. Mapping breast cancer blood flow index, composition, and metabolism in a human subject using combined diffuse optical spectroscopic imaging and diffuse correlation spectroscopy. J. Biomed. Opt. 2017, 22, 045003. [Google Scholar] [CrossRef]
- Kovacsova, Z.; Bale, G.; Veesa, J.D.; Dehghani, H.; Tachtsidis, I. A broadband multi-distance approach to measure tissue oxygen saturation with continuous wave near-infrared spectroscopy. Proccedings of the Diffuse Optical Spectroscopy and Imaging VII, Munich, Germany, 11 July 2019; Volume 11074, p. 110740P. [Google Scholar]
- Cortese, L.; Aranda, G.; Buttafava, M.; Contini, D.; Mora, A.D.; de Fraguier, S.; Konugolu Venkata Sekar, S.; Dehghani, H. The LUCA project—Laser and Ultrasound Co-Analyzer for Thyroid Nodules: Overview and Current Status. In Biophotonics Congress: Biomedical Optics Congress 2018 (Microscopy/Translational/Brain/OTS); OSA Technical Digest; Paper OTh4D.5. (n.d.); Optical Society of America: Washington, DC, USA, 2018. [Google Scholar]
- Lange, F.; Dunne, L.; Hale, L.; Tachtsidis, I. MAESTROS: A Multiwavelength Time-Domain NIRS System to Monitor Changes in Oxygenation and Oxidation State of Cytochrome-C-Oxidase. IEEE J. Sel. Top. Quantum Electron. 2019, 25, 7100312. [Google Scholar] [CrossRef]
- Svensson, T.; Alerstam, E.; Einarsdóttír, M.; Svanberg, K.; Andersson-Engels, S. Towards accurate in vivo spectroscopy of the human prostate. J. Biophotonics 2008, 1, 200–203. [Google Scholar] [CrossRef]
- Svensson, T.; Andersson-Engels, S.; Einarsdóttír, M.; Svanberg, K. In vivo optical characterization of human prostate tissue using near-infrared time-resolved spectroscopy. J. Biomed. Opt. 2007, 12, 014022. [Google Scholar] [CrossRef]
- Konugolu Venkata Sekar, S. Broadband time-domain diffuse optics for clinical diagnostics, and diffuse Raman spectroscopy. Ph.D. Thesis, Politecnico Milano, Milan, Italy, 2017. [Google Scholar]
- Pifferi, A.; Contini, D.; Mora, A.D.; Farina, A.; Spinelli, L.; Torricelli, A. New frontiers in time-domain diffuse optics, a review. J. Biomed. Opt. 2016, 21, 091310. [Google Scholar] [CrossRef]
- Yamada, Y.; Suzuki, H.; Yamashita, Y. Time-domain near-infrared spectroscopy and imaging: A review. Appl. Sci. 2019, 9. [Google Scholar] [CrossRef]
- Mora, A.D.; Martinenghi, E.; Contini, D.; Tosi, A.; Boso, G.; Durduran, T.; Arridge, S.; Martelli, F.; Farina, A.; Torricelli, A.; et al. Fast silicon photomultiplier improves signal harvesting and reduces complexity in time-domain diffuse optics. Opt. Express 2015, 23, 13937–13946. [Google Scholar] [CrossRef] [PubMed]
- Contini, D.; Mora, A.D.; di Sieno, L.; Cubeddu, R.; Tosi, A.; Boso, G.; Pifferi, A. Memory effect in gated single-photon avalanche diodes: A limiting noise contribution similar to afterpulsing. In SPIE OPTO; International Society for Optics and Photonics: Bellingham, WA, USA, 2013; p. 86191L. [Google Scholar]
- Zhang, C.; Lindner, S.; Antolovic, I.M.; Wolf, M.; Charbon, E. A CMOS SPAD imager with collision detection and 128 dynamically reallocating TDCs for single-photon counting and 3D time-of-flight imaging. Sensors (Switzerland) 2018, 18, 4016. [Google Scholar] [CrossRef] [PubMed]
- Mora, A.D.; Tosi, A.; Contini, D.; di Sieno, L.; Boso, G.; Villa, F.; Pifferi, A. Memory effect in silicon time-gated single-photon avalanche diodes. J. Appl. Phys. 2015, 117, 114501. [Google Scholar]
- Powell, S.; Hochuli, R.; Arridge, S.R. Radiance Monte-Carlo for application of the radiative transport equation in the inverse problem of diffuse optical tomography. In Optical Tomography and Spectroscopy of Tissue XII; International Society for Optics and Photonics: Bellingham, WA, USA, 2017; Volume 10059, p. 100590W. [Google Scholar]
- Dehghani, H.; Eames, M.E.; Yalavarthy, P.K.; Davis, S.C.; Srinivasan, S.; Carpenter, C.M.; Pogue, B.W.; Paulsen, K.D. Near infrared optical tomography using NIRFAST: Algorithm for numerical model and image reconstruction. Commun. Numer. Methods Eng. 2009, 25, 711–732. [Google Scholar] [CrossRef]
- Pifferi, A.; Torricelli, A.; Bassi, A.; Taroni, P.; Cubeddu, R.; Wabnitz, H.; Grosenick, D.; Moller, M.; Macdonald, R.; Swartling, J.; et al. Performance assessment of photon migration instruments: The MEDPHOT protocol. Appl. Opt. 2005, 44, 2104–2114. [Google Scholar] [CrossRef]
- Wabnitz, H.; Jelzow, A.; Mazurenka, M.; Steinkellner, O.; Macdonald, R.; Milej, D.; Zolek, N.; Kacprzak, M.M.; Sawosz, P.; Maniewski, R.; et al. Performance assessment of time-domain optical brain imagers, part 2: nEUROPt protocol. J. Biomed. Opt. 2014, 19, 86012. [Google Scholar] [CrossRef]
- Wabnitz, H.; Taubert, D.R.; Mazurenka, M.; Steinkellner, O.; Jelzow, A.; Macdonald, R.; Milej, D.; Sawosz, P.; Kacprzak, M.; Liebert, A.; et al. Performance assessment of time-domain optical brain imagers, part 1: Basic instrumental performance protocol. J. Biomed. Opt. 2014, 19, 86010. [Google Scholar] [CrossRef]
- Konugolu Venkata Sekar, S.; Farina, A.; Martinenghi, E.; Mora, A.D.; Taroni, P.; Pifferi, A.; Negredo, E.; Puig, J.; Escrig, R.; Rosales, Q.; et al. Time-resolved diffused optical characterization of key tissue constituents of human bony prominence locations. Proc. SPIE 2015, 9538, 95380X. [Google Scholar]
- Konugolu Venkata Sekar, S.; Farina, A.; Mora, A.D.; Taroni, P.; Lindner, C.; Mora, M.; Pagliazzi, M.; Squarcia, M.; Halperin, I.; Hanzu, F.; et al. Broadband (600–1100 nm) Diffuse Optical Characterization of Thyroid Tissue Constituents and Application to in vivo Thyroid Studies. In Biophotonics Congress: Biomedical Optics Congress 2018 (Microscopy/Translational/Brain/OTS); OSA: Washington, DC, USA, 2018; p. CF2B.3. [Google Scholar]
- Sanchez, R.; McCormick, N.J. A Review of Neutron Transport Approximations. Nucl. Sci. Eng. 1982, 80, 481–535. [Google Scholar] [CrossRef]
- Contini, D.; Martelli, F.; Zaccanti, G. Photon migration through a turbid slab described by a model based on diffusion approximation. I. Theory. Appl. Opt. 1997, 36, 4587–4599. [Google Scholar] [CrossRef]
- Martelli, F.; Binzoni, T.; Pifferi, A.; Spinelli, L.; Farina, A.; Torricelli, A. There’s plenty of light at the bottom: Statistics of photon penetration depth in random media. Sci. Rep. 2016, 6, 27057. [Google Scholar] [CrossRef] [PubMed]
- Becker, W. Advanced Time-Correlated Single Photon Counting Techniques; Springer Series in Chemical Physics; Springer: New York, NY, USA, 2005. [Google Scholar]
- Andersson-Engels, S.; Berg, R.; Persson, A.; Svanberg, S. Multispectral tissue characterization with time-resolved detection of diffusely scattered white light. Opt. Lett. 1993, 18, 1697. [Google Scholar] [CrossRef] [PubMed]
- Klinteberg, C.A.; Berg, R.; Lindquist, C.; Andersson-Engels, S.; Svanberg, S. Diffusely scattered femtosecond white-light examination of breast tissue in vitro and in vivo. Proc. SPIE 1995, 2626. [Google Scholar] [CrossRef]
- Abrahamsson, C.; Svensson, T.; Svanberg, S.; Andersson-Engels, S.; Johansson, J.; Folestad, S. Time and wavelength resolved spectroscopy of turbid media using light continuum generated in a crystal fiber. Opt. Express 2004, 12, 4103–4112. [Google Scholar] [CrossRef]
- Taroni, P.; Pifferi, A.; Torricelli, A.; Comelli, D.; Cubeddu, R. In vivo absorption and scattering spectroscopy of biological tissues. Photochem. Photobiol. Sci. 2003, 2, 124–129. [Google Scholar] [CrossRef]
- Russell, P. Photonic Crystal Fibers. Science 2003, 299, 358–362. [Google Scholar] [CrossRef]
- Dudley, J.M.; Taylor, J.R. Ten years of nonlinear optics in photonic crystal fibre. Nat. Photonics 2009, 3, 85–90. [Google Scholar] [CrossRef]
- Khoptyar, D.; Subash, A.A.; Johansson, S.; Saleem, M.; Sparén, A.; Johansson, J.; Andersson-Engels, S. Broadband photon time-of-flight spectroscopy of pharmaceuticals and highly scattering plastics in the VIS and close NIR spectral ranges. Opt. Express 2013, 21, 20941–20953. [Google Scholar] [CrossRef]
- Grigoriev, E.; Akindinov, A.; Breitenmoser, M.; Buono, S.; Charbon, E.; Niclass, C.; Desforges, I.; Rocca, R. Silicon photomultipliers and their bio-medical applications. Nucl. Instrum. Methods Phys. Res. Sect. A Accel. Spectrometers Detect. Assoc. Equip. 2007, 571, 130–133. [Google Scholar] [CrossRef]
- Farina, A.; Tagliabue, S.; di Sieno, L.; Martinenghi, E.; Durduran, T.; Arridge, S.; Martelli, F.; Torricelli, A.; Pifferi, A.; Mora, A.D. Time-domain functional diffuse optical tomography system based on fiber-free silicon photomultipliers. Appl. Sci. 2017, 7, 1235. [Google Scholar]
- Konugolu Venkata Sekar, S.; Farina, A.; Martinenghi, E.; Mora, A.D.; Taroni, P.; Pifferi, A.; Durduran, T.; Pagliazzi, M.; Lindner, C.; Farzam, P.; et al. Broadband time-resolved diffuse optical spectrometer for clinical diagnostics: Characterization and in-vivo measurements in the 600–1350 nm spectral range. In European Conference on Biomedical Optics; Optical Society of America: Washington, DC, USA, 2015; p. 95380R. [Google Scholar]
- Konugolu Venkata Sekar, S.; Farina, A.; Mora, A.D.; Taroni, P.; Lindner, C.; Mora, M.; FarzamI, P.; Pagliazzi, M.; Squarcia, M.; Halperin, I.; et al. Thyroid tissue constituents characterization and application to in vivo studies by broadband (600–1200 nm) diffuse optical spectroscopy. In European Conference on Biomedical Optics; Optical Society of America: Washington, DC, USA, 2017; p. 1041107. [Google Scholar]
- Bassi, A.; Swartling, J.; D’Andrea, C.; Pifferi, A.; Torricelli, A.; Cubeddu, R. Time-resolved spectrophotometer for turbid media based on supercontinuum generation in a photonic crystal fiber. Opt. Lett. 2004, 29, 2405–2407. [Google Scholar] [CrossRef] [PubMed]
- Gerega, A.; Milej, D.; Weigl, W.; Kacprzak, M.; Liebert, A. Multiwavelength time-resolved near-infrared spectroscopy of the adult head: Assessment of intracerebral and extracerebral absorption changes. Biomed. Opt. Express 2018, 9, 2974. [Google Scholar] [CrossRef] [PubMed]
- Terborg, C.; Bramer, S.; Harscher, S.; Simon, M.; Witte, O.W. Bedside assessment of cerebral perfusion reductions in patients with acute ischaemic stroke by near-infrared spectroscopy and indocyanine green. J. Neurol. Neurosurg. Psychiatry 2004, 75, 38–42. [Google Scholar] [PubMed]
- Milej, D.; Abdalmalak, A.; Desjardins, L.; Ahmed, H.; Lee, T.Y.; Diop, M.; Lawrence, K.S. Quantification of blood-brain barrier permeability by dynamic contrast-enhanced NIRS. Sci. Rep. 2017, 7, 1702. [Google Scholar] [CrossRef] [PubMed]
- Liebert, A.; Wabnitz, H.; Steinbrink, J.; Möller, M.; Macdonald, R.; Rinneberg, H.; Villringer, A.; Obrig, H. Bed-side assessment of cerebral perfusion in stroke patients based on optical monitoring of a dye bolus by time-resolved diffuse reflectance. Neuroimage 2005, 24, 426–435. [Google Scholar] [CrossRef] [PubMed]
- Weigl, W.; Milej, D.; Gerega, A.; Toczylowska, B.; Kacprzak, M.; Sawosz, P.; Botwicz, M.; Maniewski, R.; Mayzner-Zawadzka, E.; Liebert, A. Assessment of cerebral perfusion in post-traumatic brain injury patients with the use of ICG-bolus tracking method. Neuroimage 2014, 85, 555–565. [Google Scholar] [CrossRef] [PubMed]
- Weigl, W.; Milej, D.; Gerega, A.; Toczyłowska, B.; Sawosz, P.; Kacprzak, M.; Janusek, D.; Wojtkiewicz, S.; Maniewski, R.; Liebert, A. Confirmation of brain death using optical methods based on tracking of an optical contrast agent: Assessment of diagnostic feasibility. Sci. Rep. 2018, 8, 7332. [Google Scholar] [CrossRef]
- Hawrysz, D.J.; Sevick-Muraca, E.M. Developments toward diagnostic breast cancer imaging using neer-infrared optical measurements and fluorescent contrast agents. Neoplasia 2000, 2, 388–417. [Google Scholar] [CrossRef]
- Ishizawa, T.; Fukushima, N.; Shibahara, J.; Masuda, K.; Tamura, S.; Aoki, T.; Hasegawa, K.; Beck, Y.; Fukayama, M.; Kokudo, N. Real-time identification of liver cancers by using indocyanine green fluorescent imaging. Cancer 2009, 115, 2491–2504. [Google Scholar]
- Contini, D.; Martelli, F.; Zaccanti, G. Photon migration through a turbid slab described by a model based on diffusion approximation. I. Comparison with Monte Carlo Results. Appl. Opt. 1997, 36, 4600–4612. [Google Scholar] [CrossRef] [PubMed]
- Liemert, A.; Martelli, F.; Binzoni, T.; Kienle, A. P3 solution for the total steady-state and time-resolved reflectance and transmittance from a turbid slab. Appl. Opt. 2019, 58, 4143. [Google Scholar] [CrossRef] [PubMed]
- Liemert, A.; Reitzle, D.; Kienle, A. Analytical solutions of the radiative transport equation for turbid and fluorescent layered media. Sci. Rep. 2017, 7, 3819. [Google Scholar] [CrossRef] [PubMed]
- Liemert, A.; Kienle, A. Light diffusion in a turbid cylinder. II. Layered case. Opt. Express 2010, 18, 9266–9279. [Google Scholar] [CrossRef] [PubMed]
- Kienle, A. Light diffusion through a turbid parallelepiped. J. Opt. Soc. Am. A 2005, 22, 1883–1888. [Google Scholar] [CrossRef]
- Simpson, C.R.; Kohl, M.; Essenpreis, M.; Cope, M. Near-infrared optical properties of ex vivo human skin and subcutaneous tissues measured using the Monte Carlo inversion technique. Phys. Med. Biol. 1998, 43, 2465–2478. [Google Scholar] [CrossRef]
- Sassaroli, A.; Martelli, F.; Zaccanti, G.; Yamada, Y. Performance of Fitting Procedures in Curved Geometry for Retrieval of the Optical Properties of Tissue from Time-Resolved Measurements. Appl. Opt. 2001, 40, 185–197. [Google Scholar] [CrossRef]
- Kamran, F.; Abildgaard, O.H.A.; Subash, A.A.; Andersen, P.E.; Andersson-Engels, S.; Khoptyar, D. Computationally effective solution of the inverse problem in time-of-flight spectroscopy. Opt. Express 2015, 23, 6937–6945. [Google Scholar] [CrossRef]
- Martelli, F.; Bassani, M.; Alianelli, L.; Zangheri, L.; Zaccanti, G. Accuracy of the diffusion equation to describe photon migration through an infinite medium: Numerical and experimental investigation. Phys. Med. Biol. 2000, 45, 1359–1373. [Google Scholar] [CrossRef]
- Schweiger, M.; Arridge, S.R. The finite-element method for the propagation of light in scattering media: Frequency domain case. Med. Phys. 1997, 24, 895–902. [Google Scholar] [CrossRef]
- Schweiger, M.; Arridge, S. The Toast ++ software suite for forward and inverse modeling in optical tomography. J. Biomed. Opt. 2014, 19, 040801. [Google Scholar] [CrossRef] [PubMed]
- Wojtkiewicz, S.; Durduran, T.; Dehghani, H. Time-resolved near infrared light propagation using frequency domain superposition. Biomed. Opt. Express 2018, 9, 41–54. [Google Scholar] [CrossRef] [PubMed]
- Wang, L.; Jacques, S.L.; Zheng, L. MCML--Monte Carlo modeling of light transport in multi-layered tissues. Comput. Methods Programs Biomed. 1995, 47, 131–146. [Google Scholar]
- Sassaroli, A.; Martelli, F. Equivalence of four Monte Carlo methods for photon migration in turbid media. J. Opt. Soc. Am. A. Opt. Image Sci. Vis. 2012, 29, 2110–2117. [Google Scholar] [CrossRef] [PubMed]
- Alerstam, E.; Svensson, T.; Andersson-Engels, S. Parallel computing with graphics processing units for high-speed Monte Carlo simulation of photon migration. J. Biomed. Opt. 2008, 13, 060504. [Google Scholar] [PubMed]
- Fang, Q.; Kaeli, D.R. Accelerating mesh-based Monte Carlo method on modern CPU architectures. Biomed. Opt. Express 2012, 3, 3223–3230. [Google Scholar] [CrossRef]
- Yao, R.; Intes, X.; Fang, Q. Generalized mesh-based Monte Carlo for wide-field illumination and detection via mesh retessellation. Biomed. Opt. Express 2015, 7, 171. [Google Scholar] [CrossRef]
- Fang, Q. Mesh-based Monte Carlo method using fast ray-tracing in Plücker coordinates. Biomed. Opt. Express 2010, 1, 165–175. [Google Scholar]
- Alerstam, E.; Andersson-Engels, S.; Svensson, T. White Monte Carlo for time-resolved photon migration. J. Biomed. Opt. 2008, 13, 041304. [Google Scholar]
- Alerstam, E.; Andersson-Engels, S.; Svensson, T. Improved accuracy in time-resolved diffuse reflectance spectroscopy. Opt. Express 2008, 16, 10434–10448. [Google Scholar] [CrossRef]
- Selb, J.; Ogden, T.M.; Dubb, J.; Fang, Q.; Boas, D.A. Systematic evaluation of a time-domain Monte Carlo fitting routine to estimate the adult brain optical properties. In Optical Tomography and Spectroscopy of Tissue X; International Society for Optics and Photonics: Bellingham, WA, USA, 2013; Volume 8578, p. 857817. [Google Scholar]
- Arridge, S.R. Photon-measurement density functions. Part I: Analytical forms. Appl. Opt. 1995, 34, 7395–7409. [Google Scholar] [CrossRef] [PubMed]
- Arridge, S.R.; Schweiger, M. Photon-measurement density functions. Part 2: Finite-element-method calculations. Appl. Opt. 1995, 34, 8026–8037. [Google Scholar] [CrossRef] [PubMed]
- Martelli, F.; del Bianco, S.; Ismaelli, A.; Zaccanti, G. Light Propagation through Biological Tissue and Other Diffusive Media; SPIE Press: Bellingham, WA, USA, 2010. [Google Scholar]
- Martelli, F.; del Bianco, S.; di Ninni, P. Perturbative forward solver software for small localized fluorophores in tissue. Biomed. Opt. Express 2012, 3, 26. [Google Scholar] [CrossRef] [PubMed][Green Version]
- Torricelli, A.; Spinelli, L.; Pifferi, A.; Taroni, P.; Cubeddu, R.; Danesini, G. Use of a nonlinear perturbation approach for in vivo breast lesion characterization by multiwavelength time-resolved optical mammography. Opt. Express 2003, 11, 853–867. [Google Scholar] [CrossRef] [PubMed]
- Martelli, F.; Pifferi, A.; Contini, D.; Spinelli, L.; Torricelli, A.; Wabnitz, H.; Macdonald, R.; Sassaroli, A.; Zaccanti, G. Phantoms for diffuse optical imaging based on totally absorbing objects, part 1: Basic concepts. J. Biomed. Opt. 2013, 18, 66014. [Google Scholar] [CrossRef] [PubMed]
- Sassaroli, A.; Pifferi, A.; Contini, D.; Torricelli, A.; Spinelli, L.; Wabnitz, H.; di Ninni, P.; Zaccanti, G.; Martelli, F. Forward solvers for photon migration in the presence of highly and totally absorbing objects embedded inside diffusive media. J. Opt. Soc. Am. A 2014, 31, 460. [Google Scholar] [CrossRef]
- Sassaroli, A.; Blumetti, C.; Martelli, F.; Alianelli, L.; Contini, D.; Ismaelli, A.; Zaccanti, G. Monte carlo procedure for investigating light propagation and imaging of highly scattering media. Appl. Opt. 1998, 37, 7392–7400. [Google Scholar] [CrossRef]
- Sassaroli, A. Fast perturbation Monte Carlo method for photon migration in heterogeneous turbid media. Opt. Lett. 2011, 36, 2095–2097. [Google Scholar] [CrossRef]
- Nguyen, J.; Hayakawa, C.K.; Mourant, J.R.; Spanier, J. Perturbation Monte Carlo methods for tissue structure alterations. Biomed. Opt. Express 2013, 4, 1946–1963. [Google Scholar] [CrossRef]
- Chauchard, F.; Roger, J.M.; Bellon-Maurel, V.; Abrahamsson, C.; Andersson-Engels, S.; Svanberg, S. MADSTRESS: A linear approach for evaluating scattering and absorption coefficients of samples measured using time-resolved spectroscopy in reflection. Appl. Spectrosc. 2005, 59, 1229–1235. [Google Scholar] [CrossRef]
- Chauchard, F.; Roussel, S.; Roger, J.M.; Bellon-Maurel, V.; Abrahamsson, C.; Svensson, T.; Andersson-Engels, S.; Svanberg, S. Least-squares support vector machines modelization for time-resolved spectroscopy. Appl. Opt. 2005, 44, 7091–7097. [Google Scholar] [CrossRef] [PubMed]
- Mourant, J.R.; Fuselier, T.; Boyer, J.; Johnson, T.M.T.M.; Bigio, I.J.I.J. Predictions and measurements of scattering and absorption over broad wavelength ranges in tissue phantoms. Appl. Opt. 1997, 36, 949. [Google Scholar] [CrossRef] [PubMed]
- Nilsson, A.M.; Sturesson, C.; Liu, D.L.; Andersson-Engels, S. Changes in spectral shape of tissue optical properties in conjunction with laser-induced thermotherapy. Appl. Opt. 1998, 37, 1256–1267. [Google Scholar] [CrossRef] [PubMed]
- D’Andrea, C.; Spinelli, L.; Bassi, A.; Giusto, A.; Contini, D.; Swartling, J.; Torricelli, A.; Cubeddu, R. Time-resolved spectrally constrained method for the quantification of chromophore concentrations and scattering parameters in diffusing media. Opt. Express 2006, 14, 1888–1898. [Google Scholar] [CrossRef]
- Farina, A.; Bassi, A.; Pifferi, A.; Taroni, P.; Comelli, D.; Spinelli, L.; Cubeddu, R. Bandpass effects in time-resolved diffuse spectroscopy. Appl. Spectrosc. 2009, 63, 48–56. [Google Scholar] [CrossRef]
- Guggenheim, J.A.; Bargigia, I.; Farina, A.; Pifferi, A.; Dehghani, H. Time resolved diffuse optical spectroscopy with geometrically accurate models for bulk parameter recovery. Biomed. Opt. Express 2016, 7, 3784. [Google Scholar] [CrossRef]
- Bouchard, J.; Veilleux, I.; Jedidi, R.; Noiseux, I.; Fortin, M.; Mermut, O. Reference optical phantoms for diffuse optical spectroscopy. Part 1—Error analysis of a time resolved transmittance characterization method. Opt. Express 2010, 18, 1143–1155. [Google Scholar] [CrossRef]
- Martelli, F.; del Bianco, S.; Zaccanti, G. Retrieval procedure for time-resolved near-infrared tissue spectroscopy based on the optimal estimation method. Phys. Med. Biol. 2012, 57, 2915–2929. [Google Scholar] [CrossRef]
- Martelli, F.; del Bianco, S.; Spinelli, L.; Cavalieri, S.; di Ninni, P.; Binzoni, T.; Jelzow, A.; Macdonald, R.; Wabnitz, H. Optimal estimation reconstruction of the optical properties of a two-layered tissue phantom from time-resolved single-distance measurements. J. Biomed. Opt. 2015, 20, 115001. [Google Scholar] [CrossRef]
- Konugolu Venkata Sekar, S.; Farina, A.; Mora, A.D.; Lindner, C.; Pagliazzi, M.; Mora, M.; Aranda, G.; Dehghani, H.; Durduran, T.; Taroni, P.; et al. Broadband (550–1350 nm) diffuse optical characterization of thyroid chromophores. Sci. Rep. 2018, 8, 10015. [Google Scholar] [CrossRef] [PubMed]
- Nachabé, R.; Evers, D.J.; Hendriks, B.H.W.; Lucassen, G.W.; van der Voort, M.; Rutgers, E.J.; Peeters, M.-J.V.; van der Hage, J.a.; Oldenburg, H.S.; Wesseling, J.; et al. Diagnosis of breast cancer using diffuse optical spectroscopy from 500 to 1600 nm: Comparison of classification methods. J. Biomed. Opt. 2011, 16, 087010. [Google Scholar] [CrossRef] [PubMed]
- Konugolu Venkata Sekar, S.; Bargigia, I.; Mora, A.D.; Taroni, P.; Ruggeri, A.; Tosi, A.; Pifferi, A.; Farina, A. Diffuse optical characterization of collagen absorption from 500 to 1700 nm. J. Biomed. Opt. 2017, 22, 15006. [Google Scholar] [CrossRef] [PubMed]
- Provenzano, P.P.; Inman, D.R.; Eliceiri, K.W.; Knittel, J.G.; Yan, L.; Rueden, C.T.; White, J.G.; Keely, P.J. Collagen density promotes mammary tumor initiation and progression. BMC Med. 2008, 6, 11. [Google Scholar] [CrossRef] [PubMed]
- Taroni, P.; Quarto, G.; Pifferi, A.; Ieva, F.; Paganoni, A.M.; Abbate, F.; Balestreri, N.; Menna, S.; Cassano, E.; Cubeddu, R. Optical identification of subjects at high risk for developing breast cancer. J. Biomed. Opt. 2013, 18, 060507. [Google Scholar] [CrossRef][Green Version]
- Taroni, P.; Comelli, D.; Pifferi, A.; Torricelli, A.; Cubeddu, R. Absorption of collagen: Effects on the estimate of breast composition and related diagnostic implications. J. Biomed. Opt. 2007, 12, 014021. [Google Scholar] [CrossRef]
- Taroni, P.; Bassi, A.; Comelli, D.; Farina, A.; Cubeddu, R.; Pifferi, A. Diffuse optical spectroscopy of breast tissue extended to 1100 nm. J. Biomed. Opt. 2009, 14, 054030. [Google Scholar] [CrossRef]
- Puschmann, S.; Rahn, C.-D.; Wenck, H.; Gallinat, S.; Fischer, F. Approach to quantify human dermal skin aging using multiphoton laser scanning microscopy. J. Biomed. Opt. 2012, 17, 036005. [Google Scholar] [CrossRef]
- Sinkus, R.; Lorenzen, J.; Schrader, D.; Lorenzen, M.; Dargatz, M.; Holz, D. High-resolution tensor MR elastography for breast tumour detection. Phys. Med. Biol. 2000, 45, 1649–1664. [Google Scholar] [CrossRef]
- Plewes, D.B.; Bishop, J.; Samani, A.; Sciarretta, J. Visualization and quantification of breast cancer biomechanical properties with magnetic resonance elastography. Phys. Med. Biol. 2000, 45, 1591–1610. [Google Scholar] [CrossRef]
- Konugolu Venkata Sekar, S.; Beh, J.S.; Farina, A.; Mora, A.D.; Pifferi, A.; Taroni, P. Broadband diffuse optical characterization of elastin for biomedical applications. Biophys. Chem. 2017, 229, 130–134. [Google Scholar] [CrossRef]
- Bremer, A.A.; Jialal, I. Adipose tissue dysfunction in nascent metabolic syndrome. J. Obes. 2013, 2013. [Google Scholar] [CrossRef] [PubMed]
- Bremer, A.A.; Devaraj, S.; Afify, A.; Jialal, I. Adipose Tissue Dysregulation in Patients with Metabolic Syndrome. J. Clin. Endocrinol. Metab. 2011, 96, E1782–E1788. [Google Scholar] [CrossRef] [PubMed]
- Bargigia, I.; Tosi, A.; Shehata, A.B.; della Frera, A.; Farina, A.; Bassi, A.; Taroni, P.; Mora, A.D.; Zappa, F.; Cubeddu, R.; et al. Time-resolved diffuse optical spectroscopy up to 1700 nm by means of a time-gated InGaAs/InP single-photon avalanche diode. Appl. Spectrosc. 2012, 66, 944–950. [Google Scholar] [CrossRef] [PubMed]
- Lindner, C.; Mora, M.; Farzam, P.; Squarcia, M.; Johansson, J.; Weigel, U.M.; Halperin, I.; Hanzu, F.A.; Durduran, T. Diffuse optical characterization of the healthy human thyroid tissue and two pathological case studies. PLoS ONE 2016, 11, e0147851. [Google Scholar] [CrossRef] [PubMed]
- Taroni, P.; Pifferi, A.; Quarto, G.; Spinelli, L.; Torricelli, A.; Abbate, F.; Villa, A.; Balestreri, N.; Menna, S.; Cassano, E.; et al. Noninvasive assessment of breast cancer risk using time-resolved diffuse optical spectroscopy. J. Biomed. Opt. 2010, 15, 060501. [Google Scholar] [CrossRef] [PubMed]
- Farina, A.; Torricelli, A.; Bargigia, I.; Spinelli, L.; Cubeddu, R.; Foschum, F.; Jäger, M.; Simon, E.; Fugger, O.; Kienle, A.; et al. In-vivo multilaboratory investigation of theoptical properties of thehuman head. Biomed. Opt. 2014, 6, 2609–2623. [Google Scholar]
- Liemert, A.; Kienle, A. Exact and efficient solution of the radiative transport equation for the semi-infinite medium. Sci. Rep. 2013, 3, 2018. [Google Scholar] [CrossRef]
- Geiger, S.; Reitzle, D.; Liemert, A.; Kienle, A. Determination of the optical properties of three-layered turbid media in the time domain using the P 3 approximation. OSA Contin. 2019, 2, 1889. [Google Scholar] [CrossRef]
- Konugolu Venkata Sekar, S.; Mora, A.D.; Martinenghi, E.; Taroni, P.; Farina, A.; Puig, J.; Negredo, E.; Lindner, C.; Pagliazzi, M. In vivo Time domain Broadband (600–1200 nm) Diffuse Optical Characterization of Human Bone. In Optical Tomography and Spectroscopy; Optical Society of America: Washington, DC, USA, 2016; p. JTu3A.32. [Google Scholar]
- Tee, Y.Y.; Lowe, A.J.; Brand, C.A.; Judson, R.T. Fine-Needle Aspiration May Miss a Third of All Malignancy in Palpable Thyroid Nodules. Ann. Surg. 2007, 246, 714–720. [Google Scholar] [CrossRef]
- Giordano, A.; Frontini, A.; Cinti, S. Convertible visceral fat as a therapeutic target to curb obesity. Nat. Rev. Drug Discov. 2016, 15, 405–424. [Google Scholar] [CrossRef]
- Ganesan, G.; Warren, R.V.; Leproux, A.; Compton, M.; Cutler, K.; Wittkopp, S.; Tran, G.; O’Sullivan, T.; Malik, S.; Galassetti, P.R.; et al. Diffuse optical spectroscopic imaging of subcutaneous adipose tissue metabolic changes during weight loss. Int. J. Obes. 2016, 40, 1292–1300. [Google Scholar] [CrossRef] [PubMed]
- Torricelli, A.; Pifferi, A.; Taroni, P.; Giambattistelli, E.; Cubeddu, R. In vivo optical characterization of human tissues from 610 to 1010 nm by time-resolved reflectance spectroscopy. Phys. Med. Biol. 2001, 46, 2227–2237. [Google Scholar] [CrossRef] [PubMed]
- Pifferi, A.; Konugolu Venkata Sekar, S.; Farina, A.; Guadagno, C.; Spinelli, L.; Lanka, P.; Cubeddu, R.; Nisoli, E.; Taroni, P. In vivo Study of the Layered Structure on the Abdomen by Broadband Time-Domain Diffuse Optical Spectroscopy. In Optical Tomography and Spectroscopy; Optical Society of America: Washington, DC, USA, 2018. [Google Scholar]
- Kelley, S.S.; Rials, T.G.; Snell, R.; Groom, L.H.; Sluiter, A. Use of near infrared spectroscopy to measure the chemical and mechanical properties of solid wood. Wood Sci. Technol. 2004, 38, 257–276. [Google Scholar] [CrossRef]
- Tsuchikawa, S. A review of recent near infrared research for wood and paper. Appl. Spectrosc. Rev. 2007. [Google Scholar] [CrossRef]
- Hodge, G.R.; Woodbridge, W.C. Global near infrared models to predict lignin and cellulose content of pine wood. J. Near Infrared Spectrosc. 2010, 18, 367–380. [Google Scholar] [CrossRef]
- Tsuchikawa, S.; Schwanninger, M. A review of recent near-infrared research for wood and paper (Part 2). Appl. Spectrosc. Rev. 2013, 48, 560–587. [Google Scholar] [CrossRef]
- Sandak, A.; Sandak, J.; Zborowska, M.; Pradzyński, W. Near infrared spectroscopy as a tool for archaeological wood characterization. J. Archaeol. Sci. 2010, 37, 2093–2101. [Google Scholar] [CrossRef]
- D’Andrea, C.; Farina, A.; Comelli, D.; Pifferi, A.; Taroni, P.; Valentini, G.; Cubedduo, R.; Zoia, L.; Orlandi, M.; Kienle, A. Time-resolved optical spectroscopy of wood. Appl. Spectrosc. 2008, 62, 569–574. [Google Scholar] [CrossRef]
- D’Andrea, C.; Nevin, A.; Farina, A.; Bassi, A.; Cubeddu, R. Assessment of variations in moisture content of wood using time-resolved diffuse optical spectroscopy. Appl. Opt. 2009, 48, B87–B93. [Google Scholar] [CrossRef]
- Farina, A.; Bargigia, I.; Janeček, E.-R.; Walsh, Z.; D’Andrea, C.; Nevin, A.; Ramage, M.; Scherman, O.A.; Pifferi, A. Nondestructive optical detection of monomer uptake in wood polymer composites. Opt. Lett. 2014, 39, 228–231. [Google Scholar] [CrossRef]
- Janeček, E.R.; Walsh-Korb, Z.; Bargigia, I.; Farina, A.; Ramage, M.H.; D’Andrea, C.; Nevin, A.; Pifferi, A.; Scherman, O.A. Time-resolved laser spectroscopy for the in situ characterization of methacrylate monomer flow within spruce. Wood Sci. Technol. 2017, 51, 227–242. [Google Scholar] [CrossRef]
- Zude, M.; Herold, B.; Roger, J.M.; Bellon-Maurel, V.; Landahl, S. Non-destructive tests on the prediction of apple fruit flesh firmness and soluble solids content on tree and in shelf life. J. Food Eng. 2006, 77, 254–260. [Google Scholar] [CrossRef]
- Qing, Z.; Ji, B.; Zude, M. Predicting soluble solid content and firmness in apple fruit by means of laser light backscattering image analysis. J. Food Eng. 2007, 82, 58–67. [Google Scholar] [CrossRef]
- Cubeddu, R.; D’Andrea, C.; Pifferi, A.; Taroni, P.; Torricelli, A.; Valentini, G.; Dover, C.; Johnson, D.; Ruiz-Altisent, M.; Valero, C. Nondestructive quantification of chemical and physical properties of fruits by time-resolved reflectance spectroscopy in the wavelength range 650–1000 nm. Appl. Opt. 2001, 40, 538–543. [Google Scholar] [CrossRef] [PubMed]
- Nicolaï, B.M.; Verlinden, B.E.; Desmet, M.; Saevels, S.; Saeys, W.; Theron, K.; Cubeddu, R.; Pifferi, A.; Torricelli, A. Time-resolved and continuous wave NIR reflectance spectroscopy to predict soluble solids content and firmness of pear. Postharvest Biol. Technol. 2008, 47, 68–74. [Google Scholar] [CrossRef]
- Cubeddu, R.; D’Andrea, C.; Pifferi, A.; Taroni, P.; Torricelli, A.; Valentini, G.; Ruiz-Altisent, M.; Valero, C.; Ortiz, C.; Dover, C.; et al. Time-resolved reflectance spectroscopy applied to the nondestructive monitoring of the internal optical properties in apples. Appl. Spectrosc. 2001, 55, 1368–1374. [Google Scholar] [CrossRef]
- Nielsen, O.H.A.; Subash, A.A.; Nielsen, F.D.; Dahl, A.B.; Skytte, J.L.; Andersson-Engels, S.; Khoptyar, D. Spectral characterisation of dairy products using photon time-of-flight spectroscopy. J. Near Infrared Spectrosc. 2013, 21, 375–383. [Google Scholar] [CrossRef]
- Khoptyar, D.; Kamran, F.; Nielsen, O.H.; Sparén, A.; Johansson, J.; Svensson, O.; Andersson-Engels, S. Broadband photon time of flight spectroscopy: Advanced spectroscopic tool for PAT in pharmaceutical and dairy industries. In Asia Communications and Photonics Conference; Optical Society of America: Washington, DC, USA, 2014. [Google Scholar]
- Kamran, F. Quality Assessment of Turbid Media: Milk and Pharmaceuticals. Ph.D. Thesis, Technical University of Denmark (DTU), København, Denmark, 2014. [Google Scholar]
- Johansson, S. Broadband Photon Time-of-Flight Spectroscopy on Pharmaceutical Tablets and Dairy Products. In Lund Reports on Atomic Physics; Lund University: Lund, Sweden, 2014. [Google Scholar]
- Svensson, T.; Andersson, M.; Rippe, L.; Svanberg, S.; Andersson-Engels, S.; Johansson, J.; Folestad, S. VCSEL-based oxygen spectroscopy for structural analysis of pharmaceutical solids. Appl. Phys. B Lasers Opt. 2008, 90, 345–354. [Google Scholar] [CrossRef]
- Johansson, J.; Folestad, S.; Josefson, M.; Sparen, A.; Abrahamsson, C.; Andersson-Engels, S.; Svanberg, S. Time-resolved NIR/vis spectroscopy for analysis of solids: Pharmaceutical tablets. Appl. Spectrosc. 2002, 56, 725–731. [Google Scholar] [CrossRef]
- Abrahamsson, C.; Johansson, J.; Andersson-Engels, S.; Svanberg, S.; Folestad, S. Time-resolved NIR spectroscopy for quantitative analysis of intact pharmaceutical tablets. Anal. Chem. 2005, 77, 1055–1059. [Google Scholar] [CrossRef] [PubMed]
- Abrahamsson, C.; Löwgren, A.; Strömdahl, B.; Svensson, T.; Andersson-Engels, S.; Johansson, J.; Folestad, S. Scatter correction of transmission near-infrared spectra by photon migration data: Quantitative analysis of solids. Appl. Spectrosc. 2005, 59, 1381–1387. [Google Scholar] [CrossRef] [PubMed]
- Svensson, T.; Persson, L.; Andersson, M.; Svanberg, S.; Andersson-Engels, S.; Johansson, J.; Folestad, S. Noninvasive characterization of pharmaceutical solids by diode laser oxygen spectroscopy. Appl. Spectrosc. 2007. [Google Scholar] [CrossRef] [PubMed]
- Subash, A.A. Wide-Bandwidth Time of Flight Spectroscopy of Turbid Media. sweden. Lund Rep. At. Phys. 2011, 61, 784–786. [Google Scholar]
- Abrahamsson, C. Time-Resolved Spectroscopy for Pharmaceutical Applications; Lund Institute of Technology, Lund University: Lund, Sweden, 2005. [Google Scholar]
- Kamran, F.; Abildgaard, O.H.A.; Sparén, A.; Svensson, O.; Johansson, J.; Andersson-Engels, S.; Andersen, P.E.; Khoptyar, D. Transmission near-infrared (NIR) and photon time-of-flight (PTOF) spectroscopy in a comparative analysis of pharmaceuticals. Appl. Spectrosc. 2015, 69, 389–397. [Google Scholar] [CrossRef]
- Editorial, Keeping up standards. Nat. Photonics 2018, 12, 117. [CrossRef]
- Di Sieno, L.; Nissinen, J.; Hallman, L.; Martinenghi, E.; Contini, D.; Pifferi, A.; Kostamovaara, J.; Mora, A.D. Miniaturized pulsed laser source for time-domain diffuse optics routes to wearable devices. J. Biomed. Opt. 2017, 22, 1–9. [Google Scholar] [CrossRef]
- Martinenghi, E.; Mora, A.D.; Contini, D.; Farina, A.; Villa, F.; Torricelli, A.; Pifferi, A. Spectrally Resolved Single-Photon Timing of Silicon Photomultipliers for Time-Domain Diffuse Spectroscopy. IEEE Photonics J. 2015, 7, 1–12. [Google Scholar] [CrossRef]
- Tyndall, D.; Rae, B.; Li, D.; Richardson, J.; Arlt, J.; Henderson, R. A 100Mphoton/s time-resolved mini-silicon photomultiplier with on-chip fluorescence lifetime estimation in 0.13μm CMOS imaging technology. In Proceedings of the 2012 IEEE International Solid-State Circuits Conference, San Francisco, CA, USA, 19–23 February 2012; pp. 122–124. [Google Scholar]
- Niclass, C.; Favi, C.; Kluter, T.; Gersbach, M.; Charbon, E. A 128 $\times$ 128 Single-Photon Image Sensor with Column-Level 10-Bit Time-to-Digital Converter Array. IEEE J. Solid-State Circuits 2008, 43, 2977–2989. [Google Scholar] [CrossRef]
- Dutton, N.A.W.; Gnecchi, S.; Parmesan, L.; Holmes, A.J.; Rae, B.; Grant, L.A.; Henderson, R.K. 11.5 A time-correlated single-photon-counting sensor with 14GS/S histogramming time-to-digital converter. Proccedings of the 2015 IEEE International Solid-State Circuits Conference—(ISSCC) Digest of Technical Papers, San Francisco, CA, USA, 22–26 February 2015; pp. 1–3. [Google Scholar]
- Di Sieno, L.; Mora, A.D.; Boso, G.; Tosi, A.; Pifferi, A.; Cubeddu, R.; Contini, D. Diffuse optics using a dual window fast-gated counter. Appl. Opt. 2014, 53, 7394–7401. [Google Scholar] [CrossRef]
- Behera, A.; di Sieno, L.; Pifferi, A.; Martelli, F.; Mora, A.D. Instrumental, optical and geometrical parameters affecting time-gated diffuse optical measurements: A systematic study. Biomed. Opt. Express 2018, 9, 5524–5542. [Google Scholar] [CrossRef]
- Di Sieno, L.; Boetti, N.G.; Mora, A.D.; Pugliese, D.; Farina, A.; Konugolu Venkata Sekar, S.; Ceci-Ginistrelli, E.; Janner, D.; Pifferi, A.; Milanese, D. Towards the use of bioresorbable fibers in time-domain diffuse optics. J. Biophotonics 2017, 11, e201600275. [Google Scholar] [CrossRef]
- Pifferi, A.; Torricelli, A.; Cubeddu, R.; Quarto, G.; Re, R.; Konugolu Venkata Sekar, S.; Spinelli, L.; Farina, A.; Martelli, F.; Wabnitz, H. Mechanically switchable solid inhomogeneous phantom for performance tests in diffuse imaging and spectroscopy. J. Biomed. Opt. 2015, 20, 121304. [Google Scholar] [CrossRef] [PubMed]
- Martelli, F.; di Ninni, P.; Zaccanti, G.; Contini, D.; Spinelli, L.; Torricelli, A.; Cubeddu, R.; Wabnitz, H.; Mazurenka, M.; Macdonald, R. Phantoms for diffuse optical imaging based on totally absorbing objects, part 2: Experimental implementation. J. Biomed. Opt. 2014, 19, 76011. [Google Scholar] [CrossRef] [PubMed]
- Spinelli, L.; Botwicz, M.; Zolek, N.; Kacprzak, M.; Milej, D.; Sawosz, P.; Liebert, A.; Weigel, U.; Durduran, T.; Foschum, F.; et al. Determination of reference values for optical properties of liquid phantoms based on Intralipid and India ink. Biomed. Opt. Express 2014, 5, 2037–2053. [Google Scholar] [CrossRef]
- Vavadi, H.; Mostafa, A.; Zhou, F.; Uddin, K.M.S.; Althobaiti, M.; Xu, C.; Bansal, R.; Ademuyiwa, F.; Poplack, S.; Zhu, Q. Compact ultrasound-guided diffuse optical tomography system for breast cancer imaging. J. Biomed. Opt. 2018, 24, 021203. [Google Scholar] [CrossRef]
- Zhu, Q. Optical Tomography with Ultrasound Localization: Initial Clinical Results and Technical Challenges. Technol. Cancer Res. Treat. 2005, 4, 235–244. [Google Scholar] [CrossRef]
- Cortese, L.; Presti, G.L.; Pagliazzi, M.; Contini, D.; Mora, A.D.; Pifferi, A.; Konugolu Venkata Sekar, S.; Spinelli, L.; Taroni, P.; Zanoletti, M.; et al. Liquid phantoms for near-infrared and diffuse correlation spectroscopies with tunable optical and dynamic properties. Biomed. Opt. Express 2018, 9, 2068–2080. [Google Scholar] [CrossRef]
- Glycerine Producers’ Association. Physical Properties of Glycerineand Its Solutions; Glycerine Producers’ Association: New York, NY, USA, 1963. [Google Scholar]
- Quarto, G.; Pifferi, A.; Bargigia, I.; Farina, A.; Cubeddu, R.; Taroni, P. Recipes to make organic phantoms for diffusive optical spectroscopy. Appl. Opt. 2013, 52, 2494–2502. [Google Scholar] [CrossRef]
- SOLUS—Smart Optical and Ultrasound Diagnostics of Breast Cancer. Available online: http://www.solus-project.eu/ (accessed on 29 November 2019).
- LUCA—Laser and Ultrasound Co-analyzer for Thyroid Nodules. Available online: http://luca-project.eu/ (accessed on 29 November 2019).
- Lanka, P.; Farina, A.; Konugolu Venkata Sekar, S.; Guadagno, C.; Spinelli, L.; Taroni, P.; Cubeddu, R.; Nisoli, E.; Pifferi, A. Multidistance time domain diffuse optical spectroscopy in the assessment of abdominal fat heterogeneity. In Biophotonics: Photonic Solutions for Better Health Care VI; International Society for Optics and Photonics: Bellingham, WA, USA, 2018; Volume 10685, p. 1068513. [Google Scholar]
- Farina, A.; Konugolu Venkata Sekar, S.; Guadagno, C.; Spinelli, L.; Lanka, P.; Taroni, P.; Cubeddu, R. In vivo depth heterogeneity of the abdomen assessed by broadband time-domain diffuse optical spectroscopy. Eur. Conf. Biomed. Opt. 2017, 10412, 104120M. [Google Scholar]
- Di Sieno, L.; Cubeddu, R.; Sportouche, H.; Savéry, D.; Konugolu Venkata Sekar, S.; Rosinski, B.; Farina, A.; Ferocino, E.; Lanka, P.; Taroni, P.; et al. Solid heterogeneous phantoms for multimodal ultrasound and diffuse optical imaging: An outcome of the SOLUS project for standardization. In Novel Biophotonics Techniques and Applications V; International Society for Optics and Photonics: Bellingham, WA, USA, 2019; Volume 11075, p. 1107516. [Google Scholar]
- Lanka, P.; Yang, L.; Orive-Miguel, D.; Veesa, J.D.; Tagliabue, S.; Sudakou, A.; Samaei, S.; Forcione, M.; Kovacsova, Z.; Behera, A.; et al. The BITMAP exercise: A multi-laboratory performance assessment campaign of diffuse optical instrumentation. In Diffuse Optical Spectroscopy and Imaging VII; International Society for Optics and Photonics: Bellingham, WA, USA, 2019; Volume 11074, p. 110741A. [Google Scholar]
- Konugolu Venkata Sekar, S.; Pacheco, A.; Martella, P.; Li, H.; Lanka, P.; Pifferi, A.; Andersson-Engels, S. A Solid Phantom Recipe for Diffuse Optics in Biophotonics Applications: A Step Towards Anatomically Correct 3D Tissue Phantoms. Biomed. Opt. Express 2019, 10, 2090–2100. [Google Scholar]


| Tissue Composition | Scattering Parameters | ||||||
|---|---|---|---|---|---|---|---|
| Breast Type | tHb (μM) | SO2 (%) | Lipid (mg/cm3) | Water (mg/cm3) | Collagen (mg/cm3) | a (cm−1) | b |
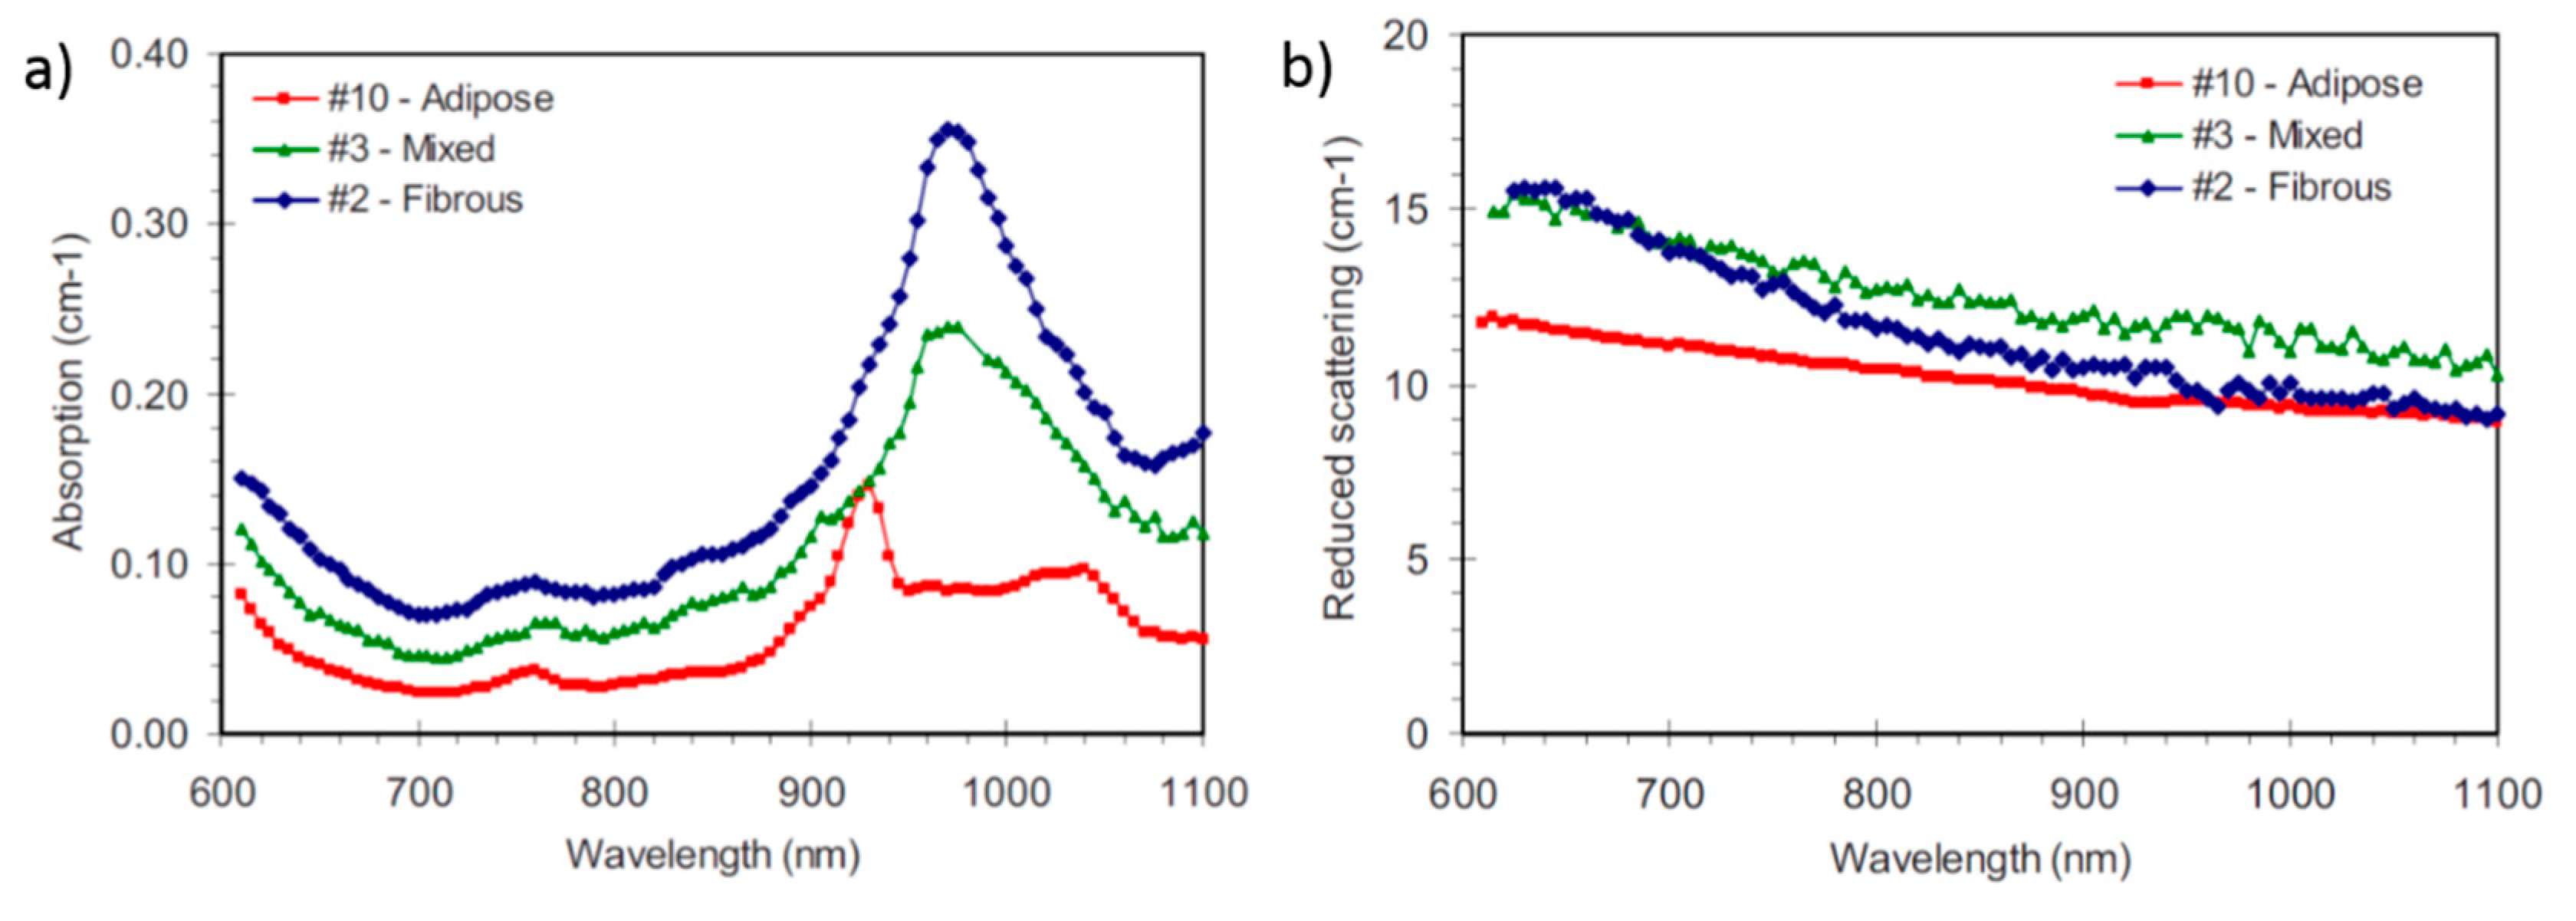
| Adipose | 10.0 ± 1.2 | 71 ± 10 | 737 ± 52 | 111 ± 15 | 24 ± 5 | 13.4 ± 2.0 | 0.69 ± 0.28 |
| Mixed | 24.1 ± 2.0 | 84 ± 1 | 428 ± 24 | 302 ± 80 | 60 ± 1 | 16.1 ± 0.5 | 0.71 ± 0.03 |
| Fibrous | 24.3 ± 1.8 | 80 ± 1 | 173 ± 56 | 615 ± 40 | 107 ± 22 | 17.6 ± 1.1 | 1.16 ± 0.09 |
© 2019 by the authors. Licensee MDPI, Basel, Switzerland. This article is an open access article distributed under the terms and conditions of the Creative Commons Attribution (CC BY) license (http://creativecommons.org/licenses/by/4.0/).
Share and Cite
Konugolu Venkata Sekar, S.; Lanka, P.; Farina, A.; Dalla Mora, A.; Andersson-Engels, S.; Taroni, P.; Pifferi, A. Broadband Time Domain Diffuse Optical Reflectance Spectroscopy: A Review of Systems, Methods, and Applications. Appl. Sci. 2019, 9, 5465. https://doi.org/10.3390/app9245465
Konugolu Venkata Sekar S, Lanka P, Farina A, Dalla Mora A, Andersson-Engels S, Taroni P, Pifferi A. Broadband Time Domain Diffuse Optical Reflectance Spectroscopy: A Review of Systems, Methods, and Applications. Applied Sciences. 2019; 9(24):5465. https://doi.org/10.3390/app9245465
Chicago/Turabian StyleKonugolu Venkata Sekar, Sanathana, Pranav Lanka, Andrea Farina, Alberto Dalla Mora, Stefan Andersson-Engels, Paola Taroni, and Antonio Pifferi. 2019. "Broadband Time Domain Diffuse Optical Reflectance Spectroscopy: A Review of Systems, Methods, and Applications" Applied Sciences 9, no. 24: 5465. https://doi.org/10.3390/app9245465
APA StyleKonugolu Venkata Sekar, S., Lanka, P., Farina, A., Dalla Mora, A., Andersson-Engels, S., Taroni, P., & Pifferi, A. (2019). Broadband Time Domain Diffuse Optical Reflectance Spectroscopy: A Review of Systems, Methods, and Applications. Applied Sciences, 9(24), 5465. https://doi.org/10.3390/app9245465