Article

Performance Evaluation and Optimization of a Building-Integrated Photovoltaic/Thermal Solar Water Heating System for Exterior Shading: A Case Study in South China

1
Hunan Provincial Engineering Research Center of Energy Saving and Material Technology of Green and Low Carbon Buildings, Hunan Institute of Engineering, Xiangtan 411104, China
2
College of Civil Engineering, Guangzhou University, Guangzhou 510006, China
*
Author to whom correspondence should be addressed.
Appl. Sci. 2019, 9(24), 5395; https://doi.org/10.3390/app9245395
Submission received: 25 October 2019 / Revised: 25 November 2019 / Accepted: 5 December 2019 / Published: 10 December 2019
(This article belongs to the Special Issue Building-Integrated Photovoltaics)

Abstract

:
Building-integrated photovoltaic/thermal (BIPV/T) systems can produce both electrical and thermal energy through the use of photovoltaic/thermal modules integrated with building envelope. Exterior shading is a common way to improve summer indoor thermal environment of the buildings in low latitudes. This study presents a BIPV/T solar water heating system for exterior shading of residences. In order to evaluate and optimize the system performances, a model was developed to simulate the thermal and electrical production of such system. The simulations for an example system in Guangzhou, a city in South China, were performed to investigate the influences of tank installation height and panel tilt angle on system performances. According to simulation results, the suggested tank installation height is 0.6~0.8 m. The shading coefficient ranges from 0.797 to 0.828 when the tilt angle varies from 14° to 38°. The reduction of panel tilt angle causes a certain improvement of shading performance. The annual auxiliary heat reaches the minimum when the panel tilt angle equals 28°, and the annual electric energy output changes little when the panel tilt angle ranges from 20° to 28°. Comprehensively considering thermal, electrical, and shading performances, the suggested panel tilt angle is 20°~28°. The average thermal and electrical efficiencies are respectively 38.25% and 11.95% when the panel tilt angle ranges from 20° to 28°. The presented system is a promising way to provide hot water, electricity, and exterior shading for residences.

1. Introduction

In the past decade years, more and more attention was paid to the utilization of solar energy in China. China’s photovoltaic (PV) power capacity reached 136 million kilowatts by the end of June 2019, ranking first in the world [1]. For crystalline silicon solar cells, more than 80% of the solar irradiations cannot be converted into electricity, and most of them are converted into thermal energy. This leads to a temperature rise of solar cells and a drop of electrical efficiency. As the PV cell temperature increases above 25 °C, the electrical efficiency decreases by 0.04~0.08% per degree centigrade rise [2]. Photovoltaic/thermal (PV/T) collectors using air or water as working fluid can produce electrical and thermal energy simultaneously, which makes the PV cell temperature decrease and electrical efficiency increase to a certain extent.
Building-integrated photovoltaic (BIPV) systems consist of the integration of PV modules into building envelope [3]. In BIPV systems, PV modules simultaneously serve as building envelope material and power generator, and have been widely used for exterior shading [4,5]. There is a likelihood of performance degradation in a BIPV system due to various factors, including the increase of PV module temperature [6]. Building-integrated photovoltaic/thermal (BIPV/T) systems can recover the heat from PV modules incorporated with the building envelope, and often utilize air as working fluid [7,8,9].
Some studies about PV/T water collectors have been conducted, which are reviewed by Yang and Athienitis [10]. Moreover, the performance of PV/T water collectors integrated into a building envelope (roof or façade) should be evaluated according to practical operation conditions. Corbin et al. performed an experimental and numerical investigation on thermal and electrical performance of a water-based BIPV/T collector system on the roof of a house in Boulder, Colorado [11]. The analysis results indicated that the PV cell efficiency can be raised by 5.3% and that the outlet water temperature is suitable for domestic hot water use. Davidsson et al. investigated the thermal and electrical performances of a multifunctional PV/T hybrid solar window in Älvkarleö, Sweden, which can simultaneously produce electricity and hot water and can serve as a sunshade [12]. The solar window mainly consists of reflector screens located on the inside of the window. The reflector screens are integrated with PV cells and water pipes. Buker et al. investigated the performance of a building-integrated PV/T roof collector using polyethylene pipes as the thermal absorber in Nottingham, UK [13]. The previous studies about water-based BIPV/T systems rarely dealt with their shading performance.
Most BIPV and BIPV/T systems are connected to power grids. Stand-alone photovoltaic systems have been used for outdoor lighting, electric vehicles, and outdoor water pumping, etc. [14,15]. In this paper, a stand-alone BIPV/T solar water heating system for exterior horizontal shading of residence windows is presented. The system can not only produce domestic hot water but also help to increase the electrical efficiency of PV cells. In the presented system, the collectors of decentralized solar water heaters are integrated with building envelope. This study aims to evaluate and optimize the performance of such system applied in a typical city of south China. The thermal, electrical, and shading performances of such system are analyzed through simulations.

2. System Description

2.1. Description of System Configuration

A schematic diagram of the system under investigation is shown in Figure 1. Such system can be used to provide households with hot water, electricity, and exterior shading of windows.
The PV/T panel for exterior shading of a south-facing window is connected to a wall-mounted hot water tank of 120 L. The PV/T panel is fixed with a certain tilt angle by triangle brackets. The PV/T panel and water tank are mounted on the exterior wall with expansion bolts. In order to ensure safety and durability, the selection of brackets and expansion bolts for the installation should meet relevant standards or regulations. The tank is near and above the PV/T panel to create a natural circulation between the PV/T panel and tank, which is called thermosyphon solar water heater systems. A gas water heater is used to provide auxiliary heat by the way of mixing the two flows from the tank and the gas water heater when solar radiation is insufficient.
The investigated system is a stand-alone photovoltaic system. The excess electrical power from the PV/T panel is stored in batteries which ensure that the electricity can be supplied stably. The electricity produced by the PV/T panel is limited and mainly supplied for direct current (DC) lighting.

2.2. Determination of PV/T Panel Size

The whole geographic area of China is divided into five zones in terms of weather conditions. Among the five zones, the hot summer and warm winter (HSWW) zone located in the south of China has a subtropical humid monsoon climate with strong solar radiation and a long summer. Therefore, sun shading has become a common way to improve the indoor thermal environment of the buildings in the HSWW zone.
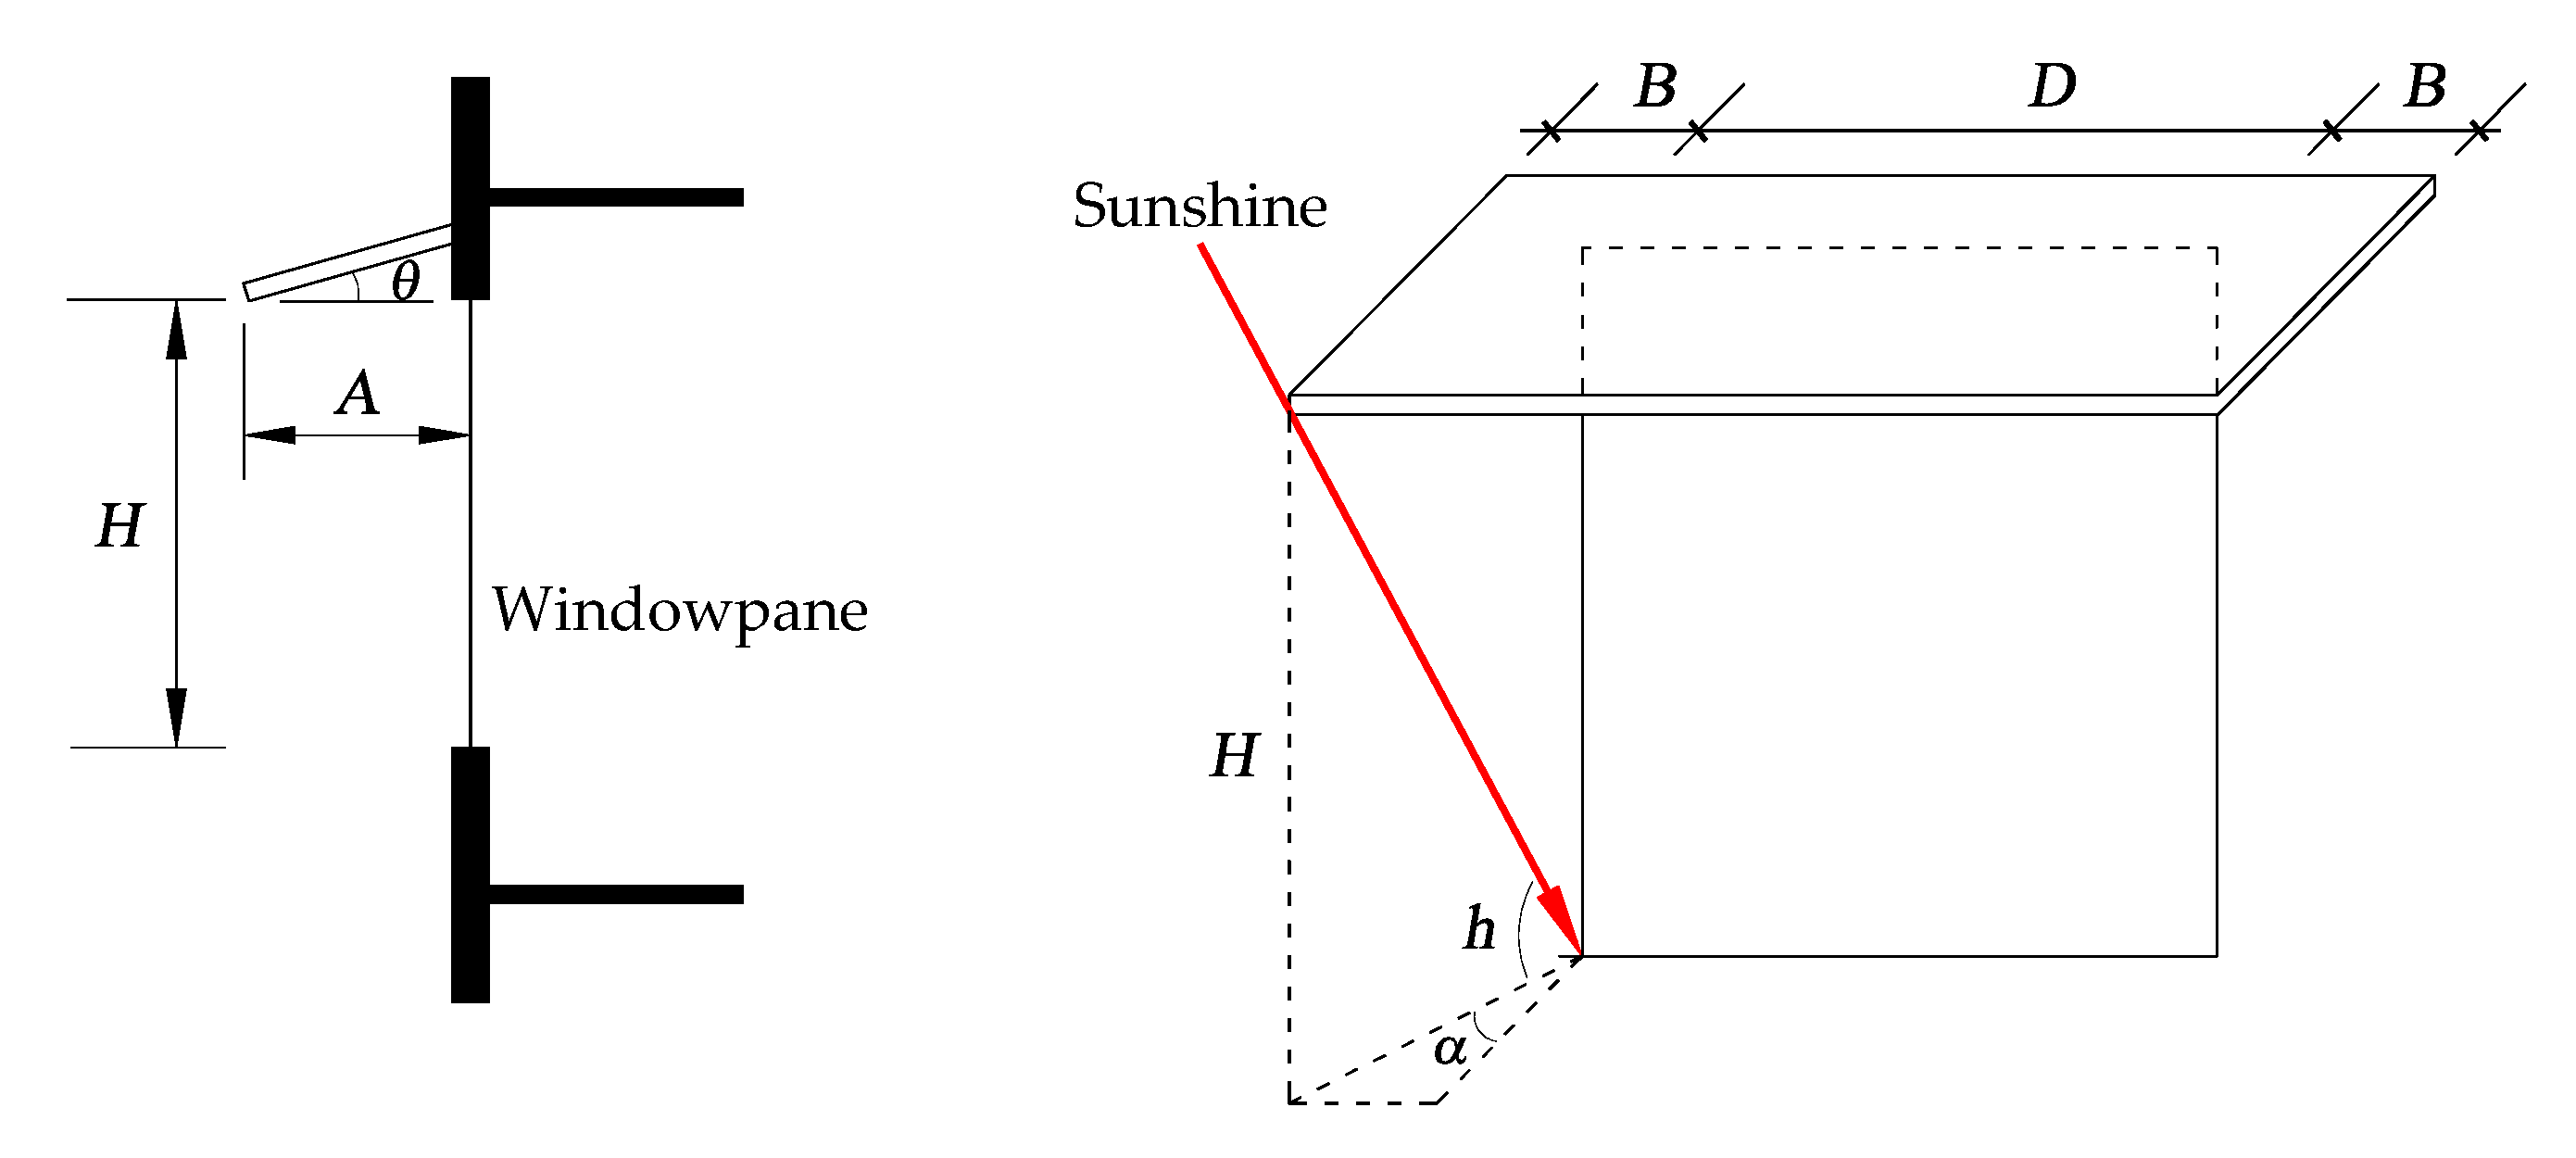
For a PV/T panel used as horizontal sunshade shown in Figure 2, its performance of shading the sunshine from above depends on its overhanging length (A). The minimum overhanging length can be calculated by:
A = H cot h cos α ,
where A is the overhanging length (m), H is the vertical distance between the bottom of the panel and windowsill (m), h is the solar altitude angle (0° < h < 90°), α is the solar azimuth angle (0° < α < 90°). Then, the panel width is determined by:
W = A E cos θ ,
where W is the panel width (m), θ is the tilt angle of the panel (°), E is the embedded depth of the windowpane (m). The performance of shading the sunshine from the left and right sides depends on the distances between the left/right sides of the window and the left/right endpoints of the panel (B), the minimum value of which is calculated by:
B = H cot h sin α .
Therefore, the panel length can be determined by:
L = D + 2 H cot h sin α ,
where L is panel length (m), D is window width (m).
The value of H is taken as the window height from the viewpoint of reducing overhanging length. In view of the fact that the solar altitude angle and the azimuth angle always vary, it is necessary to determine a design condition for exterior shading of windows. In the HSWW zone, the autumnal equinox (22, 23, or 24 September) is a transition from hot weather to cool weather. Thus, the solar altitude angle and azimuth angle at 11 a.m. or 1:00 p.m. on the autumnal equinox are determined as the design condition because the strongest solar radiation during a day occurs around noon. A south-facing window (Orientation: 180° North) of a residence in Guangzhou, a city in the HSWW zone, is chosen as an application object of the PV/T panel in the presented system. The required hot water production is 120 L per day. The hot water temperature (HWT) is taken to be 45 °C, which is a little higher than the HWT for practical usage in households. According to the common device configuration of solar water heaters in Guangzhou, the irradiation-collection area of the panel is taken to be 1.6 m2. The panel size and tilt angle, which make the panel just shade the sunshine at 11 a.m. or 1:00 p.m. on the autumnal equinox, were determined using Equations (1)–(4), and are listed in Table 1.

2.3. Structrue of PV/T Panel

The PV/T panel in this study is a sheet-and-tube PV/T solar collector. As shown in Figure 3, the PV/T panel consists of glass cover, mono-crystalline silicon cells, aluminum absorber plate, copper tubes, and insulation layer. The PV cells are packaged and attached to the absorber plate with a packing factor of 0.85. The air gap between the glass cover and the PV cells can help to reduce the heat loss from the upper surface. Direct flow absorber is adopted to reduce the water flow resistance in the tubes. Six parallel copper tubes (i.e., collector risers) with a diameter of 8 mm are welded at the bottom of the absorber plate. Both ends of the copper tubes are welded with two headers with a diameter of 22 mm. The PV cell efficiency at reference conditions (at irradiation intensity of 1000 W/m2 and temperature of 25 °C) is 15%.

3. Methodology

3.1. Performance Evaluation Methods

The performance evaluation of the presented system involves its thermal, electrical, and shading performances. Simulations are used to investigate the influences of tank installation height (i.e., the vertical distance between the collector outlet and tank bottom) and the panel tilt angle on system performances.
The operation strategy directly affects the simulation process of the thermosyphon solar water heater system. According to the domestic hot water usage habits of Chinese households, the hot water produced during the day is mainly used for the shower at night. Thus, we consider that the hot water production of 120 L in the day can be entirely consumed at night. Auxiliary heat is provided by gas water heater when insufficient solar radiation cannot make the tank water temperature reach 45 °C.
In this study, the daily/annual thermal efficiencies of the system (ηth) are defined as:
η t h = Q u L R T ,
where Qu is the daily/annual useful thermal energy from PV/T panel(MJ), L is the daily/annual heat losses (MJ), RT is the daily/annual solar radiation on panel (MJ).
The annual electrical efficiency (ηe) is defined as:
η e = E o u t R p v ,
where Eout is the annual electric energy output (kWh), Rpv is the annual solar radiation on PV cells (kWh).
Considering that electrical energy is high-grade energy, primary energy-saving efficiency is proposed to evaluate the comprehensive performance of the PV/T system, and is given by [16,17]:
η f = η t h + λ η e η p ,
where ηf is the annual primary energy-saving efficiency, λ is the packing factor of PV/T panel, ηp is the heat-to-electricity conversion efficiency of conventional power plant, and its value is taken as 38%.
The shading performance of the PV/T panel is evaluated through the shading coefficient which is defined as [18]:
S D = Q S Q I ,
where SD is the shading coefficient of window, QS and QI are respectively the total solar heat gains through the window with exterior shading and the window without exterior shading in a cooling season (MJ). The simulations of the total solar heat gains through the window were performed using DesignBuilder which is the first comprehensive user interface for the EnergyPlus dynamic thermal simulation engine [19].

3.2. TRNSYS Modeling

TRNSYS is an acronym for “Transient System Simulation Program”, and is a complete and extensible simulation environment for transient simulations of systems [20]. The TRNSYS 17 simulation program was used to perform the simulations needed for the performance evaluation and optimization. The interrelationship of various system components is shown in Figure 4. The water-based PV/T collectors can be regarded as a flat-plate collector with a single glazing sheet, and their thermal performance can be evaluated based on the Hottel–Whillier model [16]. The main component of the TRNSYS deck file is Type 45a. This component models a thermosyphon solar water heater system which includes a flat-plate solar collector, a stratified storage tank and water as working fluid [20]. The system is analyzed by respectively dividing the collector and the water tank into a number of nodes. The thermal performance of the flat-plate solar collector is modeled using the Hottel–Whillier model. The thermosyphon loop is divided into a number of segments, and Bernoulli’s equation is applied to each segment. The flow rate is obtained by numerical solution of the resulting equations [20]. TRNSYS type 50a (PV-thermal collectors) is used to model the electric energy output of the PV/T panel. The temperature gradients across the thickness of the cell/plate composite are neglect for the PV cells are bonded to plate surface tightly and the cell thickness is very small. The temperature of the cell/plate composite is calculated by iteration. The cell efficiency is assumed to decrease linearly with the temperature of cell/plate composite. The heat loss coefficient of the PV/T panel is assumed to be constant. The values of the water temperature and flow rate to collector output from TRNSYS type 45a are used as the inputs of TRNSYS type 50a. The electric energy output is determined based on the assumption of maximum power point tracking (MPPT).
Ji et al. performed a series of tests for water-based sheet-and-tube PV/T solar collectors [17]. The parameters for thermal efficiency found by Ji et al. are adopted for the water-based sheet-and-tube PV/T solar collector in this study. When the tested flow rate is 0.038 kg/s, the collector efficiency equation is [17]:
η = 0.566 6.08 T i n T a G ,
where Tin and Ta are respectively the water inlet temperature and ambient air temperature (°C), G is the solar irradiation (W/m2). During the simulation process of TRNSYS type 45a, a certain modification will be made to Equation (9) according to actual flow rate.
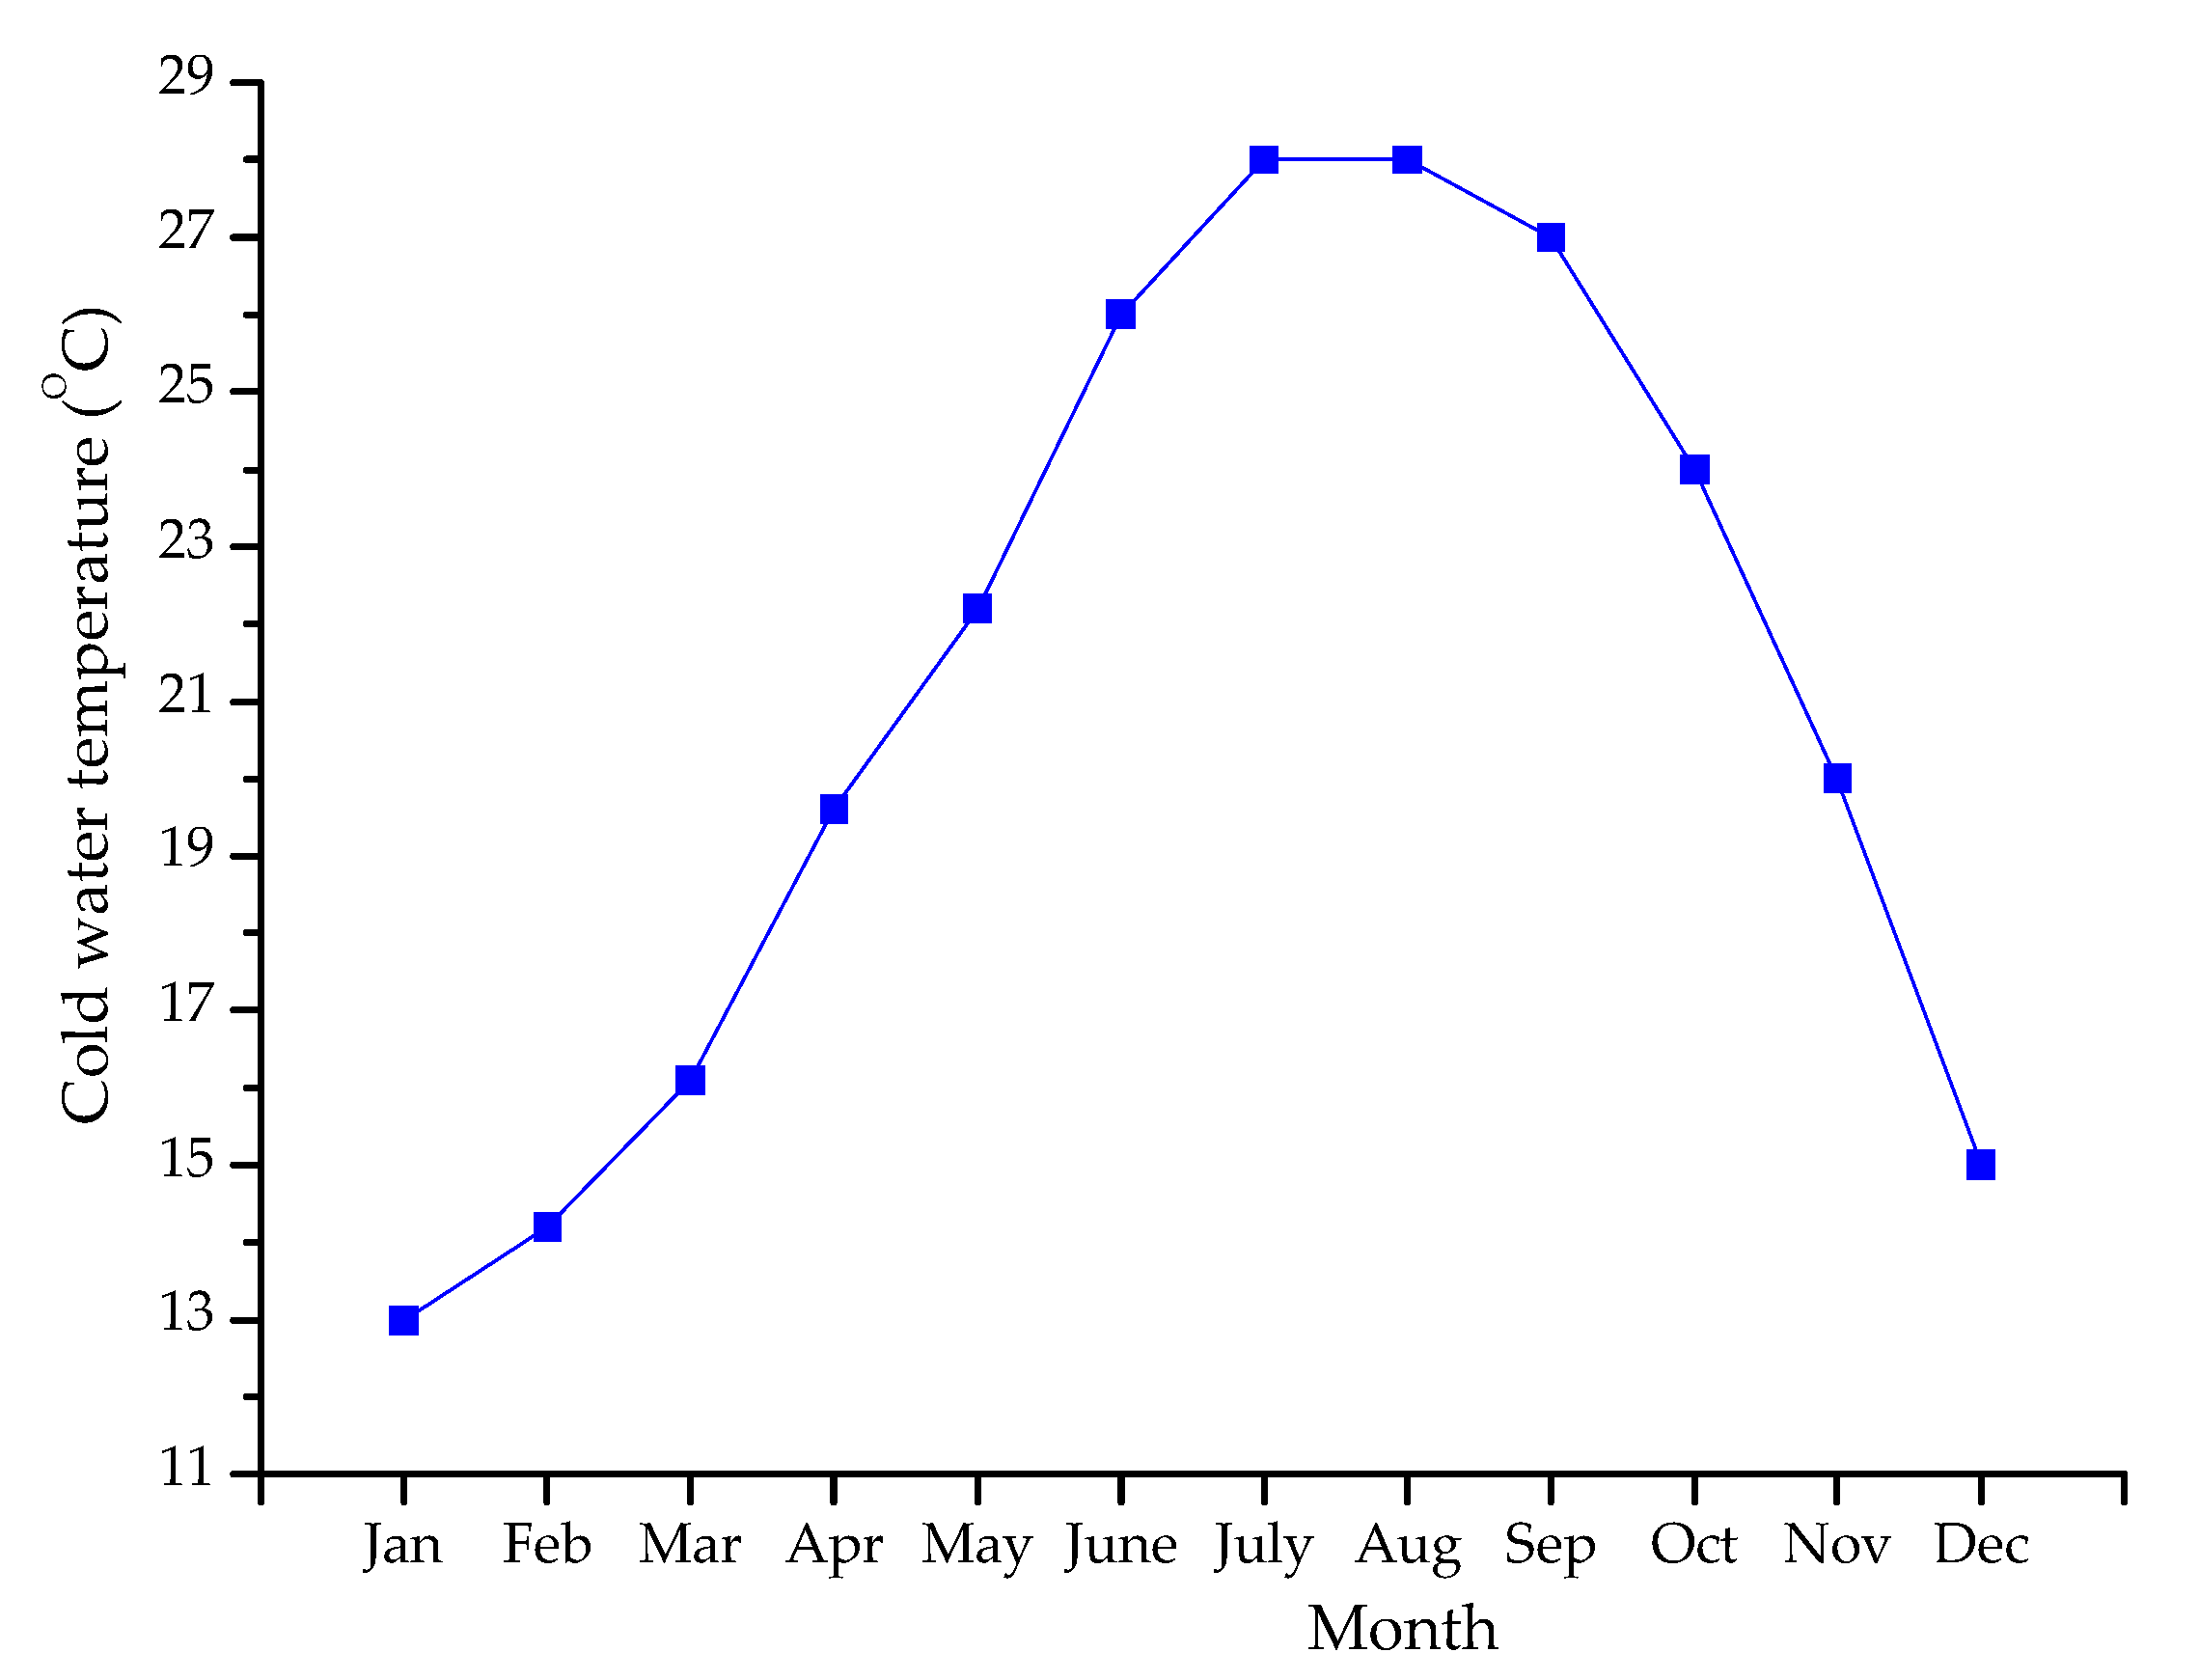
The orientation of the PV/T collector is set as due south. The main parameters for the developed TRNSYS deck file are listed in Table 2. The monthly average cold water temperatures in Guangzhou are presented in Figure 5.

3.3. Validation of the TRNSYS Model

Chow et al. developed a numerical model for thermosyphon PV/T solar water heaters, and the numerical model was validated by experimental test results [21,22]. Their simulation work was based on typical meteorological year (TMY) weather data of Hong Kong which is nearly at the same latitude and in the same climate as Guangzhou. For validation, the TRNSYS simulations based on TMY weather data of Hong Kong have been carried out using the developed TRNSYS model in this work. The tilt angle is taken to be the same as that in Chow et al.’s simulation work (i.e., 35°). The time step for the TRNSYS simulations is 0.2 h.
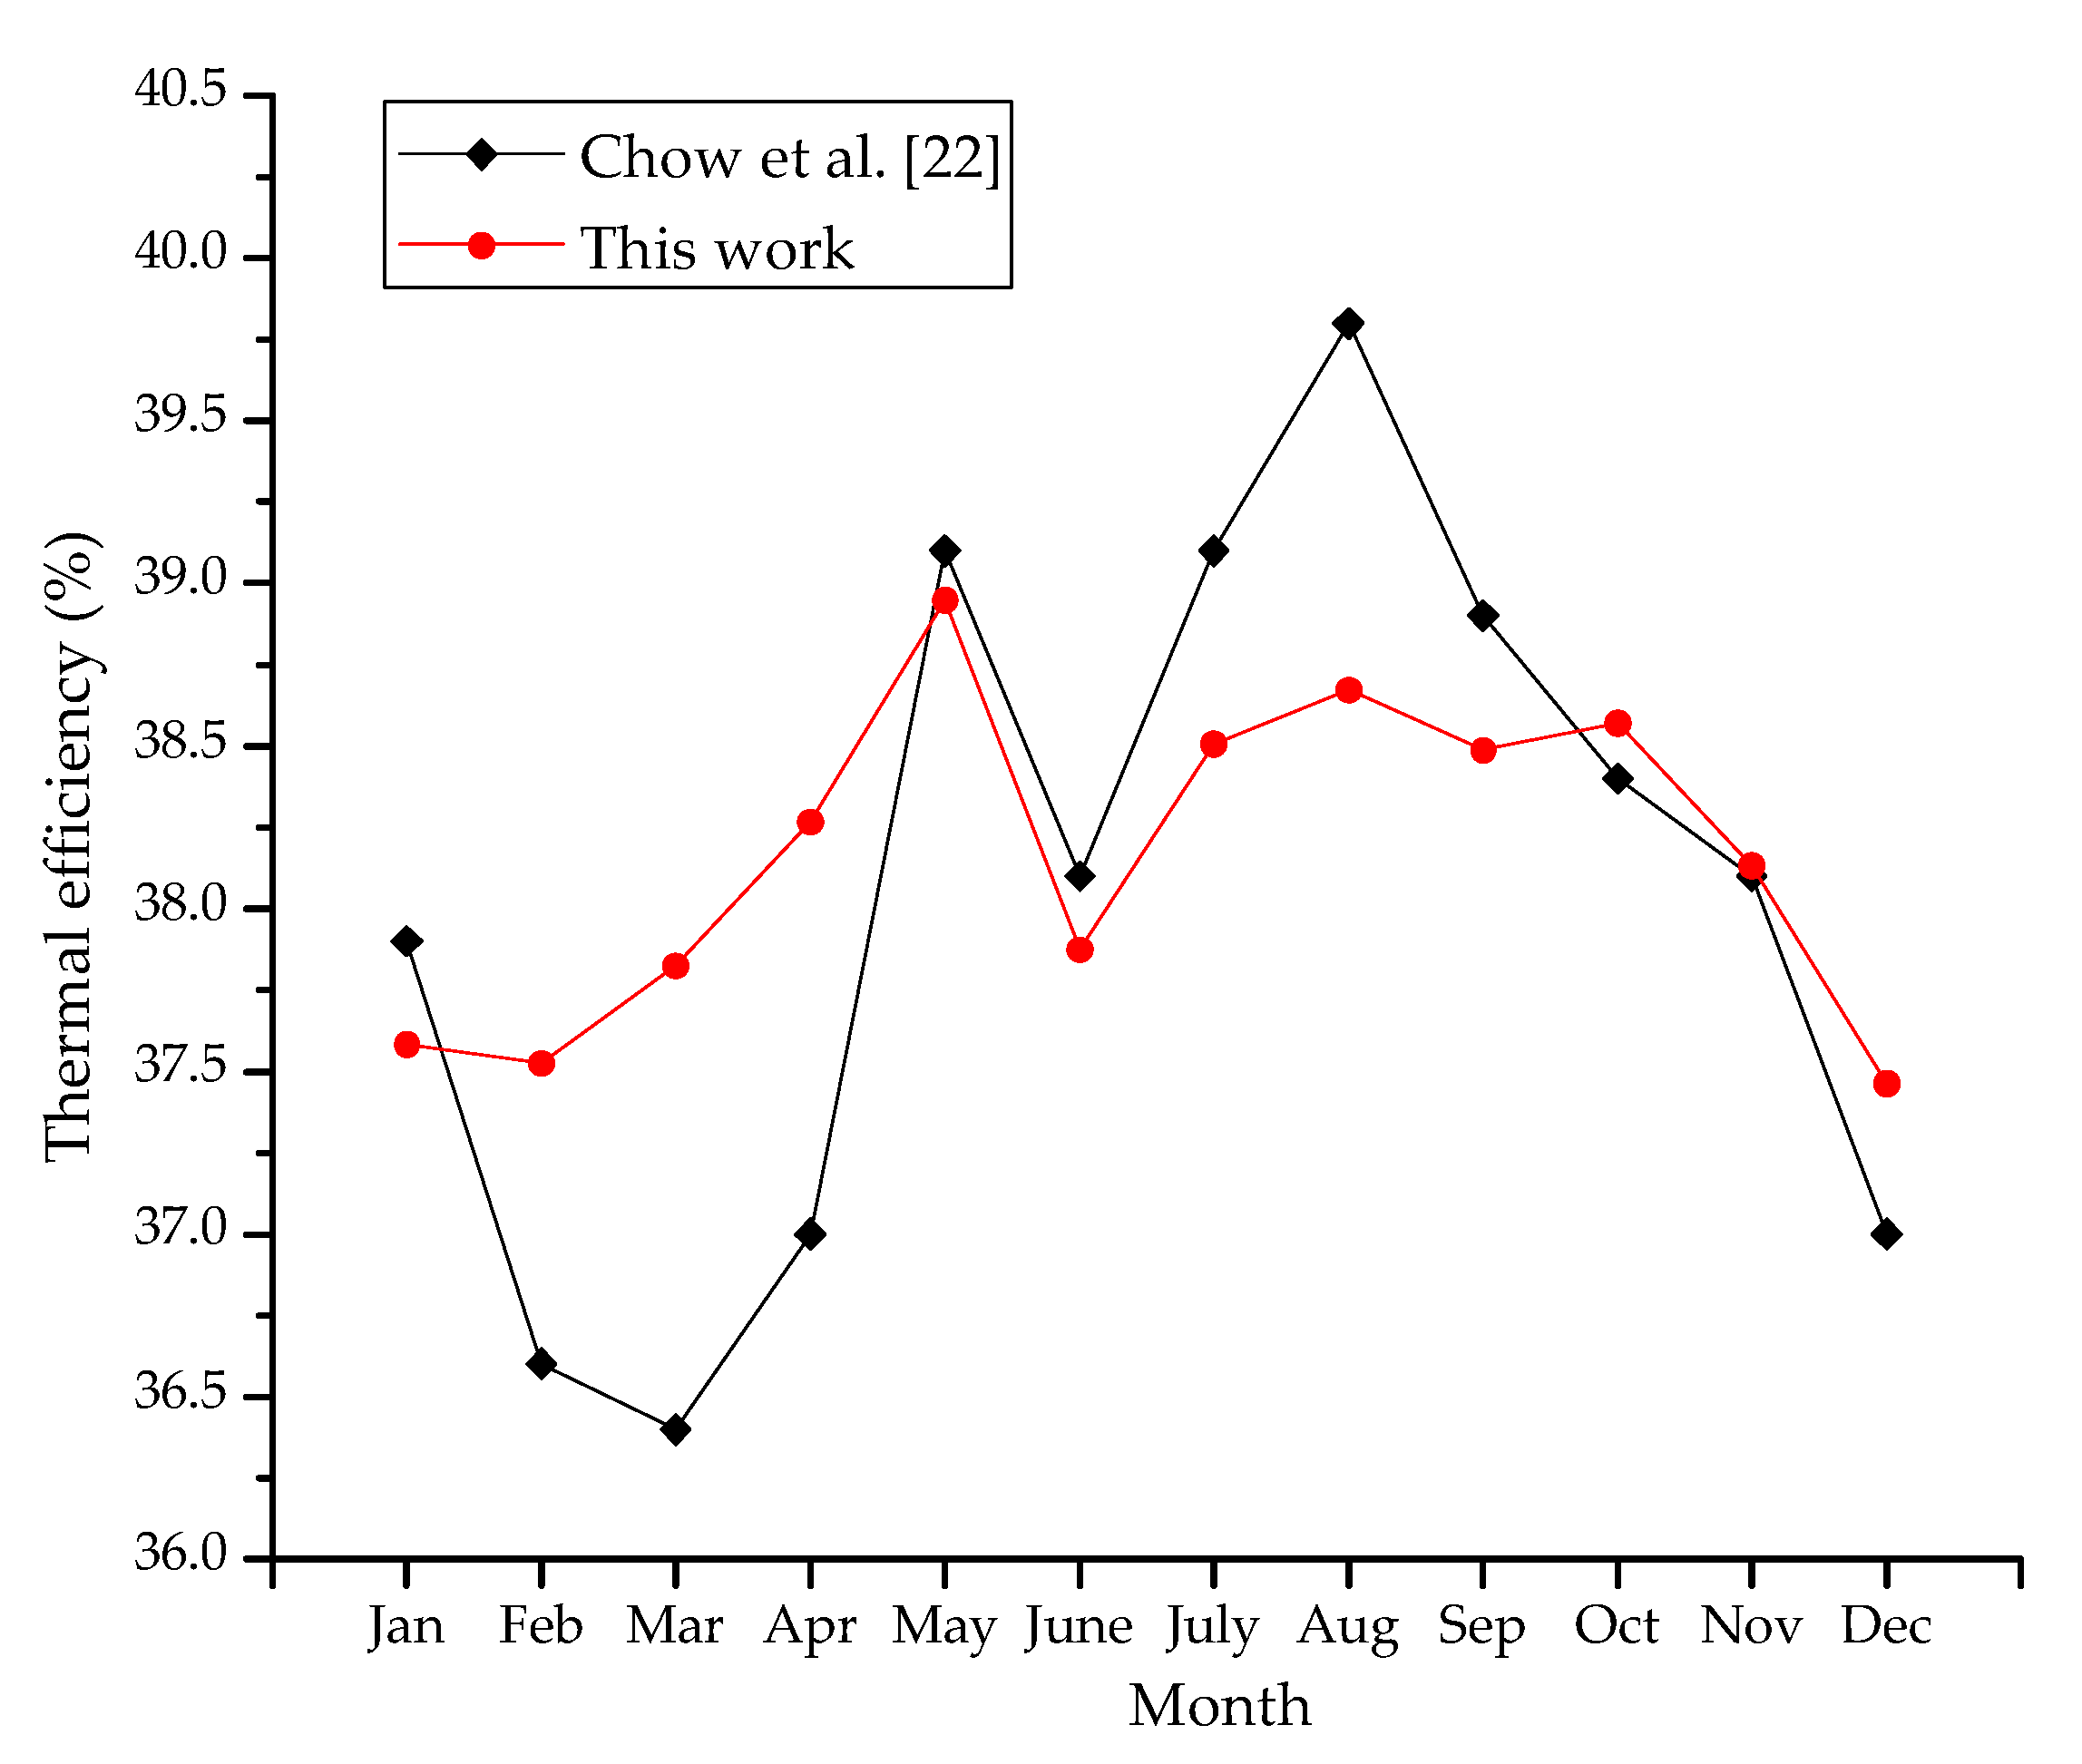
Figure 6 shows the monthly thermal efficiencies of Chow et al.’s work and this work. Except in February, March, April, and August, the monthly thermal efficiencies are quite close in the other months. The largest difference between the two series of efficiencies is 1.42% (in March). For the purpose of calibration, the coefficient of variation of the root-mean-square error (CVRMSE) was determined using the following equation [23]:
C V R M S E = i = 1 n ( η i η ^ i ) 2 n 1 η ¯ × 100 ,
where n is the number of simulation predicted data in this work (n = 12), ηi is the monthly thermal efficiency of the ith month in Chow et al.’s work, η ^ i is the monthly thermal efficiency of the ith month in this work, η ¯ is the arithmetic mean of the monthly thermal efficiencies in Chow et al.’s work. The CVRMSE was found to be 2.05%. The calibration result of CVRMSE value below 3% indicates that the prediction accuracy of the model developed in this work is very close to that of the model validated by experiment results in Chow et al.’s work. The annual thermal efficiencies of Chow et al.’s work and this work are respectively 38.1% and 38.18%, which are very close.
The annual electrical efficiencies in Chow et al.’s work and this work are respectively 9.6% and 11.97%. The difference in annual electrical efficiency mainly results from the difference in characteristic parameters of PV cells. The electrical efficiency at the same reference conditions and the temperature coefficient of the solar cell efficiency in Chow et al.’s work were respectively 13% and 0.005/K, which results in an obvious efficiency decrease comparing to the efficiency in this work. It can be concluded that the annual electrical efficiencies in Chow et al.’s work and this work would be close if such two characteristic parameters of PV cells were the same.

4. Results and Discussion

Thermal and electrical energy production was simulated through the running of the developed TRNSYS deck. TMY weather data of Guangzhou and a time step of 0.2 h were used for the simulations. The influences of the tank installation height and panel tilt angle on system performances were respectively investigated through the simulations of various scenarios.

4.1. Influence ofTank Installation Height on Thermal Performance

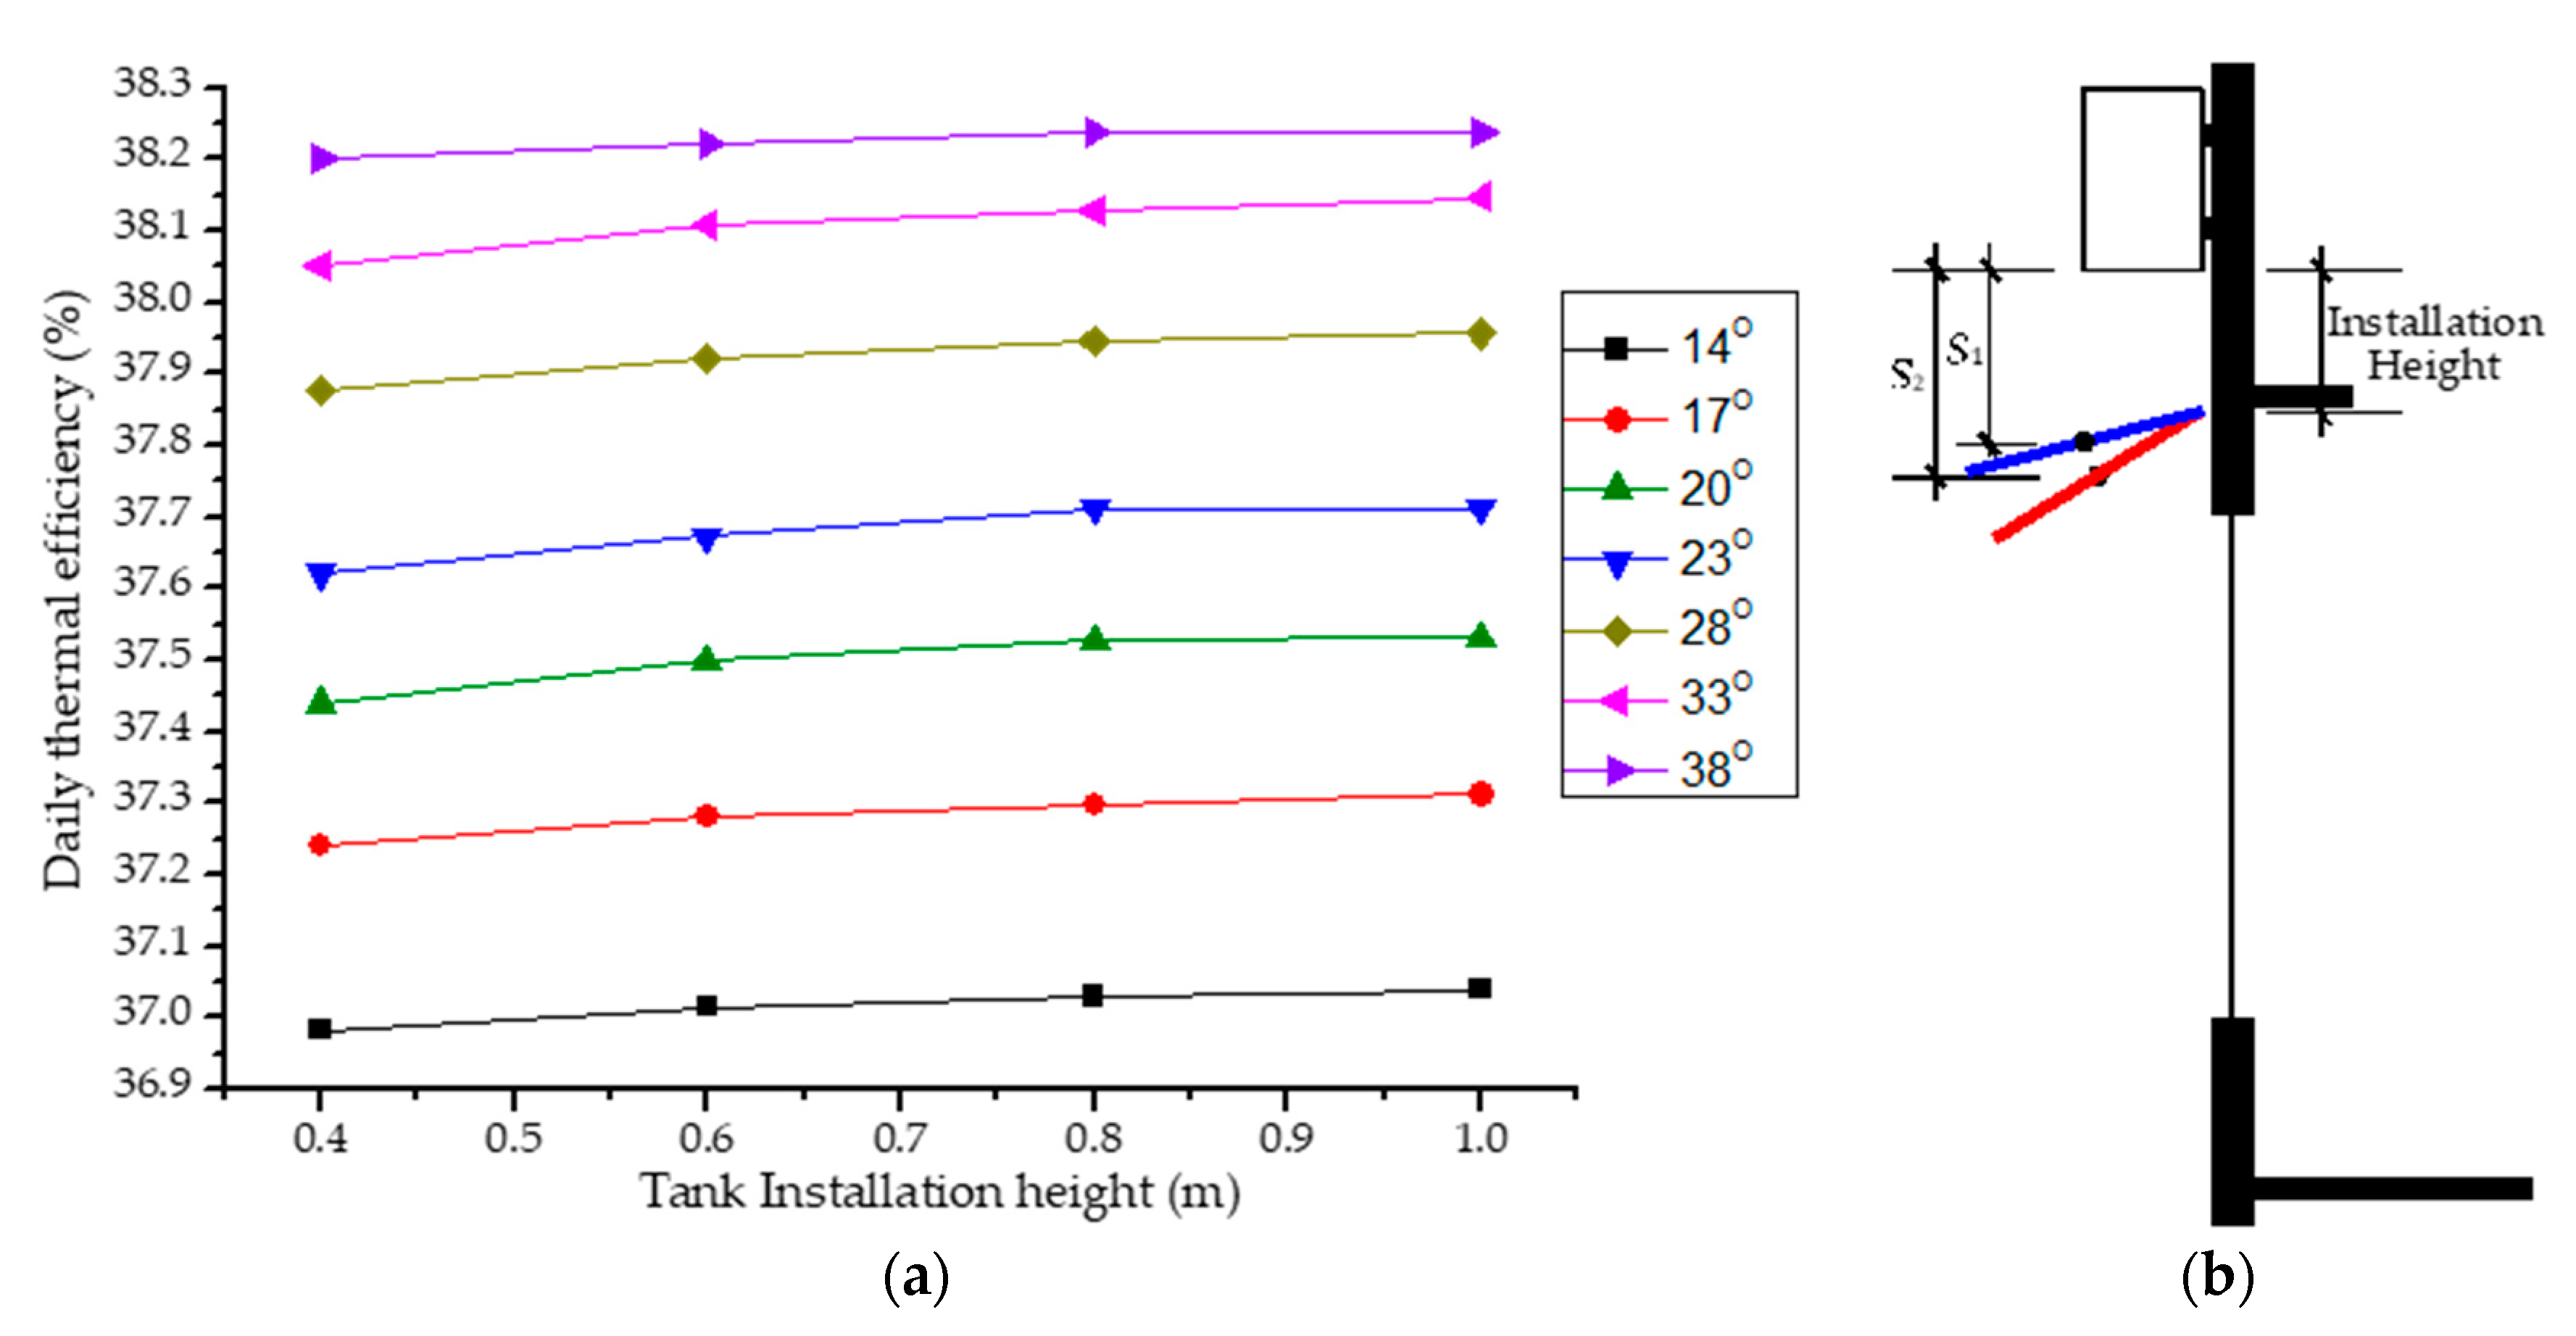
A typical meteorological day (11 January) in January, the coldest month of Guangzhou, is chosen from TMY weather data of Guangzhou for the evaluation of the influence of the tank installation height on thermal performance. The variations in daily thermal efficiency with the changes of tank installation height were computed for various panel tilt angles (14°~38°), and the results are showed in Figure 7a. In view of the limited space above the window for tank installation, the tank installation height ranges from 0.4 to 1.0 m.
As seen from Figure 7b, the vertical distance between the panel center and tank bottom increases with the increase of the tilt angle. Due to the increase of thermosyphon pressure, the daily thermal efficiency increases with the increase of the tilt angle when the tank installation height is constant. When the tilt angle is constant, the daily thermal efficiency increases considerably when the tank installation height increases from 0.4 to 0.6 m. This is because the increasing thermosyphon pressure resulting from the increase of tank installation height becomes a dominating factor which affects the thermal efficiency. When the tank installation height increases from 0.6 to 1.0 m, the thermal efficiency increases very slightly for the contribution of increasing thermosyphon pressure is, to a certain extent, offset by the increase of flow resistance and pipe heat losses. Considering that the position of the PV/T panel mounted above windows is rather high, it is suggested that the tank installation height is 0.6~0.8 m from the viewpoint of convenient maintenance.

4.2. Influence of Panel Tilt Angle on System Performances

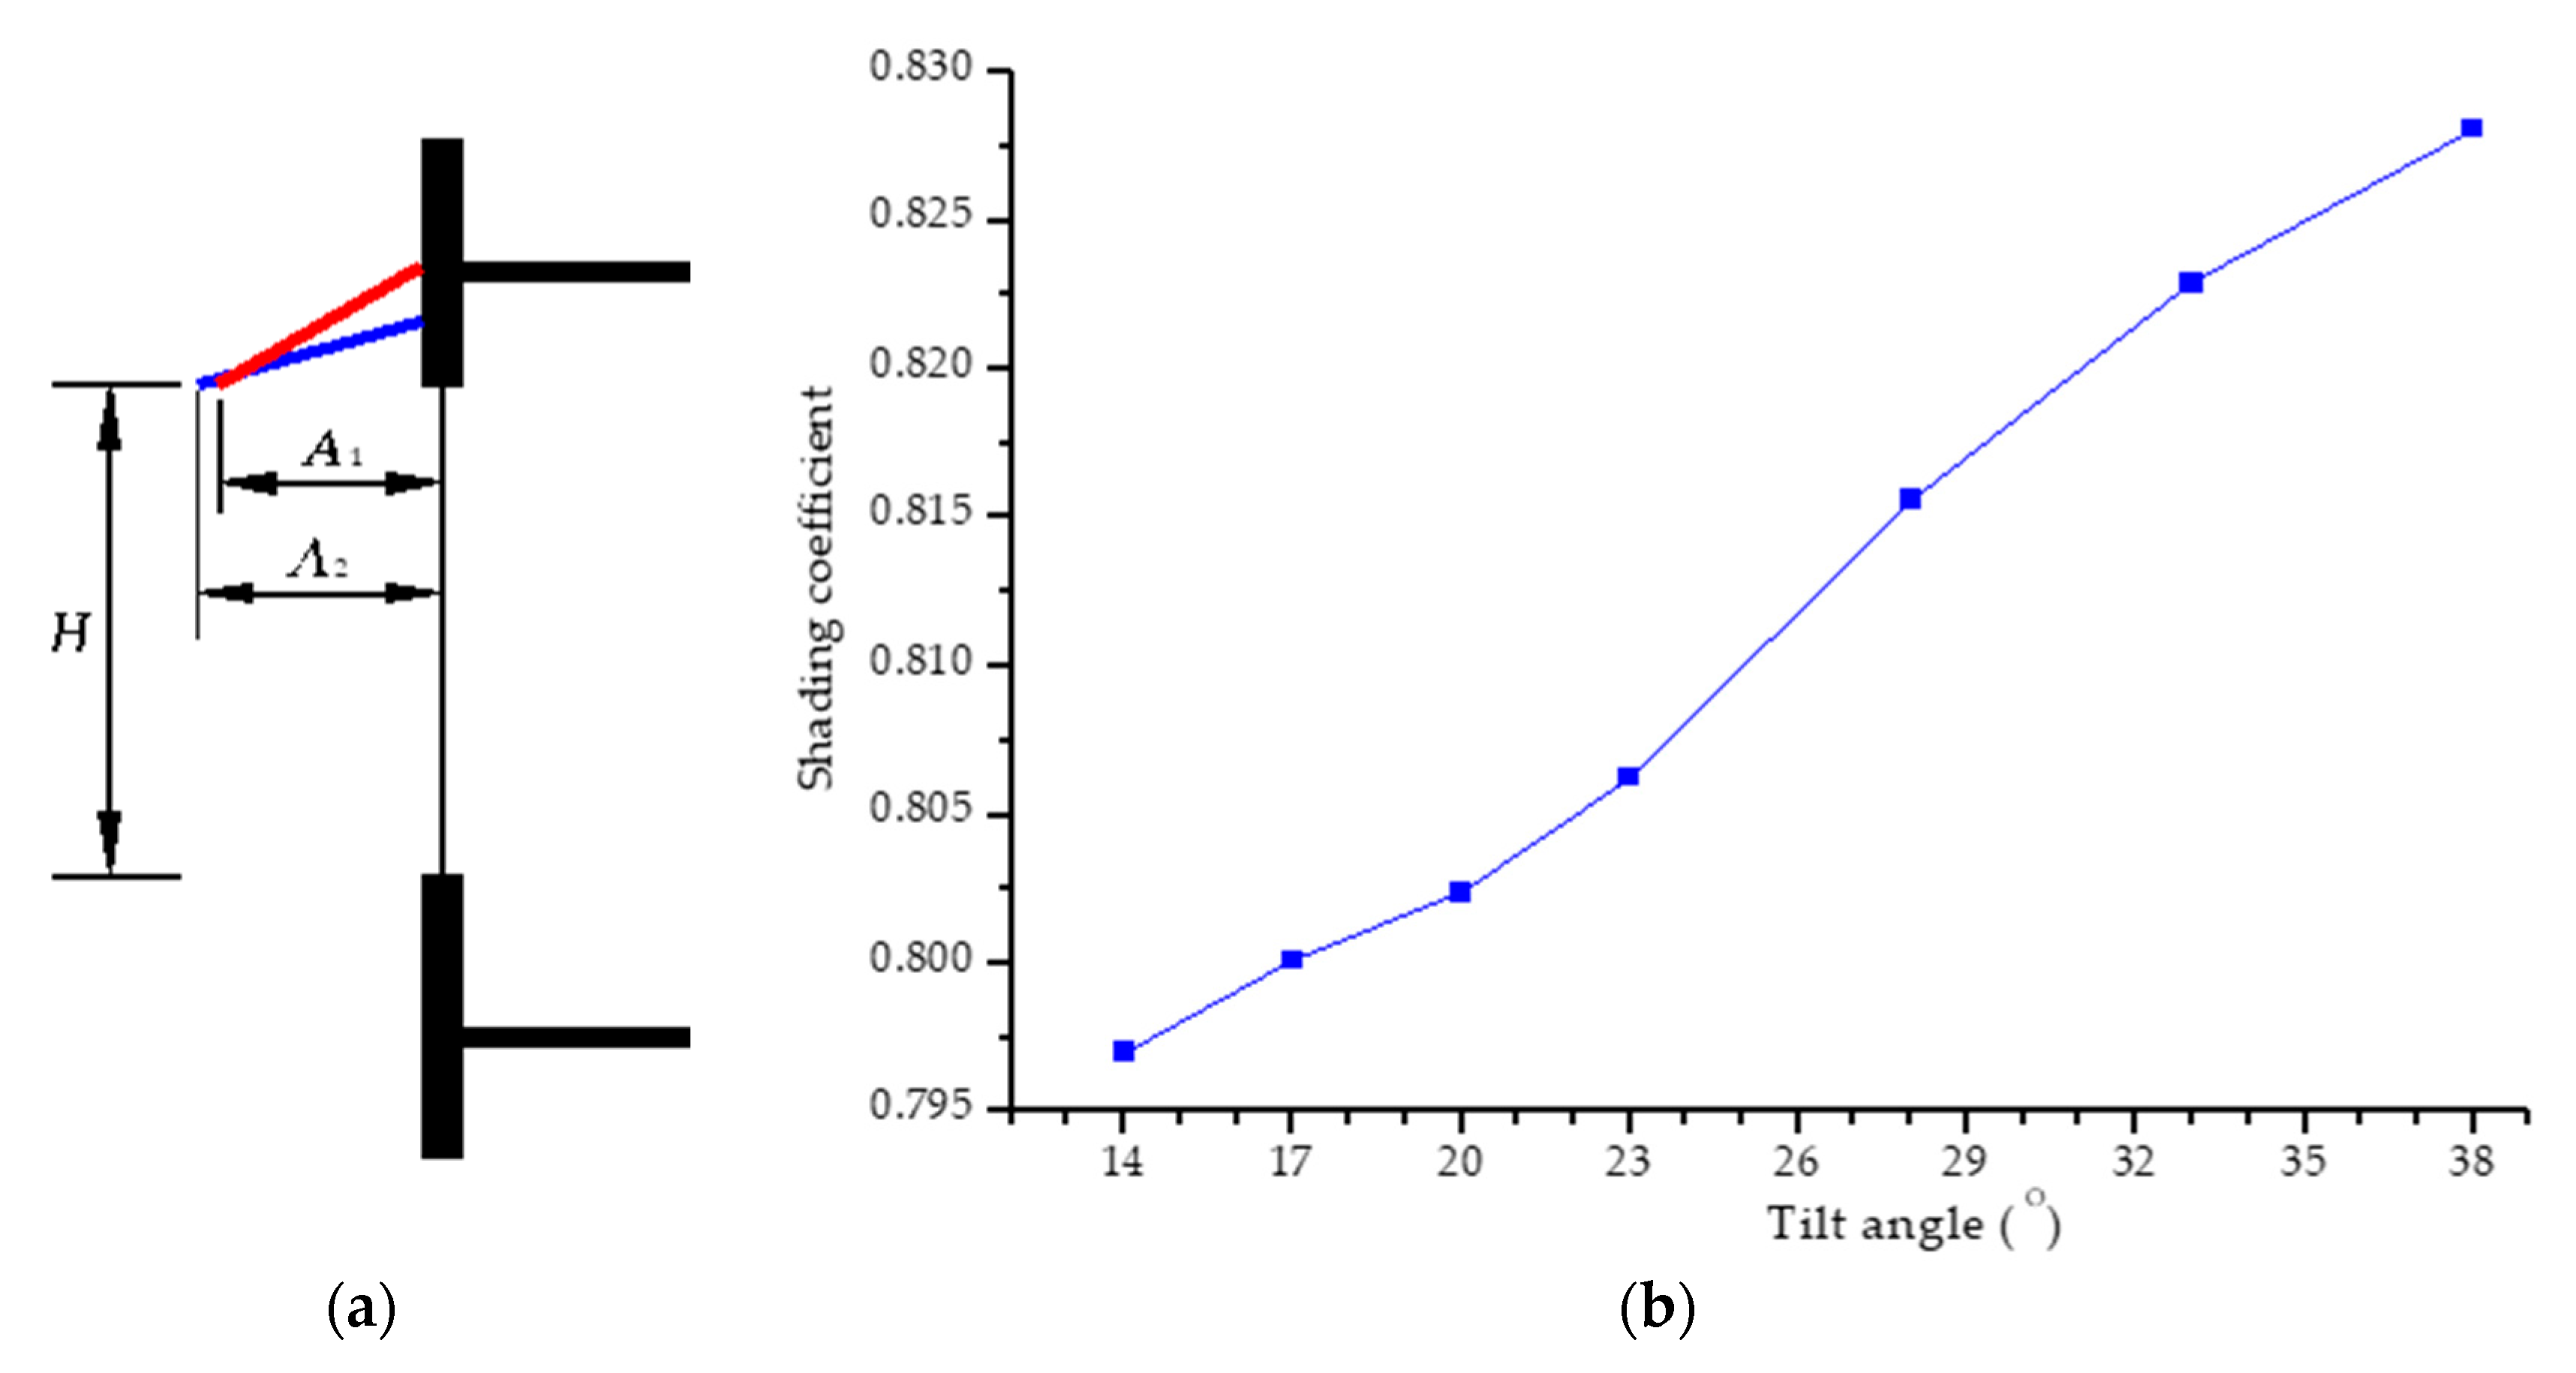
Based on the above analysis of the influence of tank installation height on thermal efficiency, the tank installation height is set as 0.7 m. As seen from Figure 8a, the bottom edge of the panel is in horizontal alignment with the upper edge of the window even though the tilt angle changes. Therefore, the values of A and H are respectively varied and unvaried. According to the latitude of Guangzhou, the range of panel tilt angle that helps to receive more solar radiation is set as 14° to 38°. The resulting changes in shading coefficient can be seen from Figure 8b. Overall, the shading coefficient ranges from 0.797 to 0.828 when the tilt angle varies from 14°to 38°, which means the reduction of total solar heat gains through window changes from 20.3% to 17.2% in a cooling season due to the exterior shading of the PV/T panel. The shading coefficient increases with the increase of tilt angle due to the decrease of overhanging length (A). From the angle of shading performance, the reduction of tilt angle helps to improve the shading performance of the PV/T panel.
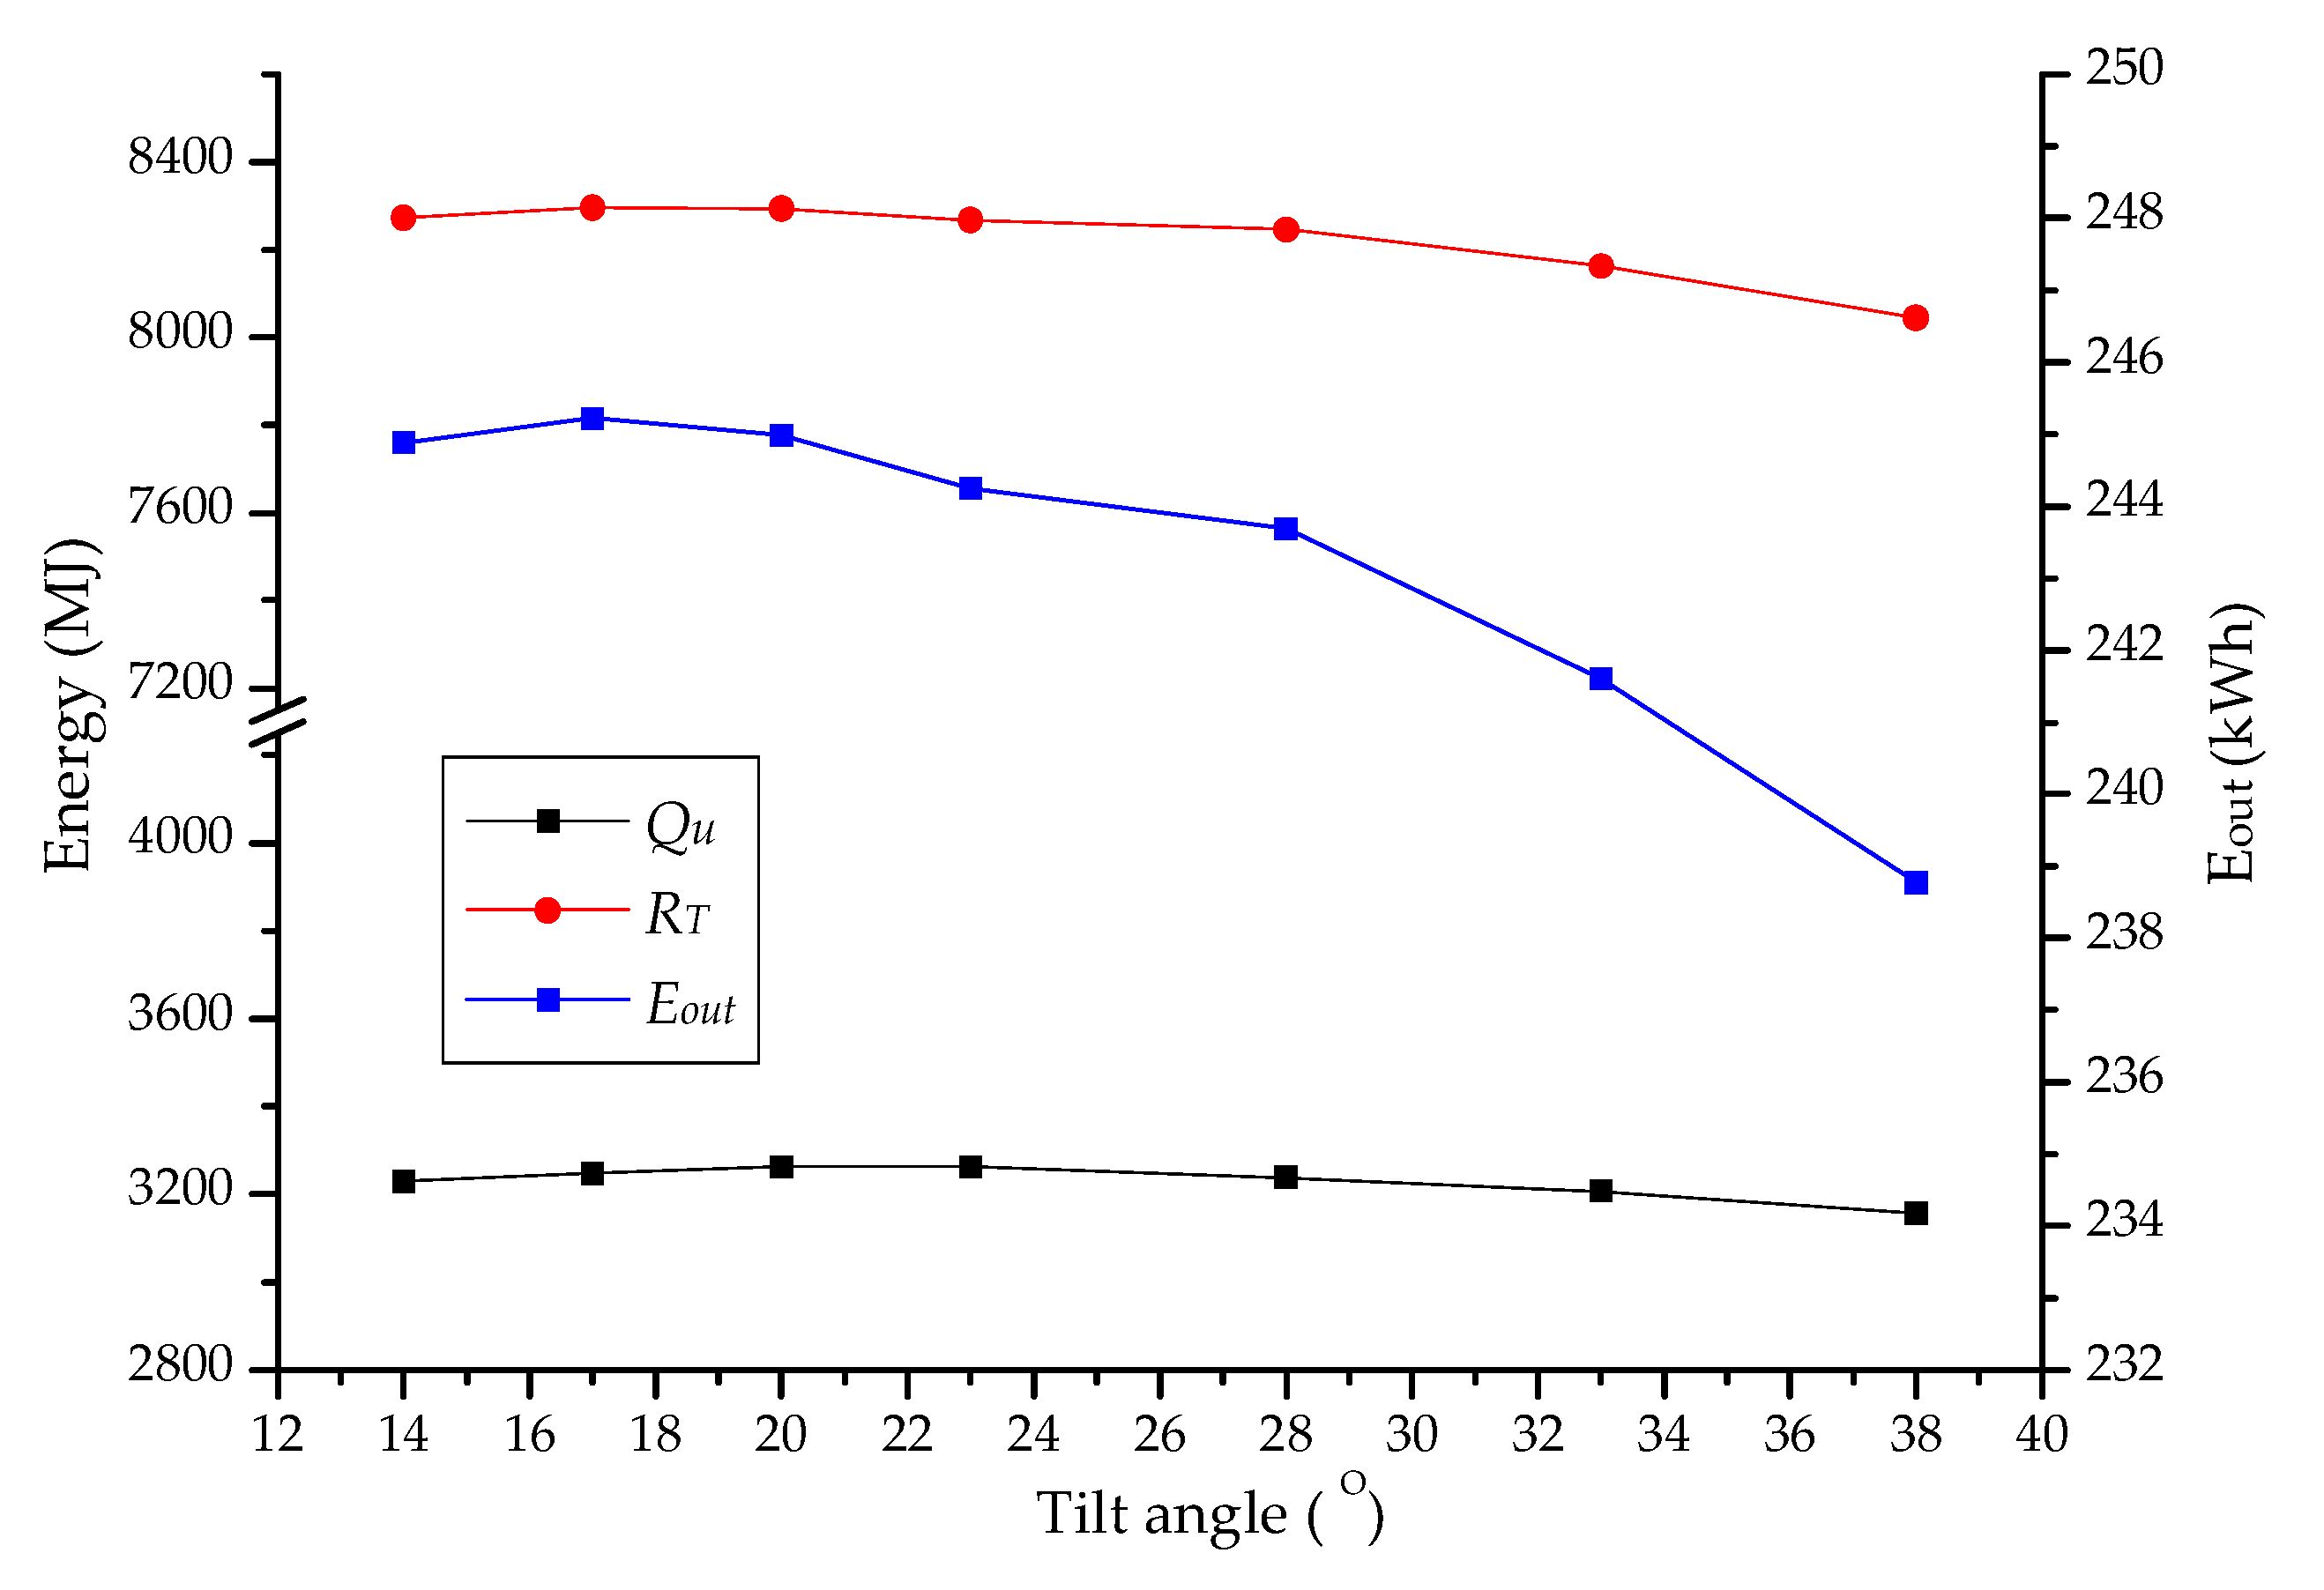
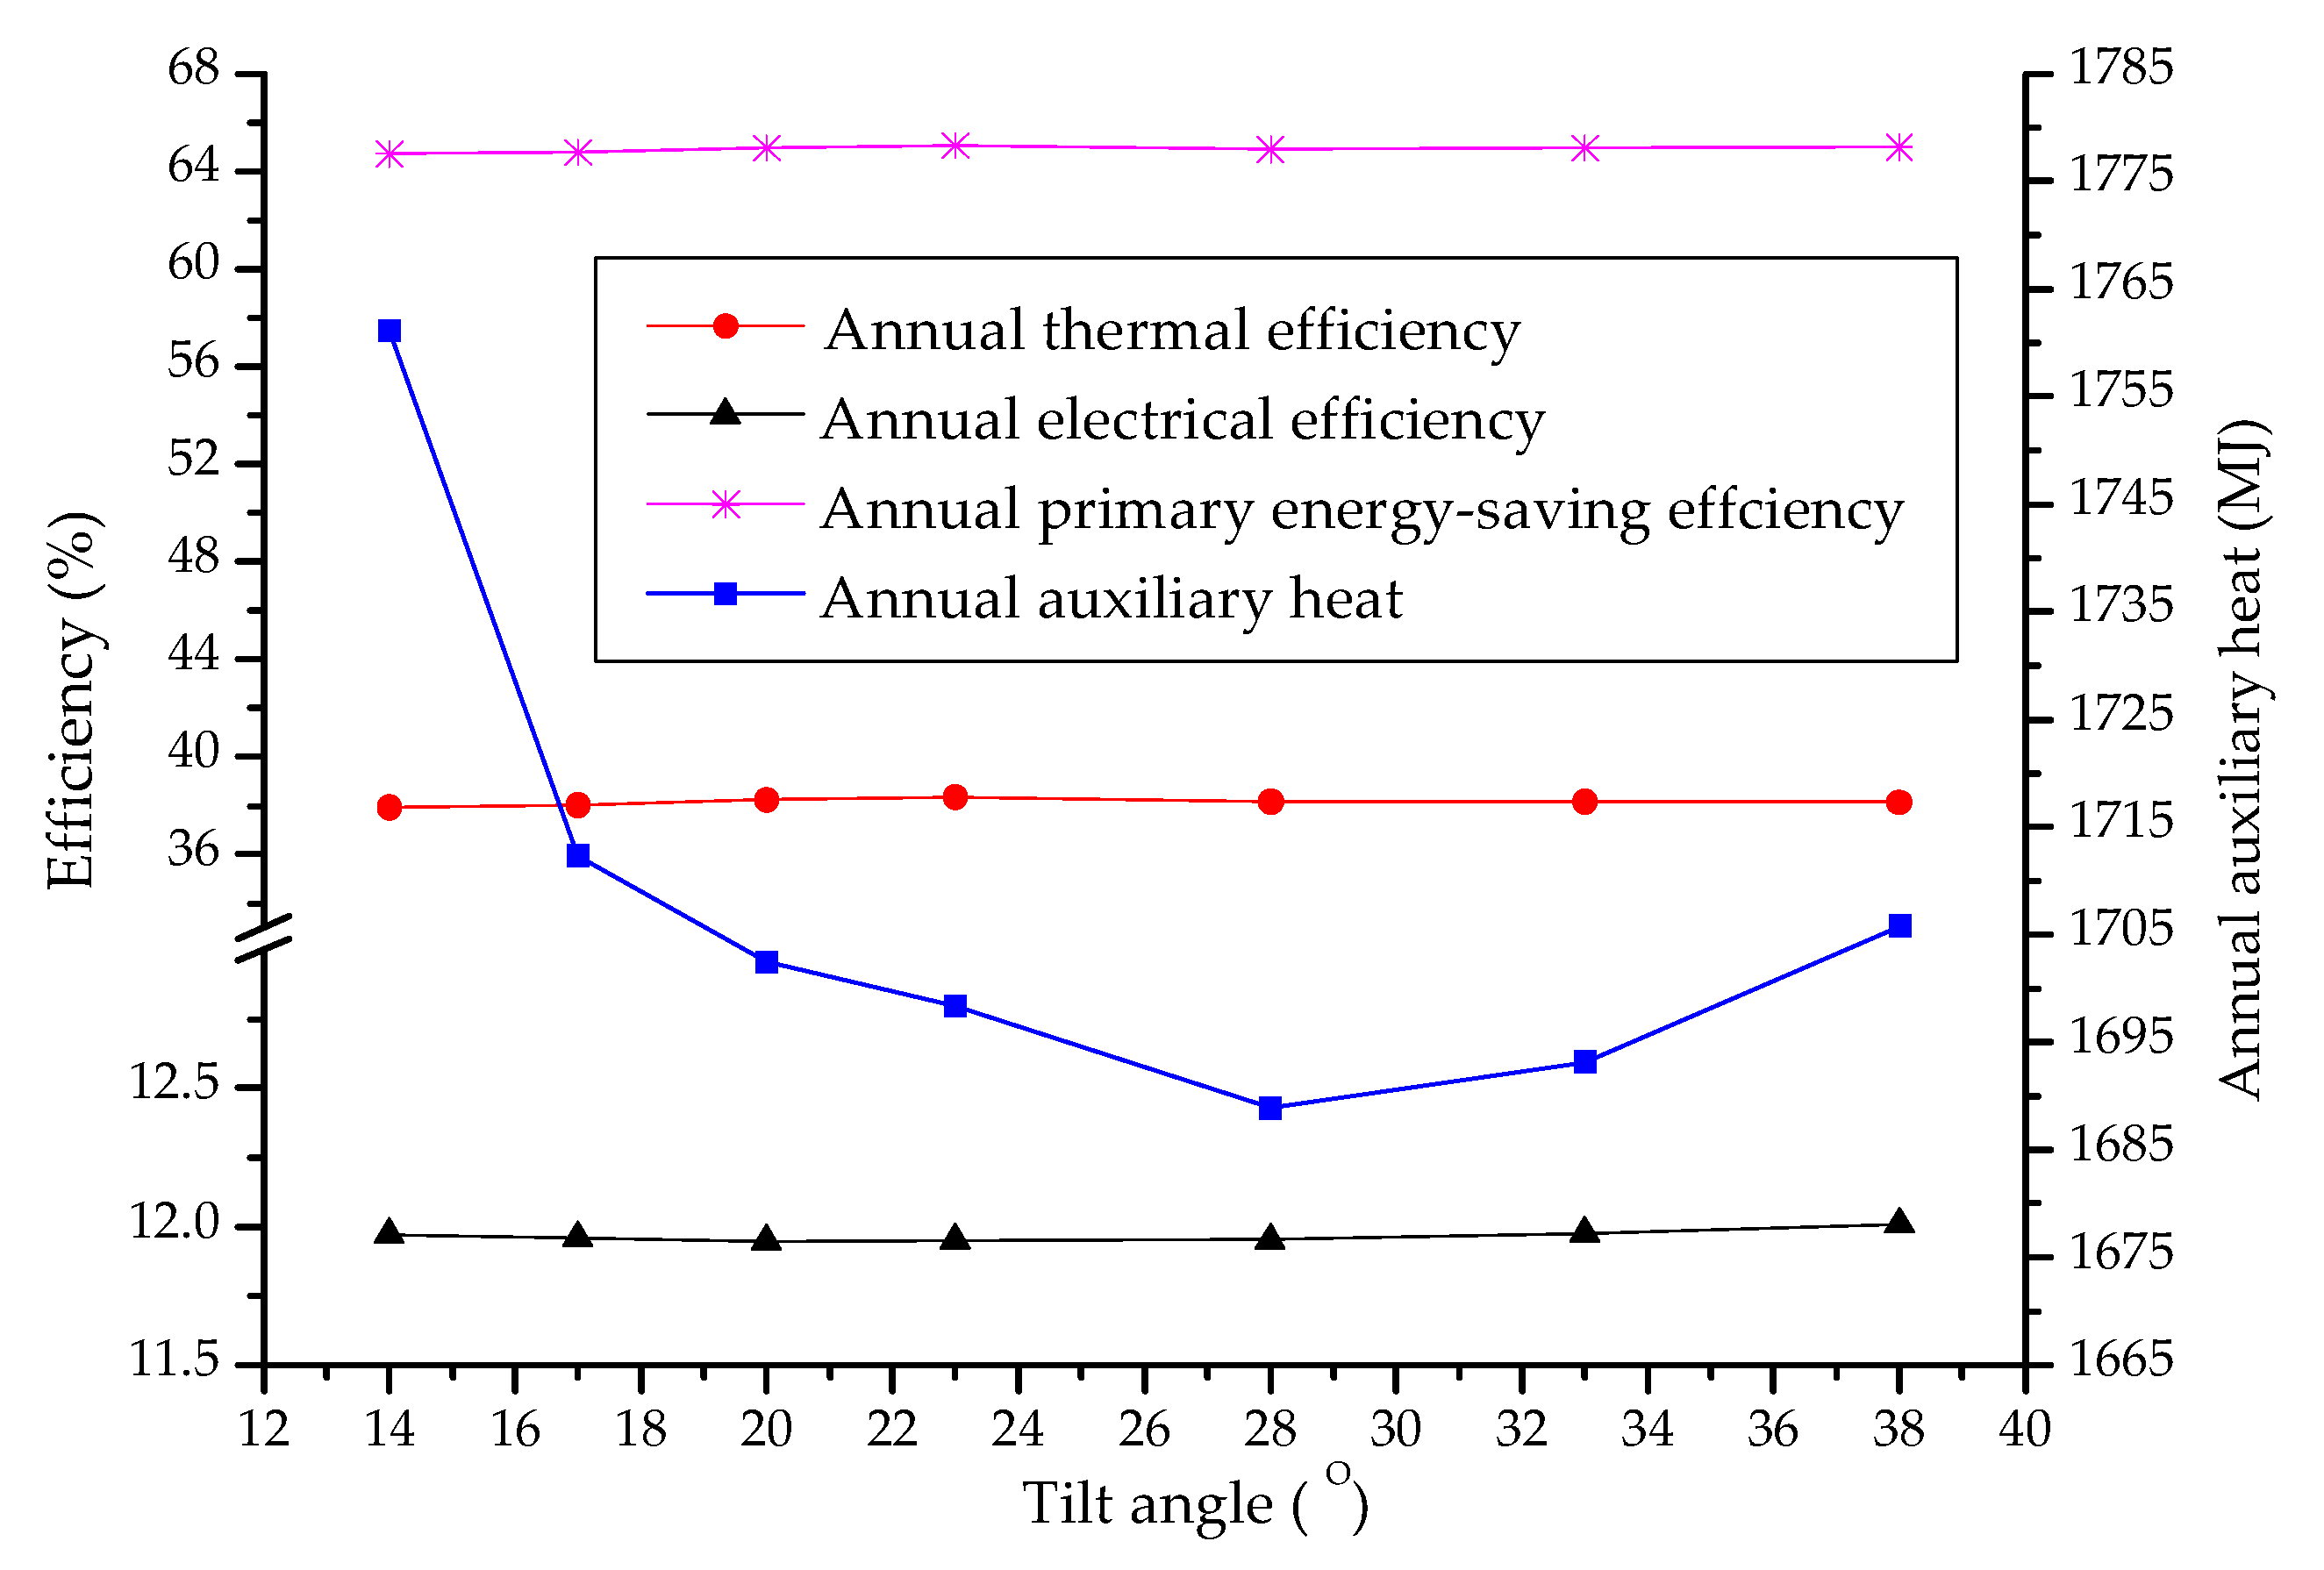
The thermal, electrical, and shading performances of the PV/T panel with various panel tilt angles were simulated. Figure 9 shows the annual useful thermal energy (Qu), annual total solar radiation on panel (RT), and annual electric energy output (Eout) with various tilt angles. Figure 10 shows the annual thermal efficiency (ηth), annual electrical efficiency (ηe), annual primary energy-saving efficiency (ηf), and annual auxiliary heat with various tilt angles. Although the annual total radiation on the panel reaches the maximum when the tilt angle ranges from 17° to 20°, the useful thermal energy from the panel and annual thermal efficiency reach the maximum when the tilt angle ranges from 20° to 23°. The annual electrical efficiency is not sensitive to the variation of the tilt angle, which is around 11.95%. The annual electric energy output reaches the maximum when the tilt angle equals 17° because the annual electric energy output mainly depends on the annual total radiation on the panel. The annual electric energy output changes slightly with the variation of the tilt angle and decreases by only 1.53 kWh when the tilt angle varies from 17° to 28°.
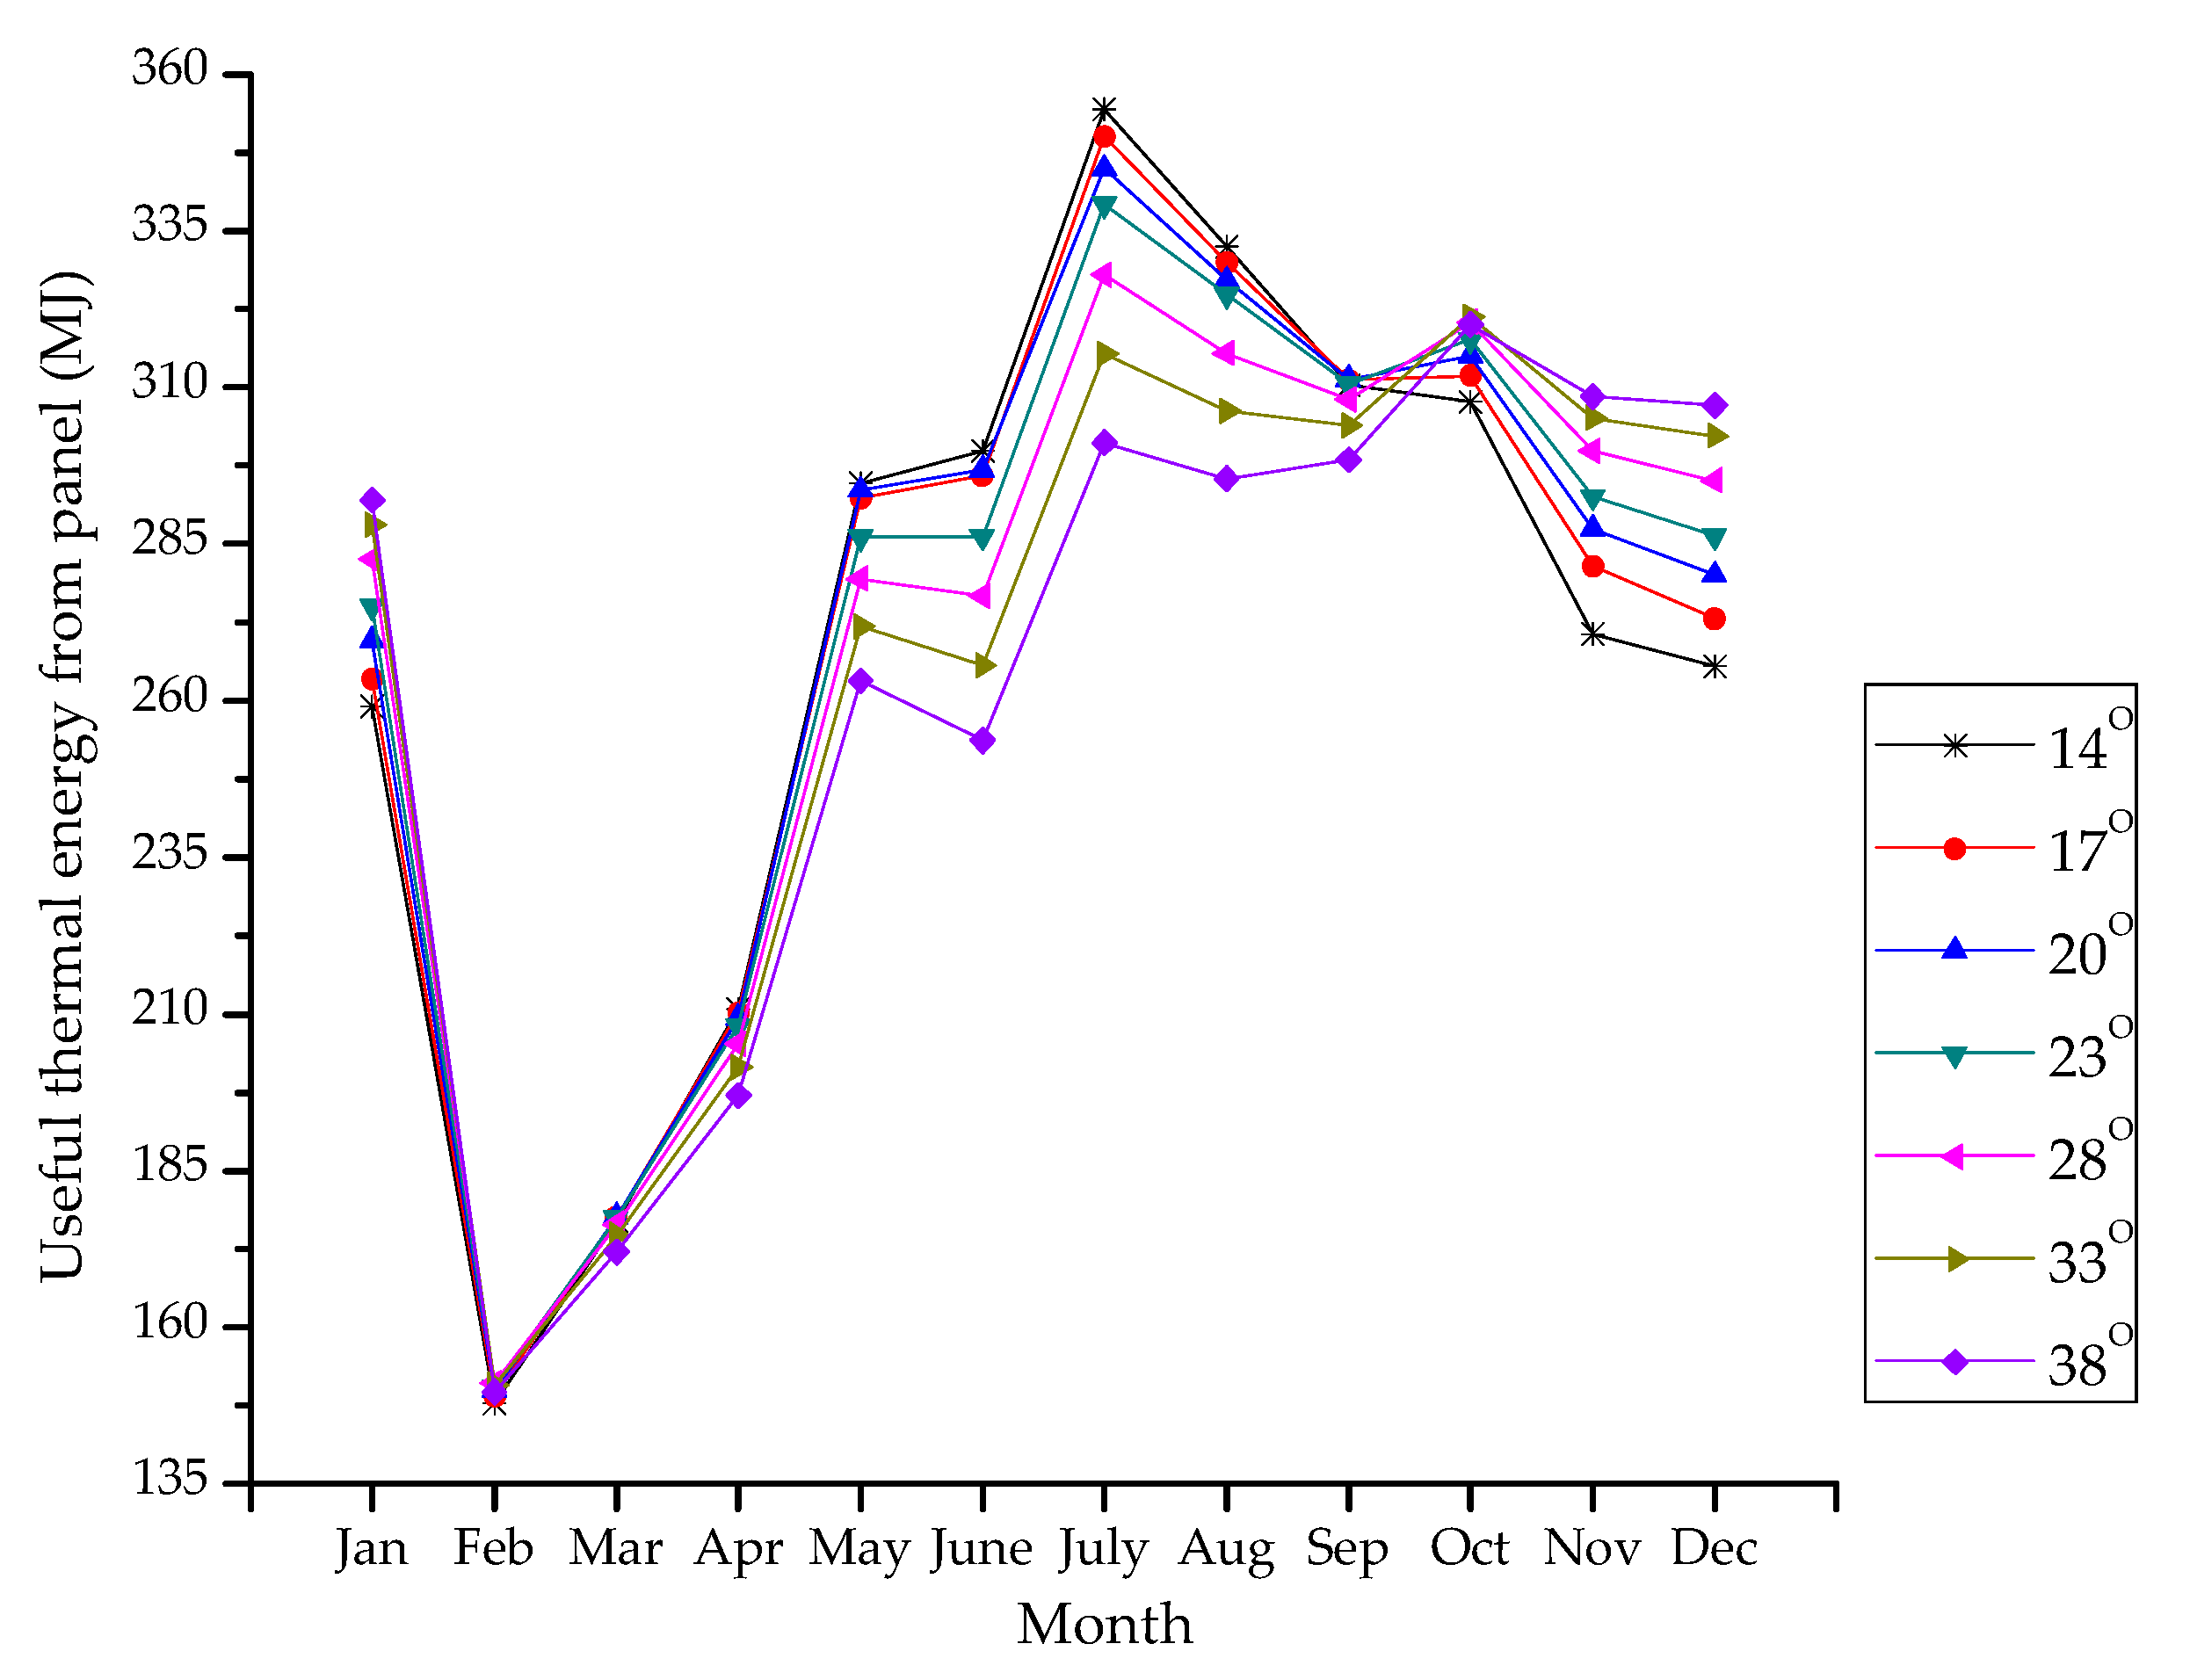
As a critical measurement index of solar energy utilization, the annual auxiliary heat reaches the minimum when the tilt angle equals 28°. This can be explained by the variation characteristics of monthly useful thermal energy from the panel shown in Figure 11. From May to September, the monthly useful thermal energy increases with the decrement of the tilt angle. However, the monthly useful thermal energy decreases with the decrement of the tilt angle from November to January. There are no distinct differences among the amounts of monthly useful thermal energy with various tilt angles in the other months. Such variation characteristics of monthly useful thermal energy cause the situation that the smaller tilt angle leads to more monthly useful thermal energy in summer (the daily useful thermal energy is even surplus in some summer days) and less monthly useful thermal energy in winter (from November to January). Thus, the system with the smaller tilt angle needs more auxiliary heat in winter. On the other hand, the larger tilt angle leads to more monthly useful thermal energy in winter and less monthly useful thermal energy in midsummer (July and August) and the transition season (May, June, and September). Therefore, the system with the larger tilt angle needs more auxiliary heat in May, June, and September. Taken together, there exists a medium tilt angle resulting in minimum annual auxiliary heat.
Comprehensively considering thermal, electrical, and shading performances, the suggested tilt angle is 20°~28°, which results in relatively lower auxiliary heat demand and relatively higher shading coefficient. The average thermal, electrical, and primary energy-saving efficiencies are respectively 38.25%, 11.95%, and 64.97% when the tilt angle ranges from 20° to 28°. A too small tilt angle will cause relatively much more auxiliary heat, although the shading performance can be improved. A too large tilt angle makes against not only thermal performance, but also shading performance.

5. Conclusions

A BIPV/T solar water heating system for exterior shading of residences is presented in this paper. The performance evaluation and optimization have been conducted through the simulations of an example system in Guangzhou. The following concluding remarks can be extracted from the case study:
(1)
In view of the offset effect of the increase of flow resistance and pipe heat losses resulting from the increase of tank installation height, the suggested tank installation height is 0.6~0.8 m.
(2)
The annual auxiliary heat reaches the minimum when the panel tilt angle equals 28°, while the annual electric energy output reaches the maximum when the panel tilt angle equals 17°. The annual electric energy output changes slightly with the variation of tilt angle. Nevertheless, the smaller tilt angle will cause better shading performance. Comprehensively considering thermal, electrical, and shading performances, it is suggested that the value of the tilt angle ranges from 20° to 28°. The average thermal, electrical, and primary energy-saving efficiencies were found to be, respectively, 38.25%, 11.95%, and 64.97% when the tilt angle ranges from 20° to 28°.
(3)
Considering that the influence of the tank installation height within the suggested range of 0.6 to 0.8 m on thermal performance is small, the optimization result for the tank installation height of 0.7 m has reference significance to other scenarios within the range of 0.6 to 0.8 m. Overall, the presented BIPV/T solar water heating system for exterior shading is suitable for residential application in the area that has a similar climate to that of Guangzhou.

Author Contributions

X.C. contributed to the conception of this study and the development of methodology. W.W. and D.L. performed the simulation works and data analyses. X.C. wrote the manuscript. C.Z. contributed to the modification of manuscript. All authors have read and approved the final manuscript.

Funding

This research received no external funding.

Acknowledgments

This work was financially supported by Scientific Research Fund of Hunan Provincial Education Department (No. 17A047), Hunan Provincial Natural Science Foundation of China (No. 2018JJ2081) and Construct Program of Applied Specialty Disciplines in Hunan Province (Hunan Institute of Engineering).

Conflicts of Interest

The authors declare no conflict of interest.

References

  1. National Energy Administration of P.R. China. China is Leading the Development of Global Renewable Energy. Available online: http://www.nea.gov.cn/2019-08/21/c_138326148.htm (accessed on 17 October 2019).
  2. Skoplaki, E.; Palyvos, J.A. On the temperature dependence of photovoltaic module electrical performance: A review of efficiency/power correlations. Sol. Energy 2009, 83, 614–624. [Google Scholar] [CrossRef]
  3. Henemann, A. BIPV: Built-in solar energy. Renew. Energy Focus 2008, 9, 14–19. [Google Scholar] [CrossRef]
  4. Yoo, S.H.; Manz, H. Available remodeling simulation for a BIPV as a shading device. Sol. Energy Mater. Sol. Cells 2011, 95, 394–397. [Google Scholar] [CrossRef]
  5. Asfour, O.S. Solar and shading potential of different configurations of building integrated photovoltaics used as shading devices considering hot climatic conditions. Sustainability 2018, 10, 4373. [Google Scholar] [CrossRef] [Green Version]
  6. Lee, H.M.; Kim, S.C.; Lee, C.S.; Yoon, J.H. Power Performance Loss Factor Analysis of the a-Si BIPV Window System Based on the Measured Data of the BIPV Test Facility. Appl. Sci. 2018, 8, 1645. [Google Scholar] [CrossRef] [Green Version]
  7. Candanedo, J.A.; Athienitis, A. Simulation of the performance of a BIPV/T system coupled to a heat pump in a residential heating application. In Proceedings of the 9th International IEA Heat Pump Conference, Zürich, Switzerland, 20–22 May 2008. [Google Scholar]
  8. Chen, Y.X.; Athienitis, A.K.; Galal, K. Modeling, design and thermal performance of a BIPV/T system thermally coupled with a ventilated concrete slab in a low energy solar house: Part 1, BIPV/T system and house energy concept. Sol. Energy 2010, 84, 1892–1907. [Google Scholar] [CrossRef]
  9. Yang, T.T.; Athienitis, A.K. Experimental investigation of a two-inlet air-based building integrated photovoltaic/thermal (BIPV/T) system. Appl. Energy 2015, 159, 70–79. [Google Scholar] [CrossRef]
  10. Yang, T.T.; Athienitis, A.K. A review of research and developments of building-integrated photovoltaic/thermal (BIPV/T) systems. Renew. Sustain. Energy Rev. 2016, 66, 886–912. [Google Scholar] [CrossRef]
  11. Corbin, C.D.; Zhai, Z.Q.J. Experimental and numerical investigation on thermal and electrical performance of a building integrated photovoltaic-thermal collector system. Energy Build. 2010, 42, 76–82. [Google Scholar] [CrossRef]
  12. Davidsson, H.; Perers, B.; Karlsson, B. System analysis of a multifunctional PV/T hybrid solar window. Sol. Energy 2012, 86, 903–910. [Google Scholar] [CrossRef]
  13. Buker, M.S.; Mempouo, B.; Riffat, S.B. Performance evaluation and techno-economic analysis of a novel building integrated PV/T roof collector: An experimental validation. Energy Build. 2014, 76, 164–175. [Google Scholar] [CrossRef]
  14. Mehdipour, C.; Mohammadi, F. Design and analysis of a stand-alone photovoltaic system for footbridge lighting. J. Sol. Energy Res. 2019, 4, 85–91. [Google Scholar]
  15. Mohammadi, F. Design, analysis, and electrification of a solar-powered electric vehicle. J. Sol. Energy Res. 2018, 3, 293–299. [Google Scholar]
  16. Fudholi, A.; Sopian, K.; Yazdi, M.H.; Ruslan, M.H.; Ibrahim, A.; Kazem, H.A. Performance analysis of photovoltaic thermal (PVT) water collectors. Energy Convers. Manag. 2014, 78, 641–651. [Google Scholar] [CrossRef]
  17. Ji, J.; Guo, C.; Sun, W.; He, W.; Wang, Y.; Li, G. Experimental investigation of tri-functional photovoltaic/thermal solar collector. Energy Convers. Manag. 2014, 88, 650–656. [Google Scholar] [CrossRef]
  18. Long, E.S.; Chen, J.H. Are the annual relative variation rates of energy consumption approximate in different cities with the same shading coefficient? Build. Environ. 2005, 40, 507–515. [Google Scholar]
  19. DesignBuilder Simulation and CFD Training Guide; DesignBuilder Software Ltd.: Stroud, UK, 2009.
  20. TRNSYS 17: A Transient Simulation and Program; Solar Energy Laboratory, University of Wisconsin-Madison, 2010. Available online: http://web.mit.edu/parmstr/Public/TRNSYS/04-MathematicalReference.pdf (accessed on 28 October 2019).
  21. Chow, T.T.; He, W.; Ji, J. Hybrid photovoltaic-thermosyphon water heating system for residential application. Sol. Energy 2006, 80, 298–306. [Google Scholar] [CrossRef]
  22. Chow, T.T.; He, W.; Ji, J.; Chan, A.L.S. Performance evaluation of photovoltaic—Thermosyphon system for subtropical climate application. Sol. Energy 2007, 81, 123–130. [Google Scholar] [CrossRef]
  23. ASHRAE Guideline 14-2014. Measurement of Energy, Demand, and Water Savings; American Society of Heating, Refrigerating and Air-Conditioning Engineers: Atlanta, GA, USA, 2014. [Google Scholar]
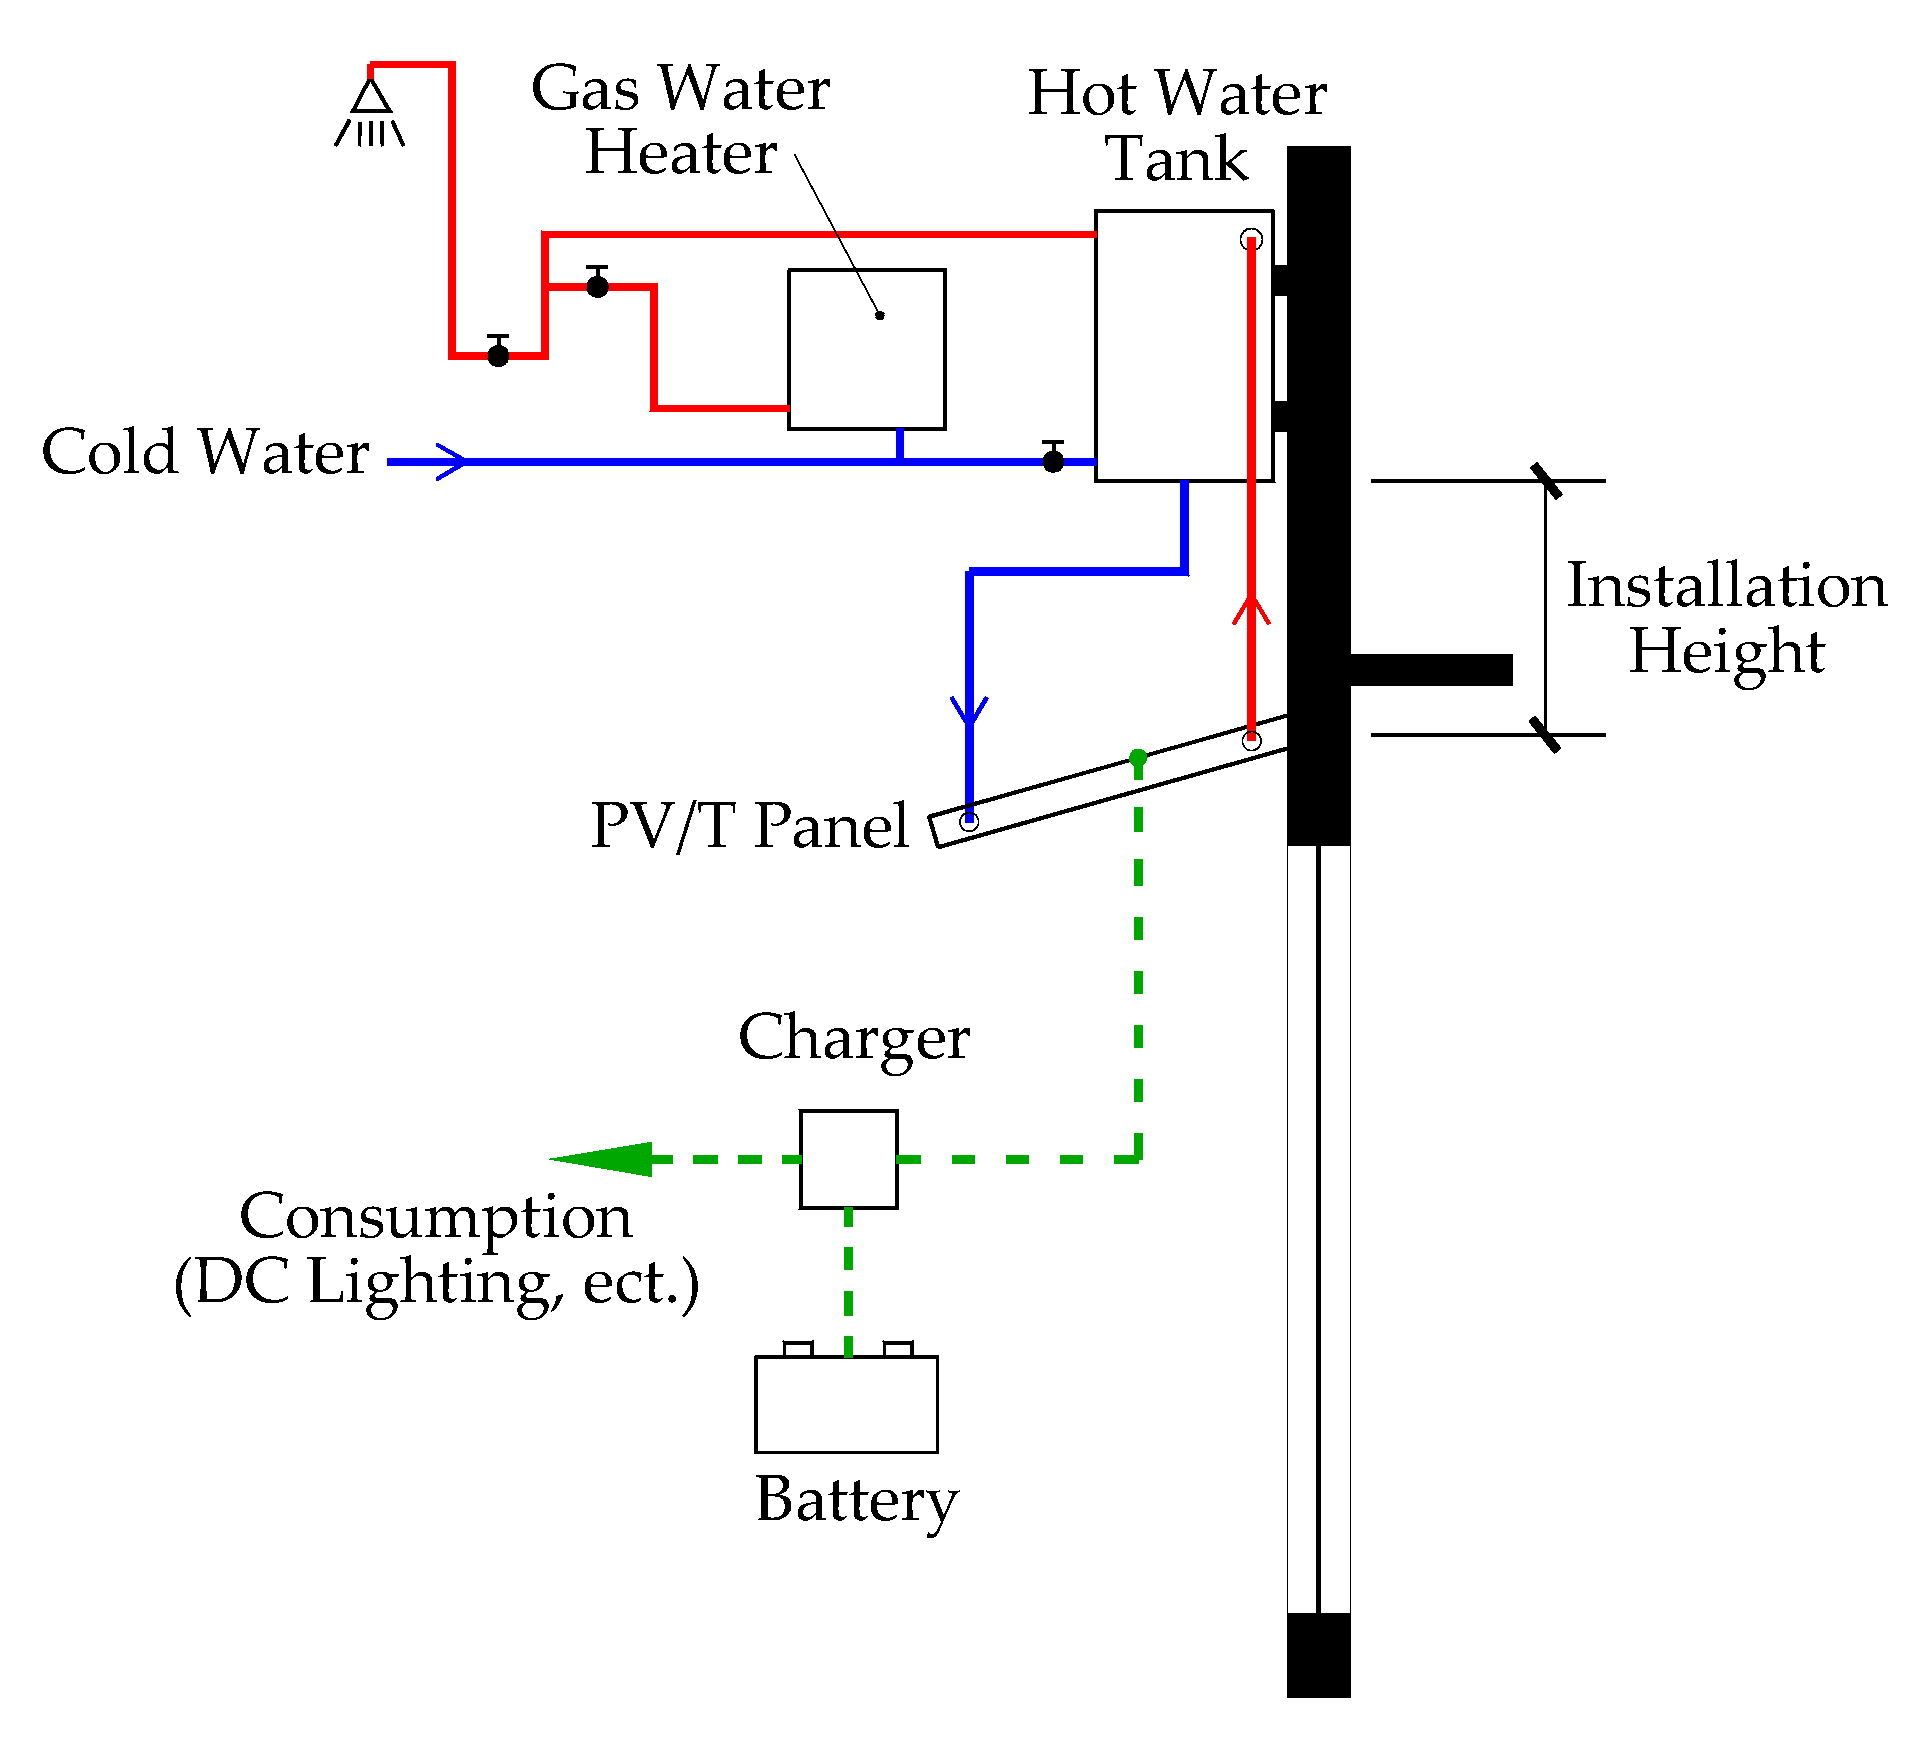
Figure 1. Schematic of a BIPV/T solar water heating system for exterior shading.
Applsci 09 05395 g001
Figure 2. Schematic of a PV/T panel used as horizontal sunshade.
Applsci 09 05395 g002
Figure 3. Cross-section and structure of water-based PV/T collector.
Applsci 09 05395 g003
Figure 4. Data flow diagram in TRNSYS component representation.
Applsci 09 05395 g004
Figure 5. Monthly average cold water temperatures in Guangzhou.
Applsci 09 05395 g005
Figure 6. The monthly thermal efficiencies of Chow et al.’s work [22] and this work.
Applsci 09 05395 g006
Figure 7. (a) Daily thermal efficiencies with various tank installation heights and panel tilt angles; (b) illustration for the variation of the vertical distance between the panel center and tank bottom.
Applsci 09 05395 g007
Figure 8. (a) Illustration for the variation of overhanging length; (b) shading coefficient vs. panel tilt angle.
Applsci 09 05395 g008
Figure 9. Annual useful thermal energy from panel (Qu), annual total radiation on panel (RT), and annual electric energy output (Eout) with various panel tilt angles.
Applsci 09 05395 g009
Figure 10. Annual thermal efficiency, annual electrical efficiency, annual primary energy-saving efficiency, and annual auxiliary heat with various panel tilt angles.
Applsci 09 05395 g010
Figure 11. Monthly useful thermal energy with various panel tilt angles.
Applsci 09 05395 g011
Table 1. Parameters of the window and PV/T panel.
Latitude and Longitude of Guangzhou23°08′ N, 113°20′ E
Window height (mm)1800
Window width (mm)1600
Embedded depth of windowpane (mm)200
Tilt angle of panel (°)28
Panel width (mm)646
Panel length (mm)2648
Gross area of panel (m2)1.71
Table 2. Main parameters for the TRNSYS simulations.
Net Collector Area (m2)1.60
Intercept efficiency of the collector (%)56.6
Efficiency slope the collector [kJ/(h·m2·K)]21.88
Heat loss coefficient of PV/T panel [kJ/(h·m2·K)]34.52
Tank height (m)0.96
Pipe loss coefficient (kJ/(h·m2·K))3.42
Overall loss coefficient of storage tank (kJ/(h·K))4.97
Collector fin efficiency factor0.1454
Collector plate absorptance0.95
Cover transmittance0.94
Temperature coefficient of solar cell efficiency (1/K)0.0045