1. Introduction
Management is a very important factor for business success and is defined as the process of measuring and analyzing what happened in order to make decisions/actions. For this, tools are needed that help to know, understand, and orient the actions towards the foreseen objectives. That is to say, to manage is to pilot the company and align all the resources and actions towards the strategy marked by the direction [
1].
The management of risks in operations and supply chains (SCs) has emerged as one of the main research topics in the recent operations and supply chain management (SCM) literature [
2,
3,
4]. SCs are increasingly prone to complexity and uncertainty. Factors such as reduction of supply base, globalization, shortened product life cycles, and capacity limitation of key components increase SC risks [
5].
According to Moeinzadeh and Hajfathaliha [
6], supply chain risk management (SCRM) can be viewed as a strategic management activity in firms. Organizational efficiency and performance are enhanced when a strategy to reduce uncertainty takes into account ‘‘context’’ and ‘‘environmental realities’’. In the case of SCRM, context refers to the sources of risk, magnitude of risk and its relationship to business objectives, and threat of disruption in SCs. Environmental realities include the degree of exposure to adverse events, scope of extended SCs, supplier management practices, etc. Therefore, the essence of SCRM is to make decisions that optimally align organizational processes and decisions to exploit opportunities while simultaneously minimizing risk [
6].
The definition of the term “risk” strongly depends on the context and field of research involved. Many authors have defined risk in SC context [
7,
8,
9,
10,
11,
12,
13]. In all definitions, there are two recurring elements: uncertainty and impacts. However, there are other factors that must be considered in terms of events including: What drives/causes the risk; where the risk is; and what the risk is associated with. Moreover, it is worth highlighting two aspects connected to the SCRM: (1) Risk exists at various levels, inside the company and at the network level; (2) risk evaluation is inherently subjective, because each analyst has his or her own concept of what constitutes a risk and the nature of the upstream and downstream relationships.
According to Aqlan and Mustafa [
14], to manage SC risks, the risk can be considered in the form of an event so that it can be modelled, analyzed, mitigated, and monitored. Risk event is caused by a set of risk factors or agents that can lead to different impacts. These events are often interconnected, leading to the exacerbation of some risks when implementing mitigation strategies for other risks. Many risk management (RM) plans may fail because they do not consider interconnections among risks and are not comprehensive [
15]. Several literature reviews [
9,
16,
17] reveal the existing SCRM processes/frameworks have limited focus on the interdependency modelling of risks. According to Ho et al. [
16]: “Investigating the joint impact of such risks can lead to better management of supply chains than treating each risk type in isolation….there is lack of research measuring the correlations between risk factors and corresponding risk types, or the probability of occurrence of particular types associated with their factors’’ [
6] (p. 5060).
Aqlan and Lam [
15] and Lee et al. [
18] consider that modelling approaches for SC risks can be divided into: (1) Qualitative models, (2) quantitative models, and (3) hybrid models that incorporate qualitative and quantitative techniques. Qualitative techniques are mostly used for risk identification and risk analysis steps. According to Ho et al. [
16], failure mode and effects analysis (FMEA) is one of the most widespread methods for risk analysis; however, it presents limitations in the calculation of the risk priority number (RPN), as have been discussed in several investigations [
19,
20,
21,
22,
23]. Some of these limitations include:
Different combinations of probability and severity of consequences may produce exactly the same value of RPN, but their hidden risk implications may be totally different.
Interdependencies among various failure modes and effects are not taken into account.
The relative importance of risk factors is not taken into consideration.
The risk factors are difficult to be precisely evaluated.
In turn, due to the highly subjective nature and the lack of information, it is usually difficult to precisely measure risk parameters. A reasonable and suitable way to express these parameters is to use qualitative linguistic variables, particularly during experts’ judgments to estimate the occurrence likelihood (for example: very low, low, medium, high, and very high) and to assess the consequence severity (variables as slight, minor, moderate, critical, and catastrophic). In that sense, some studies have focused on improving the methods by reducing the uncertainty and subjectivity in information utilizing fuzzy sets, evidence theory, Bayesian approach, and other techniques. This has been one of the main drivers for developing hybrid models. Fuzzy theory has proven to be effective and efficient in handling these types of uncertainties [
14,
22,
24,
25,
26,
27].
Several RM frameworks are presented in the literature and a consensus exist that the main stages of SCRM involve four sequential stages: risk identification, risk assessment, risk treatment, and risk monitoring [
4,
15,
28]. According to Fahimnia et al. [
29], even though several studies in the SC literature have discussed RM, a limited number of studies discussed the entire management cycle of risks. Most of the studied researches are limited to some (mostly two) processes in the SCRM cycle, such as risk identification and assessment [
30], risk assessment and mitigation [
31], and risk identification and mitigation [
32,
33].
According to Ho et al. [
16], the risk monitoring process has received less attention than the other processes. It is important to develop an early alert monitoring system with adaptive risk indicators for different SC types. Hence, more attention should be given to pre-SCRM and post-SCRM [
16]. However, only a few number of research studies [
34,
35] consider in their approaches a previous analysis of SC. For example, Gaudenzi and Borghesi [
36] considered the relationship of risks with the strategic objectives of the organization, but did not include the possibility of prior process improvement. The main limitations of previous studies are (1) focus on limited stages of the RM process, and (2) ignoring SC process analysis and their alignment with strategic management as a holistic system. Gaudenzi and Borghesi [
36] and Pujawan and Geraldin [
21] suggest that SCRM can be considered as a process that supports the achievement of SC management strategic objectives. In addition, Garvey et al. [
7] and Qazi et al. [
28] affirm that many existing measurement models only result in local optimally and underestimate the effects of triggering risks due to the causal structure within the supply network. In the reviewed literature, several researches discuss the importance of investigating the joint impact of risk events [
7,
16,
17,
37].
In relation to the above, Qazi et al. [
27] revealed: “Although a number of quantitative tools and techniques have already been developed for managing supply chain risks, there is a limited focus on introducing holistic frameworks that not only integrate all stages of the risk management process but also capture the cascading effects of common risk triggers. Also, existing frameworks generally focus on optimising a single objective (performance measure) without exclusively modelling the trade-off between conflicting and interdependent objectives” [
27] (p. 37). In that sense, an integrated analysis leads to effective mitigation strategies and the integration with the strategy of the organization is extremely important. This highlights the need to reinforce SCRM by considering the assessment and management of the entire cycle of SCRM linked to strategic management (multiple objectives) as well as the aggregation of risk impacts and epistemic uncertainty in order to obtain a more accurate risk assessment. To responding to these research needs, the following research goals will be addressed in this study:
To assess SC risk level by considering the impact on multiple performance objectives and interrelationships between risk events.
To develop a mathematical model to assess the risk score by considering the vague and imprecise nature of experts’ judgements with different domains and scales according to knowledge and nature of criteria.
To integrate SCRM into business decision making through a holistic framework that considers RM stages and process relations.
This research develops a framework for proactive SCRM by integrating all RM stages with risk modelling and aggregation. This system captures the interdependence of risks in the strategic management at all levels of the SC deployment. To show the viability of proposed approach, we present a case of study in a telecommunication company.
2. Materials and Methods
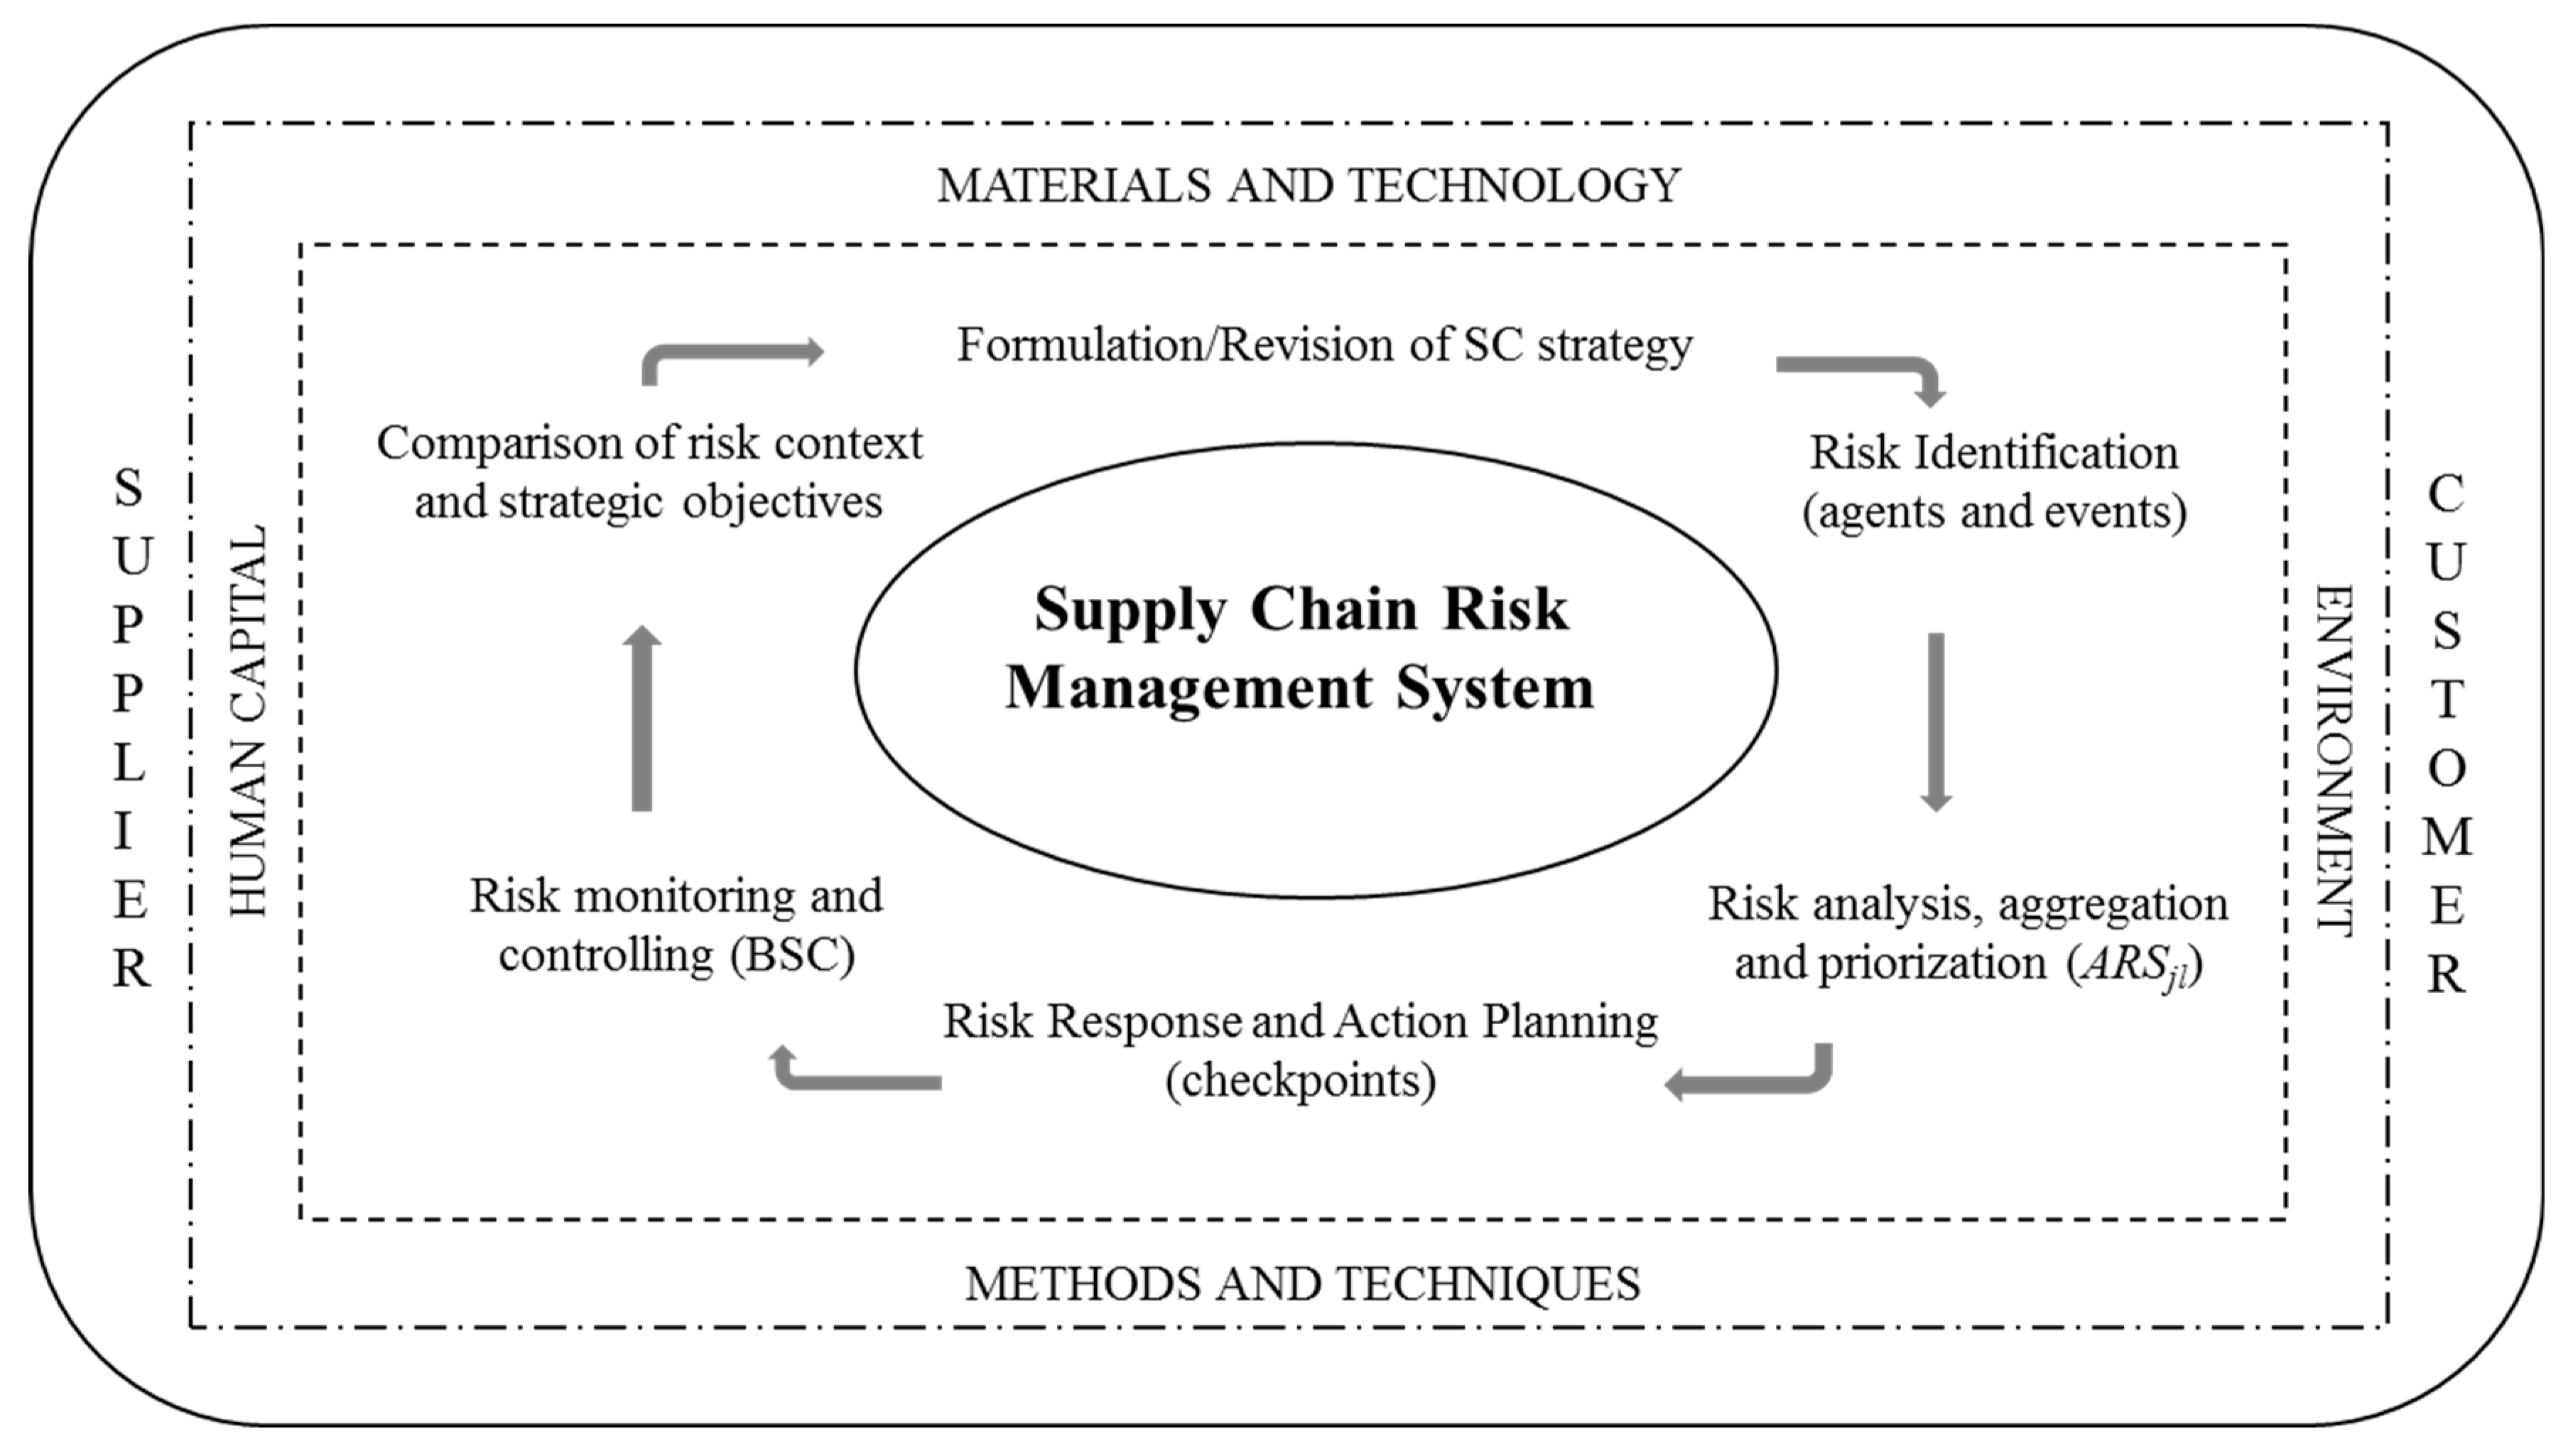
The proposed framework for SCRM is based on a cyclic process supported by qualitative and quantitative methods in an aggregated form (
Figure 1). This allows a step-by-step system for identifying and controlling risks systematically analyses. For a better understanding and application of this model, a procedure is proposed as shown in
Figure 2.
2.1. Prepare the Study
The first step is to select the team and organize the project. The function of this team is to provide the necessary information for the development of the study, as well as to identify, configure, model, evaluate, decide and make the necessary analyses as a result of the application of the procedure. Since the quality of the team decisively influences the accuracy and reliability of the results, it is important that these people are motivated to participate. The commitment and support of the organization’s executive management must also be guaranteed. In addition, a member should be appointed at this point as the project coordinator.
2.2. Identify Processes and Activities
To achieve an adequate strategic deployment and effective RM, it is necessary to achieve a mastery of the logistics process that is managed in the organization under study as well as the analysis of the activities and flows that compose it.
In the specific case of SCs, we propose the use of the supply chain reference model (SCOR). According to Moazzam et al. [
38], the SCOR model has been widely applied and easily understood in all kinds of sectors. It must be considered based on its basic management processes and key indicators and attributes.
In this sense, SC should be represented using the process categories according to their current state (AS-IS), both geographically and by wire diagrams, to then establish the design specifications of their new SC and power reconfigure it to the desired state (TO-BE). In this step, the operations strategy should be refined, and the best practices applicable to each defined element should be identified, as well as the system (hardware and software) capabilities required to support these practices.
2.3. Identify Strategic Objectives (l)
Within organizations, the behavior of some functional areas may be antagonistic to achieve objectives. It is necessary to make a deployment with “cascade effect”, from the business scope to the different strategic business units or processes, through functional strategies. For this purpose, we will use the balanced scorecard (BSC), a tool that revolutionized in the 1990s [
39] to provide a way of measuring the performance of companies considering financial and non-financial indicators and linking these indicators to short-term objectives and long-term strategy [
40]. This is achieved through the correct sequencing and integration of four processes: Convert/translate the business vision into actions; secondly communicate and link/relate to operational objectives; thirdly integrate all your business plans with your financial planning; and fourthly feedback by applying the necessary learning and adjustments [
41,
42,
43,
44,
45,
46,
47]. According to Shafiee et al. [
48], the strongest point of BSC is its ability to illustrate the cause and effect relations between strategies and processes.
2.4. Identify Risk Agents by Objective (Ajl)
According to Moeinzadeh and Hajfathaliha [
6], SC risks are associated with: planning and control, supplies, processes, demand, return, and environment. To develop this step, it is necessary to identify for each objective “
i”, the agents “
j” that jeopardize its achievement by obtaining the
Ajl. An agent is understood as the source of risk that can lead to the occurrence of one or more events and can impact more than one objective. The common tools used in the risk identification stage are questionnaires, flowcharts, interviews, event trees, fault trees, hazard and operability study (HAZOP), FMEA, among others. In this step, BSC cause–effect relationships are also very helpful.
2.5. Identify Events by Agents in the Processes (Ei)
In this step, we proceed to identify the risk events for which consequences can affect the objectives. At the same time, more than one agent can cause the same event, and an agent can cause more than one event [
22]. In this analysis, we must consider both the effect that the agent of risk could directly cause, as well as the causality that may exist between the events. Hence, it is necessary to determine the relation of influence. An event tree tool is proposed for this purpose.
2.6. Identify Degree of Relationship between Events (rnk) and between Agents and Events (Rjk)
As mentioned earlier, FMEA has some limitations in the calculation of RPN because it does not take into account the relations between the modes of failure and the effect. Previous research [
21] has developed proposals to mitigate these limitations by considering the relationships between agents and events and highlighting the need to extend the analysis to the relationships between events. In this research, we have focused on these research needs.
Influence relationships refer to: What strength can the risk agent
j cause the risk event
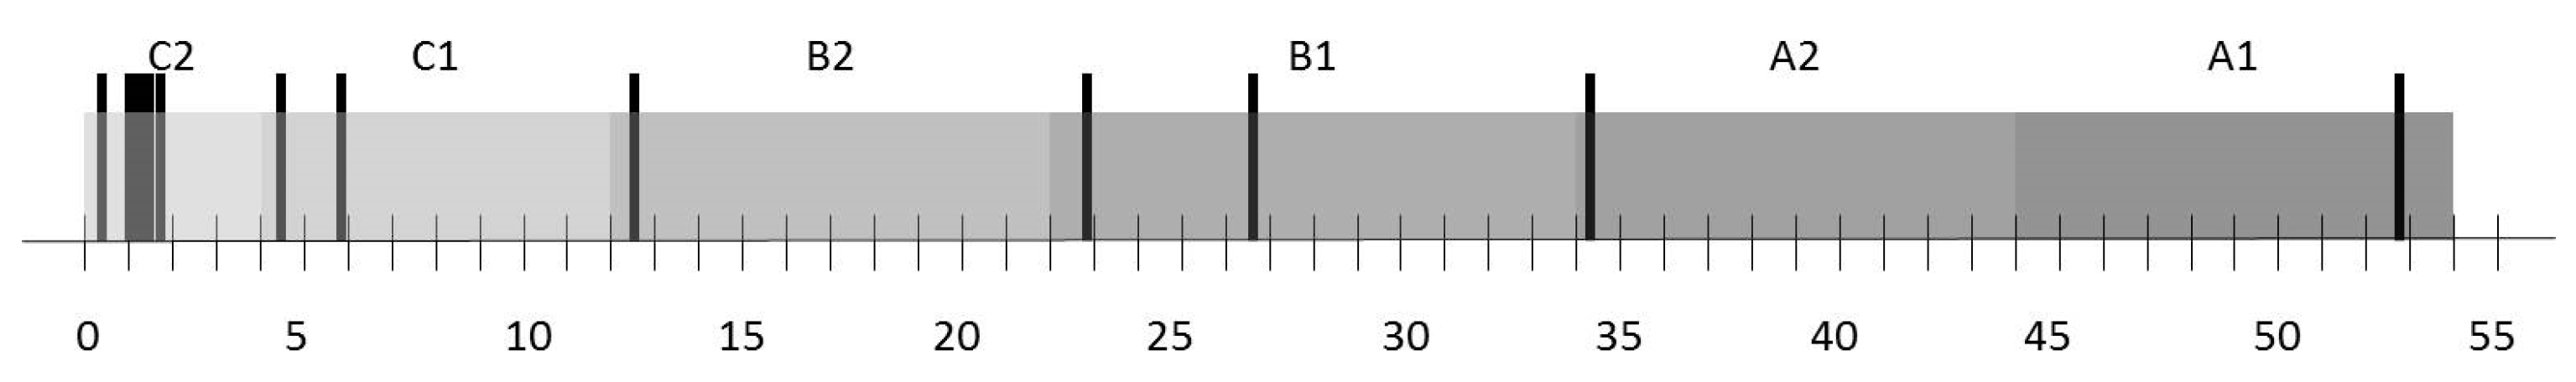
i? With which strength can a risk event trigger the occurrence of another event? These relations in conjunction with the probability of occurrence of the agent and the severity of the event will be the determining factors for the aggregated risk score (
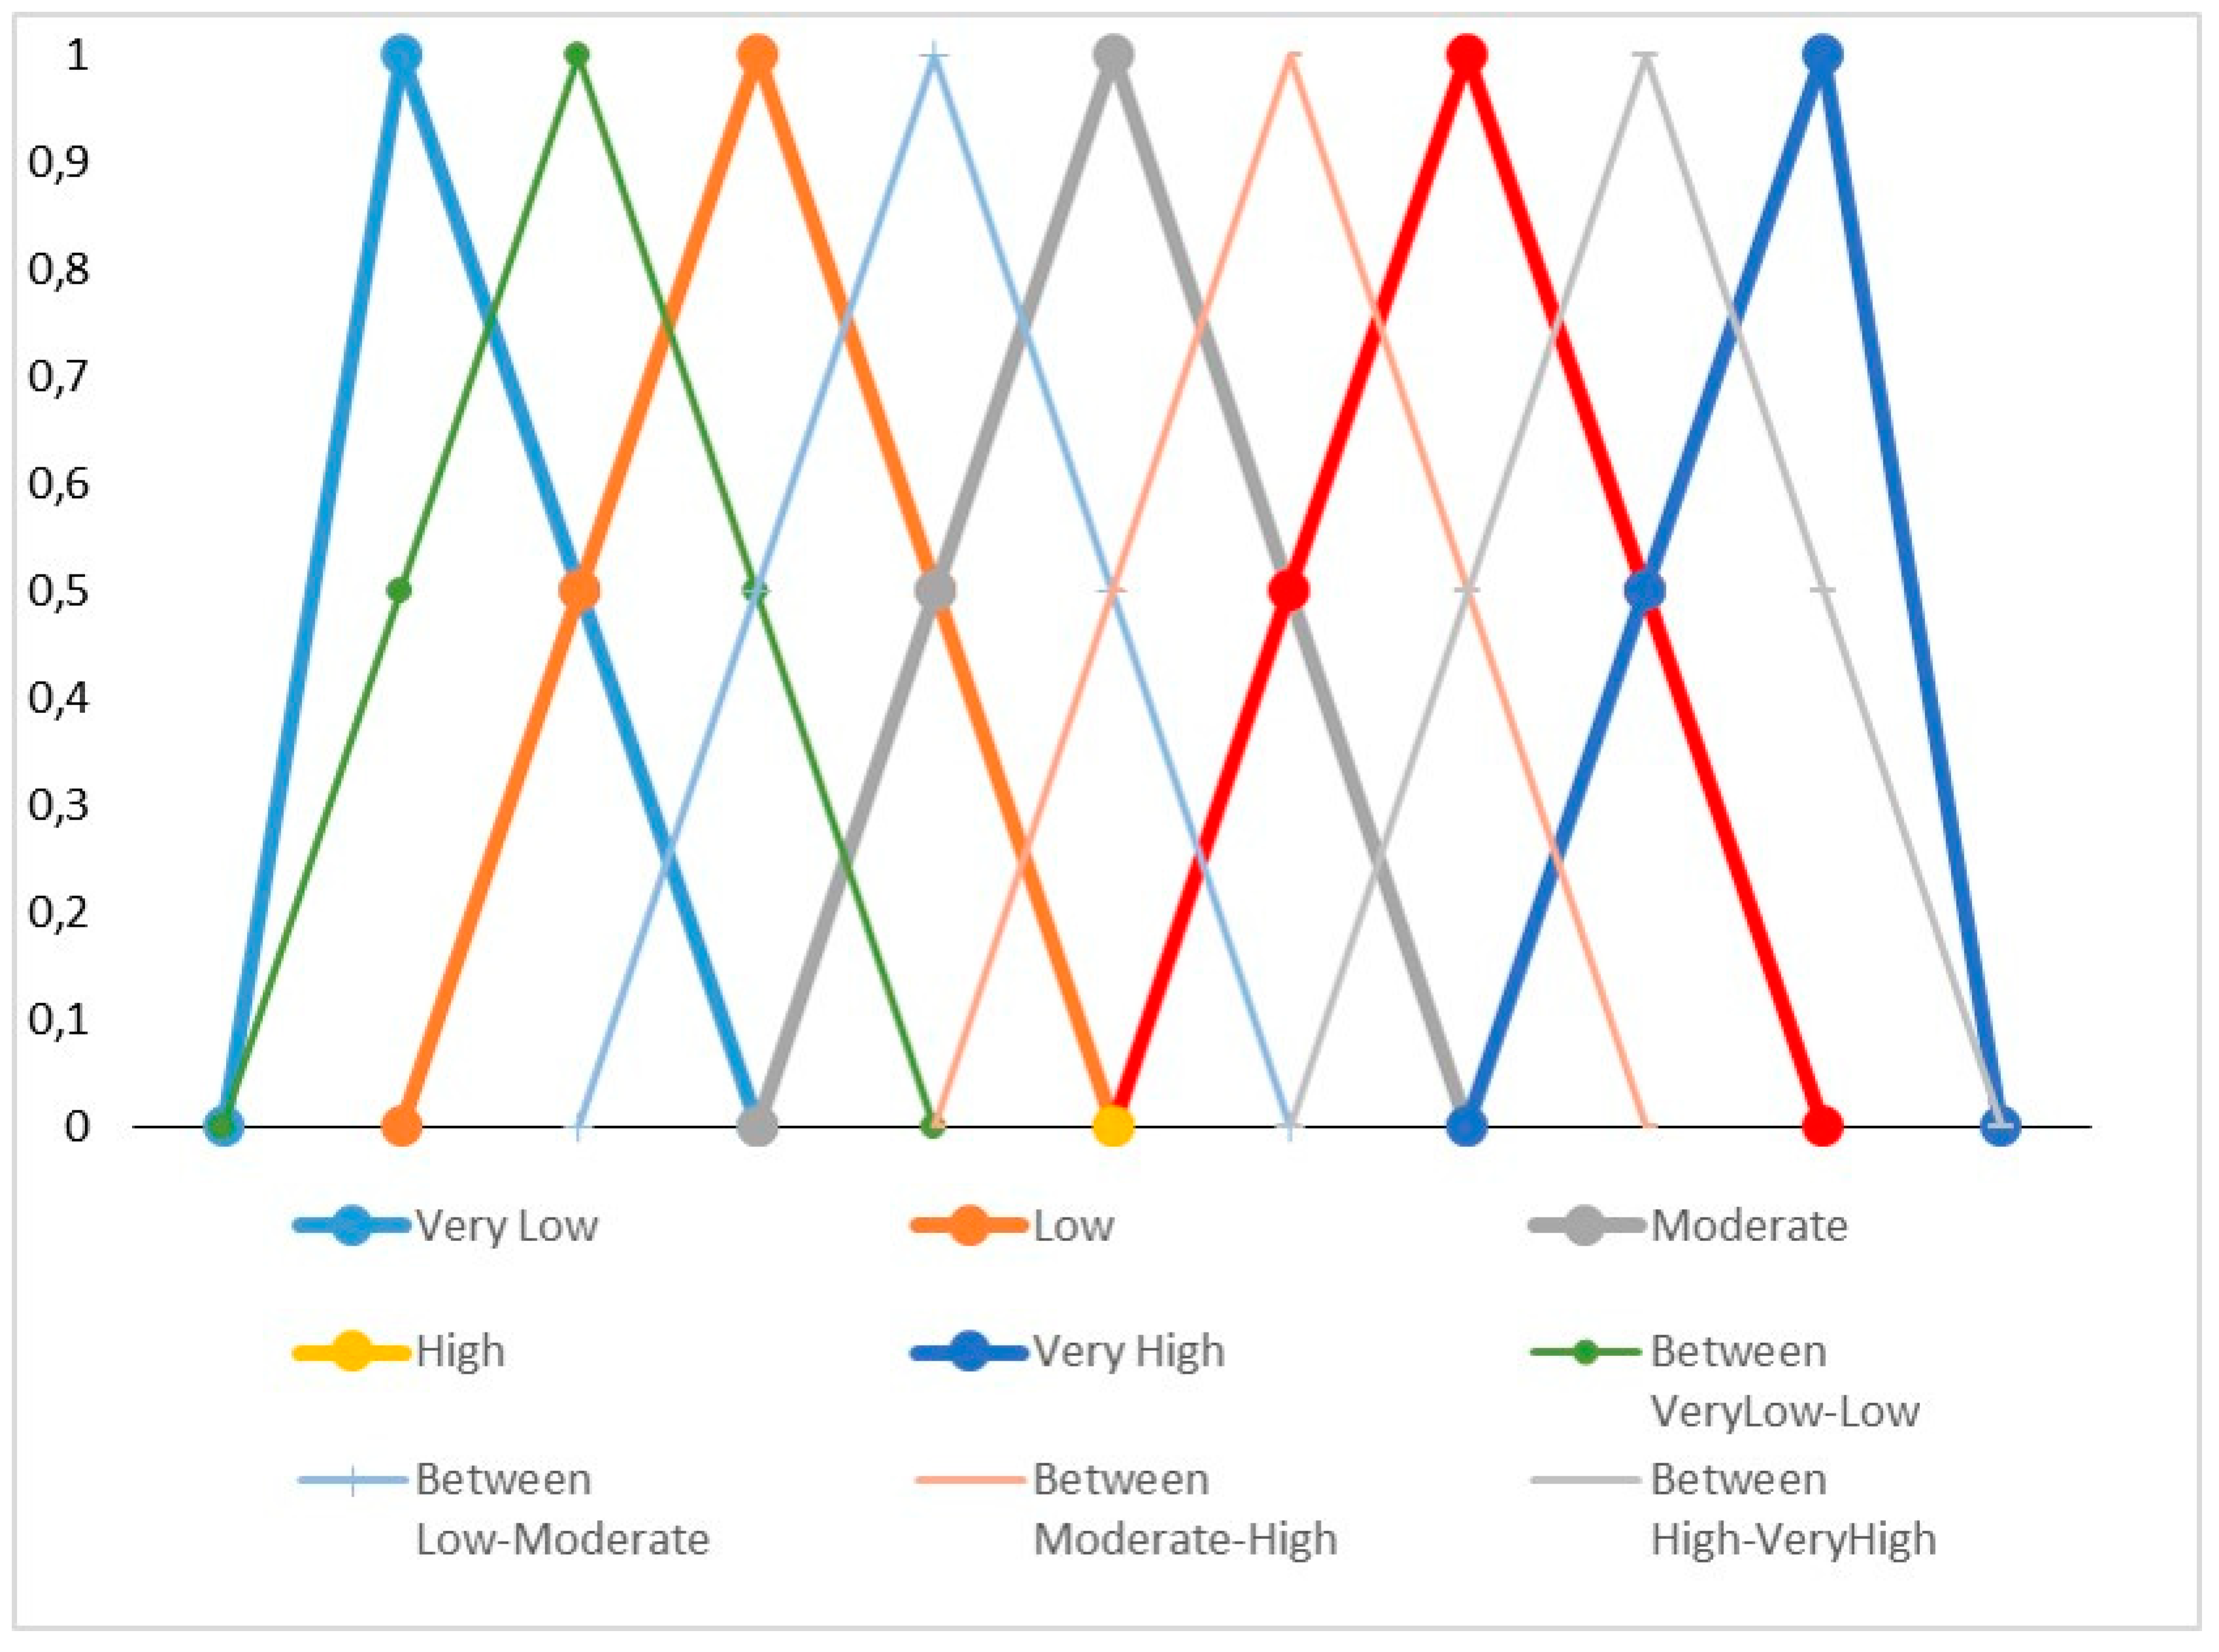
ARS). The values are obtained by using the five main linguistic labels (very high, high, moderate, low, very low) and four additional linguistic labels among the main ones, as shown in
Figure 3, as proposed by Saaty [
49]. The use of fuzzy logic is based on the fact that some problems did not require, or do not have the correct or accurate value, and we could model the problem based on prior experience or knowledge of experts [
26]. We will use the nine labels when we have been able to bring together the experts and they have reached a consensus among their different assessments, while we will only use the five main linguistic labels when we collect their assessments and must obtain the mean value.
To obtain the mean value, each main linguistic label can be transformed into a fuzzy number (
a −
c1,
a,
a +
c2), where (
a −
c1) is the minimum value of the fuzzy number,
a is the mid value, and (
a +
c2) is the maximum value. For the addition of these fuzzy numbers, we use the following expressions presented by Aqlan and Mustafa [
14]:
where
d1 is the left width,
b is the central value, and
d2 is the right width. These values will then be used to calculate the final aggregated fuzzy value as (
b −
d1,
b,
b +
d2). To facilitate the management of this information, it is proposed that the collection of these numbers be done in the form of a matrix
Ajl ×
Ei.
2.7. Determine the Probability of Occurrence of Each Risk Agent (Oj)
The conventional FMEA uses a scale to determine the probability of occurrence of the failure. In the case of this investigation, what is determined is the probability (or possibility) of occurrence of the agent of risk using linguistic labels. Information can be collected through surveys, questionnaires, and company’s information systems.
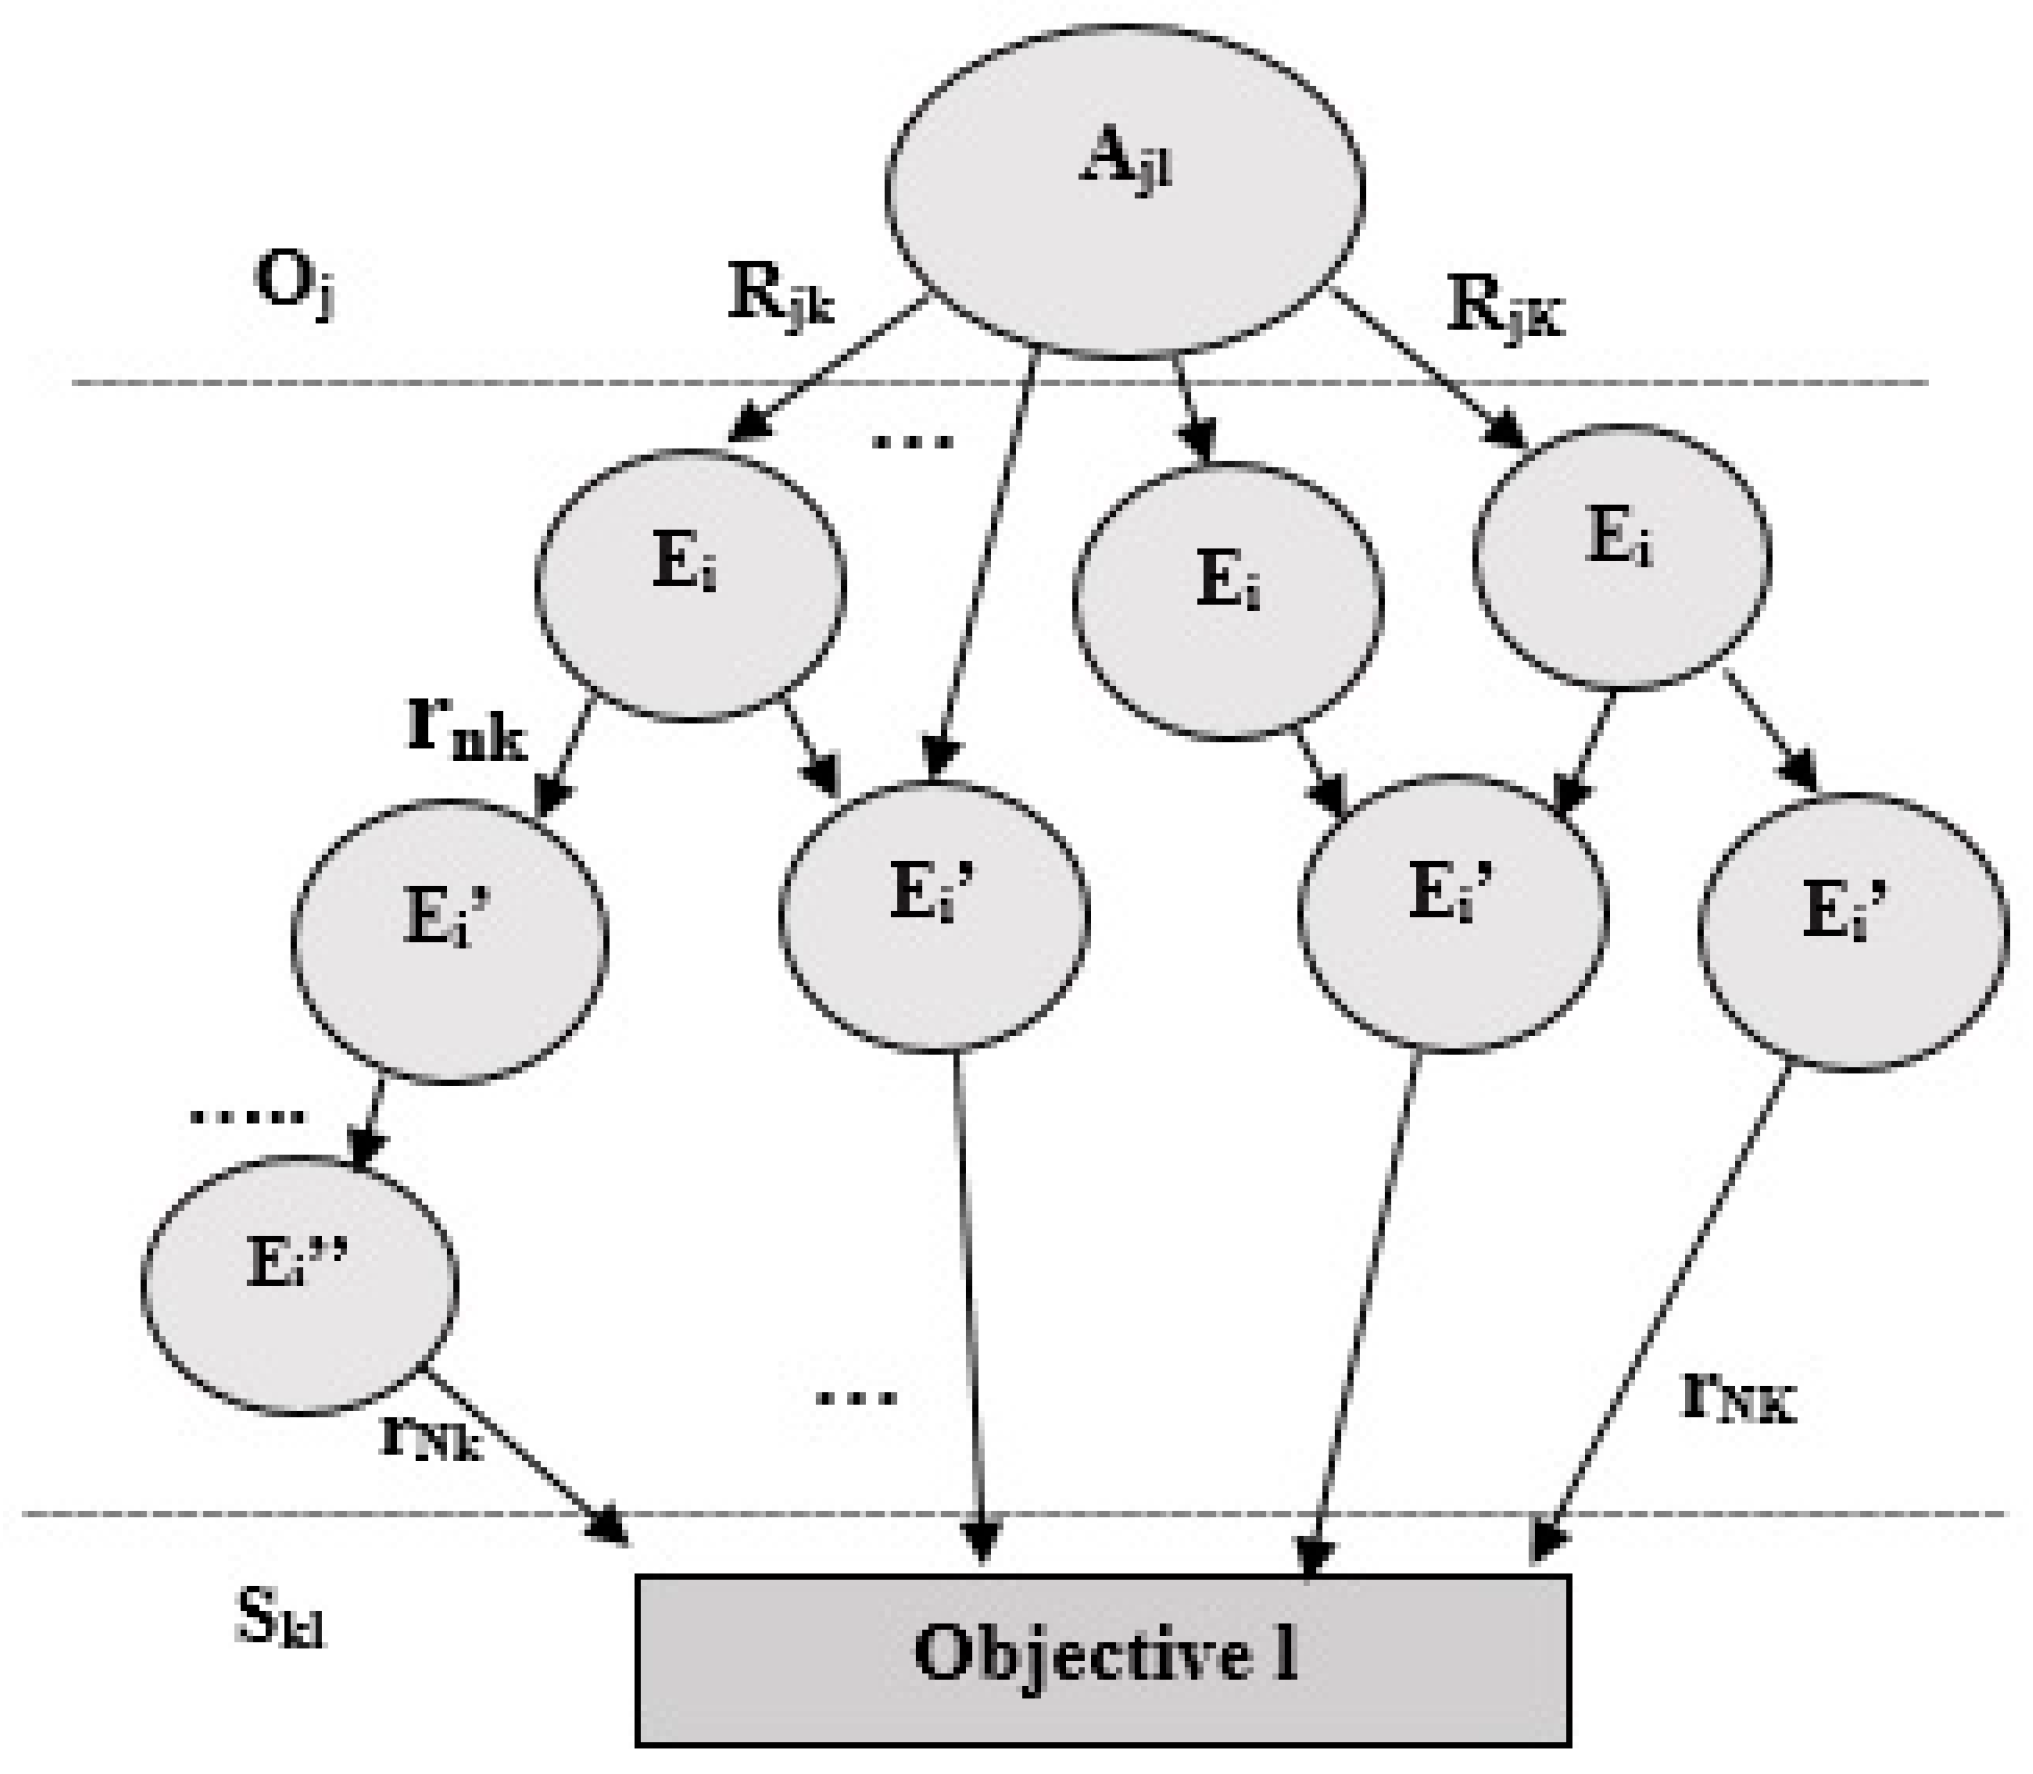
2.8. Determine the Severity of Risk Events (Skl)
To address another limitation identified in the literature related to the redundancy of the information that can be considered when evaluating the impact of the consequences, the estimation will consider the event that directly impacts the objective. This judgment is the result of consensus among experts using linguistic labels as previously discussed. The experts who evaluate each of these aspects can define a larger number of linguistic labels, or different definitions of labels by triangular or trapezoidal numbers. As result of the previous steps, a representation of the model can be obtained as shown in
Figure 4.
2.9. Determine the Aggregated Risk Score by Agent and Objective (ARSjl)
The aim of this step is to determine the
ARSjl for each risk agent as it is exposed in the expression (2) with elements that have been determined in previous steps (
Oj,
Skl,
Rjk). For the basis of our proposal, we use the approaches developed by Pujawan and Geraldin [
21] and Ma and Wong [
22], and we include the correlations between risk events and the analysis by objective. This includes the existence and weighting of agents (causes) that can trigger several events (consequences), as well as the interrelationships between the events in a holistic way.
where
K is the total branches connecting agent
j to objective
l;
Nk is the total segments between risk events in the branch
k;
L is the total objectives;
J is the total risk agents;
Rjk is the degree of correlation between the agent of risk
j and the event of risk that it affects directly in the branch
k;
rnk is the degree of correlation between risk events of segment
n in the branch
k;
Skl is the severity of the impact on the objective
l if the risk event (as final effect on objective) occurs in the branch
k; and
Oj is the probability of occurrence of the agent
j.
In this expression, we also consider the use of fuzzy logic as a support tool to achieve the assignment of the qualities to the expression (subjectivity, vague information, ambiguities) that the conventional form of calculation would not allow [
22]. By means of the operators and quantifiers of this logic [
50], it is possible to obtain a value of
ARSjl that will be mainly determined by the probability of occurrence of the agent and will take into account the possibility that these events that are caused by the same agent to improve accuracy and reliability of the calculation.
2.10. Determine Priority for Decision Making
The aggregated value of each agent (
ARSj) is achieved by aggregating its impact on the objectives affected as shown in expression (3). Then the values are ordered for the setting of priorities.
A similar analysis can be made to determine the priority by objectives, considering the agents that belong to the same objective (
ARSl) according to the expression (4).
At this point, we must defuzzify the results to facilitate decision-making with linguistic expressions using the Pareto rule. We need to identify which agents cause the highest levels of risk and which objectives are most exposed to risk situations.
2.11. Monitoring and Control
All of the above makes it possible to set priorities and; therefore, make effective decisions, focusing on where the greatest efforts should be spent while taking the necessary actions proactively.
This analysis should be carried out by integrating risk management into strategic management through the use of key risk indicators (KRIs) in the BSC. The analysis is combined with the identification of checkpoints. Control points are activities or states within the process that must be controlled to proactively assure the effectiveness of process performance.
The proposal was applied to a telecommunications company. It is a joint venture enterprise with 16 subsidiaries that relies on providing public services through the installation, operation, marketing, and maintenance of telecommunication networks and services. The working system in all subsidiaries is the same. The process selected as the subject of study was the logistic process in a subsidiary with its associated SCs. Only those objectives that were within the “area of influence” of the corresponding area were deployed to precisely define the responsibilities. These strategic objectives were balanced in the construction of the BSC and the processes involved for the SCM were identified to the level of detail. This prior analysis facilitates the subsequent risk analysis.
3. Results
The selected group of experts according to the
Section 2.1 of the proposal are shown in
Table 1. The analyses and values for the development of the assessments are based on the judgment of these experts. Many interviews were held with these experts in the chosen company to elicit solid information on the processes and identified risks.
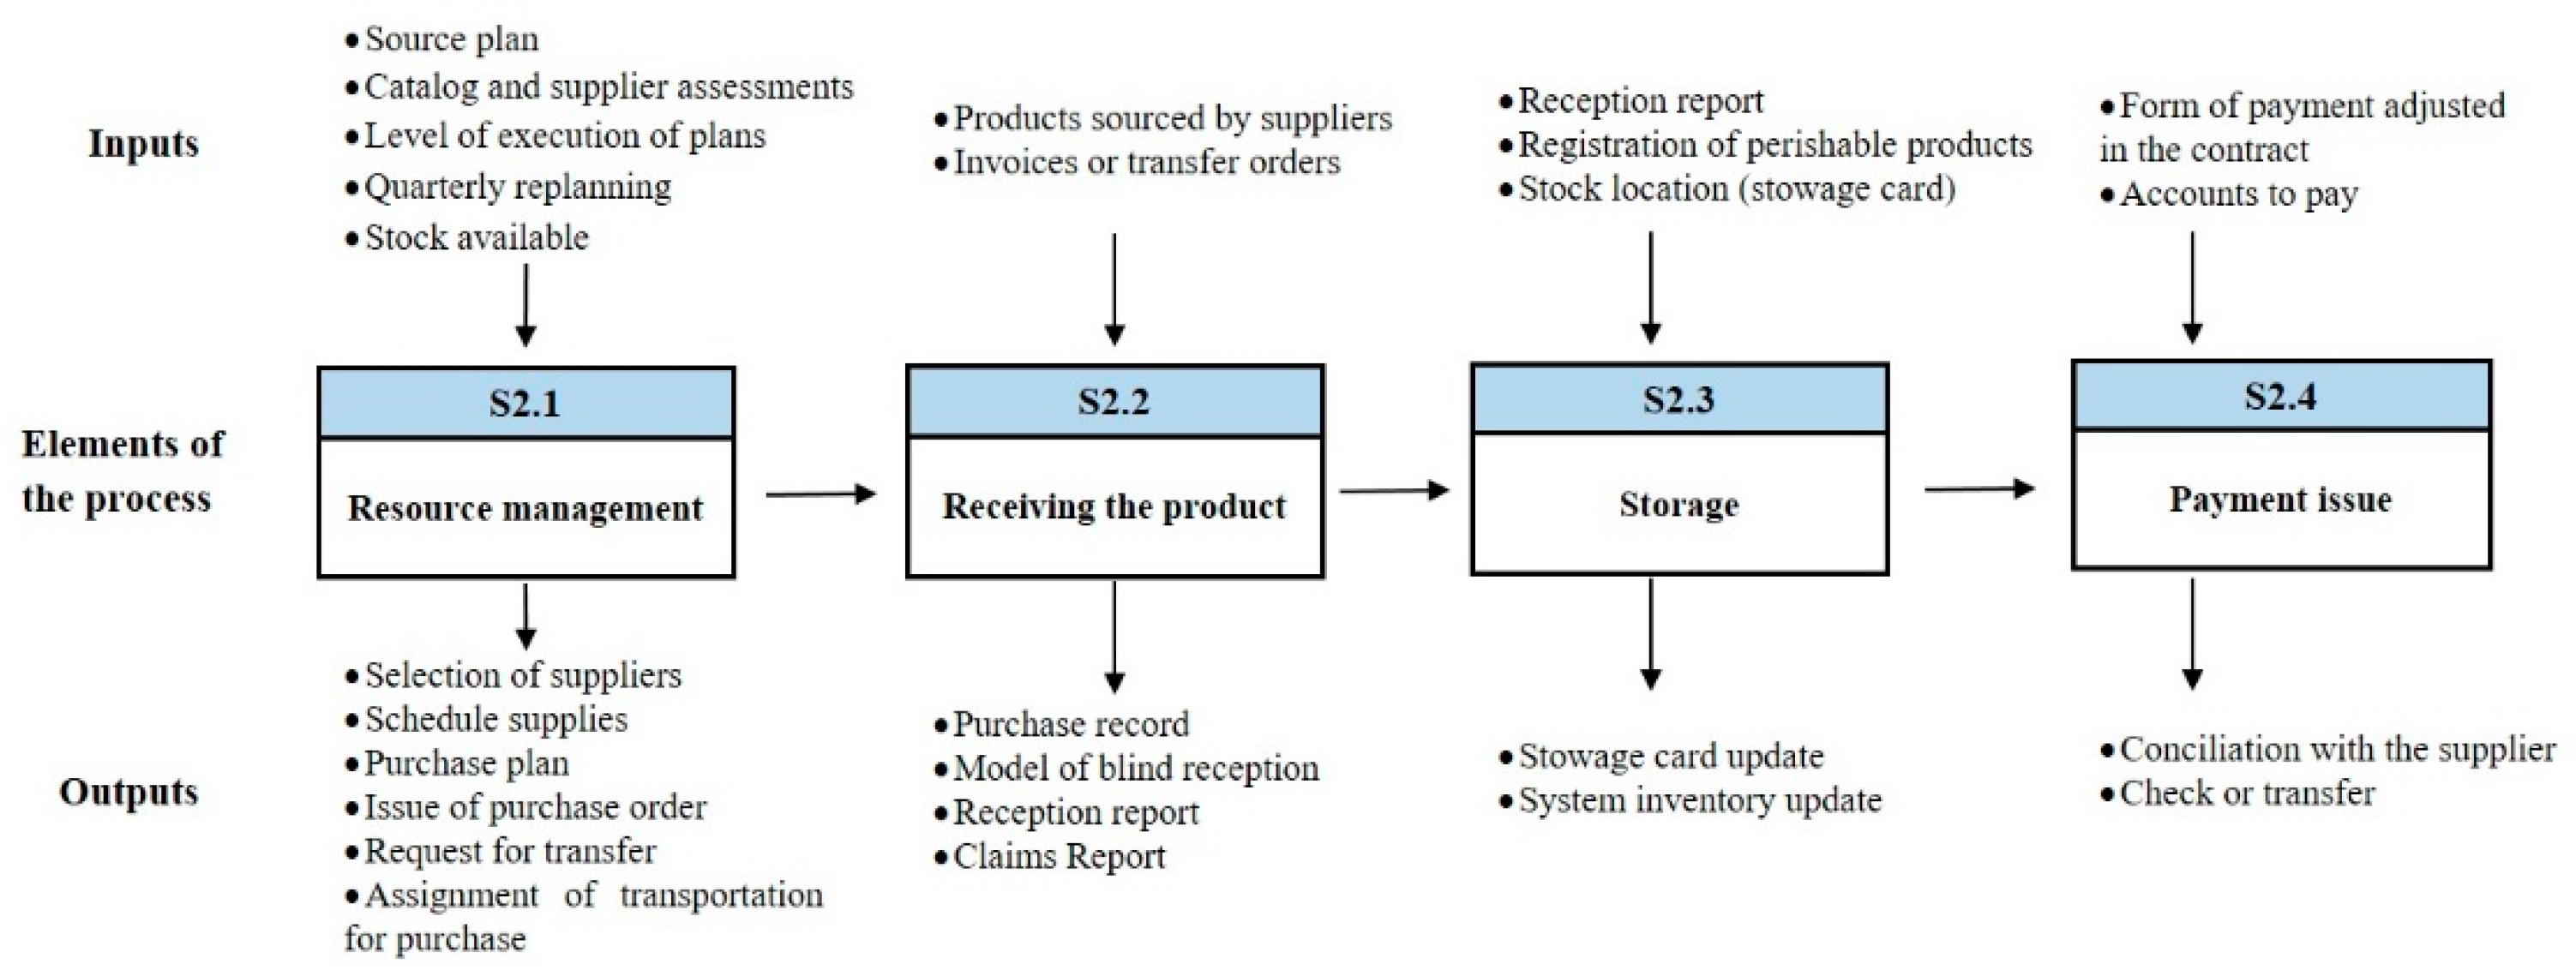
The logistic process under study was conformed (
Section 2.2). As an example,
Figure 5 shows the source process. Traceability of activities with their inputs and outputs enables decision-makers to identify risk events and their relationships. Then, in accordance with
Section 2.3, eight strategic and balanced objectives were derived according to the BSC perspectives: Clients (1), Financial (2), Processes (3), and Potentials (2).
Table 2 shows the identified risk agents associated with the achievement of the derived strategic objectives (
Section 2.4). Decision-makers have identified 18 sources of risk, which are translated into 26 risk agents (
Ajl) based on the particular objective analysis.
As a result of
Section 2.5, 54 risk events were identified in the process. The risk event categories are Plan and Control (P), Source (S), Deliver (D), Return (R), and Enable (E).
Table 3 shows the events corresponding to the Source process.
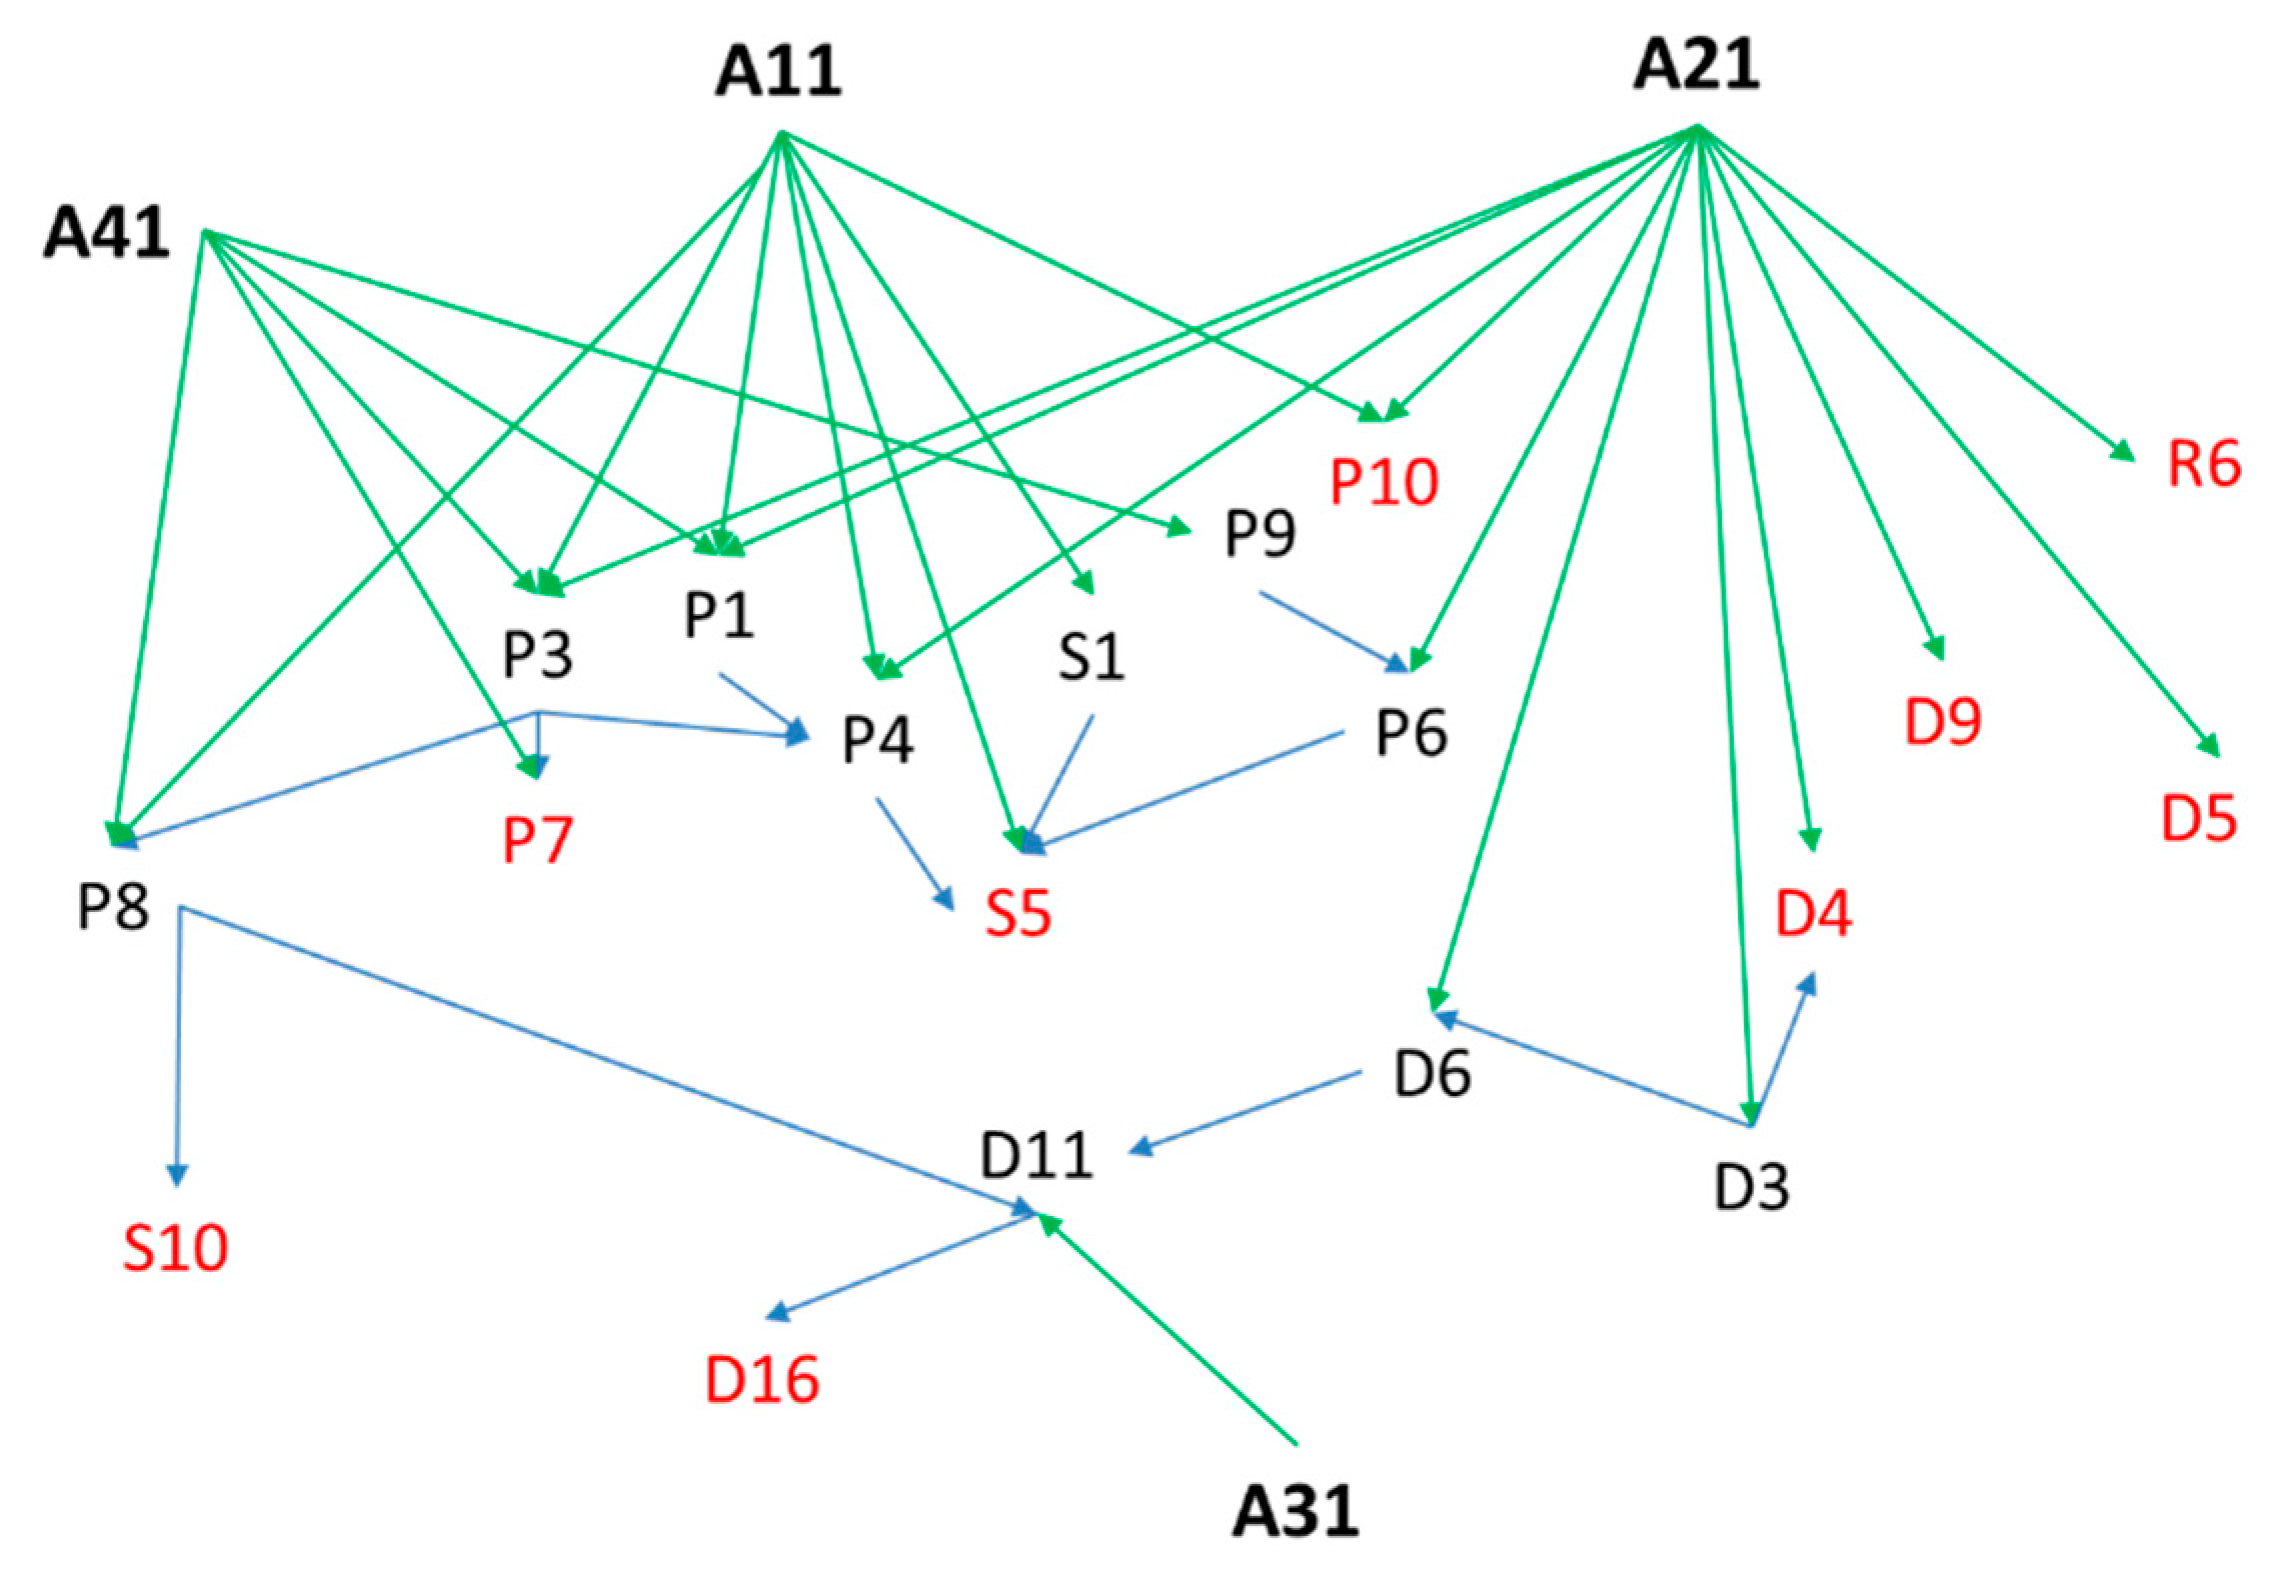
After the main risk agents and associated events are identified, the interactions between (
Rjk) and within (
rnk) can be determined (
Section 2.6). The event tree tool was used for each agent and fuzzy logic was used to add value to the ambiguities involved in the linguistic-data assessment process. Fuzzy numbers reflect the relative strength of each pair of network elements. The network structure corresponding to Objective 1 is shown in
Figure 6 where P, S, D, and R represent the process type of the events.
The fuzzy matrixes of peer-to-peer comparison with expert judgments are constructed based on the network given in
Figure 6 and are shown in
Table 4 and
Table 5. Then, as described in
Section 2.7, the values issued by the experts are shown in
Table 6. This analysis of the probability of occurrence is performed for the source agent. However, severity was identified by branch. This is in correspondence with the impact of the occurrence of the last event (highlighted in red color in
Figure 6) to avoid redundancy in the aggregation.
The values identified for agent
A11 as a result of the development of
Section 2.8 are shown in
Table 7.
For example, the calculation of the aggregated fuzzy severity of branch 5 of agent
A11 using the aggregation method in Equation (1) is calculated as:
According to described in
Section 2.9, the
ARS by agent was measured based on Equation (2). For the first branch of
A11:
Detailed calculations of the
A11 branches are shown in the
Table 8.
Table 9 shows the
ARS values calculated for each agent in its analysis by objective. It is necessary to add the values per agent, as a single source of occurrence based on Equation (3) and by objective based on Equation (4) (
Section 2.10). The corresponding values are shown in
Table 10 and
Table 11. To defuzzify the numbers, Pareto principle was used (approximately 10% A, 20% B, and 70% C) (
Figure 7 and
Figure 8 respectively). From this analysis, it was obtained that the agents with higher
ARS are the following (in that order of priority): (1) Non-compliance with working methodologies and procedures (
A2i), (2) lack of commitment of workers (
A17-8), (3) lack of correspondence of training actions and training needs (
A15-8). The objective with the highest risk of non-compliance is objective 8.
For decision making, the previous analysis was incorporated into the design and control of BSC and KRIs were integrated. The establishment of priorities for this projection according to the
ARSj and
ARSl indicators should be taken into account. As part of the actions to mitigate risks and achieve effective SCM, checkpoints associated with the identified risk events were defined. These checkpoints were incorporated into the design of the processes. The thresholds between the measurements made on the control objects were considered for acceptable evaluation. This will respond to compliance with the procedures that describe the operations, technical instructions, physical parameters, time, and other aspects, thus facilitating the control of the activity. As an example,
Table 12 shows 14 checkpoints corresponding to the risk events of the Source process. Finally,
Table 13 shows a summary that integrates these elements. The company managers were left in charge of a proactive management tool of the strategy, which has allowed them to keep a constant monitoring and diagnosis.
4. Discussion
SCRM requires dealing with uncertainty, interrelations, and subjectivity inherent in the risk assessment process. Although several quantitative/qualitative tools and techniques have already been developed for SCRM, there is a limited focus on introducing holistic frameworks that not only integrate all stages of the RM process but also consider prior analysis of SC processes and strategic management focus. Existing frameworks generally focus on optimizing a single objective, generally a performance measure, without capturing the correlation effects of common risk triggers. Existing frameworks also do not consider the trade-off between multiple and interdependent strategic objectives at the same time.
The proposed approach in this study deals with capturing this complexity by integrating all of features in a holistic framework that combines qualitative and quantitative techniques for effective SCRM. A mathematical model with a fuzzy inference system was developed to aggregate risk values taking into account the correlations of agents and risk events associated with the achievement of objectives. The intra-and inter-dependencies among the categories were considered in the form of a risk network that provides a tool to visualize the position of a risk within the network and its influence on the key performance measures. The risk network also helps in identifying potential mitigation strategies and control measures which allows for a proactive management of the strategy (see
Table 13).
The fuzzy risk assessment method proposed in this study estimates the uncertainty inherent in the input values and allows users to adequately describe the uncertainty. The use of fuzzy logic allows for the treatment of vague and ambiguity data from different domains and scales. In addition, this fuzzy method can easily be transformed into traditional probabilistic methods when sufficient information and knowledge is available.
The results of the study in the selected telecommunications industry show the identification and analysis of 18 sources of risk, which are translated into 26 risk agents and 54 risks events associated to eight objectives. The analysis and assessment of risk scores made it possible to identify, for the strategic period evaluated, that objectives 8 and 1 present higher risks. The risk sources that cause higher levels of risk and; therefore, require greater focus were agents 2 (aggregate objectives 1, 3, 4 and 5) and agent 17 (objective 8), followed by agent 15 (objective 8). The associated checkpoints facilitate proactive analysis in the achievement of activities. This scenario and its results may vary according to the strategic period, the nature of the objectives, and the dynamics of the environment, so a systematic diagnostic discipline must be adopted. However, the proposed framework is generic and can be applied in other service or manufacturing environments.
In general, this study highlights some important points that should be considered by managers when analyzing SCRM to support the achievement of strategic objectives, as managerial implications:
This study has revealed the potential holistic nature of SCRM, by RM stages, SC processes, and multi-objective analysis. This is articulated in a unique approach and quantified by a proposed score (by agents and by objectives) that constitutes a valuable tool for risk monitoring and control.
The study addresses the complex interrelationships from different sources, as well as the strength of the relationships between risk events and causal agents that can impact more than one objective simultaneously. This contributes to the optimization of mitigation strategies.
The combination of the SCOR model and the BSC tool improves strategic deployment at all levels. The SCOR model provides a balanced set of KPIs between customer-focused attributes (reliability, responsiveness, and agility) and internal-focused attributes (cost and asset). Our framework is scalable to level 3 metrics that can be selected based on specific needs. In most cases, this detailed information is not readily available. However, for the initial deployment, SCOR metrics up to level 2 are enough and the required information is easily available. This detailed analysis of the processes, combined with the cause–effect analysis of the strategic guidelines of the BSC, allows for the disruptive traceability of the system.
The methodology presented in this study shows a step-by-step guide that makes it easy for managers and decision-makers to develop each of the stages of the proposed holistic framework for conducting an aggregate risk assessment. The defuzzification method used with an easy-to-understand business tool (Pareto rules) increases the practical implications and facilitates the communication and understanding of managers and decision makers.
5. Conclusions
In this article, a new assessment approach for SCRM was developed. The theoretical and practical contributions of this paper are summarized below.
5.1. Theoretical Implications
This research contributes to the literature on SCRM integrated into strategic management by further analyzing its deployment and disruptive events interdependencies along the SC and processes.
First, we developed a holistic framework for proactive SCRM by integrating all RM stages with risk modelling and aggregation over multiple objectives and risk agents. This system captures the interdependence of risks in the strategic management at all SC levels and process.
Second, a re-engineering process based on the philosophy of the SCOR model as a preliminary analysis was proposed to allow for the alignment and operationalization of the strategy with RM. This analysis improves the control by activity through checkpoints identified in the processes.
Third, the proposed ARS can be used capture the risk agents and events dependencies in cascading effects of common risk triggers and quantify the aggregated score by risk agent and objective. This will overcome some of the limitations related to the traditional calculation of RPN. The consideration of severity as a final effect avoids redundancies in the calculation and the analysis of interdependencies (transverse and longitudinal) reduces the presence of “holes”. It also contributes to a more reliable risk assessment by addressing the randomness and epistemic uncertainty using linguistic variable as decision-makers, often due to lack of data and use of subjective judgments.
Fourth, our research integrates risk mitigation strategies into process performance assessment. The integration with the BSC tool constitutes a powerful combination allowing a proactive and effective management of the strategy.
5.2. Practical Implications
This research provides a practical and generic solution by which companies can holistically assess the risks associated with their objectives. This aggregated analysis helps managers and decision-makers to focus on the factors that affect the achievement of objectives as well as identify the risks that require more rigorous evaluation and monitoring.
The real application in a telecommunications company illustrates the viability of effectively combining human judgement in integrated aspects of performance and risk in the design and management of the SC. The results also contribute to highlighting the use of widely accepted and easily understood tools, integrated into a single approach (i.e., event trees, SCOR model, and BSC). The correlation and interdependency analysis combined with the treatment of epistemic uncertainty using fuzzy logic can be used to predict and prioritize risk agents (by agents and by objectives) on a systemic and continuous basis.
5.3. Limitations and Future Scope
This research has some limitations that can lead to future lines of research:
In this research, the time variable was not considered. The dynamics and duration of risk events constitute an interesting challenge to be incorporated in the proposed mathematical model. This analysis can be conducted in terms of the severity of the impacts and the learning of the system.
The quantification of ARS by process can be incorporated into the framework. It is important to emphasize that the relationships between all risk factors are not simply hierarchical and we must consider the interaction of risk agents. This analysis will allow for precise identification of redundant elements in the aggregation.
Only one case study was used in this paper. Additional case studies can extend our model to other industries, and comparisons can also be made to determine how our model performs differently in diverse contexts. This would further enrich theoretical and managerial contributions.
Additionally, although the mathematical model can be easily implemented in practice with a simple spreadsheet, input values require important data collection (different sources and nature) and brainstorming within the organization (cascade effect). Therefore, in the context of the forth industrial revolution (i.e., Industry 4.0), the integration with advanced technology tools and artificial intelligence techniques can be utilized to improve the decision-making and system learning.


