Article

Multiscale Characterisation of Cortical Bone Tissue

by
José A. Sanz-Herrera
1,*,
Juan Mora-Macías
2,
Esther Reina-Romo
1,
Jaime Domínguez
1 and
Manuel Doblaré
3
1
Escuela Técnica Superior de Ingeniería, Universidad de Sevilla, 41092 Seville, Spain
2
Department of Mining, Mechanical, Energy and Construction Engineering, University of Huelva, Campus Universitario La Rábida, Escuela Técnica Superior de Ingeniería, Palos de la Frontera, 21007 Huelva, Spain
3
Aragon Institute of Engineering Research (I3A), University of Zaragoza, 50018 Zaragoza, Spain
*
Author to whom correspondence should be addressed.
Appl. Sci. 2019, 9(23), 5228; https://doi.org/10.3390/app9235228
Submission received: 28 October 2019 / Revised: 18 November 2019 / Accepted: 27 November 2019 / Published: 1 December 2019
(This article belongs to the Special Issue Biomaterials for Bone Tissue Engineering)

Abstract

:

Featured Application

Multiscale analysis is widely applied in the field of mechanics of heterogeneous materials, as a numerical tool, to simulate both microstructure evolution and macroscopic response to loads. The potential of this technique is applied in this work to the micro- and macro-mechanical study of the cortical bone tissue, using a mixed experimental-numerical approach. Hence, the experimental characterisation of the cortical bone is used to calibrate the outcome of the multiscale analysis. This strategy provides useful information at macro- and micro scales. First, the apparent mechanical (orthotropic) behaviour of the tissue is obtained. Second, microstrain and microstress distributions are shown along the bone microstructure. The multiscale analysis presented in this paper can be a useful technique to further investigate the microstructural and local mechanical stimulus which orchestrates several bone functions, such as bone remodelling.

Abstract

Multiscale analysis has become an attractive technique to predict the behaviour of materials whose microstructure strongly changes spatially or among samples, with that microstructure controlling the local constitutive behaviour. This is the case, for example, of most biological tissues—such as bone. Multiscale approaches not only allow, not only to better characterise the local behaviour, but also to predict the field-variable distributions (e.g., strains, stresses) at both scales (macro and micro) simultaneously. However, multiscale analysis usually lacks sufficient experimental feedback to demonstrate its validity. In this paper an experimental and numerical micromechanics analysis is developed with application to cortical bone. Displacement and strain fields are obtained across the microstructure by means of digital image correlation (DIC). The other mechanical variables are computed following the micromechanics theory. Special emphasis is given to the differences found in the different field variables between the micro- and macro-structures, which points out the need for this multiscale approach in cortical bone tissue. The obtained results are used to establish the basis of a multiscale methodology with application to the analysis of bone tissue mechanics at different spatial scales.

1. Introduction

The key importance of mechanical factors on the physiological functions and processes that take place in the bone tissue, in both healthy and pathological conditions, is widely accepted [1,2,3]. Therefore, in recent decades, important efforts have been made in the mechanical characterisation of bone tissue [4,5] (at different scales), and the mathematical modelling of its mechanical and mechanobiological behaviour [6,7,8].
On the one hand, the properties of the bone tissue are affected by a high number of factors, such as its morphological complexity and porosity, anisotropic orientation of trabeculae and osteons or its inherent hierarchical structure. A large number of studies characterise the structural and mechanical behaviour of the bone tissue by means of micromechanical [9,10], nano-mechanical [11] and macroscopic approaches [12], to cite a few. They all show the heterogeneity of this tissue at all scales and the difficulty of relating experimental measurements to real tissue properties. For example, Tai et al. [11] show, with atomic force microscopy experiments and computational simulations, that the nanomechanical properties and shape of cortical bone are directly related to their macroscopic mechanical behaviour, being this structure-property relation a key factor in some non-physiological behaviour of the bone tissue. Therefore, processes such as bone damage, bone remodelling and bone-related diseases (e.g., osteoporosis and fracture healing) could be better understood by relating microscale material heterogeneity to its macroscopic structural performance.
One of the techniques that allows to obtain microscopic parameters in inhomogeneous, anisotropic and non-linear materials is digital image correlation (DIC). It is particularly suitable for biological tissues and has been successfully used for measuring the strain field in bone tissue [13,14,15]. It consists of comparing the positions of different points of reference within a deformable loaded region that is photographed at different times. These points of reference are usually painted in the sample using a spray to create a speckles pattern. Using this method, the strain field of a region of interest within a specimen may be provided with microscopic resolution. The advantage of this method over others, such as nanoindentation [10,11], is that the whole strain field is recorded easily for different loading conditions. This technique, however, generate large amounts of data in comparison with traditional methods.
On the other hand, there is a vast literature related to modelling bone tissue in many different scenarios and at several scales. The models may be classified—according to the observation scale—as macroscopic and microscopic. At the macroscopic scale, several issues have been addressed in the last few decades, such as modelling/remodelling [16,17,18,19,20,21,22,23], poroelasticity [24,25], bone healing [26,27,28] or bone tissue engineering [29,30,31,32] among many others. Moreover, the driven mechanical stimulus [27,33,34,35,36] and the microstructural distribution of mechanical variables have also been studied [37,38,39,40].
The multiscale analysis is a technique initially applied in the framework of the mechanics of heterogeneous materials. Specifically, multiscale techniques have been used in the analysis of fluid circulation within a porous medium [41], plasticity [42,43], thermoelasticity or composite adhesives [44,45], to cite a few (refer to [46] for a review of multiscale analysis in different applications). On the other hand, multiscale analysis has progressively developed great potential for the combined macro-and-micro analysis of biological tissues due to their hierarchical, multiphasic and heterogeneous nature [47], such as tissue engineering processes [30,31,48]. Cancellous bone has been one the first candidates to be analysed through a multiscale approach [49,50,51]. However, cortical bone tissue has not been such a clear candidate, probably due to the lack of such a clear porous microstructure as compared to the cancellous bone, so it has been traditionally modelled as homogeneous, anisotropic material with directly homogenised properties [52]. However, some of the most interesting microstructures of the bone tissue are present in the cortical region including canaliculi, or Haversian and Volkmann canals [53,54].
The referred studies of the multiscale analysis of the bone tissue are developed independently of its mechanical characterization. In this paper, cortical bone is studied from a multiscale perspective to model an experimental setup specifically developed for this analysis. Therefore, the developed mathematical analysis and simulation is fed by the results recorded in the experiments providing a novel and mixed computational-experimental approach. The outcomes of the multiscale approach for the cortical tissue allow to conclude the importance of using a multiscale approach to capture the heterogeneity of the results along the microstructure, which is critical in order to understand many of the essential biological processes of bone tissue at this level.
The paper is arranged as follows: first, the experimental setup is introduced in the Section 2. Second, the mathematical multiscale approach is developed in Section 3. Both experimental and numerical results are presented in Section 4. Finally, the results are discussed and some conclusions are established at the end of the paper.

2. Materials and Methods

A cortical bone sample from the left femur of an adult male horse, aged between 15–20 years old, was used to obtain the strain maps under both longitudinal and transversal forces by means of the Digital Image Correlation (DIC) technology. Sample preparation and experimental tests were carried out as follows.

2.1. Sample Preparation

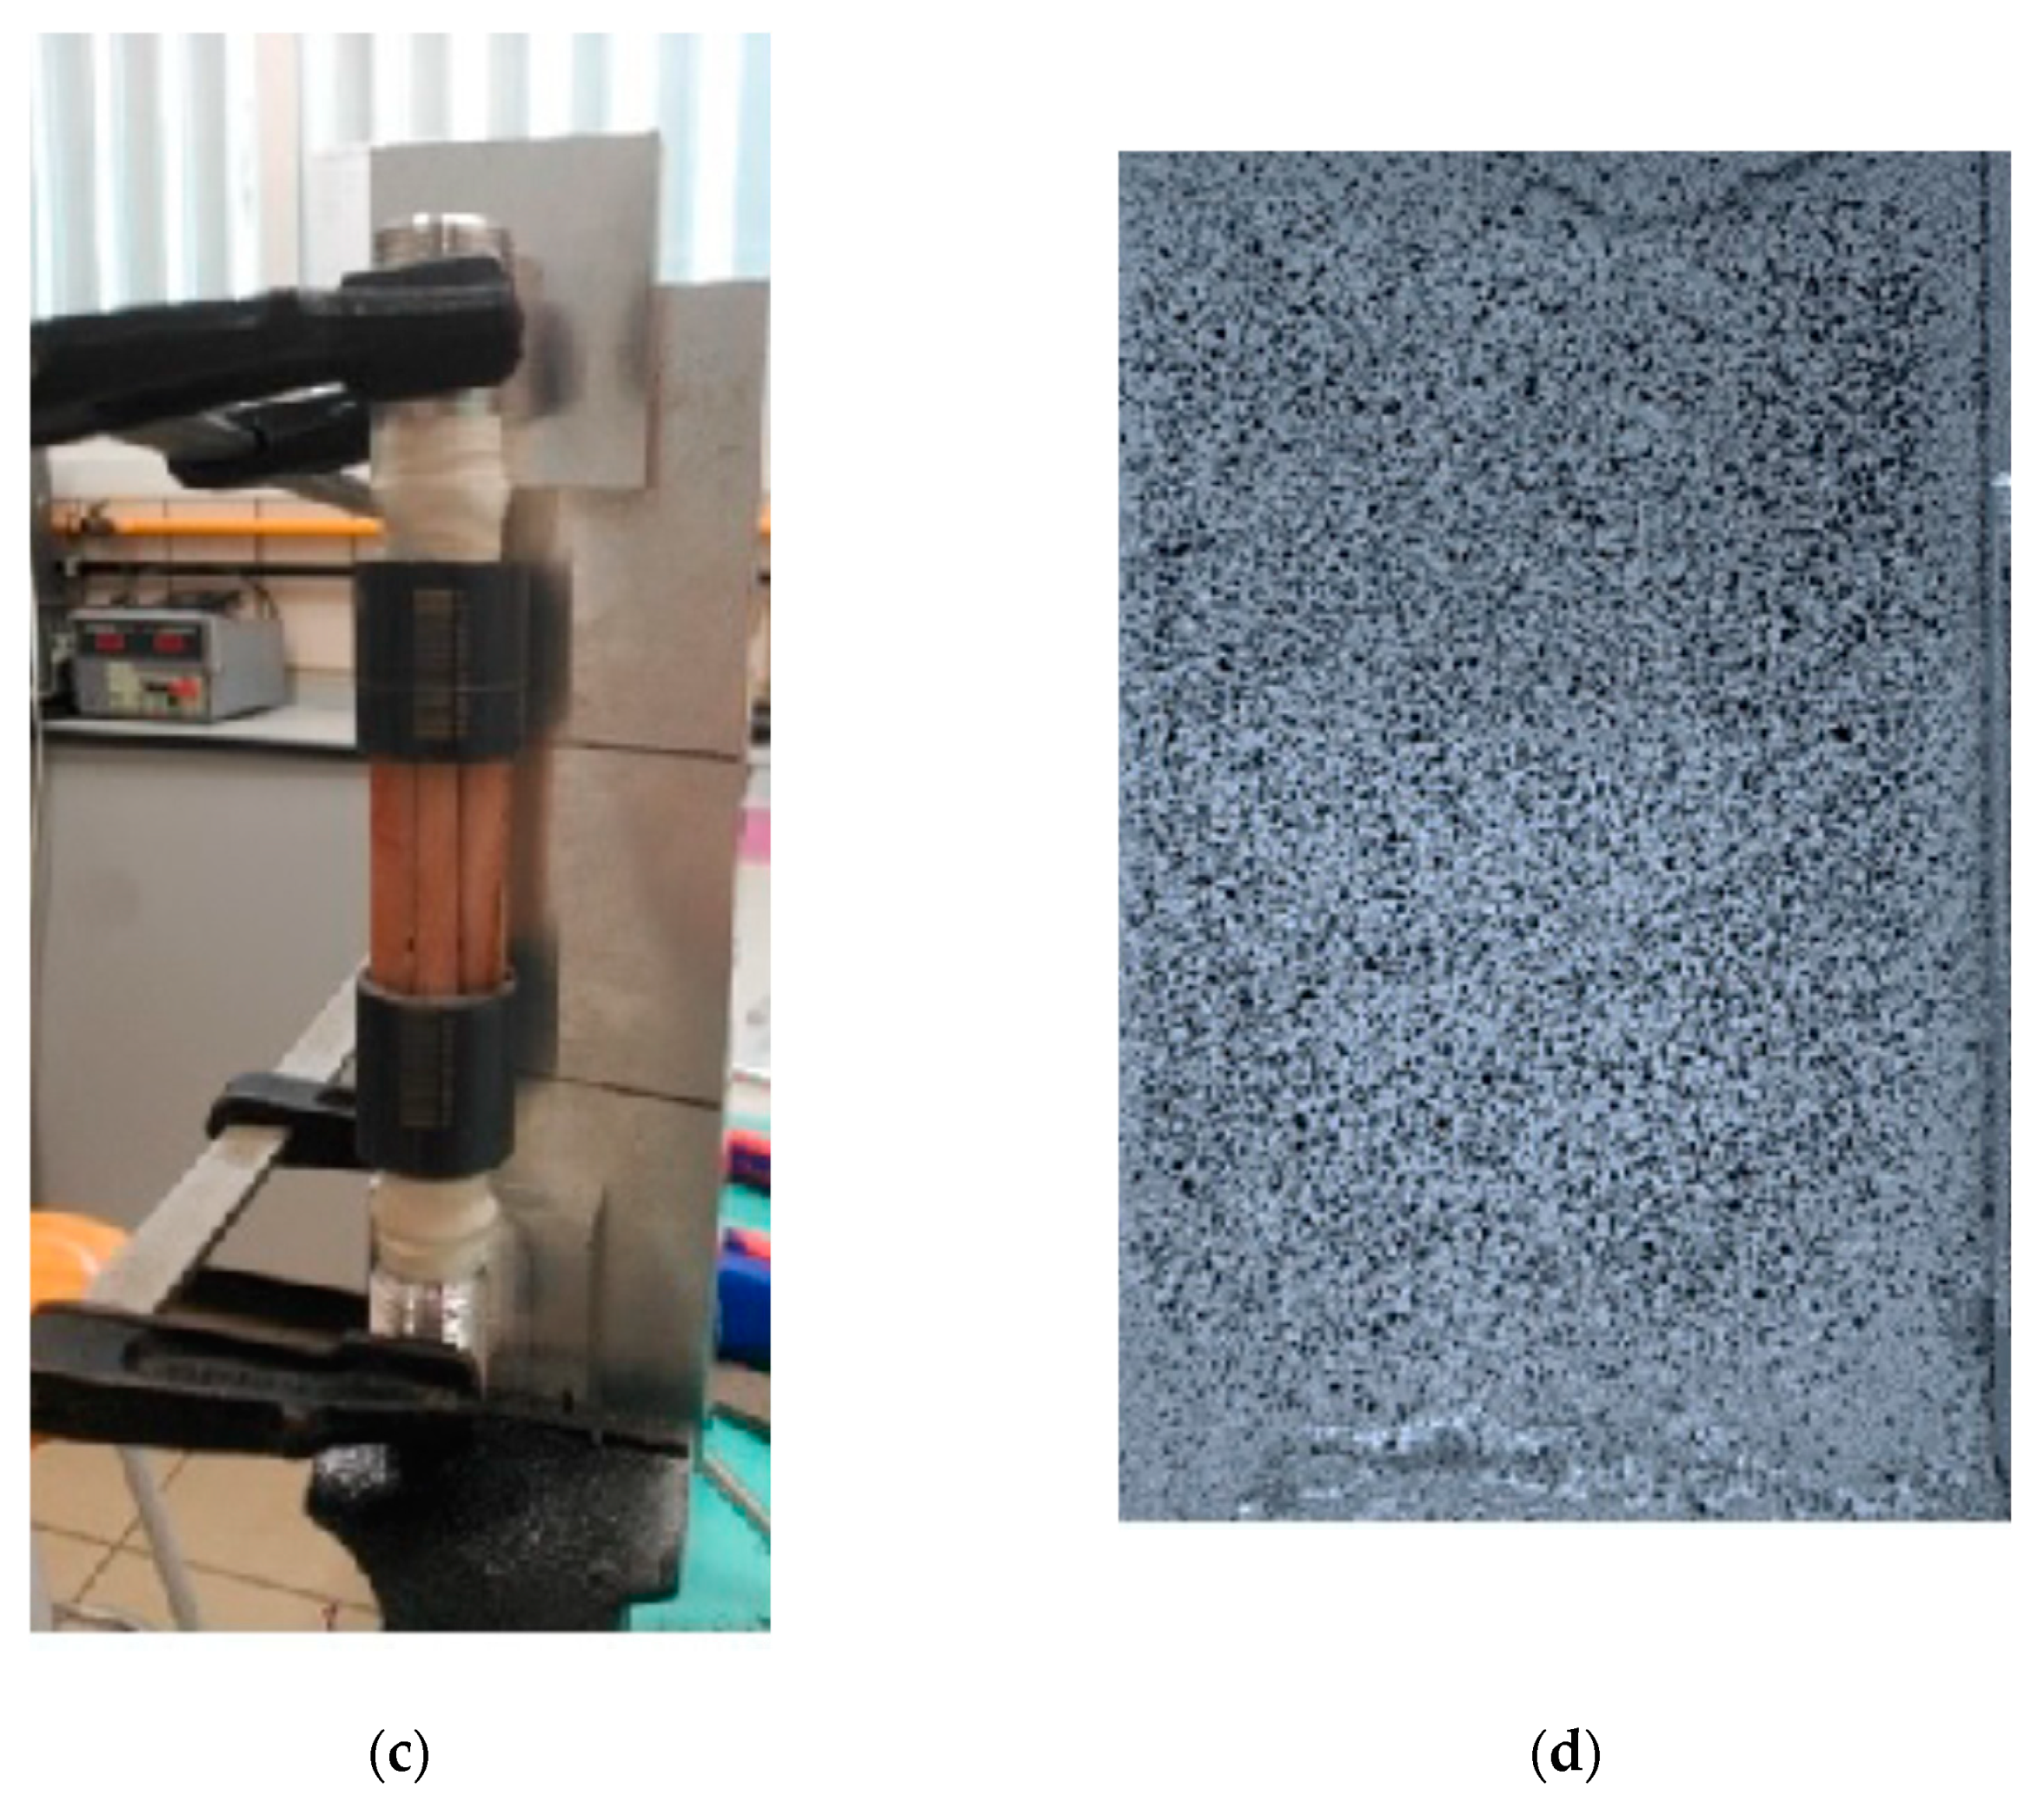
To prepare the bone sample, first, a rectangular bone piece was extracted from the mid diaphysis of the femur, lateral cranial side, by means of a band saw (Figure 1a). Second, the surface of the sample was polished with carbide papers (P600 to P4000). Colloidal silica slurry (0.04 µm) was used for the final polishing step. The sample was cleaned ultrasonically with distilled water between each polishing step. The size of the plane specimen obtained after this stage was 50 × 20 × 4 mm, with the direction of the larger side corresponding to the longitudinal direction of the bone (Figure 1b). Thirdly, the sample bone ends (10 mm approximately) were embedded in Epoxy® resin (Struers Inc, Cleveland, OH, USA) to fix them to the testing machine (Figure 1c). Finally, the spray painting was carried out with black speckles over a bright white background. It can be observed in Figure 1d that the speckles are consistent in size.

2.2. Experimental Tests

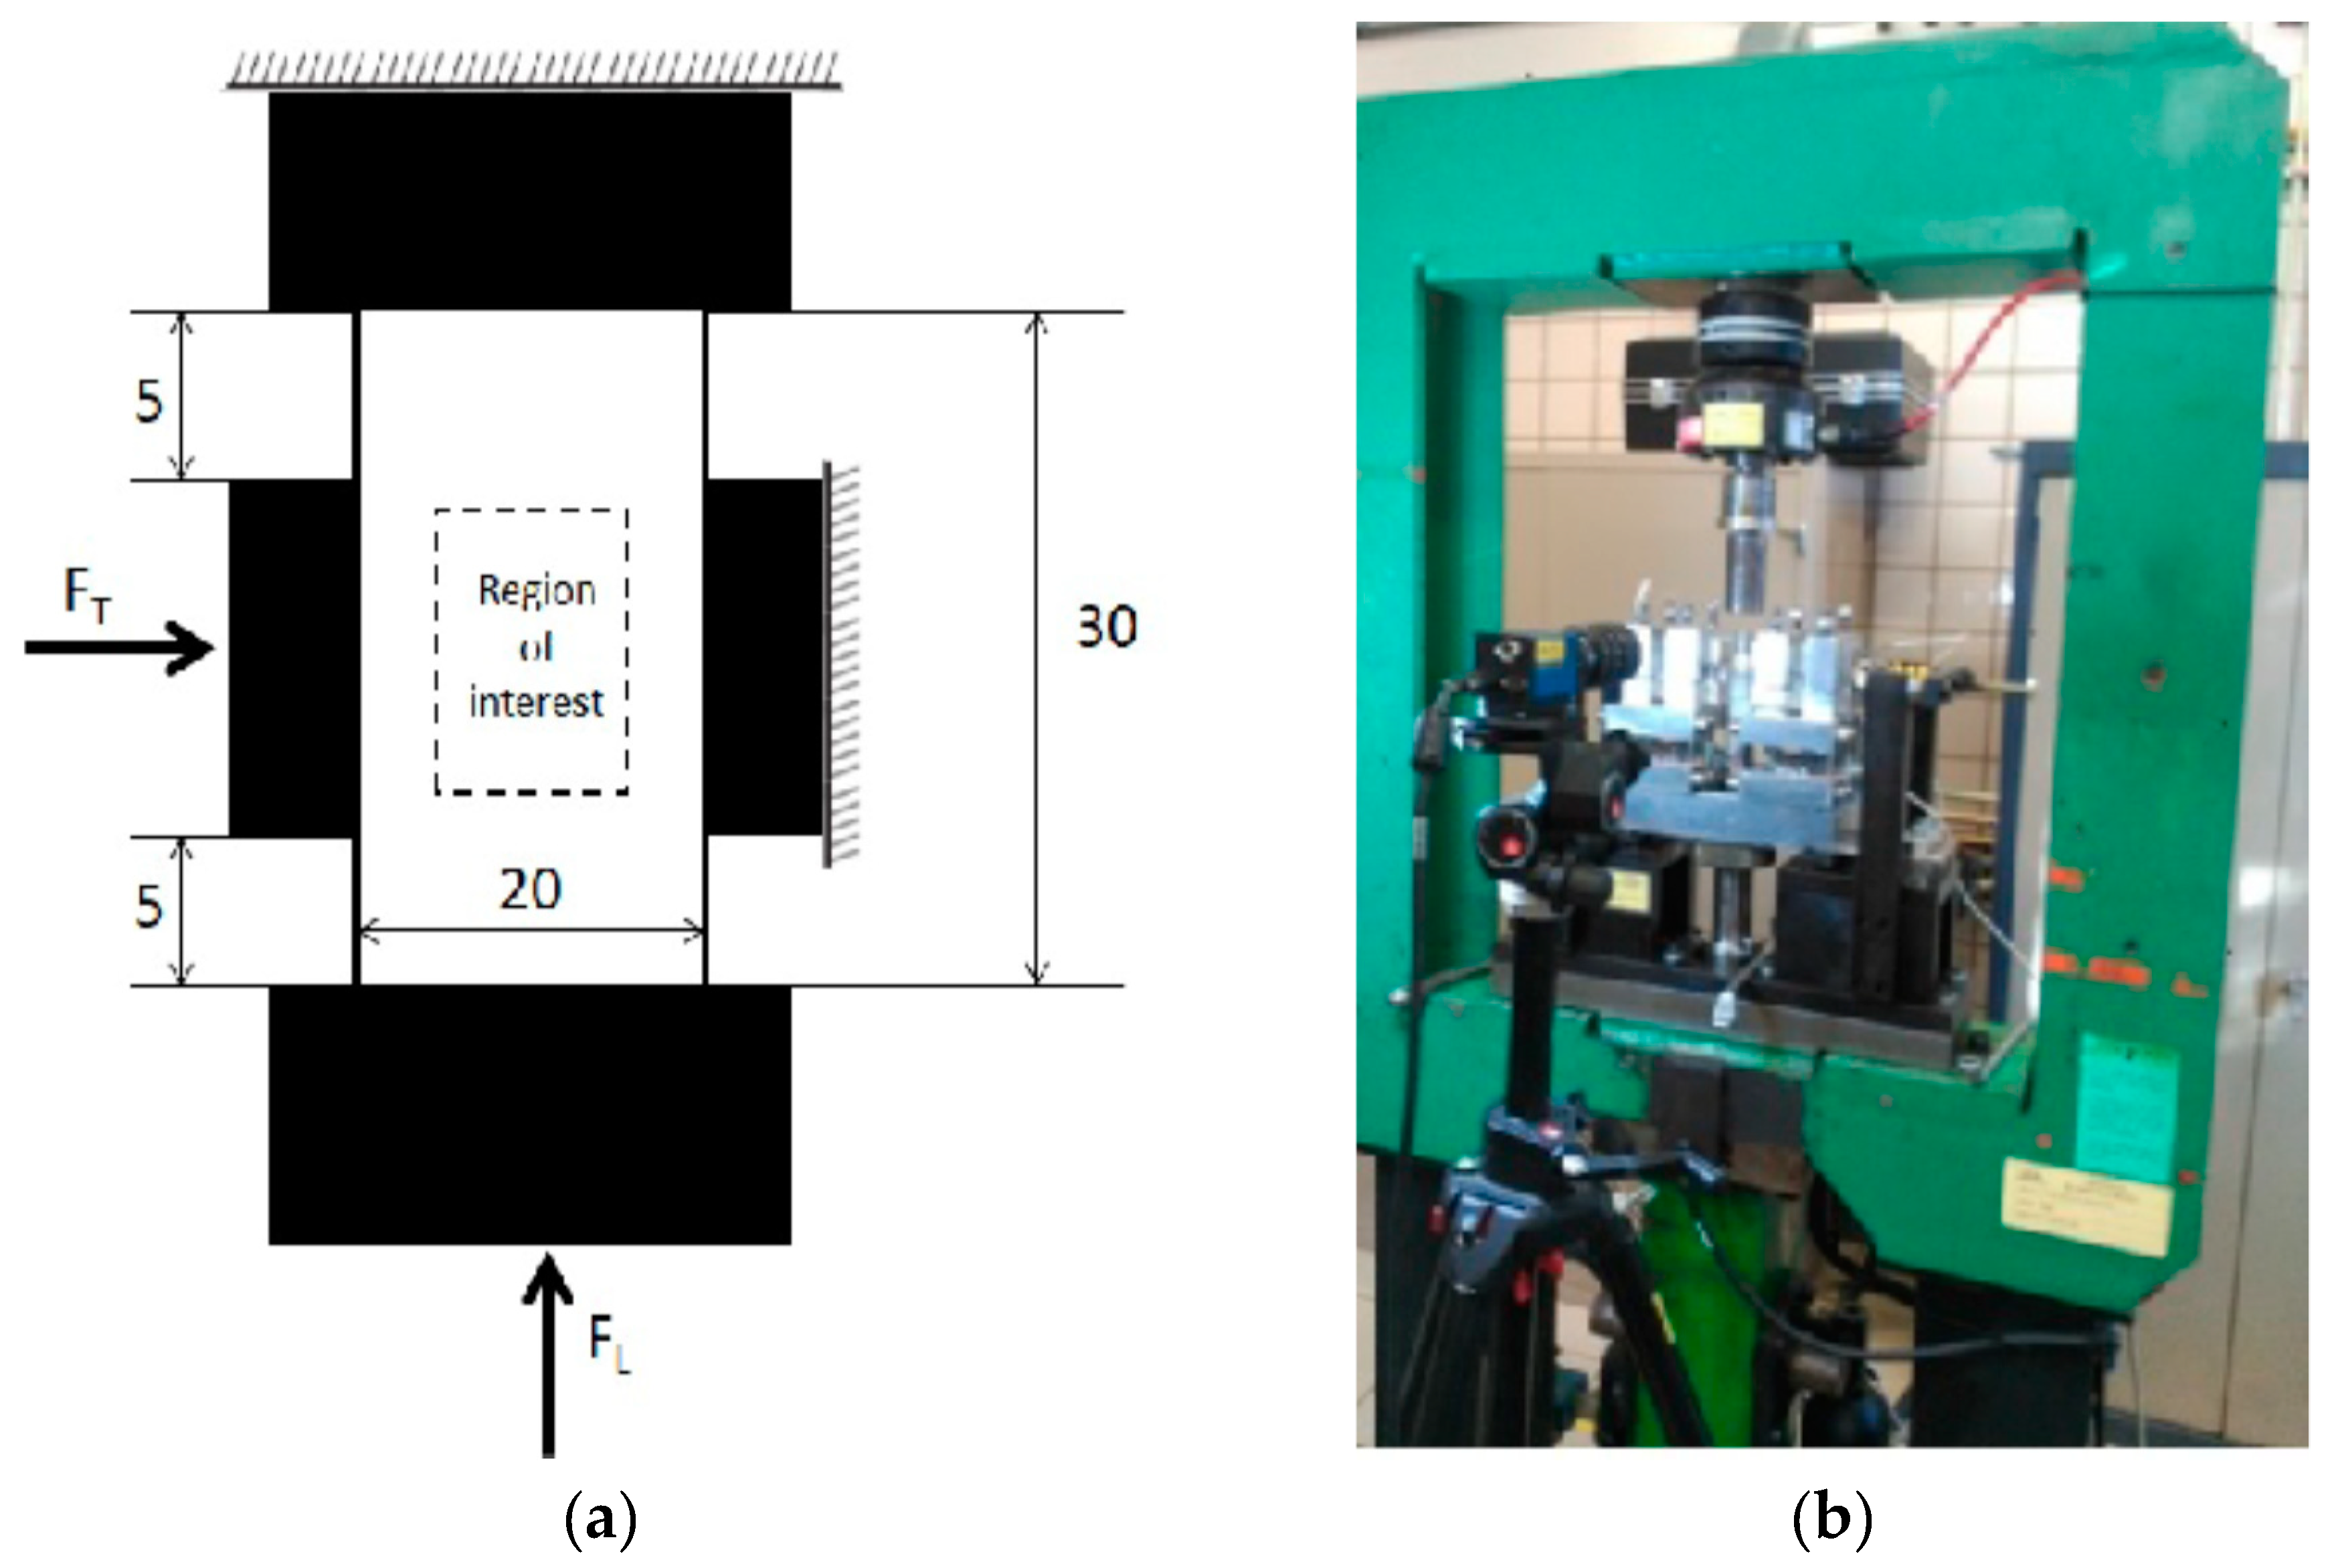
The experimental tests are composed of mechanical tests and strain measurements of the sample. The former consisted of applying both longitudinal compressive (FL) and transversal compressive (FT) forces to the prepared sample (Figure 2a). The FL was applied in the direction of the larger side of the specimen by means of a push-pull testing machine (KEELAVITE® 50 kN) (Figure 2b). This machine consists of a hydraulic actuator directed by an automatic control (MTS 407®), which allows to apply loads up to 50 kN (Figure 2b). The longitudinal system is equipped with an Eaton Lebow 20 Klbf load cell (model: 3174-20K) for force measurement. The piston of the machine, threaded to the inferior end of the sample, compresses the sample, whose superior end is threaded to the fixed frame. In addition, a complementary device [55] allows to apply transversal compressive force (FT) in the mid-section of the specimen as shown in Figure 2a. This device consists of a linear screw type actuator controlled manually [55], in which forces up to 1500 N are measured with a load cell connected in series (Interface 2 Klbf, model: WMC-2000).
A total of eight different loading states were simulated for transversal and longitudinal force values 0, 250 and 500 N as indicated in Table 1. For each loading state, transversal and longitudinal loads were applied from 0 to the desired level of load in static conditions. The load was applied very slowly, below 10 N/s. During load application, the strain in the region of interest was measured as described below. During the 6 h required to complete the test, from the moment that the samples are taken out of the freezer, the sample was not hydrated.
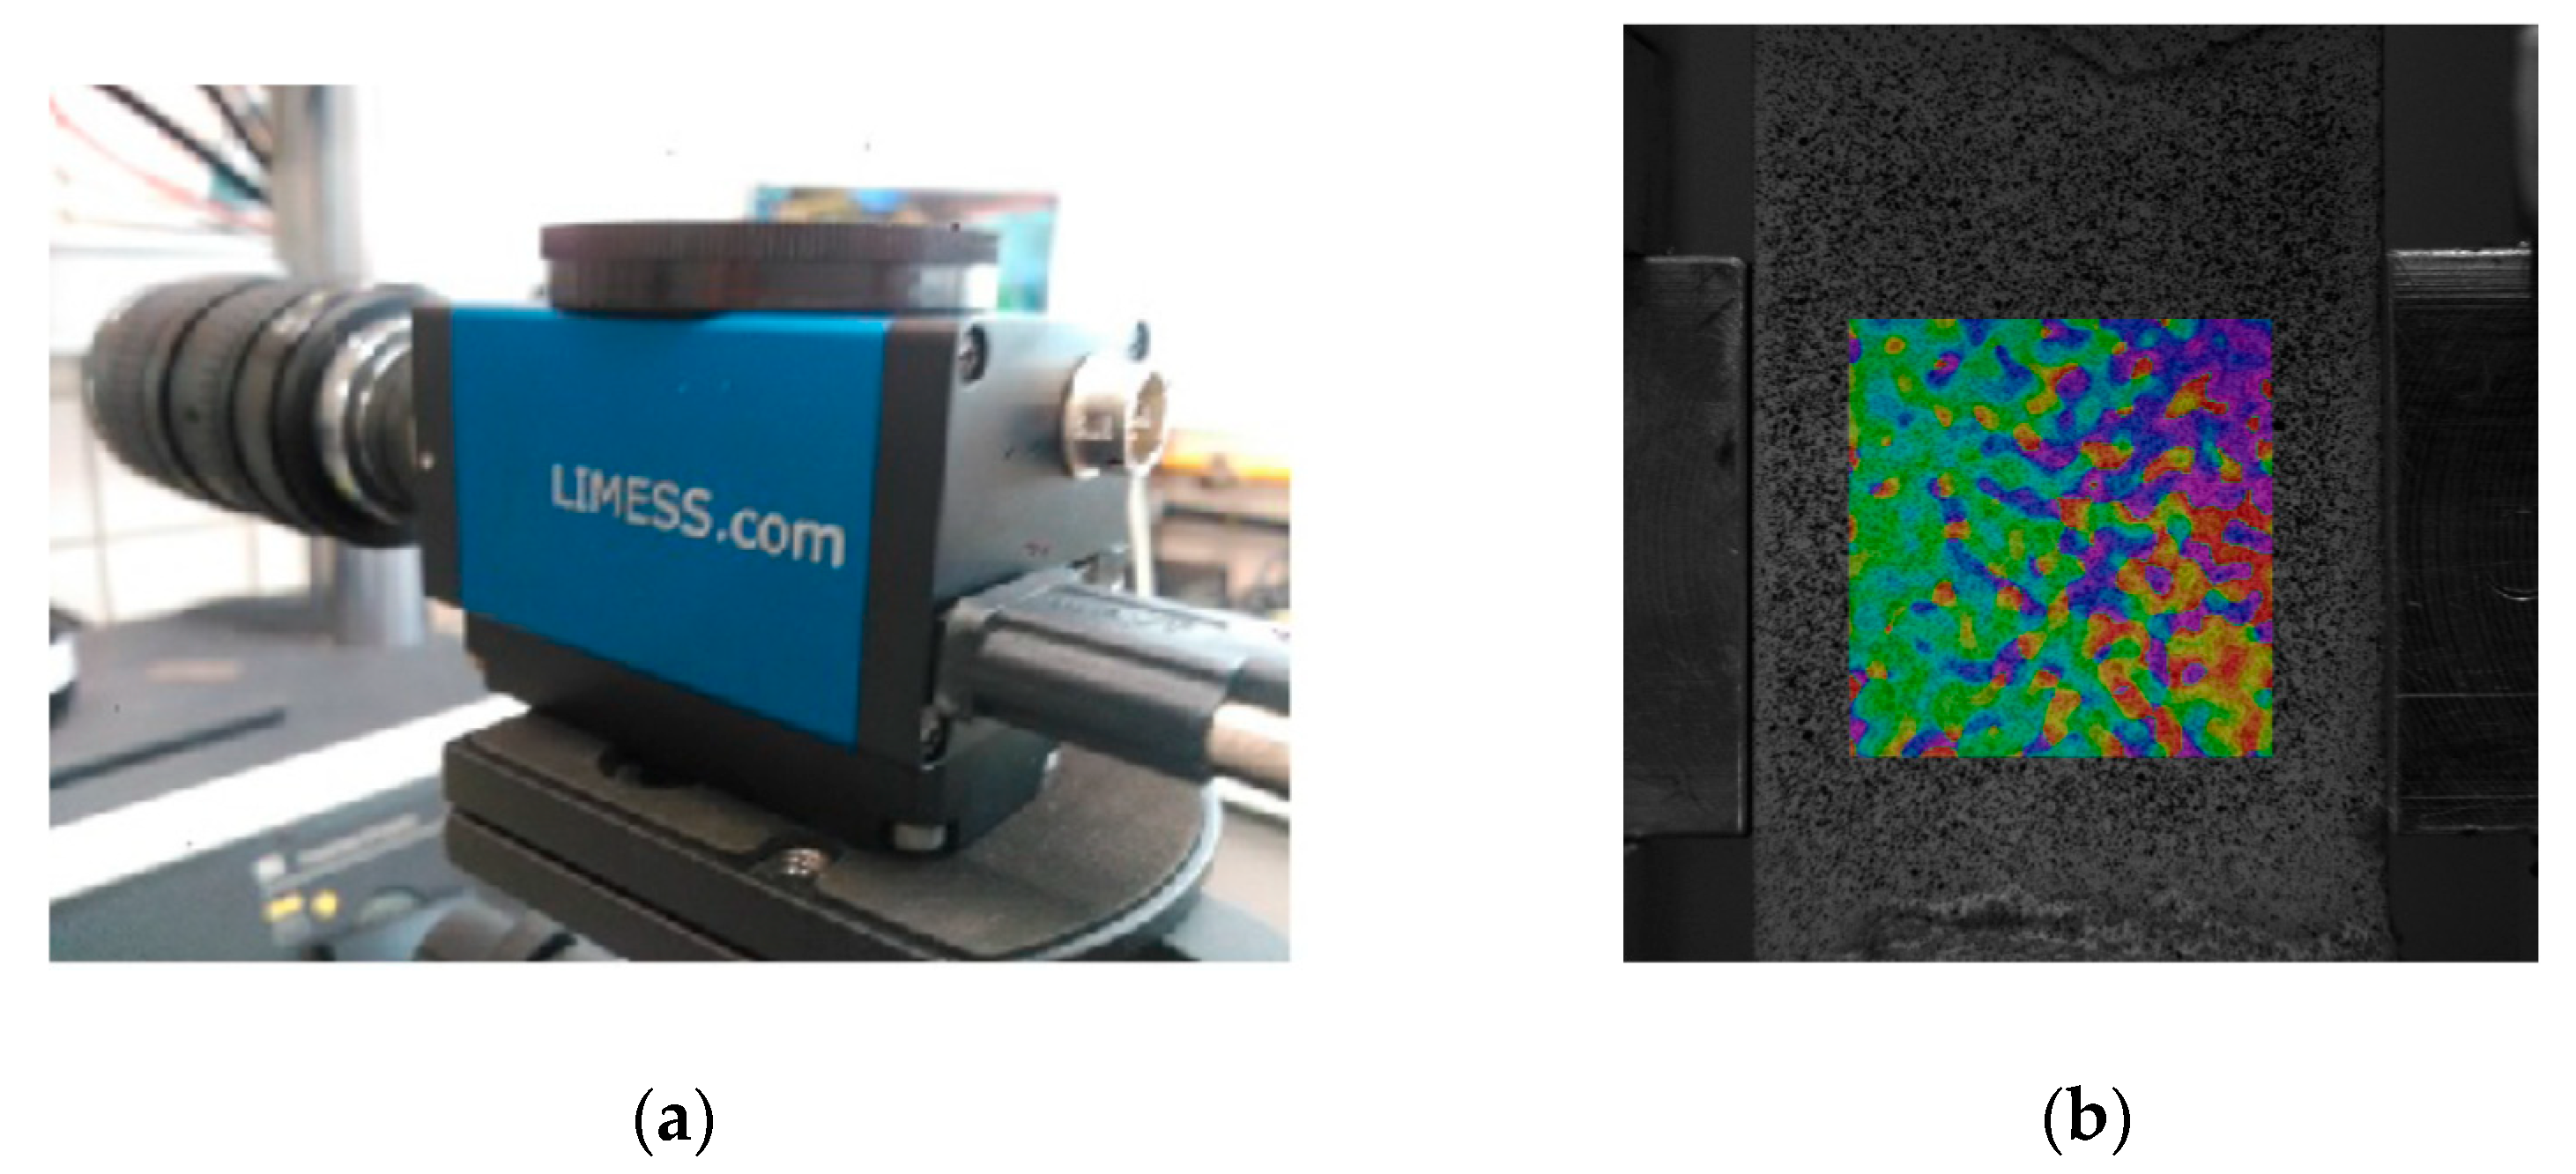
To determine the strain of the bone sample during the biaxial test, an optical non-contact system (Limess®, Q400; Vic Snap Image Acquisition®, version 2010, build 902; and Vic2D 2009®, version 2009.1.0, build 345M) was used (Figure 3a). This system allows to obtain the history of deformations in real time on the outer surface of the sample. Strain measurements were performed in the 10 × 10 mm region of interest located in the middle of the sample (see Figure 2a). The resolution of the system allows to measure strains in points with a separation of 57 µm within the region of interest. It means that the analysed region generates a strain field of around 34,000 points. Strain maps were taken at the loading points selected with the DIC camera, which took pictures of the bone surface every 20 ms (Figure 3b). In addition, a micrograph of the region of interest in the bone sample was carried out for meshing purposes. A high resolution image with a size of 11.63 × 11.8 mm was manually generated from 54 images taken by microscopy with 5× magnification. These images were converted into a finite element model of the mineralised portion of the specimen.

3. Mathematical Approach

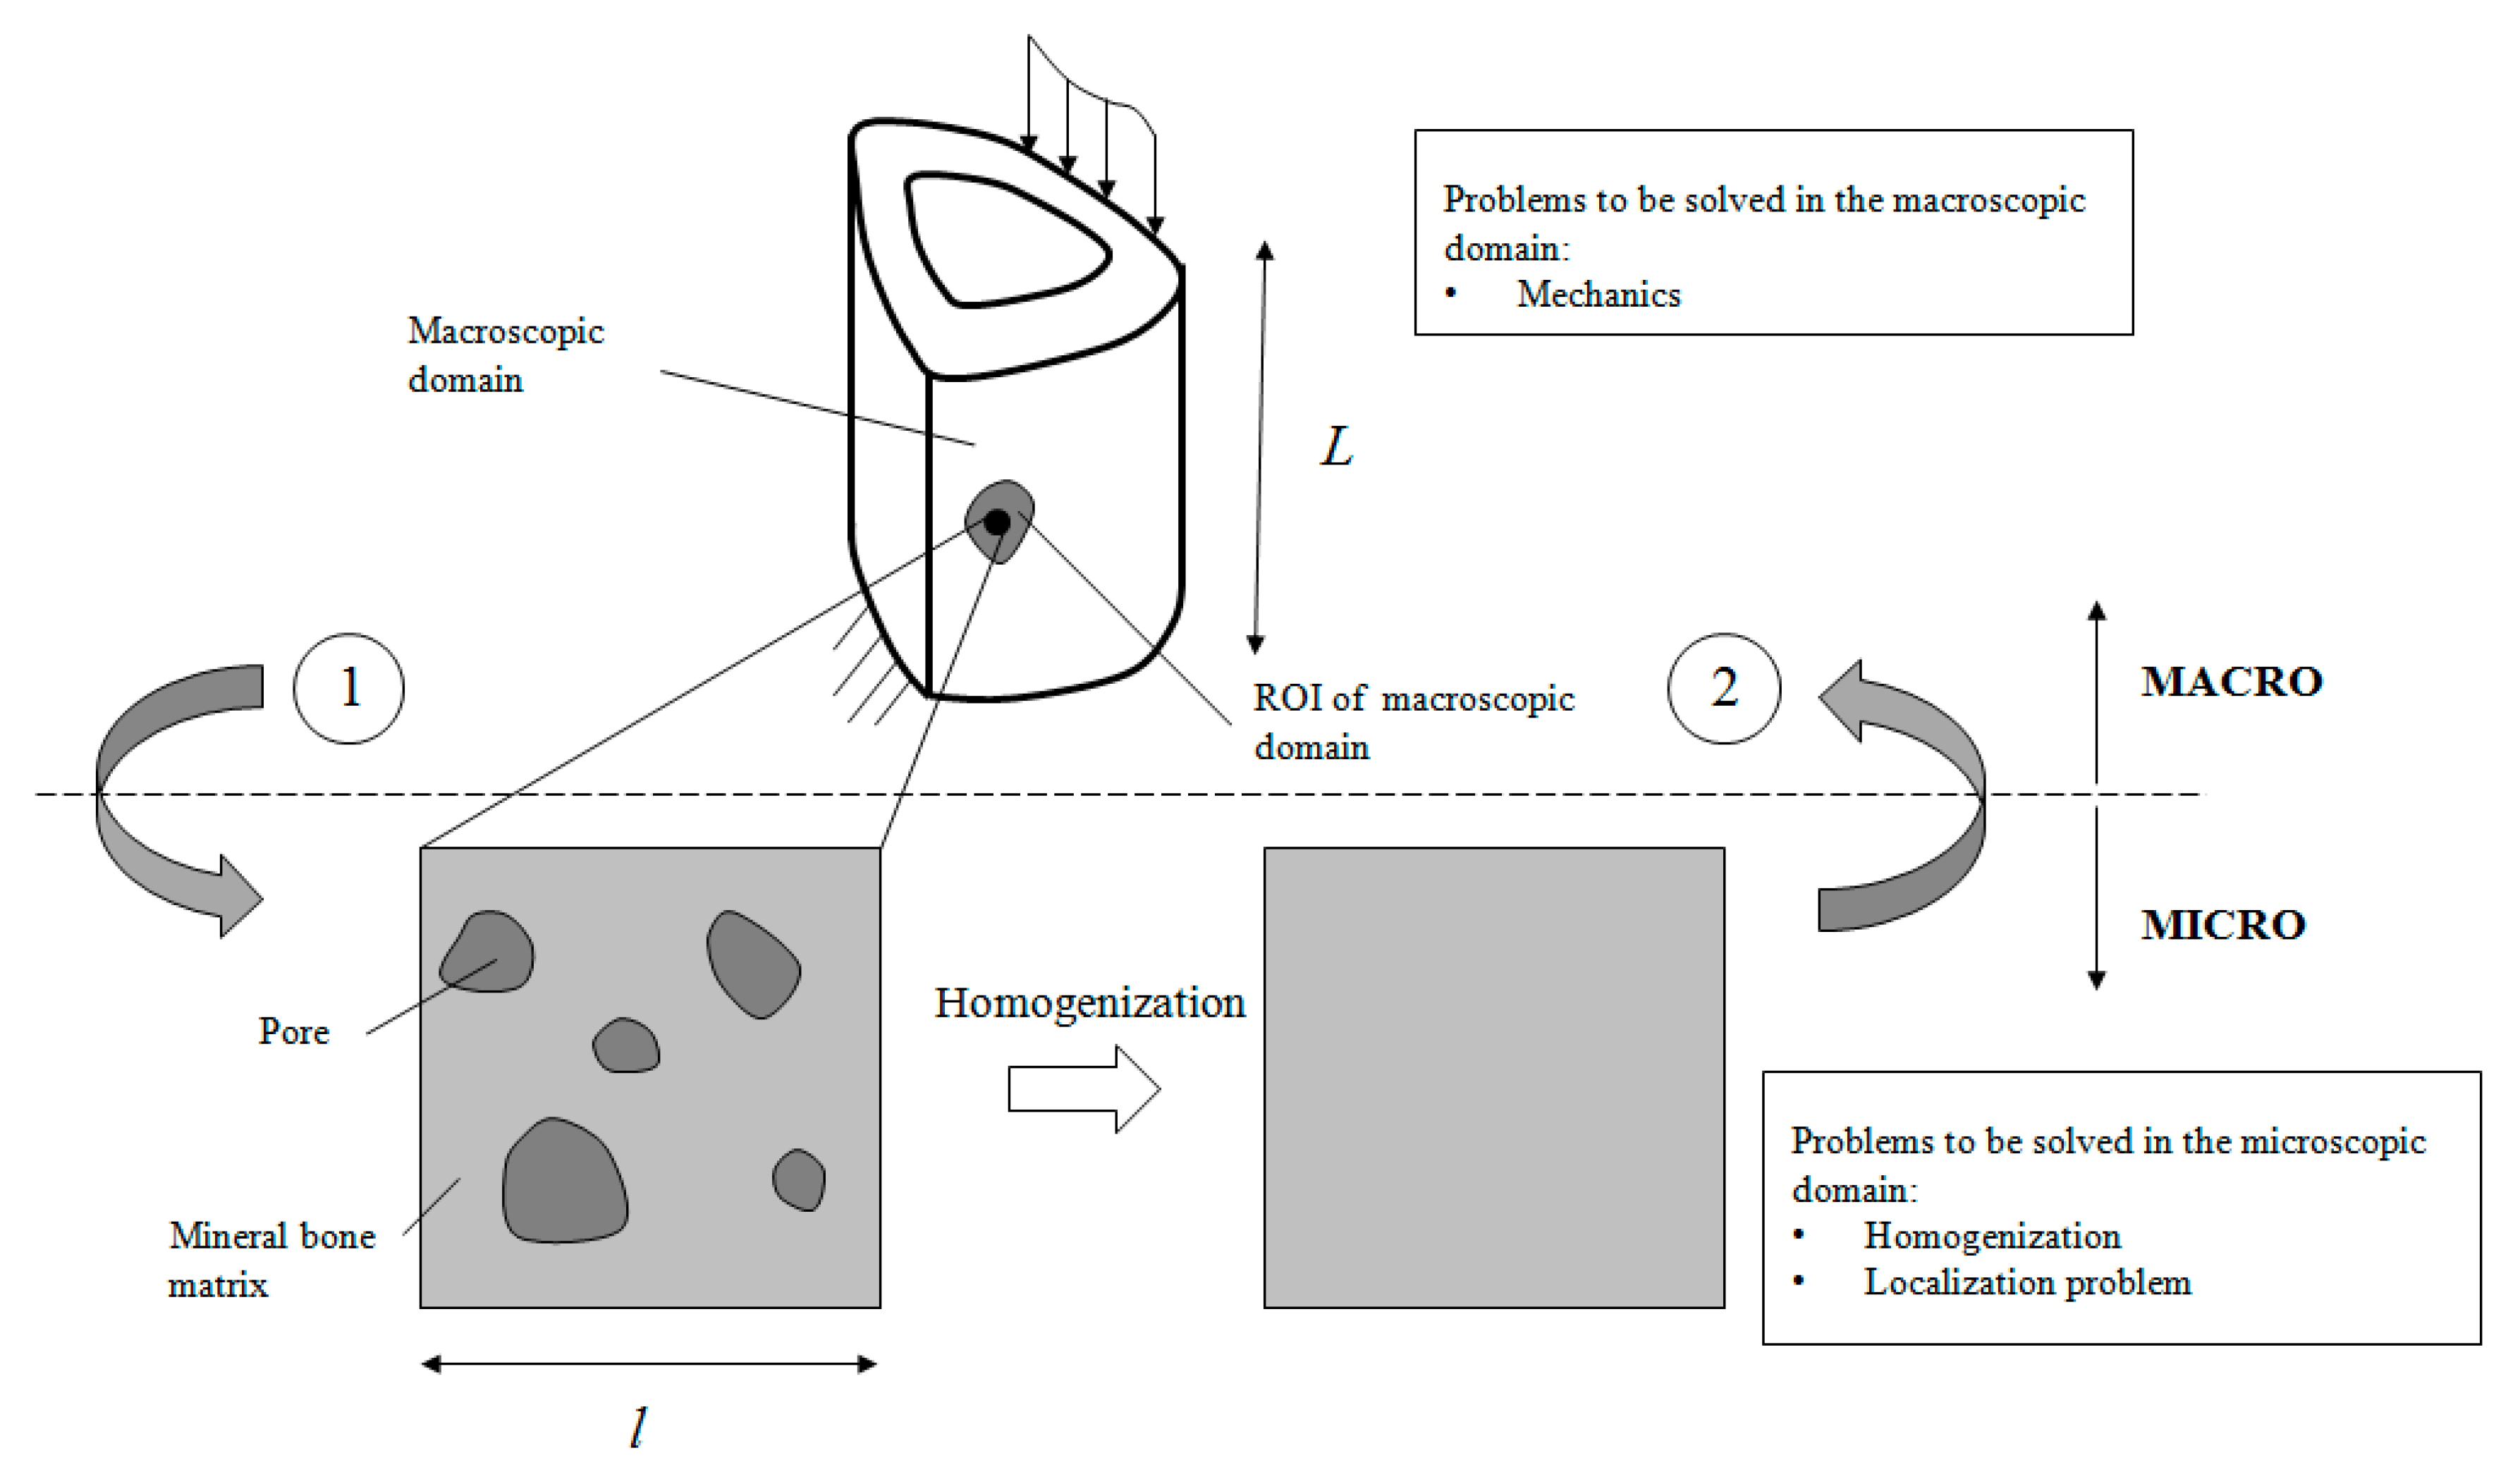
The analysis of heterogeneous media involves two well-distinguished scales: the macroscopic scale ( x ), with characteristic length ( L ) , in which the size of the heterogeneities is very small; and the microscopic scale ( y ), with characteristic length ( ), which is the scale of the heterogeneities. To sustain this statement, we must assume the length separation scale condition, i.e., L . In order to deal with the macroscopic scale as a continuum in a macroscopic material point, the microscopic scale is homogenised in terms of its effective behaviour over a Representative Volume Element (RVE). An RVE must statistically represent the underlying microstructure of the specimen, in such a way that every material point of the macroscopic region is featured by such RVE. Another definition of the RVE may be established as it being the smallest microstructural volume that sufficiently and accurately represents the overall macroscopic properties of interest. The minimum required RVE size also depends on the type of material behaviour, macroscopic loading path and difference of properties between heterogeneities.
In the following, the variable x stands in the homogeneous macroscopic body, whereas y describes the microscopic scale of the RVE. In the microscopic scale, the domain is composed by the (solid or bulk) bone (B) and pore (P) bodies, so that RVE Ω B φ   Ω P φ . The linear elastic equations are posed in the RVE domain to obtain the averaged, apparent or homogenised mechanical properties and the microscopic distribution of the stress and strain fields. Then, the primary variables are asymptotically expanded as:
u φ = u 0 ( x ) + φ u ( x , y )
where u φ is the total displacement field, u 0 is the associated field variable averaged at the macroscopic scale and u is the perturbation (oscillating) functions due to the heterogeneity of the microscopic scale. In Equation (1), φ = / L refers to the ratio between the microscopic and macroscopic levels.
For averaging the macroscopic fields, the following operator is defined over a microscopic volume generally denoted by Θ :
= 1 | Θ | Θ d Θ
This expression enables us to obtain macroscopic quantities and, eventually, the macroscopic response (behaviour) induced by the underlying microstructure. This approach is called homogenisation. The inverse procedure, localisation, allows to determine the microscopic values from the macroscopic ones. Both are outlined below.

3.1. Localisation

The linear, elastic, microscopic problem in the absence of body loads reads as:
· σ φ = 0 ε φ = 1 2 ( u φ + ( u φ ) T ) σ φ = φ ε φ ε φ = ε 0
There is an absence of boundary conditions in Equation (3). These boundary conditions must reproduce, as closely as possible, the in situ state of the RVE inside the material. Therefore, they strongly depend on the choice of the RVE itself, and particularly on its size. Amongst the classical boundary conditions considered in the literature (see Suquet [56] for further reading), Dirichlet boundary conditions are used in our problem:
u φ = u 0   on Ω S φ
Then, the local strain ε φ ( u φ ) is split into its average and fluctuating term so that:
ε φ ( u φ ) = ε 0 + ε φ ( u ) ε φ ( u ) = 0
Let Equation (5) be substituted into the equilibrium (divergence free) equation of the stress tensor (see Equation (3)), namely:
· ( φ ε φ ( u ) ) = · ( φ ε 0 )   in   Ω S φ ( y ) + boundary   conditions
where the boundary conditions are related to Equation (4). By virtue of the linearity of the problem, the solution of ε φ ( u ) in Equation (3) for a general macro strain ε 0 may be expressed as the superposition of elementary unit strain solutions ε φ ( χ k h ) [56], such that:
ε φ ( u ) = ε k h 0 ε φ ( χ k h )
where χ k h are the displacements associated to those elementary strain states denoted by indices k h resulting from the solution of Equation (3).
By substitution of Equation (7) into Equation (5), the micro-strains are expressed as:
ε φ ( u φ ) = ε k h 0 ( I k h + ε φ ( χ k h ) )
where I k h is the identity fourth order tensor with components I k h = ( I i j ) k h = 1 / 2 ( δ i k δ j h + δ i h δ j k ) . Equation (8) allows us to obtain the microstructural distribution of the strain field, under the aforementioned hypothesis and once the boundary conditions are established through the macroscopic ones.

3.2. Homogenisation

Once the elementary solutions ε φ ( χ k h ) are obtained through (8), the macroscopic stress-strain relationship is directly obtained:
σ 0 = σ φ ( u φ ) = φ ε φ ( u φ ) = φ ( I k h + ε φ ( χ k h ) ) : ε 0
Consequently, at the macroscopic scale, the elasticity tensor is identified in Equation (9) as:
0 = φ ( I k h + ε φ ( χ k h ) )

3.3. Variational Formulation

Using the standard formulation, the variational form of Equation (6) yields to [56]:
Ω S φ ε φ ( w ) : ( φ ε φ ( u ) ) d y = Ω S φ ε φ ( w ) : ( φ ε 0 ) d y w ( y ) V Y
where the space V Y is defined as:
V Y : { w   |   w   H 1 ( Ω S φ ) }
with H 1 ( Ω S φ ) as the first-order Sobolev space. Using (7), Equation (11) can be further developed, namely:
Ω S φ C i j p q φ χ p k l y q ω i y j d y = Ω S φ C i j k l φ ω i y j d y
χ p k l represents the characteristic microstructure displacement at p directions due to an applied k l unit strain, being k = l normal unit strain states and k l shear unit strain states. ω i represents a virtual displacement. There are three total strain states (two normal and one shear, assuming plane stress two-dimensional (2D) modelling) corresponding to the three linear equations above (Equation (13)). Once these functions are obtained, the macroscopic stiffness tensor can be computed through Equation (10).

3.4. Multiscale Approach

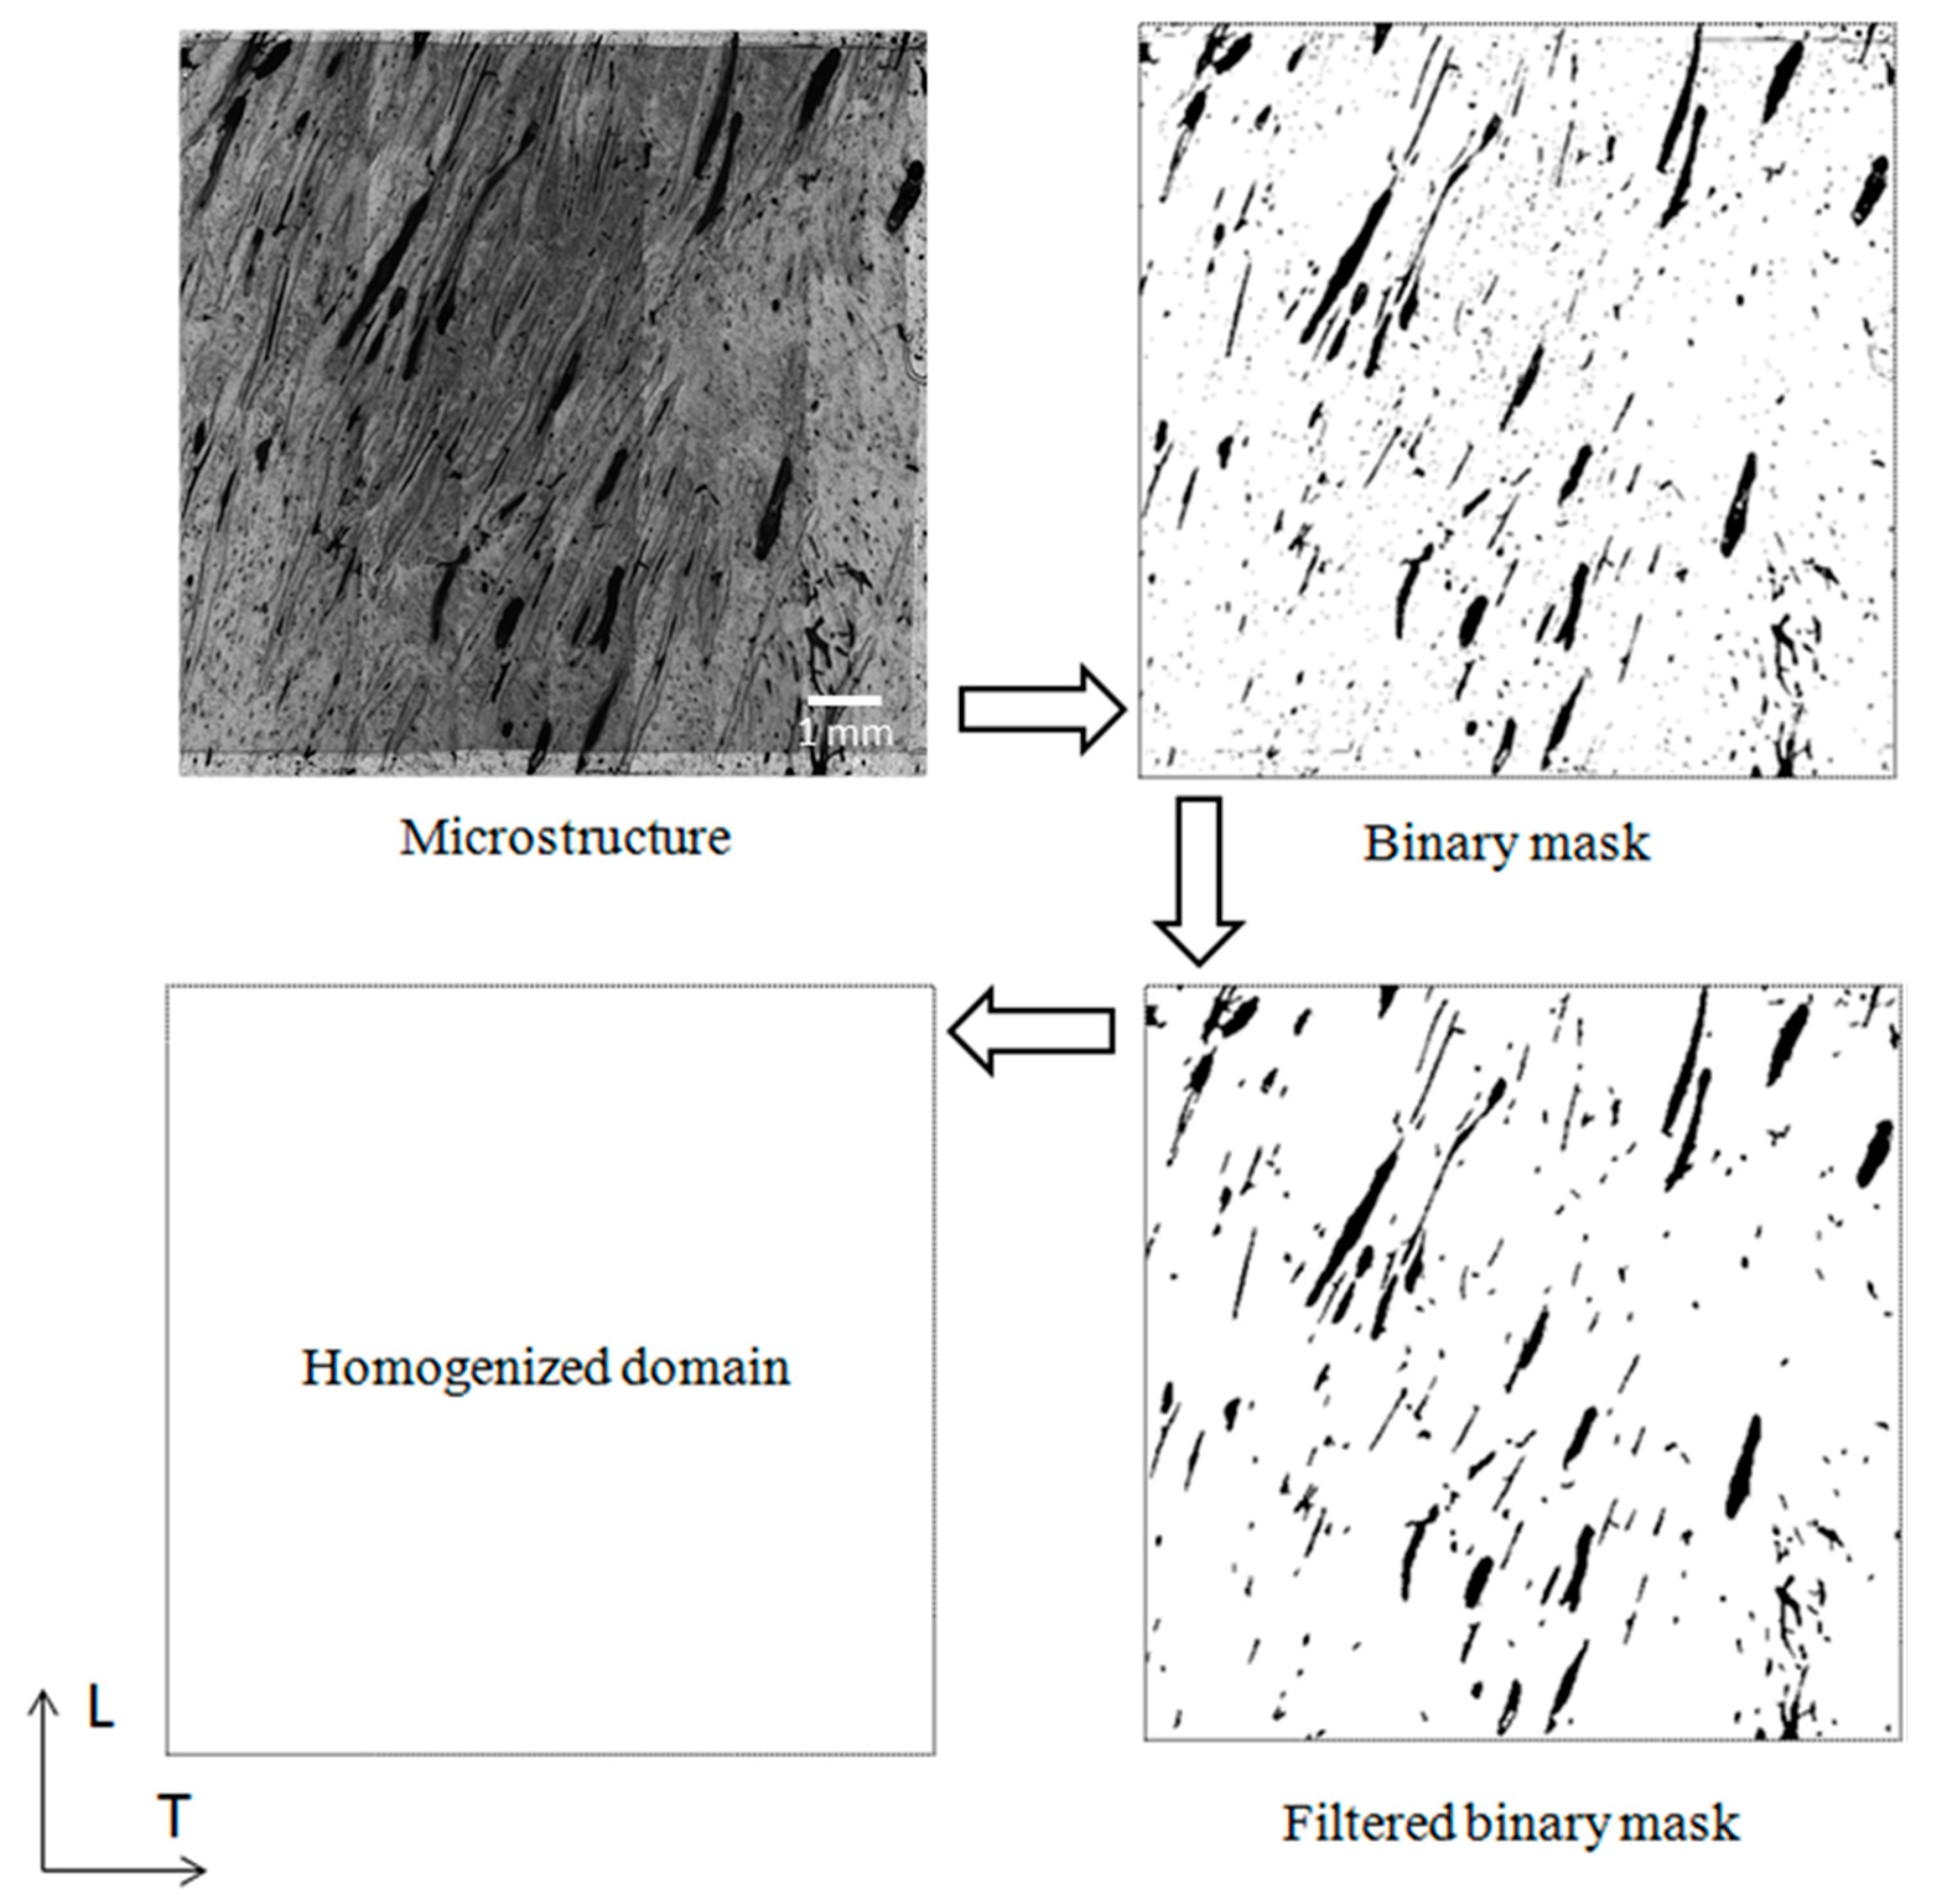
The multiscale analysis of the cortical bone tissue proceeds as follows. First, at the microstructural level, the overall, apparent or homogenised properties of the macroscopic cortical bone tissue are obtained by solving the homogenisation problem, i.e., Equation (10) in the microscopic domain. The input data to solve this problem are the microstructural domain of the cortical bone tissue (Figure 4) and the mechanical properties of the mineral bone material, which are a parameters to be fitted as explained in Section 4.2.
Second, using the obtained homogenised mechanical properties, the mechanical problem is then solved at the macroscopic domain for a given loading state. Finally, strain and displacement macroscopic quantities, associated to such a loading state, are passed to the microstructure where the localisation problem is solved.
Macro and micro variables are recorded from the macroscopic and microscopic localisation problems, respectively. A sketch of the multiscale procedure can be seen in Figure 5. The details of the computational implementation can be found, as an example, in Yuan and Fish [57].

4. Results

4.1. Computational Models

Two different levels of analysis are considered in the present multiscale approach of cortical bone tissue modelling and simulation.
First, at the macroscopic level, the experimental setup shown in Figure 2a is modelled. The model was solved using the software Abaqus Simulia® v6.17 and modelled under the plane stress hypothesis so that a 2D geometry is considered. Bilinear quadratic (plane stress) elements were selected. The model resulted in 2846 nodes and 2737 elements. Load boundary conditions are applied along the left and bottom regions of the specimen as shown in Figure 2a. Moreover, normal displacements are prescribed along the right and top regions (Figure 2a).
Second, a finite element model was developed for the microstructure presented in the region of interest (see Figure 2a). First, the microstructure image was converted into a grey level image. Then, a binary mask was created and filtered using a filter of 5 pixels (i.e., objects smaller than 5 × 5 pixels are removed). Pixels of the filtered mask were converted then to a regular quadrilateral finite element mesh with a resolution of 1358 × 1358 pixels. Matlab® R2017a was used during this process. Dirichlet boundary conditions were applied along the boundary of the domain, as a hypothesis, following the micromechanics theory [56]. The workflow of the methodology is summarised in Figure 5.

4.2. Homogenisation Macrostructural Results

4.2.1. Homogenisation

The model of the microstructure of the cortical bone tissue (see Figure 4), was used to solve the micromechanics equations presented in Section 3.2, under the finite element framework, with the objective of obtaining the homogenised mechanical properties tensor (Equation (10)) from the micromechanical analysis of the microconstituents of the microstructure.
The microstructure of the cortical bone was considered to be composed of mineral bone material and pores (voids). Mineral bone is considered at the observation scale of our model as a homogeneous material with orthotropic (2D) mechanical behaviour along the longitudinal and transversal directions, according to the literature [58,59]. After a fitting iterative procedure of the experimental results (introduced and explained below), the following values were obtained for the mechanical behaviour of bone mineral tissue: EL = 20 GPa, ET = 48 GPa, GLT = 12.5 GPa and υLT = 0.395. These mechanical properties are associated to the following orthotropic tensor:
φ = [ 77.0 30.4 0 30.4 32.0 0 0 0 12.5 ]   [ GPa ]
Therefore, after the homogenisation procedure, the macroscopic (or apparent) mechanical properties tensor yields to:
0 = [ 23.13 8.63 1.01 8.63 19.54 0.91 1.01 0.91 6.90 ]   [ GPa ]

4.2.2. Macrostructural Results

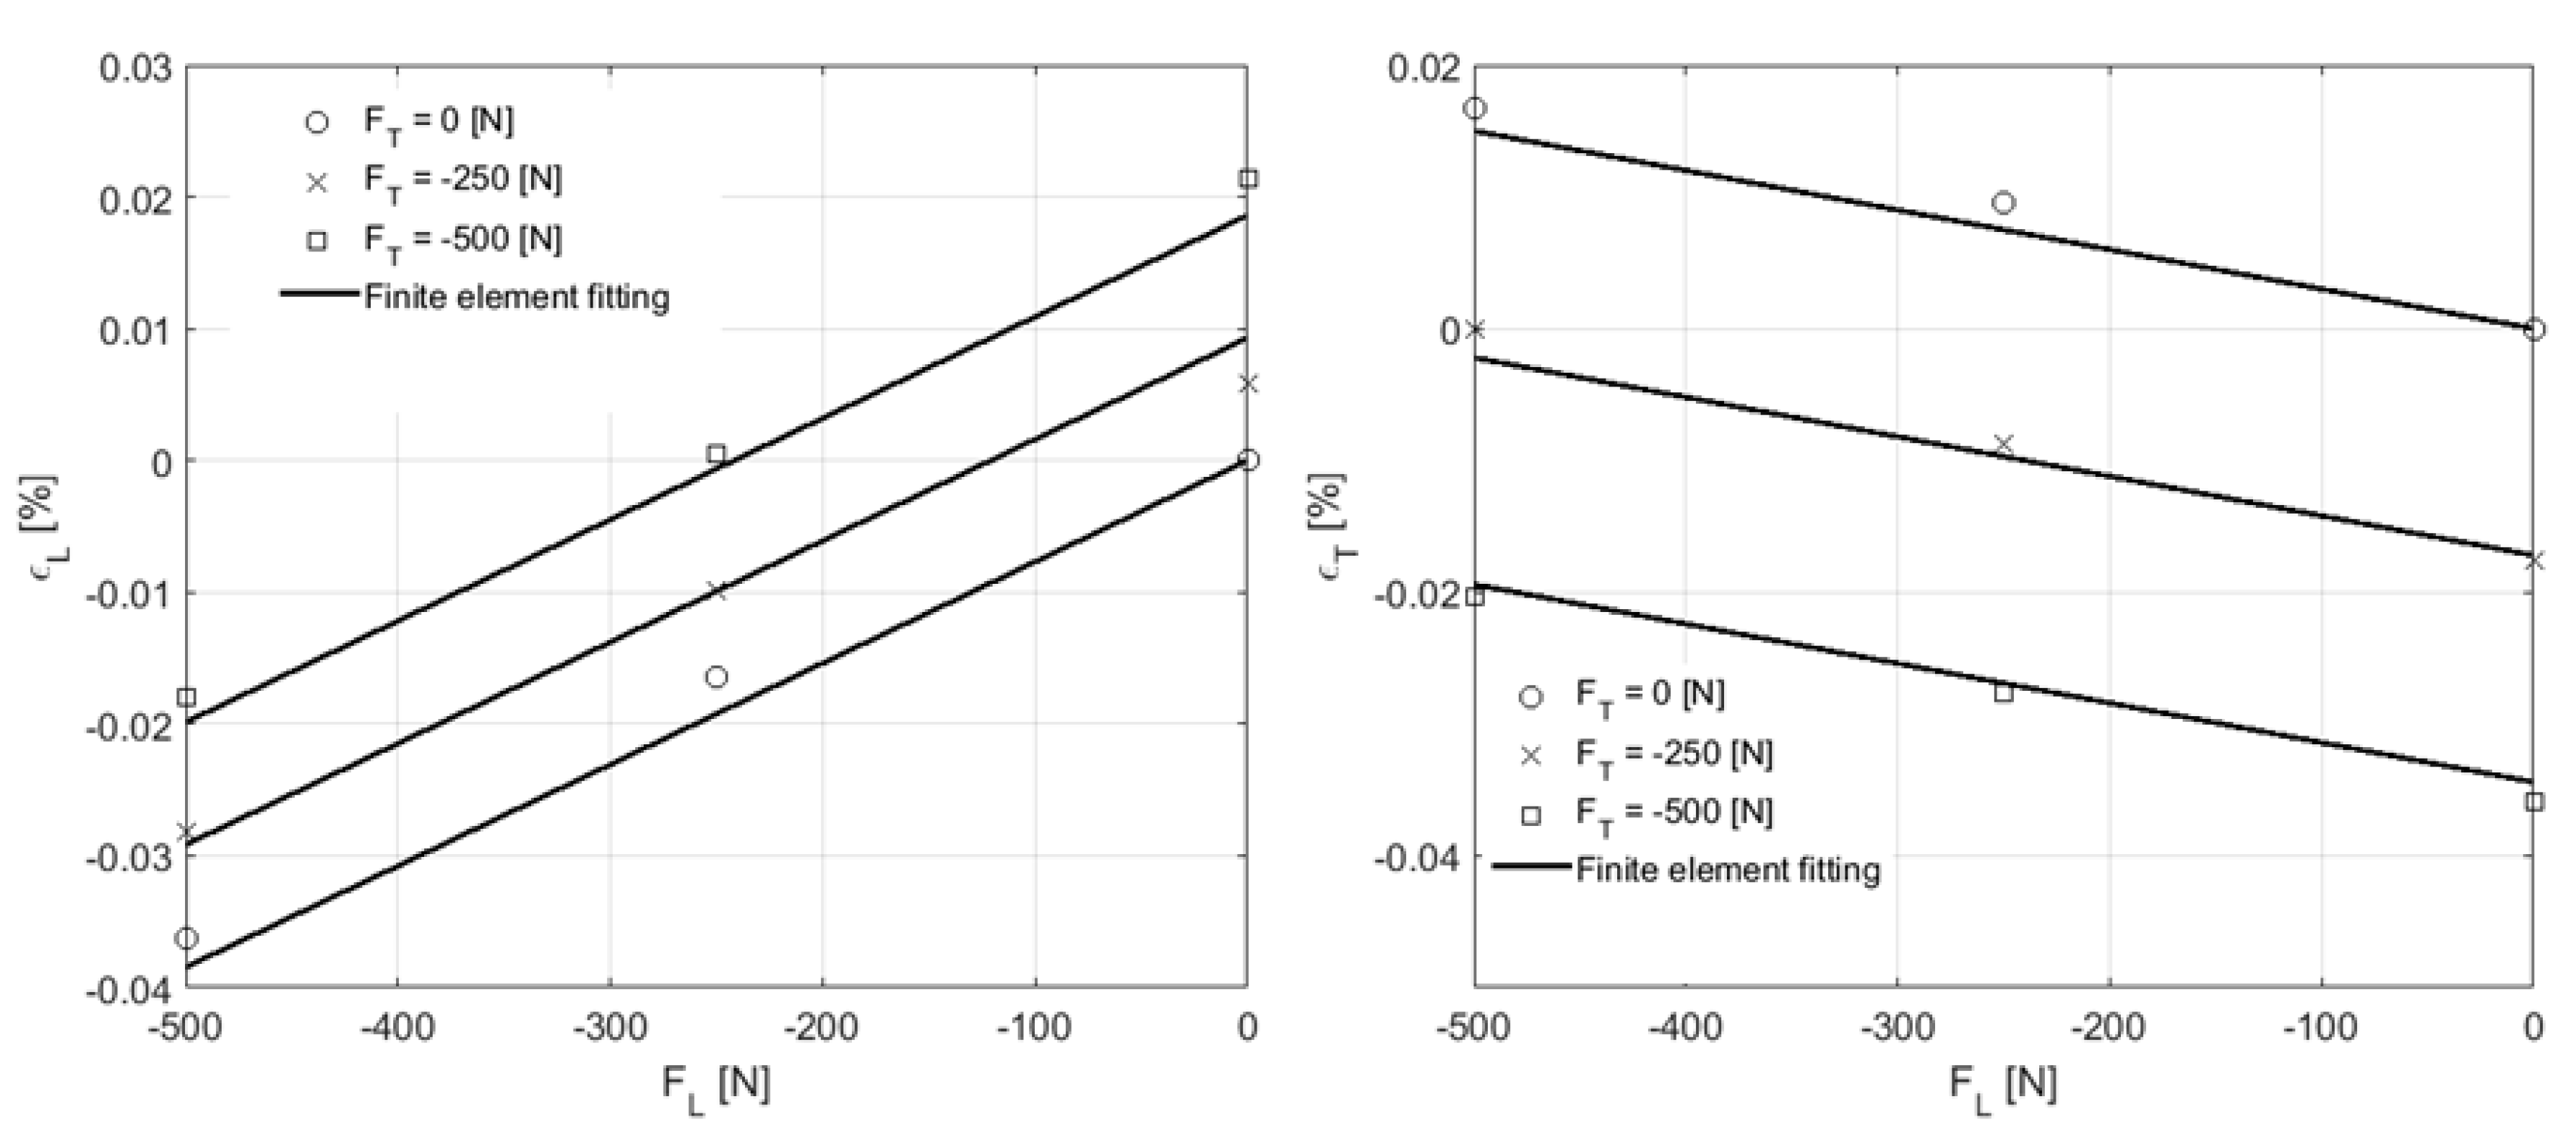
The experimental mechanical tests (see Figure 2) provided the macroscopic results (averaged in the region of interest shown in Table 1. These results are the basis for fitting the mechanical properties of the mineral bone tissue iteratively as follows:
(i)
Choose values for the mechanical properties of the mineral bone tissue (assumed as orthotropic).
(ii)
Solve the homogenisation problem in the microstructural domain (Figure 4) and obtain the (homogenised) macroscopic mechanical properties.
(iii)
Solve the macroscopic problem shown in Figure 2a. At the macroscopic level, bone is assumed as a homogeneous continuum medium with macroscopic (homogenised) mechanical properties derived from the micromechanics analysis of the microstructure (ii).
(iv)
Obtain the average for the solution of the macroscopic problem along the ROI and compare results with Table 1.
The iterative process converged to values of the mechanical properties of the bone mineral tissue and macroscopic cortical bone tissue shown in Equations (14) and (15), respectively. The fitting of the numerical results versus the experimental ones is plotted in Figure 6.

4.3. Multiscale Results

As we have discussed throughout the paper, the proposed multiscale approach allows to obtain both the macroscopic (mechanical) solution of the problem at hand, as well as the distribution of mechanical variables along the domain of the microstructure. Therefore, micromechanical variables are recovered in the microstructure following the localisation procedure introduced in Section 3.1. On the other hand, multiscale results are obtained according to Section 3.3.
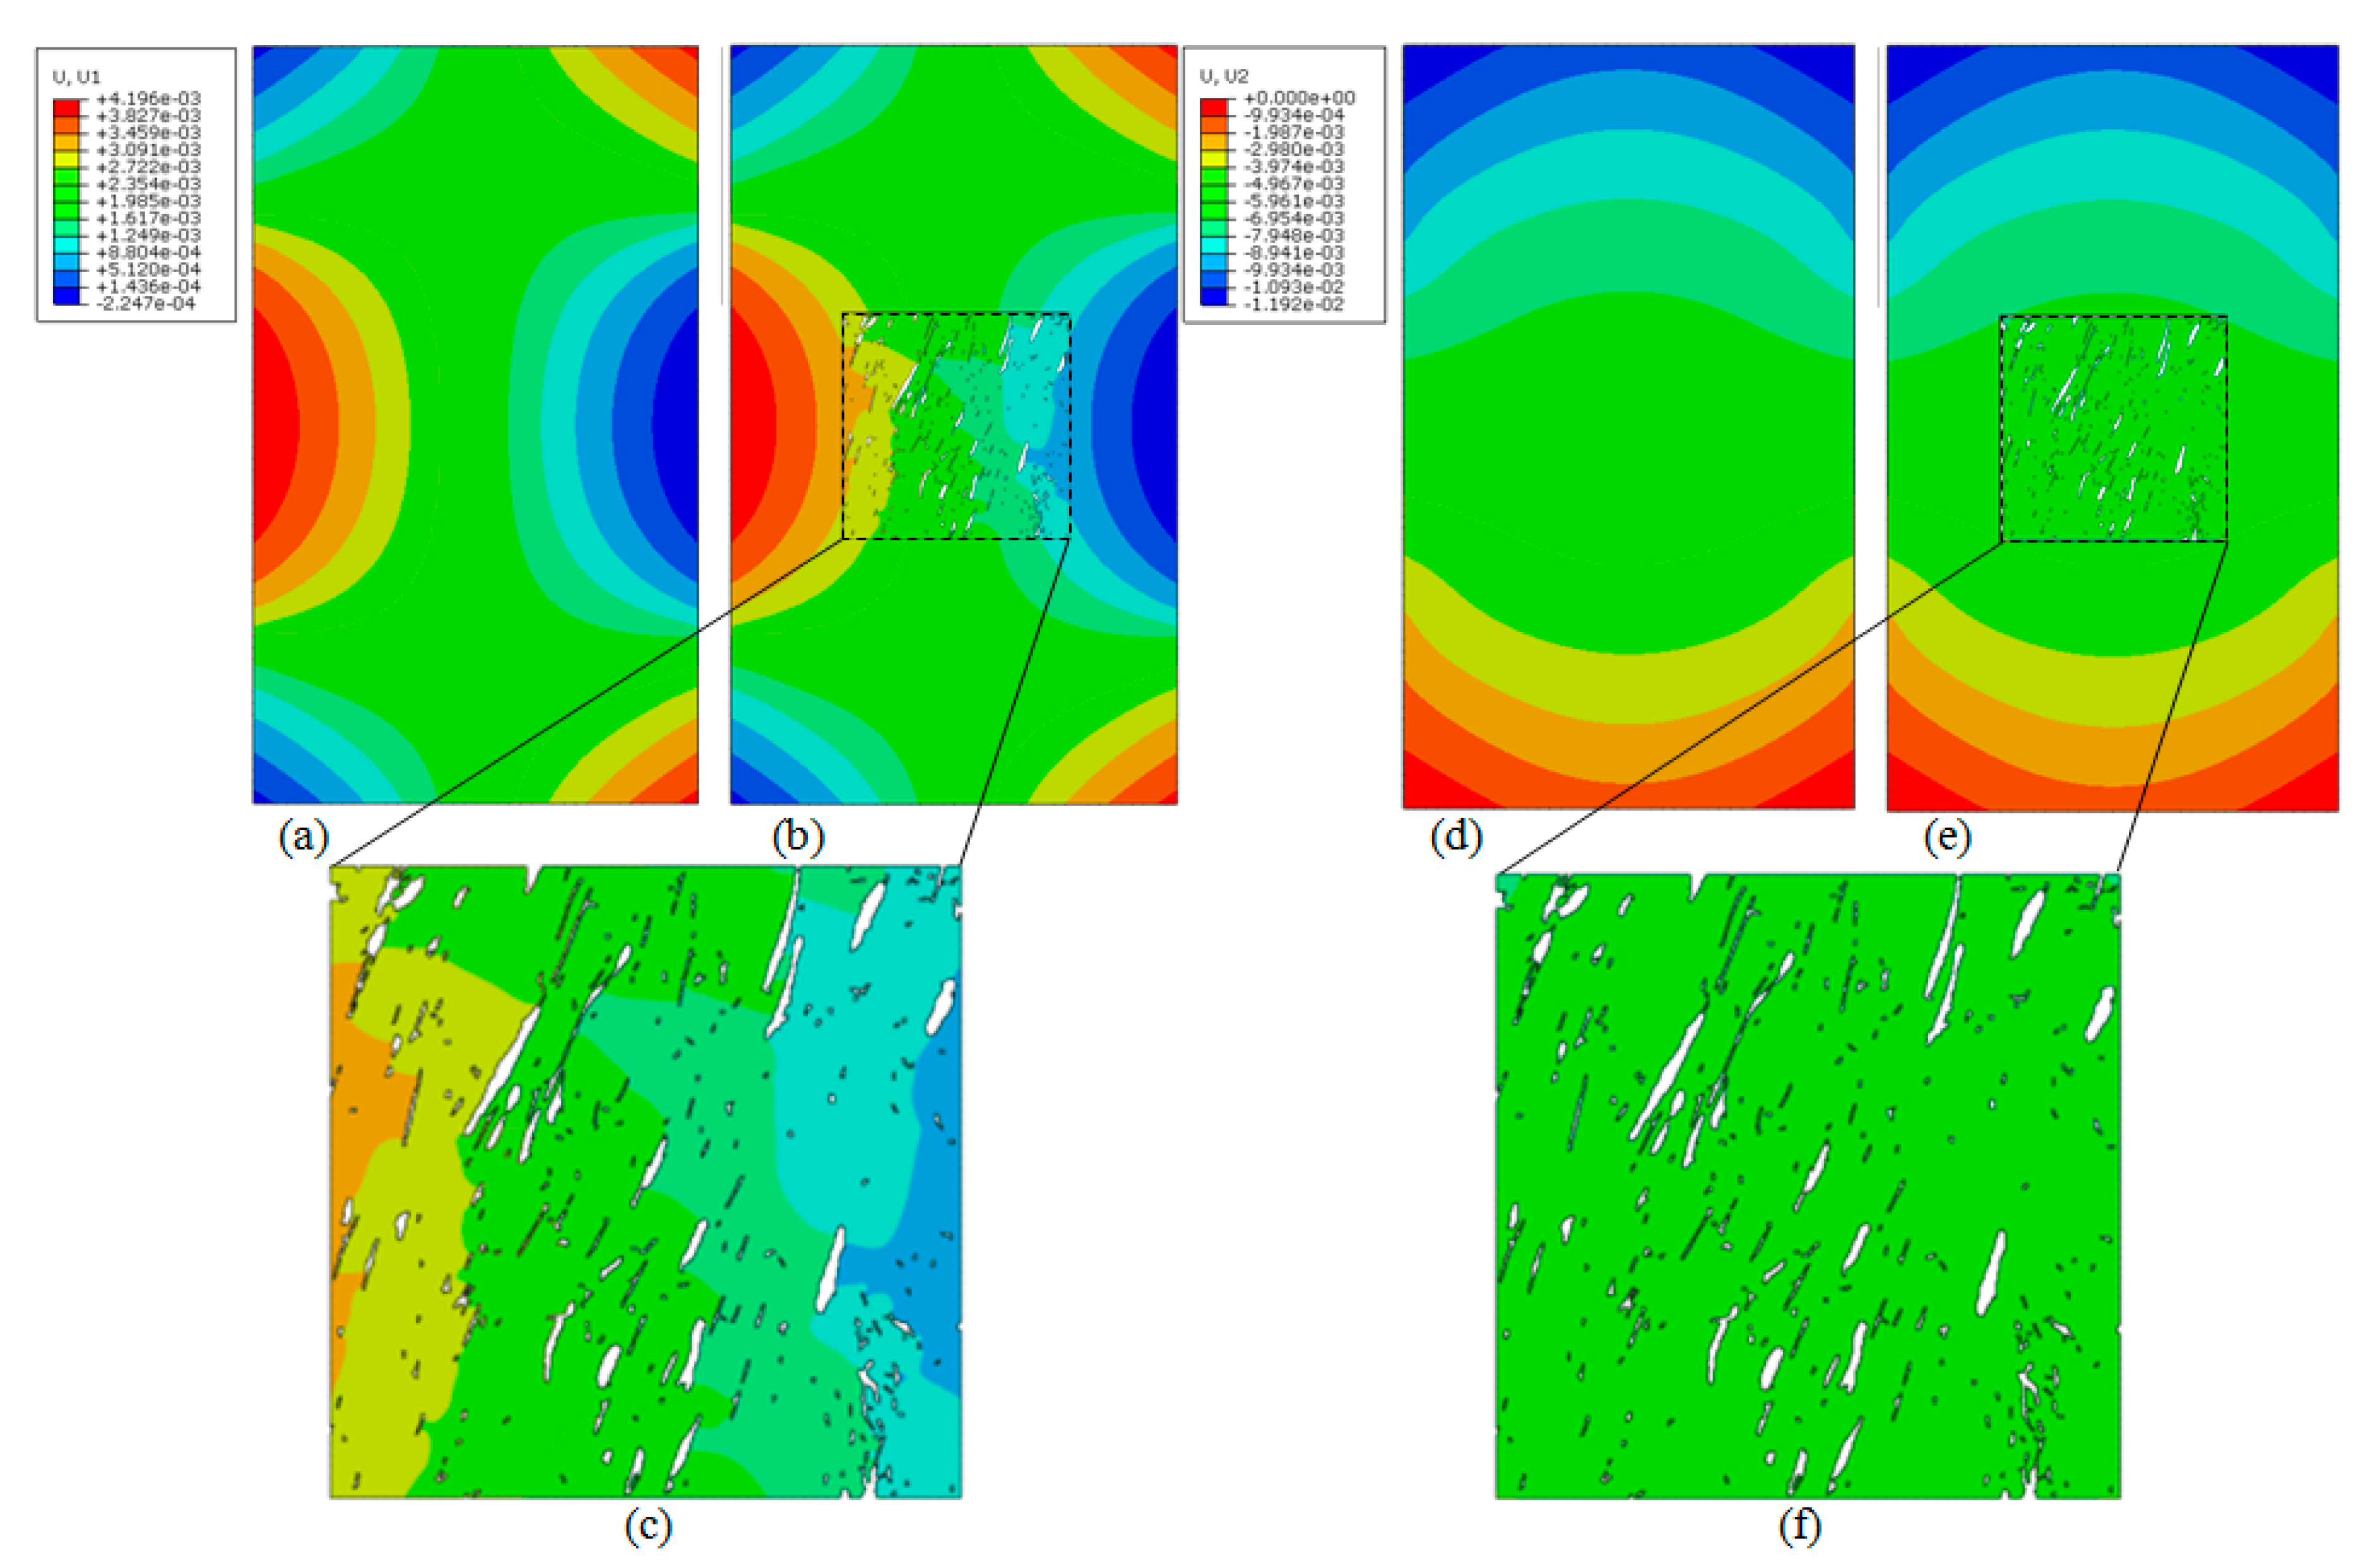
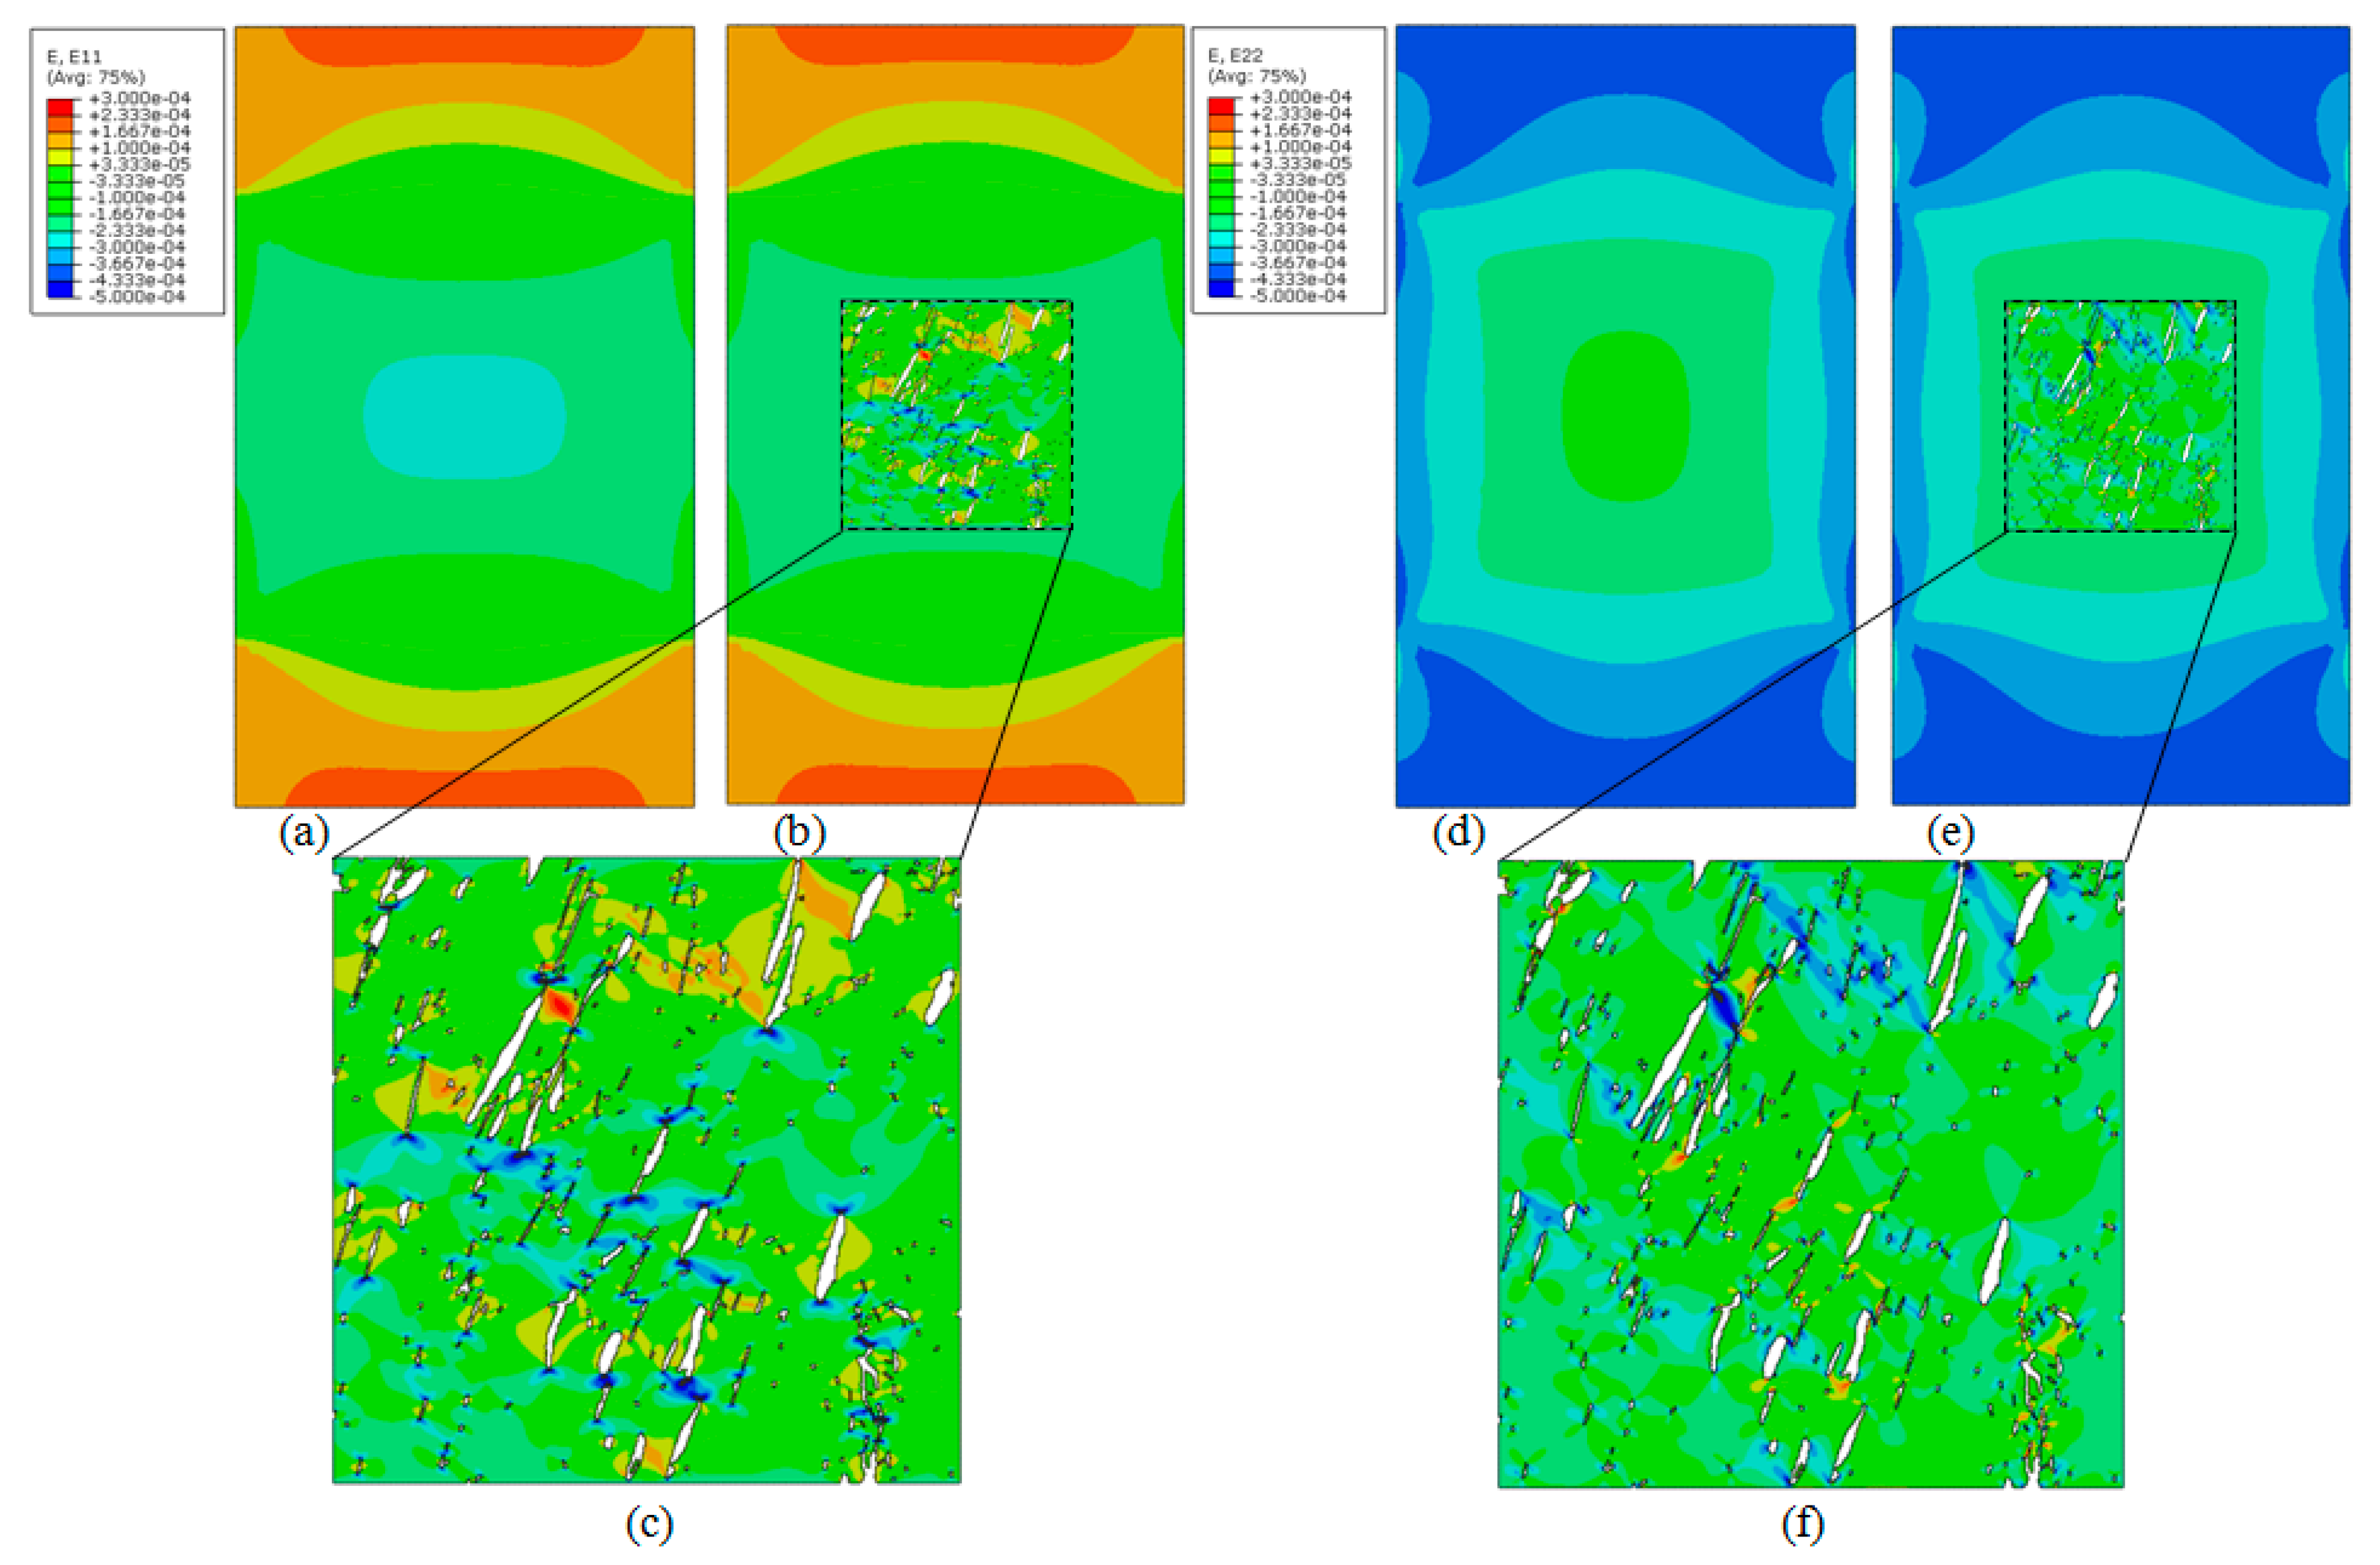
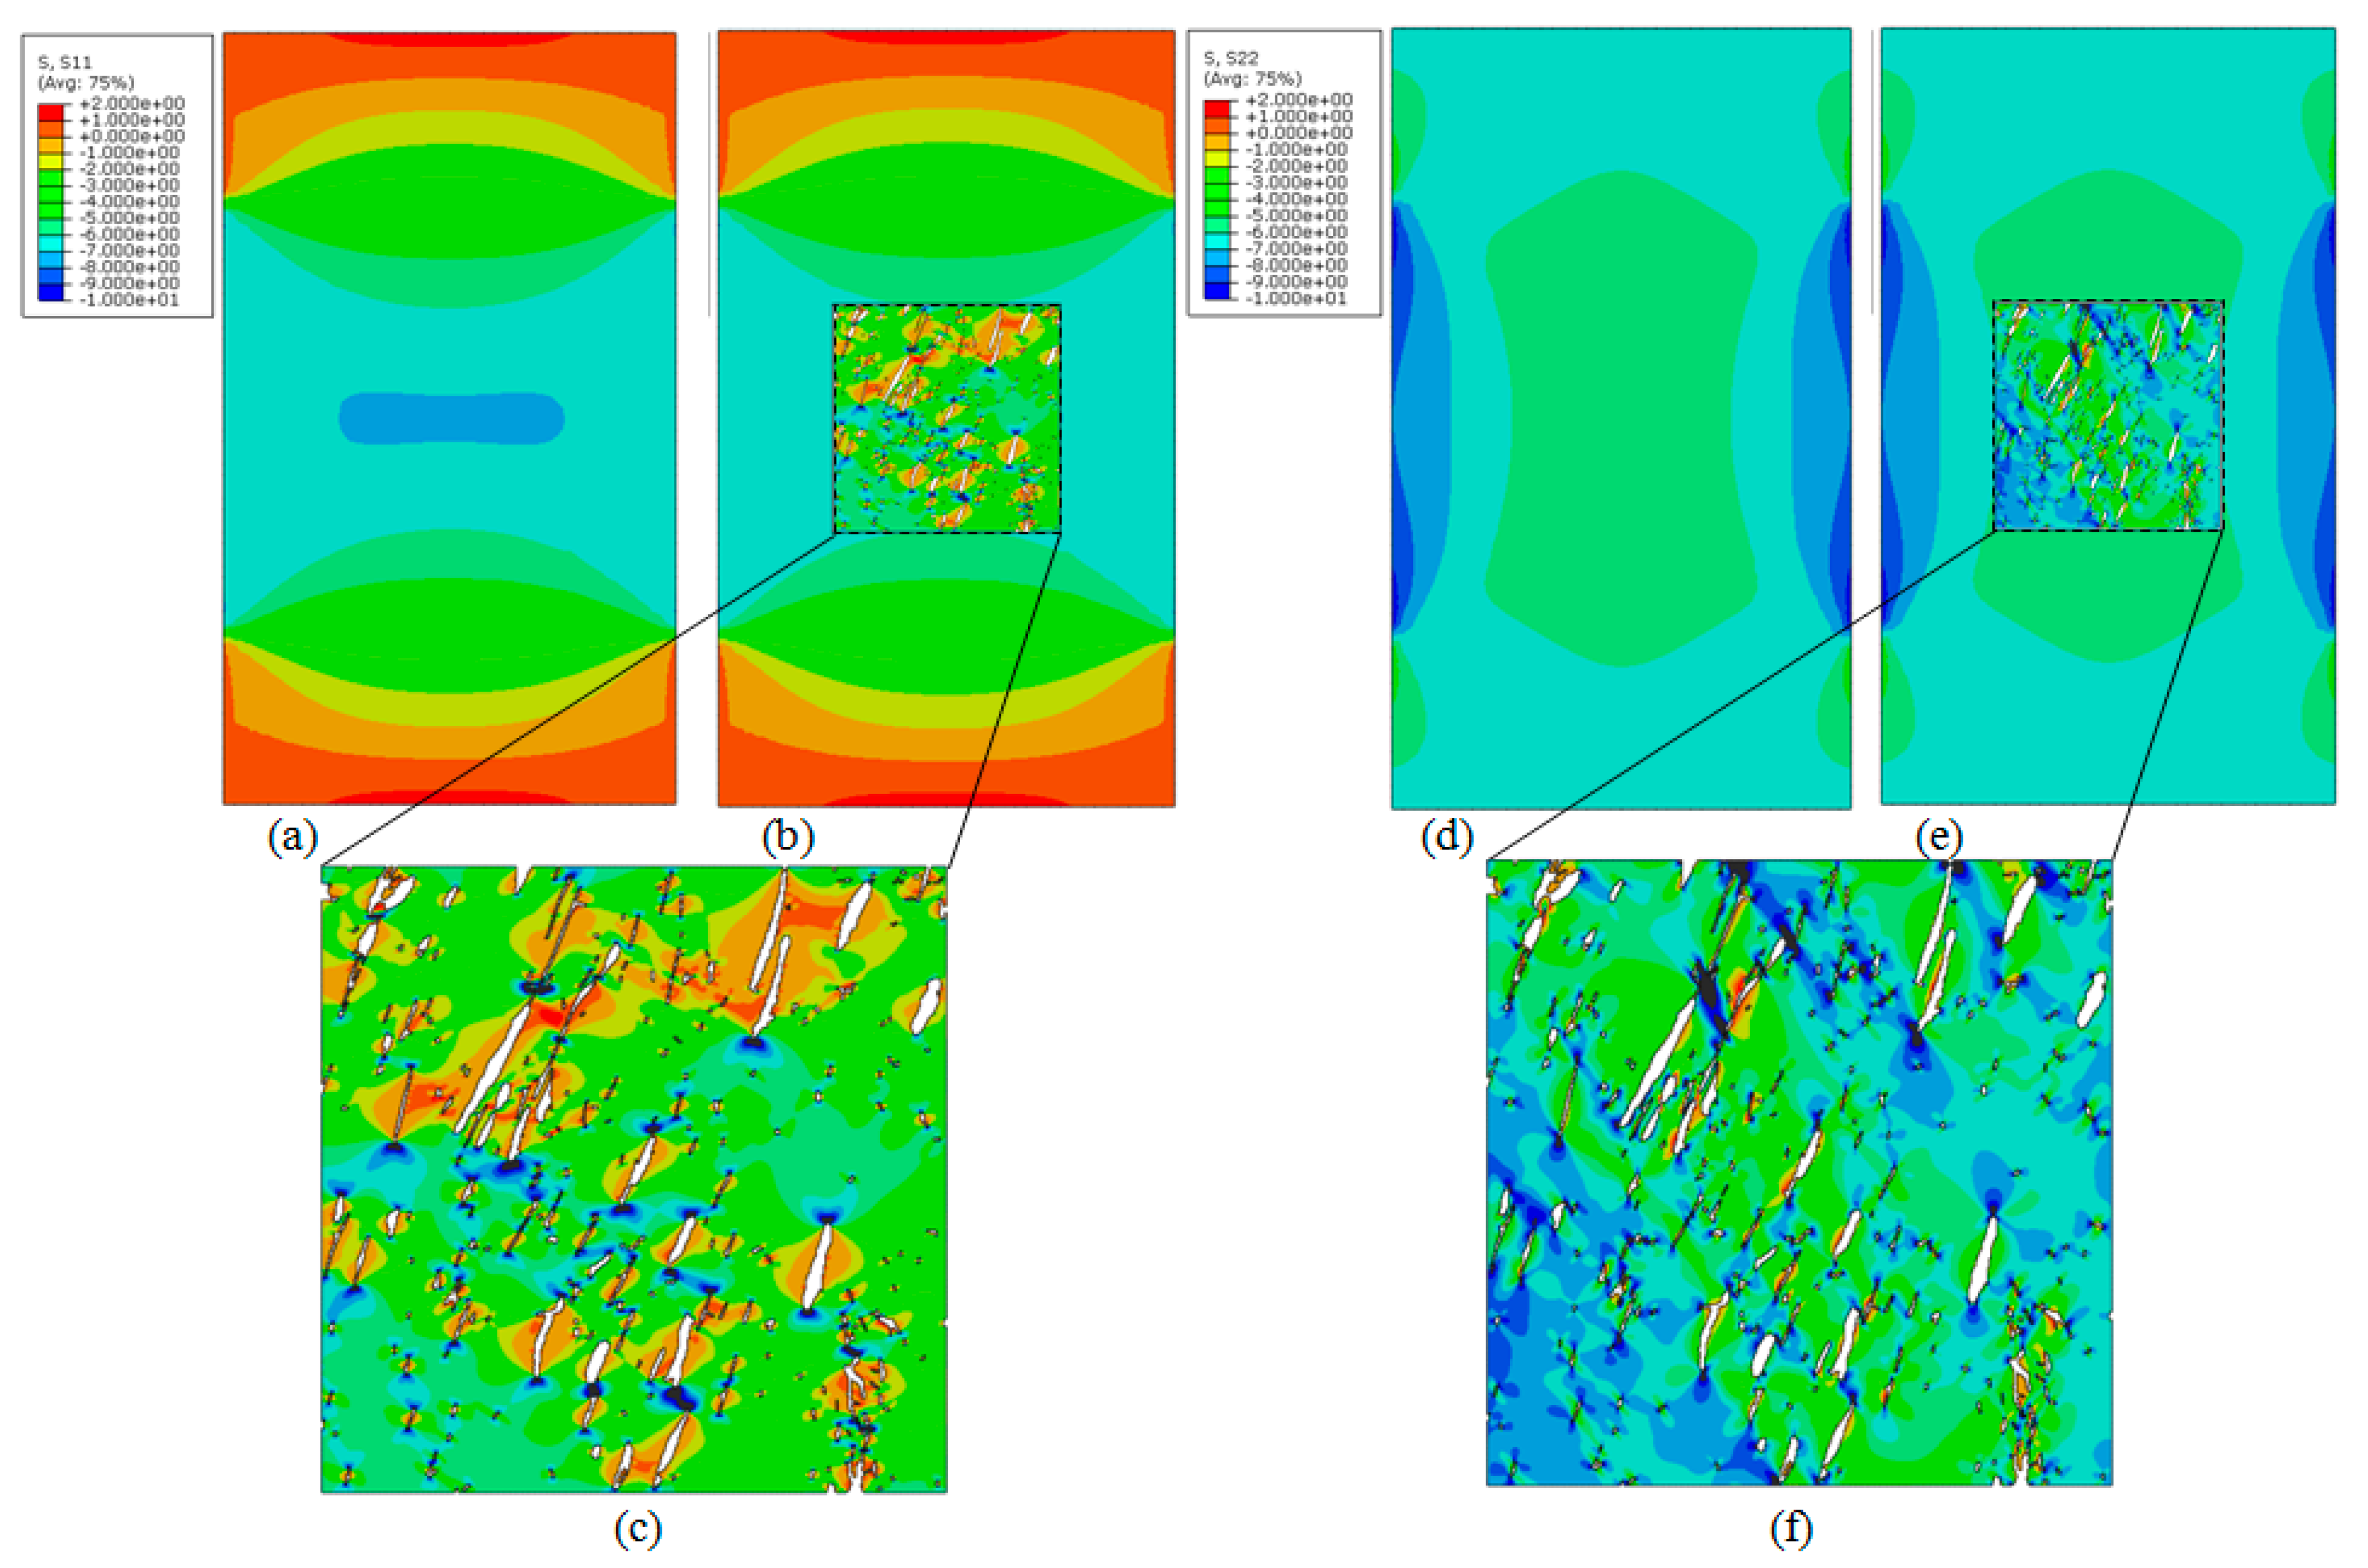
The multiscale results, i.e., results belonging to the macro geometry and microstructure, are shown in Figure 7, Figure 8 and Figure 9 for the displacement, strain and stress fields, respectively. The microstructure of the ROI is distinguished in these figures and the results are represented both in the macroscopic (homogeneous) and microscopic (heterogeneous) domains.

5. Discussion

The multiscale characterisation and analysis of the cortical bone tissue shown in this paper included several steps of analyses at different spatial scales, namely, microscopic and macroscopic scales. The micromechanical analyses performed in the microstructure of the cortical bone tissue initially took place through a homogenisation analysis. This procedure allowed to estimate both the micromechanical properties of the mineral bone material of the matrix, as well as the homogenised apparent properties of the bone tissue. Specifically, using the information of the performed mechanical tests (Table 1), we could fit the properties of the mineral bone matrix by means of the homogenisation problem (Equation (14)), and then, the overall macroscopic or apparent behaviour (Equation (15)). Several interesting conclusions can be drawn from this analysis, as we shall reveal next.
Assuming an orthotropic mechanical behaviour of the bone mineral matrix, the microstructural arrangement of the cortical pores yields to an approximately orthotropic mechanical behaviour at the apparent level as well, along the longitudinal and transversal directions. This can be concluded from Equation (15) where it is seen that the components 1–3 and 2–3 of the matrix are one order of magnitude lower than the others. With a broad consensus, an orthotropic behaviour of the cortical bone is considered in the literature [4,58,59,60].
Assuming an orthotropic apparent behaviour for the bone tissue, the following values are estimated, using homogenisation, in the longitudinal and transversal directions: EL = 16.32 GPa, ET = 19.31 GPa, υLT = 0.373 and υTL = 0.442. These values are within the range of values measured in the literature for cortical bone tissue. For example, values in the range of 15–22 GPa are reported for the elasticity modulus of equine cortical bone [61,62,63,64]. On the other hand, for human bone tissue, values in the range of 10–25 GPa are found for the elasticity modulus, and 0.3–0.6 for the Poisson’s ratio [4].
In the microstructural approach mineral bone is considered a homogeneous material without distinguishing among hydroxyapatite or collagen. A multiscale analysis may be recursively established at the microstructural level to accurately obtain the micromechanical interaction and overall behaviour of mineral bone [11,65,66].
Results referring to the multiscale approach were obtained using the fitted properties of the mineral bone matrix at the microscopic domain in the localisation problem. These results show a smooth variation along the microstructure of the displacement field (see Figure 7). Therefore, as a first approach, the displacement field may be estimated through its macroscopic modelling. However, both the strain field and—most importantly—the stress field show peak magnification of 3× versus their macroscopic and homogenised (mean) values (see Figure 9). This is an extra and important added value given by the multiscale approach. It is currently accepted that the mechanical stimulus which orchestrates many bone processes and diseases, such as osteoporosis, remodelling or consolidation, is local and microstructural [27,33,34,35,36,67,68,69,70]. In this context, a multiscale approach is critical to link mechanical loading of the bone organ with internal and microstructural evolution of the bone tissue.
Finally, as highlighted in the introduction, the low porosity level of the cortical bone makes this tissue not very attractive from a multiscale point of view, assuming a priori a similar mechanical behaviour to the mineral bone tissue matrix. However, in this work, significant differences between the macro and micro behaviours have been evidenced, highlighting the importance of considering cortical bone tissue through a multiscale approach, for a suitable characterisation of its mechanical response.

Author Contributions

Conceptualisation, J.A.S.-H., J.M.-M., E.R.-R., J.D. and M.D.; methodology, J.A.S.-H., J.M.-M., and E.R.-R.; software, J.A.S.-H.; formal analysis, J.A.S.-H., J.M.-M., E.R.-R., J.D. and M.D.; writing—original draft preparation, J.A.S.-H., J.M.-M. and E.R.-R.; writing—review and editing, J.A.S.-H., J.M.-M., E.R.-R., J.D. and M.D.; supervision, J.D. and M.D.

Funding

The authors gratefully acknowledge the Ministry of Economy and Competitiveness [Ministerio de Economía y Competitividad] of the Government of Spain (DPI2014-58233-P, DPI2017-82501-P, PGC2018-097257-B-C31) for research funding.

Conflicts of Interest

The authors declare no conflicts of interest.

References

  1. Currey, J.D. The adaptation of bone to stress. J. Theor. Biol. 1968, 20, 91–106. [Google Scholar] [CrossRef]
  2. Cowin, S.C.; Moss-Salentijn, L.; Moss, M.L. Candidates for the mechanosensory system in bone. J. Biomech. Eng. 1991, 113, 191–197. [Google Scholar] [CrossRef]
  3. Cowin, S.C.; Sadegh, A.M.; Luo, G.M. An evolutionary Wolff’s law for trabecular architecture. J. Biomech. Eng. 1992, 114, 129–136. [Google Scholar] [CrossRef]
  4. Skalak, R.; Chien, S. Handbook of Bioengineering; McGraw-Hill: New York, NY, USA, 1987. [Google Scholar]
  5. Currey, J.D. Bones: Structure and Mechanics; Princeton University Press Editions: Princeton, NJ, USA, 2006. [Google Scholar]
  6. Cowin, S.C.; Hegedus, D.H. Bone remodeling i: A theory of adaptive elasticity. J. Elast. 1976, 6, 313–326. [Google Scholar] [CrossRef]
  7. Huiskes, R.; Ruimerman, R.; van Lenthe, G.H.; Janssen, J.D. Effects of mechanical forces on maintenance and adaptation of form in trabecular bone. Nature 2000, 405, 704–706. [Google Scholar] [CrossRef]
  8. Christen, P.; Ito, K.; Ellouz, R.; Boutroy, S.; Sornay-Rendu, E.; Chapurlat, R.D.; van Rietbergen, B. Bone remodelling in humans is load-driven but not lazy. Nat. Commun. 2014, 5, 4855. [Google Scholar] [CrossRef] [PubMed]
  9. Bouxsein, M.L.; Boyd, S.K.; Christiansen, B.A.; Guldberg, R.E.; Jepsen, K.J.; Müller, R. Guidelines for assessment of bone microstructure in rodents using micro-computed tomography. J. Bone Miner. Res. 2010, 25, 1468–1486. [Google Scholar] [CrossRef] [PubMed]
  10. Mora-Macías, J.; Pajares, A.; Miranda, P.; Domínguez, J.; Reina-Romo, E. Mechanical characterization via nanoindentation of the woven bone developed during bone transport. J. Mech. Behav. Biomed. Mater. 2017, 74, 236–244. [Google Scholar] [CrossRef] [PubMed]
  11. Tai, K.; Dao, M.; Suresh, S.; Palazoglu, A.; Ortiz, C. Nanoscale heterogeneity promotes energy dissipation in bone. Nat. Mater. 2007, 6, 454–462. [Google Scholar] [CrossRef]
  12. Schaffler, M.B.; Burr, D.B. Stiffness of compact bone: Effects of porosity and density. J. Biomech. 1998, 21, 13–16. [Google Scholar] [CrossRef]
  13. Thompson, M.S.; Schell, H.; Lienau, J.; Duda, G.N. Digital image correlation: A technique for determining local mechanical conditions within early bone callus. Med. Eng. Phys. 2007, 29, 820–823. [Google Scholar] [CrossRef] [PubMed]
  14. Carriero, A.; Abela, L.; Pitsillides, A.A.; Shefelbine, S.J. Ex vivo determination of bone tissue strains for an in vivo mouse tibial loading mode. J. Biomech. 2014, 47, 2490–2497. [Google Scholar] [CrossRef] [PubMed]
  15. Gustafsson, A.; Mathavan, N.; Turunen, M.J.; Engqvist, J.; Khayyeri, H.; Hall, S.A.; Isaksson, H. Linking multiscale deformation to microstructure in cortical bone using in situ loading, digital image correlation and synchrotron X-ray scattering. Acta Biomater. 2018, 69, 323–331. [Google Scholar] [CrossRef] [PubMed]
  16. Carter, D.R.; Orr, T.E.; Fyhrie, D.P. Relationships between loading history and femoral cancellous bone architecture. J. Biomech. 1989, 22, 231–244. [Google Scholar] [CrossRef]
  17. Hernandez, C.J.; Beaupre, G.S.; Carter, D.R. A model of mechanobiologic and metabolic influences on bone adaptation. J. Rehabil. Res. Dev. 2000, 37, 235–244. [Google Scholar] [PubMed]
  18. Hazelwood, S.J.; Martin, R.B.; Rashid, M.M.; Rodrigo, J.J. A mechanistic model for internal bone remodeling exhibits different dynamic responses in disuse and overload. J. Biomech. 2001, 34, 299–308. [Google Scholar] [CrossRef]
  19. Garcia-Aznar, J.M.; Rueberg, T.; Doblare, M. A bone remodelling model coupling micro-damage growth and repair by 3D BMU-activity. Biomech. Model. Mechanobiol. 2005, 4, 147–167. [Google Scholar] [CrossRef] [PubMed]
  20. Beaupre, G.S.; Orr, T.E.; Carter, D.R. An approach for time-dependent bone modelling and remodelling: Theoretical development. J. Orthop. Res. 1990, 8, 651–661. [Google Scholar] [CrossRef] [PubMed]
  21. Beaupre, G.S.; Orr, T.E.; Carter, D.R. An approach for time-dependent bone modeling and remodeling-application: A preliminary remodeling simulation. J. Orthop. Res. 1990, 8, 662–670. [Google Scholar] [CrossRef] [PubMed]
  22. Jacobs, C.R. Numerical Simulation of Bone Adaptation to Mechanical Loading. Ph.D. Thesis, Stanford University, Stanford, CA, USA, 1994. [Google Scholar]
  23. Wittkowske, C.; Reilly, G.C.; Lacroix, D.; Perrault, C.M. In Vitro Bone Cell Models: Impact of Fluid Shear Stress on Bone Formation. Front. Bioeng. Biotechnol. 2016, 15, 4–87. [Google Scholar] [CrossRef] [PubMed]
  24. Cowin, S.C. Bone poroelasticity. J. Biomech. 1999, 32, 217–238. [Google Scholar] [CrossRef]
  25. Cowin, S.C.; Gailani, G.; Benalla, M. Hierarchical poroelasticity: Movement of interstitial fluid between porosity levels in bones. Philos. Trans. A Math. Phys. Eng. Sci. 2009, 367, 3401–3444. [Google Scholar] [CrossRef] [PubMed]
  26. Bailon-Plaza, A.; van der Meulen, C.H. A mathematical framework to study the effects of growth factor influences on fracture healing. J. Theor. Biol. 2001, 212, 191–200. [Google Scholar] [CrossRef] [PubMed]
  27. Lacroix, D.; Prendergast, P.J. A mechano-regulation model for tissue differentiation during fracture healing: Analysis of gap size and loading. J. Biomech. 2002, 35, 1163–1171. [Google Scholar] [CrossRef]
  28. Wang, M.; Yang, N.; Wang, X. A review of computational models of bone fracture healing. Med. Biol. Eng. Comput. 2017, 55, 1895–1914. [Google Scholar] [CrossRef] [PubMed]
  29. Byrne, D.P.; Lacroix, D.; Planell, J.A.; Kelly, D.J.; Prendergast, P.J. Simulation of tissue differentiation in a scaffold as a function of porosity, Young’s modulus and dissolution rate: Application of mechanobiological models in tissue engineering. Biomaterials 2007, 28, 5544–5554. [Google Scholar] [CrossRef] [PubMed]
  30. Sanz-Herrera, J.A.; Garcia-Aznar, J.M.; Doblare, M. A mathematical model for bone tissue regeneration inside a specific type of scaffold. Biomech. Model. Mechanobiol. 2008, 7, 355–366. [Google Scholar] [CrossRef]
  31. Sanz-Herrera, J.A.; Garcia-Aznar, J.M. A mathematical approach to bone tissue engineering. Philos. Trans. A Math. Phys. Eng. Sci. 2009, 367, 2055–2078. [Google Scholar] [CrossRef]
  32. Guyot, Y.; Papantoniou, I.; Chai, Y.C.; Van Bael, S.; Schrooten, J.; Geris, L. A computational model for cell/ECM growth on 3D surfaces using the level set method: A bone tissue engineering case study. Biomech. Model. Mechanobiol. 2014, 13, 1361–1371. [Google Scholar] [CrossRef]
  33. Claes, L.E.; Heigele, C.A. Magnitudes of local stress and strain along bony surfaces predict the course and type of fracture healing. J. Biomech. 1999, 32, 255–266. [Google Scholar] [CrossRef]
  34. Isaksson, H.; Comas, O.; van Donkelaar, C.C.; Mediavilla, J.; Wilson, W.; Huiskes, R.; Ito, K. Bone regeneration during distraction osteogenesis: Mechano-regulation by shear strain and fluid velocity. J. Biomech. 2007, 40, 2002–2011. [Google Scholar] [CrossRef] [PubMed]
  35. Reina-Romo, E.; Gomez-Benito, M.J.; Garcia-Aznar, J.M.; Dominguez, J.; Doblare, M. Modeling distraction osteogenesis: Analysis of the distraction rate. Biomech. Model. Mechanobiol. 2009, 8, 323–335. [Google Scholar] [CrossRef] [PubMed]
  36. Reina-Romo, E.; Gomez-Benito, M.J.; Dominguez, J.; Niemeyer, F.; Wehner, T.; Simon, U.; Claes, L.E. Effect of the fixator stiffness on the young regenerate bone after bone transport: Computational approach. J. Biomech. 2011, 44, 917–923. [Google Scholar] [CrossRef] [PubMed]
  37. Adachi, T.; Tsubota, K.I.; Tomita, Y.; Hollister, S.J. Trabecular surface remodelling simulation for cancellous bone using microstructural voxel finite element models. J. Biomech. Eng. T ASME 2001, 123, 403–409. [Google Scholar] [CrossRef] [PubMed] [Green Version]
  38. Adachi, T.; Osako, Y.; Tanaka, M.; Hojo, M.; Hollister, S.J. Framework for optimal design of porous scaffold microstructure by computational simulation of bone regeneration. Biomaterials 2006, 27, 3964–3972. [Google Scholar] [CrossRef]
  39. Kelly, D.J.; Prendergast, P.J. Prediction of the optimal mechanical properties for a scaffold used in osteochondral defect repair. Tissue Eng. 2006, 12, 2509–2519. [Google Scholar] [CrossRef] [Green Version]
  40. Schulte, F.A.; Ruffoni, D.; Lambers, F.M.; Christen, D.; Webster, D.J.; Kuhn, G.; Muller, R. Local mechanical stimuli regulate bone formation and resorption in mice at the tissue level. PLoS ONE 2013, 8, e62172. [Google Scholar] [CrossRef]
  41. Terada, K.; Kikuchi, N. A class of general algorithms for multi-scale analyses of heterogeneous media. Comput. Methods Appl. Mech. Eng. 2001, 190, 5427–5464. [Google Scholar] [CrossRef]
  42. Kouznetsova, V.; Geers, M.G.D.; Brekelmans, W.A.M. Multi-scale constitutive modelling of heterogeneous materials with a gradient-enhanced computational homogenization scheme. Int. J. Numer. Meth. Eng. 2002, 54, 1235–1260. [Google Scholar] [CrossRef]
  43. Miehe, C.; Bayreuther, C.G. On multiscale FE analyses of heterogeneous structures: From homogenization to multigrid solvers. Int. J. Numer. Methods Eng. 2007, 71, 1135–1180. [Google Scholar] [CrossRef]
  44. Kulkarni, M.G.; Matous, K.; Geubelle, P.H. Coupled multi-scale cohesive modeling of failure in heterogeneous adhesives. Int. J. Numer. Methods Eng. 2010, 84, 916–946. [Google Scholar] [CrossRef]
  45. Reina-Romo, E.; Sanz-Herrera, J.A. Multiscale simulation of particle-reinforced elastic-plastic adhesives at small strains. Comput. Methods Appl. Mech. Eng. 2011, 200, 2211–2222. [Google Scholar] [CrossRef]
  46. Montero-Chacon, F.; Sanz-Herrera, J.A.; Doblare, M. Computational multiscale solvers for continuum approaches. Materials 2019, 12, 691. [Google Scholar] [CrossRef] [PubMed] [Green Version]
  47. Webster, D.; Muller, R. In silico models of bone remodeling from macro to nano--from organ to cell. Wiley Interdiscip. Rev. Syst. Biol. Med. 2010, 3, 241–251. [Google Scholar] [CrossRef]
  48. Nguyen, T.K.; Carpentier, O.; Monchau, F.; Chai, F.; Hornez, J.C.; Hivart, P. Numerical optimization of cell colonization modelling inside scaffold for perfusion bioreactor: A multiscale model. Med. Eng. Phys. 2018, 57, 40–50. [Google Scholar] [CrossRef]
  49. Sanz-Herrera, J.A.; Garcia-Aznar, J.M.; Doblare, M. Micro–macro numerical modelling of bone regeneration in tissue engineering. Comput. Meth. Appl. Mech. Eng. 2008, 197, 3092–3107. [Google Scholar] [CrossRef]
  50. Sanz-Herrera, J.A.; Garcia-Aznar, J.M.; Doblare, M. On scaffold designing for bone regeneration: A computational multiscale approach. Acta Biomater. 2009, 5, 219–229. [Google Scholar] [CrossRef]
  51. Colloca, M.; Blanchard, R.; Hellmich, C.; Ito, K.; van Rietbergen, B. A multiscale analytical approach for bone remodeling simulations: Linking scales from collagen to trabeculae. Bone 2014, 64, 303–313. [Google Scholar] [CrossRef] [Green Version]
  52. Garcia, D.; Zysset, P.K.; Charlebois, M.; Curnier, A. A three-dimensional elastic plastic damage constitutive law for bone tissue. Biomech. Model. Mechanobiol. 2009, 8, 149–165. [Google Scholar] [CrossRef]
  53. Yoon, Y.J.; Cowin, S.C. The estimated elastic constants for a single bone osteonal lamella. Biomech. Model. Mechanobiol. 2008, 7, 1–11. [Google Scholar] [CrossRef]
  54. Gailani, G.; Benalla, M.; Mahamud, R.; Cowin, S.C.; Cardoso, L. Experimental determination of the permeability in the lacunar-canalicular porosity of bone. J. Biomech. Eng. 2009, 131, 101007. [Google Scholar] [CrossRef] [PubMed]
  55. Vazquez, J.; Navarro, C.; Dominguez, J. Analysis of fretting fatigue initial crack path in Al7075-T651 using cylindrical contact. Tribol. Int. 2017, 108, 87–94. [Google Scholar] [CrossRef]
  56. Suquet, P.M. Elements of homogenization for inelastic solid mechanics, trends and applications of pure mathematics to mechanics. In Homogenization Techniques for Composite Media, Lecture Notes in Physics; Sanchez-Palencia, E., Zaoui, A., Eds.; Springer: Berlin, Germany, 1985; Volume 272, pp. 193–278. [Google Scholar]
  57. Yuan, Z.; Fish, J. Toward realization of computational homogenization in practice. Int. J. Numer. Meth. Eng. 2008, 73, 361–380. [Google Scholar] [CrossRef]
  58. Taylor, W.R.; Roland, E.; Ploeg, H.; Hertig, D.; Klabunde, R.; Warner, M.D.; Hobatho, M.C.; Rakotomanana, L.; Clift, S.E. Determination of orthotropic bone elastic constants using FEA and modal analysis. J. Biomech. 2002, 35, 767–773. [Google Scholar] [CrossRef]
  59. Bernard, S.; Grimal, Q.; Laugier, P. Accurate measurement of cortical bone elasticity tensor with resonant ultrasound spectroscopy. J. Mech. Behav. Biomed. Mater. 2013, 18, 12–19. [Google Scholar] [CrossRef] [PubMed]
  60. Reilly, D.; Burstein, A. The elastic and ultimate properties of compact bone tissue. J. Biomech. 1975, 8, 393–405. [Google Scholar] [CrossRef]
  61. Schryver, H.F. Bending properties of cortical bone of the horse. Am. J. Vet. Res. 1978, 39, 25–28. [Google Scholar]
  62. Riggs, C.M.; Vaughan, L.C.; Evans, G.P.; Lanyon, L.E.; Boyde, A. Mechanical implications of collagen fibre orientation in cortical bone of the equine radius. Anat. Embryol. 1993, 187, 239–248. [Google Scholar] [CrossRef]
  63. Reilly, G.C.; Currey, J.D. The development of microcracking and failure in bone depends on the loading mode to which it is adapted. J. Exp. Biol. 1999, 202, 543–552. [Google Scholar]
  64. Batson, E.L.; Reilly, G.C.; Currey, J.D.; Balderson, D.S. Post-exercise and positional variation in mechanical properties of the radius in young horses. Equine Vet. 2000, 32, 95–100. [Google Scholar] [CrossRef]
  65. Hellmich, C.; Barthelemy, J.; Dormieux, L. Mineral-collagen interactions in elasticity of bone ultrastructure—A continuum micromechanics approach. Eur. J. Mech. A Solids 2004, 23, 783–810. [Google Scholar] [CrossRef]
  66. Fritsch, A.; Hellmich, C. ‘Universal’ microstructural patterns in cortical and trabecular, extracellular and extravascular bone materials: Micromechanics-based prediction of anisotropic elasticity. J. Theor. Biol. 2007, 244, 597–620. [Google Scholar] [CrossRef] [PubMed]
  67. Carter, D.R.; Blenman, P.; Beaupre, G.S. Correlations between mechanical stress history and tissue differentiation in initial fracture healing. J. Orthop. Res. 1988, 6, 736–748. [Google Scholar] [CrossRef] [PubMed]
  68. Cowin, S.C. Mechanosensation and fluid transport in living bone. J. Musculoskelet. Neuronal Interact. 2002, 2, 256–260. [Google Scholar]
  69. Van Rietbergen, B.; Huiskes, R.; Eckstein, F.; Ruegsegger, P. Trabecular bone tissue strains in the healthy and osteoporotic human femur. J. Bone Miner. Res. 2003, 18, 1781–1788. [Google Scholar] [CrossRef]
  70. Shefelbine, S.J.; Carter, D.R. Mechanobiological predictions of growth front morphology in developmental hip dysplasia. J. Orthop. Res. 2004, 22, 346–352. [Google Scholar] [CrossRef]
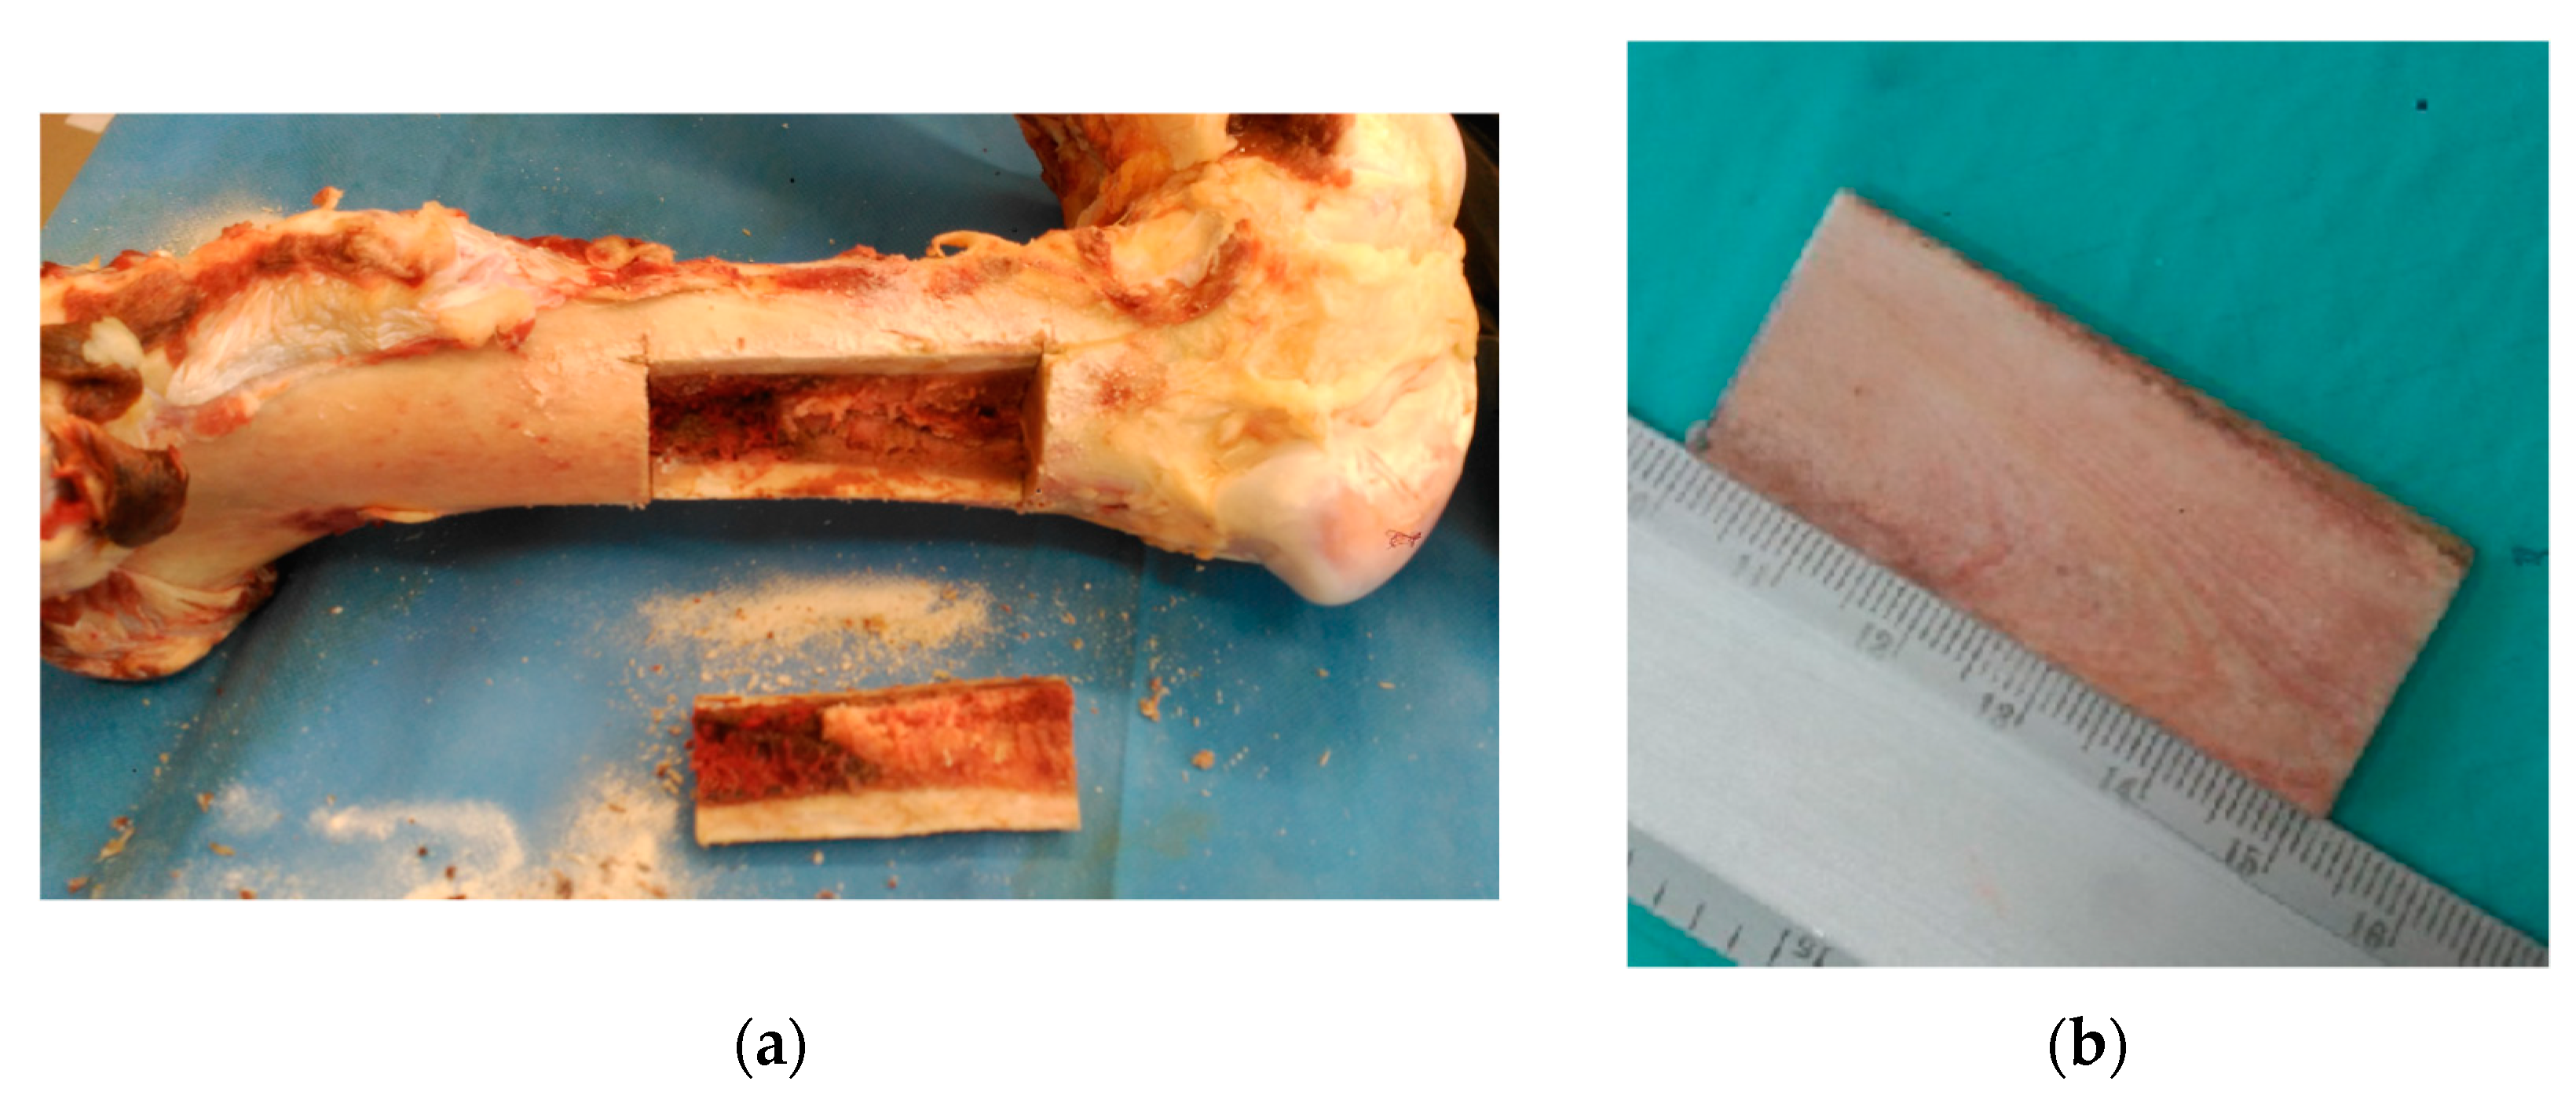
Figure 1. (a) Horse femur after extracting a piece from the mid diaphysis for machining; (b) one of the four specimens after milling; (c) embedding process; (d) spray speckle for digital image correlation strain measurements.
Applsci 09 05228 g001aApplsci 09 05228 g001b
Figure 2. (a) Scheme of the loads applied to the specimen, longitudinal forces, FL, and transversal forces, FT; (b) picture of the system during experiments. The push-pull testing machine may be observed in the back ground. The piston and the load cell above, attached to the green frame, can be observed. The system that applies the transversal load can be seen below, while the DIC camera appears in front.
Applsci 09 05228 g002
Figure 3. (a) Non-contact two-dimensional (2D) deformation system used to obtain the strain maps in the bone samples; (b) strains measured in the region of interest of the sample.
Applsci 09 05228 g003
Figure 4. Workflow to generate the computational model for microstructural analysis. The porosity level of the microstructure is 6.17%.
Applsci 09 05228 g004
Figure 5. Sketch of the procedure followed for multiscale characterisation of cortical bone tissue.
Applsci 09 05228 g005
Figure 6. Fitting of the macroscopic modelling to experimental results. Left: Averaged (in the region of interest) longitudinal component of the strain tensor versus overall longitudinal force (for different values of the overall transversal force). Right: Averaged (in the region of interest) transversal component of the strain tensor versus overall longitudinal force (for different values of the overall transversal force). See macroscopic setup of the problem in Figure 2a. ROI dimensions: 10 × 10 mm (n = 1 specimen). Average R2 of the fitting: 0.992.
Applsci 09 05228 g006
Figure 7. Displacement field [mm]. (a) Transversal component: macroscopic results, (b) transversal component: multiscale results, (c) transversal component: microscopic results. (d) Longitudinal component: macroscopic results, (e) longitudinal: multiscale results, (f) longitudinal component: microscopic results.
Applsci 09 05228 g007
Figure 8. Strain field [-]. (a) Transversal component: macroscopic results, (b) transversal component: multiscale results, (c) transversal component: microscopic results. (d) Longitudinal component: macroscopic results, (e) longitudinal component: multiscale results, (f) longitudinal component: microscopic results.
Applsci 09 05228 g008
Figure 9. Stress field [MPa]. (a) Transversal component: macroscopic results, (b) transversal component: multiscale results, (c) transversal component: microscopic results. (d) Longitudinal component: macroscopic results, (e) longitudinal component: multiscale results, (f) longitudinal component: microscopic results.
Applsci 09 05228 g009
Table 1. Macroscopic results of the mechanical tests.
FL [N]FT [N] ε L   × 10 3   [ % ] ε T   × 10 3   [ % ]
0−2505.8−17.6
0−50021.4−35.9
−2500−16.59.5
−250−250−9.8−8.8
−250−5000.55−27.7
−5000−36.316.8
−500−250−28.2−0.025
−500−500−17.9−20.3
Note: Table notes. FL: Overall longitudinal force. FT: Overall transversal force. ε L : Averaged longitudinal component of the strain tensor. ε T : Averaged transversal component of the strain tensor.