Correlation Analysis between UBD and LST in Hefei, China, Using Luojia1-01 Night-Time Light Imagery


Abstract

1. Introduction
2. Study Area and Data
2.1. Study Area
2.2. Experimental Data
2.2.1. Luojia1-01
2.2.2. Landsat8
2.2.3. Other Auxiliary Data
3. Methodology
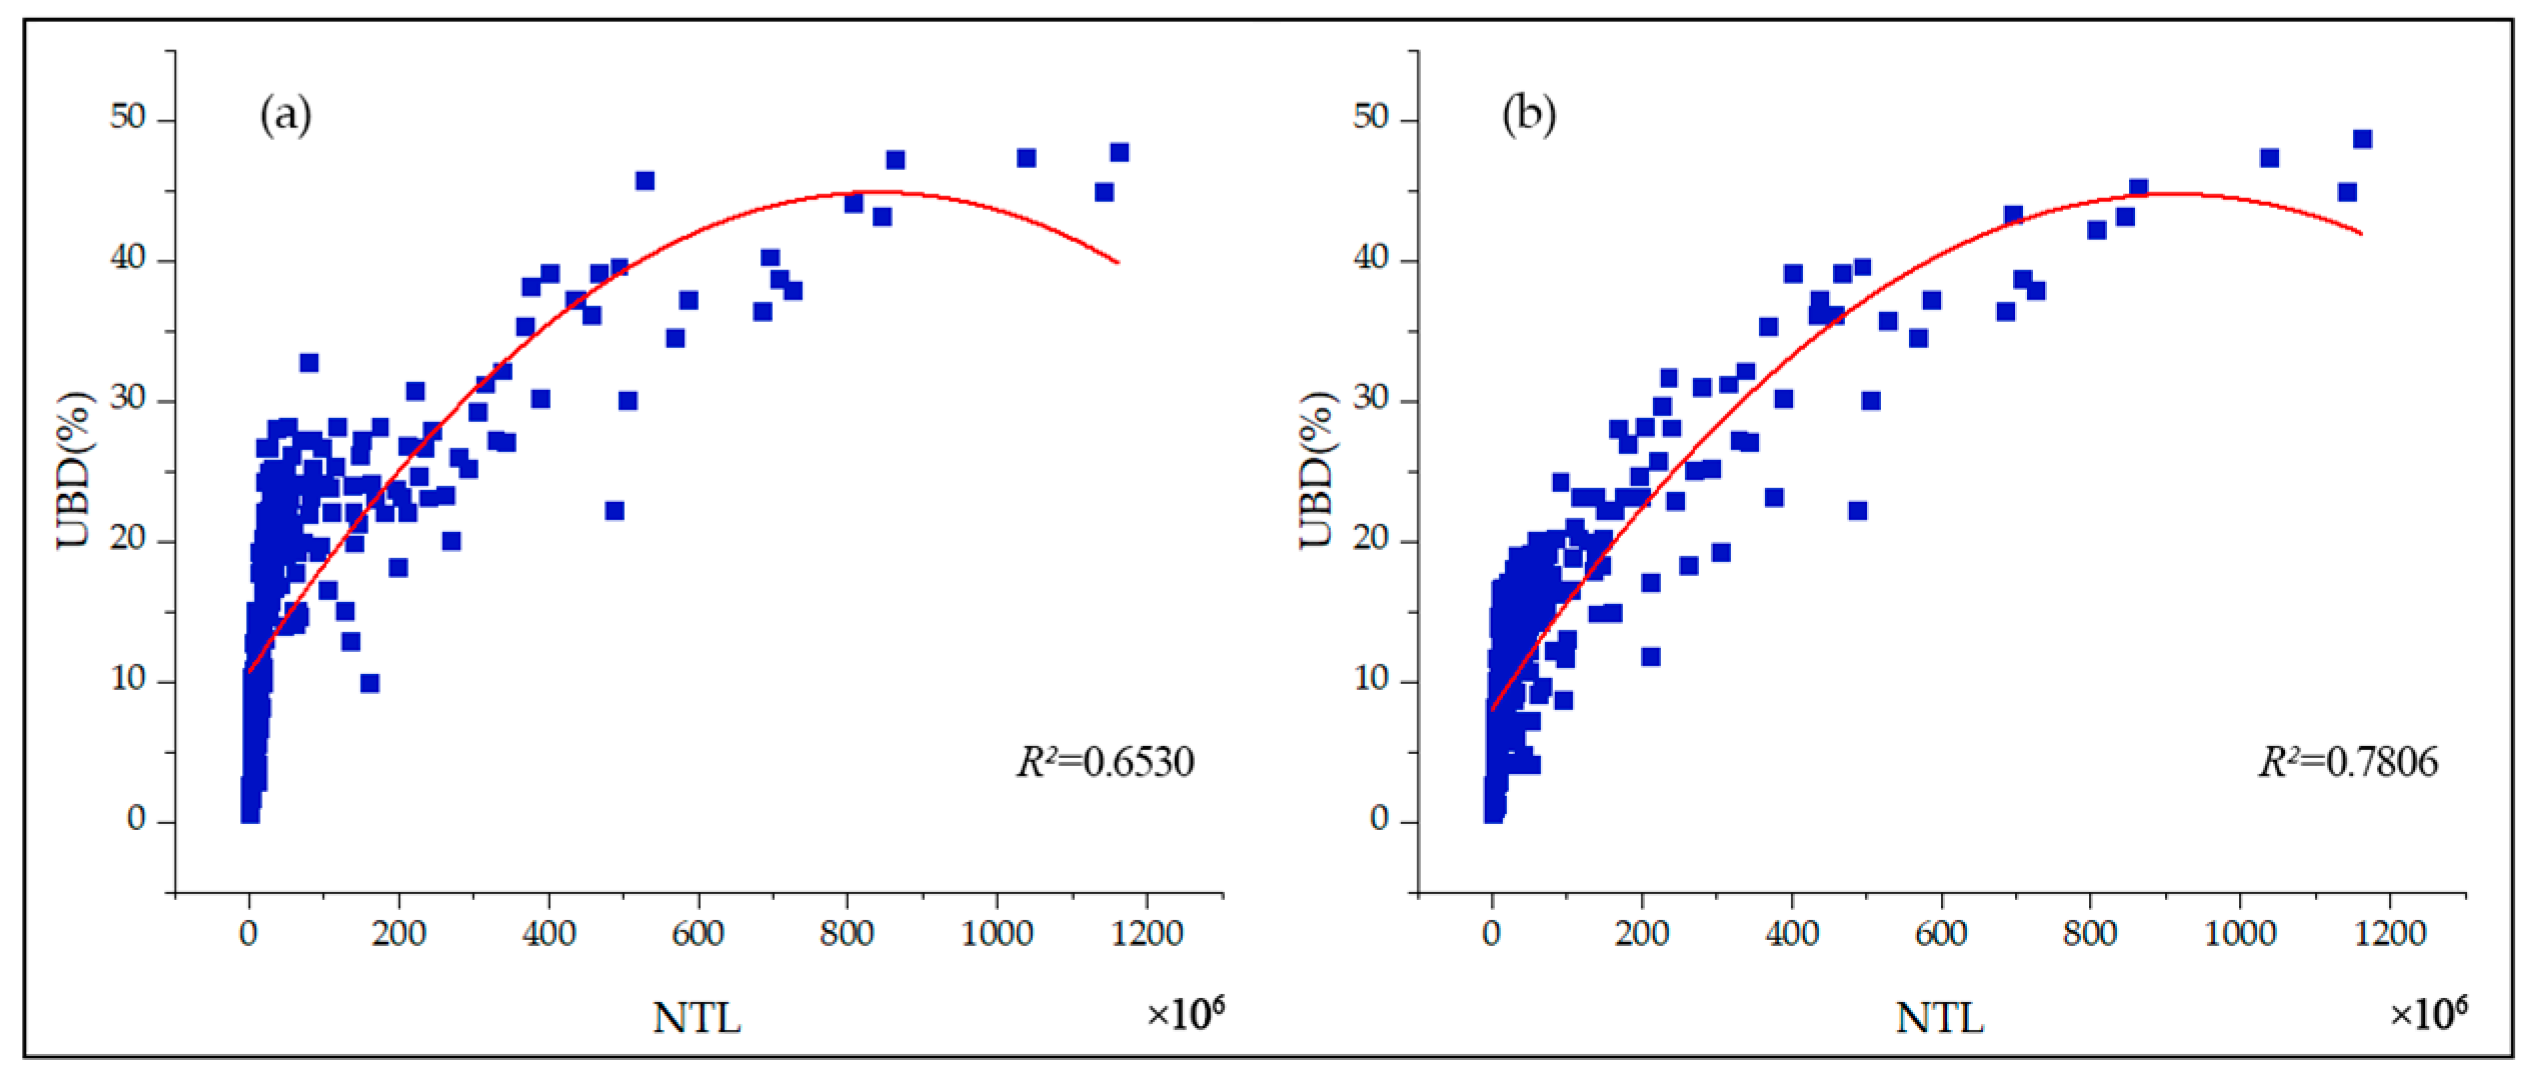
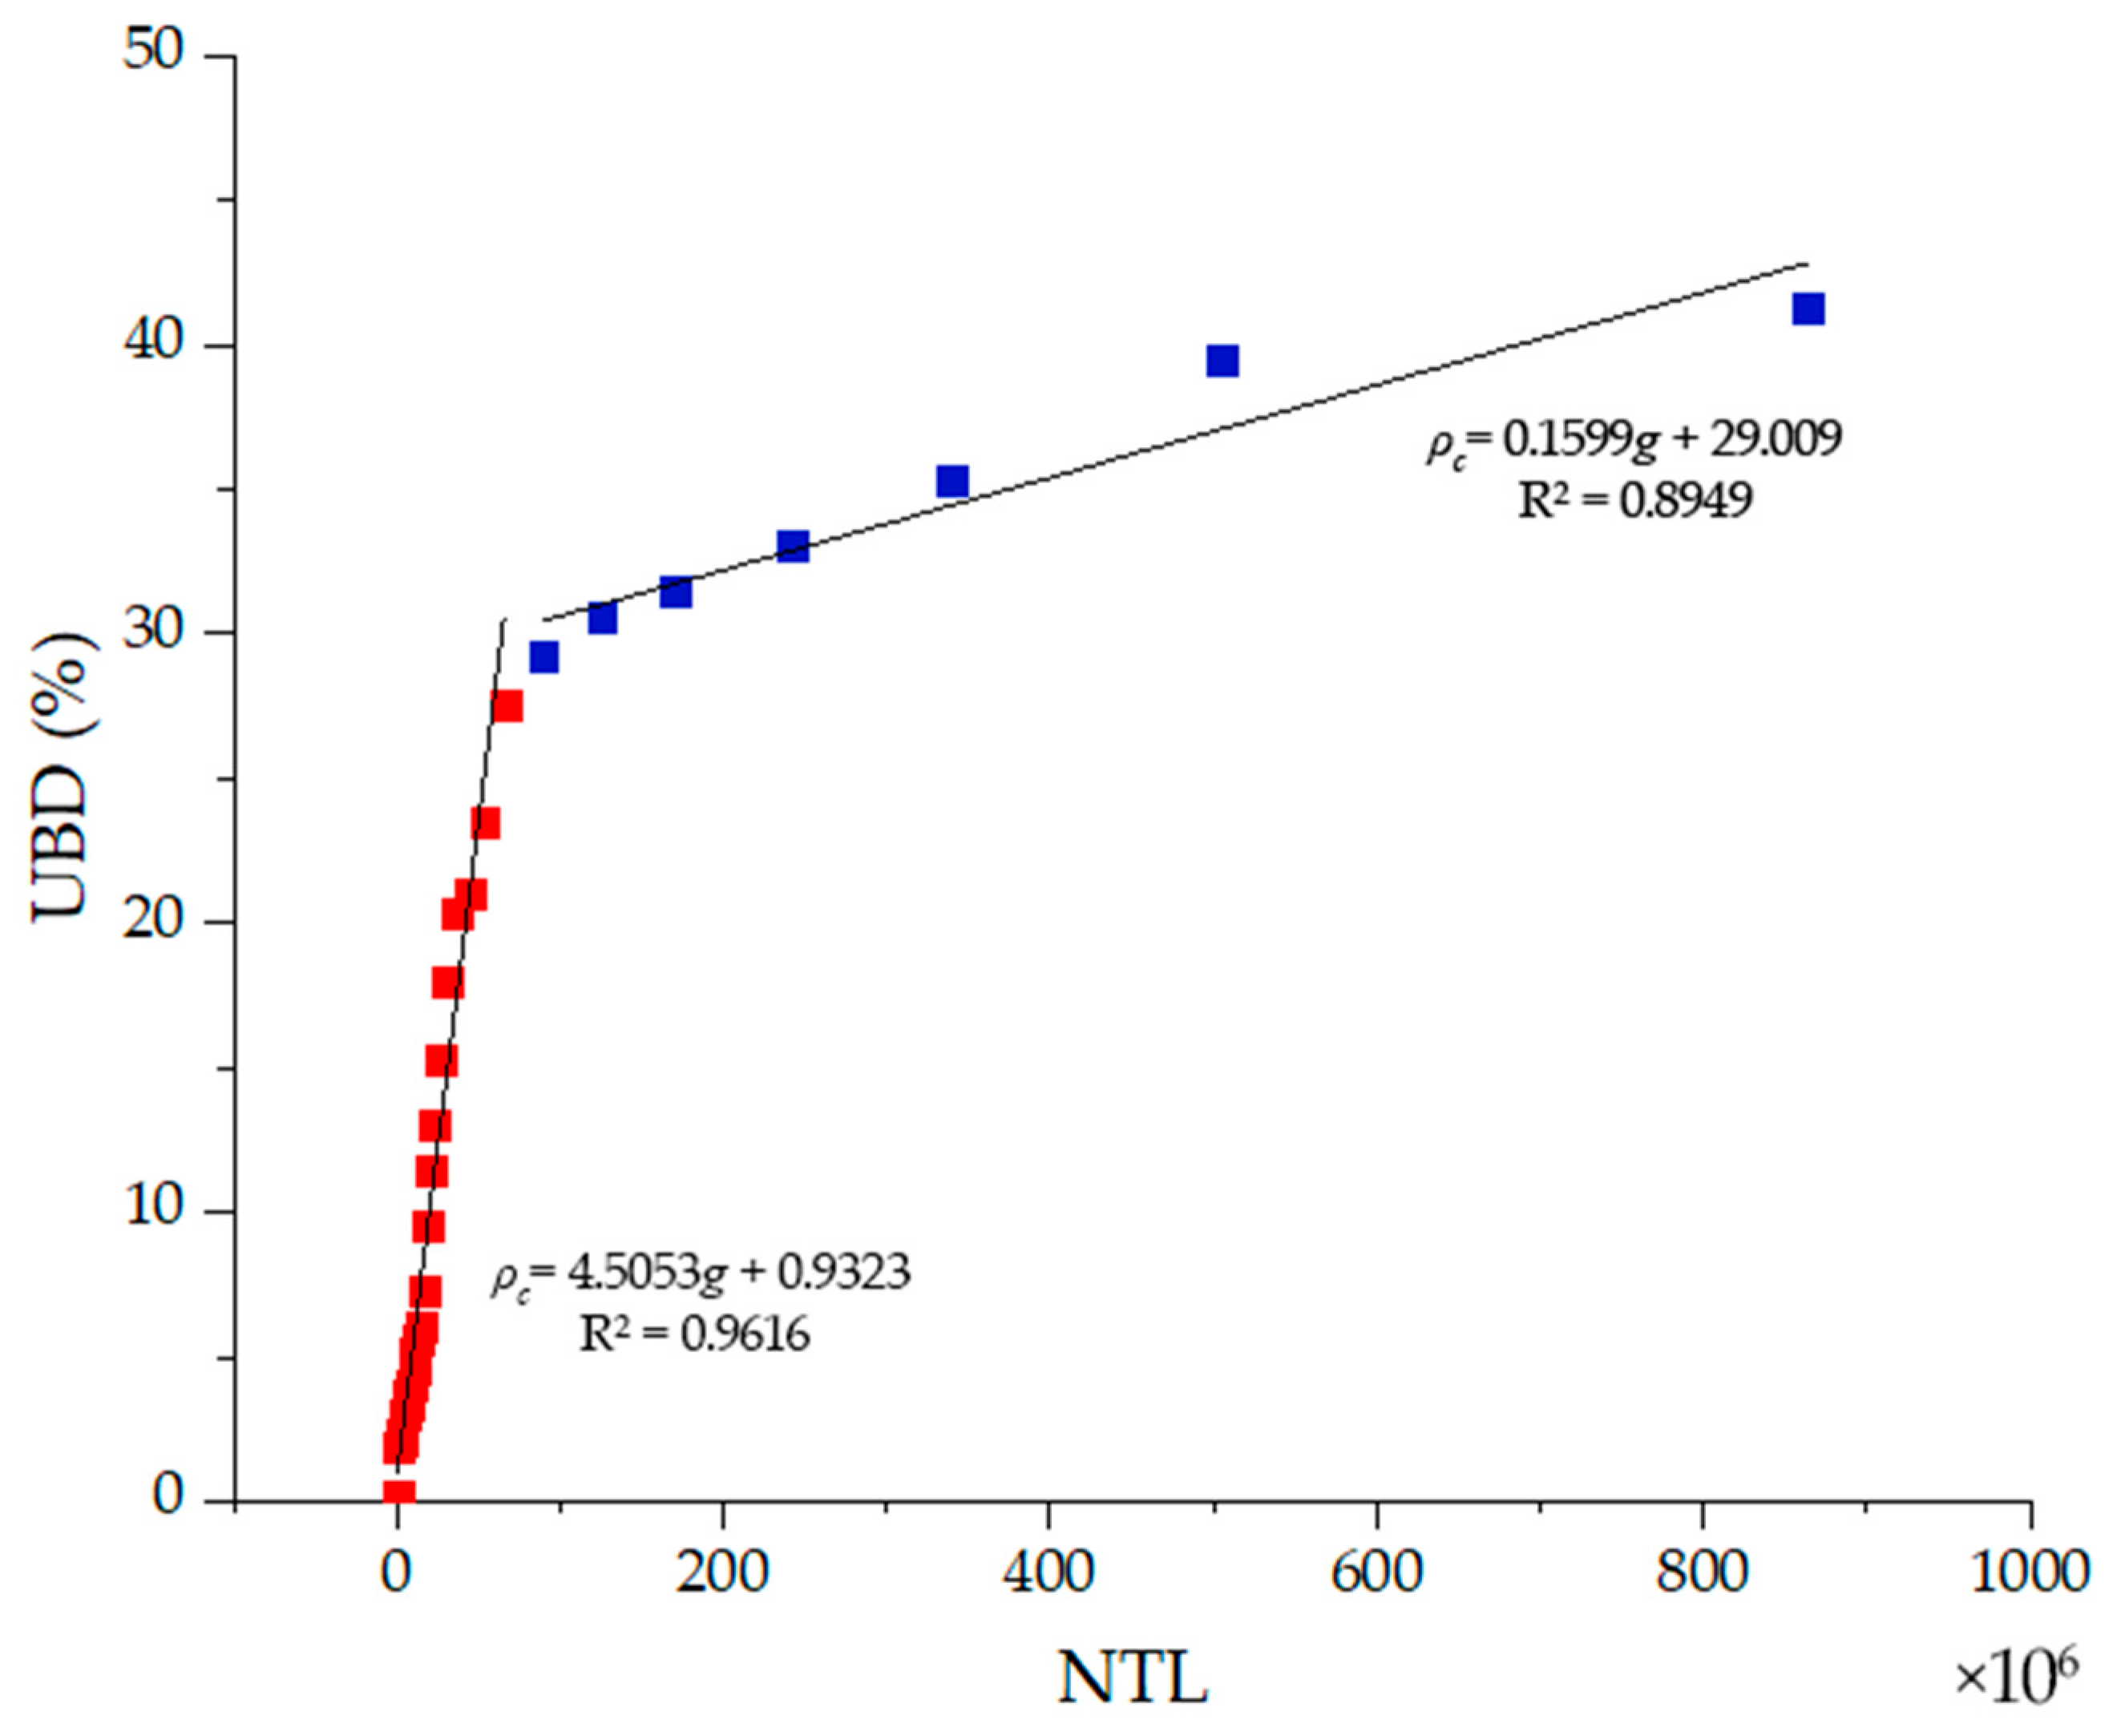
3.1. UBD Estimation Model and Verification
3.2. LST Retrieval from Landsat8
3.3. Geographically Weighted Regression
4. Results and Analysis
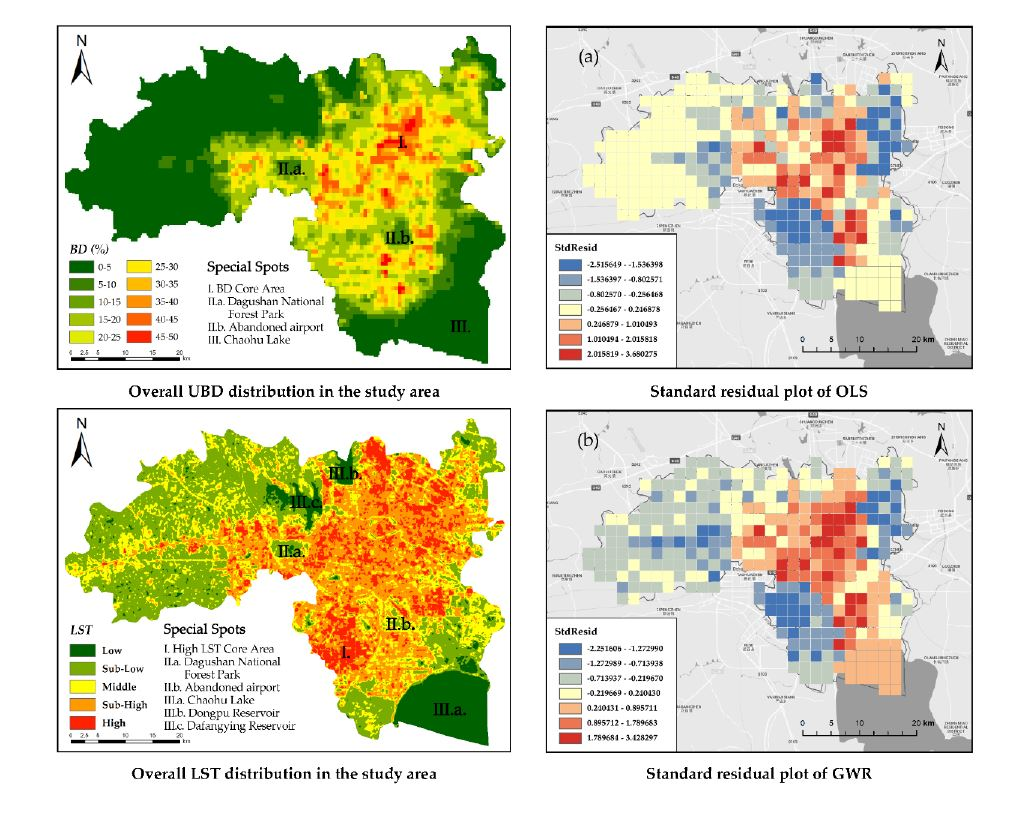
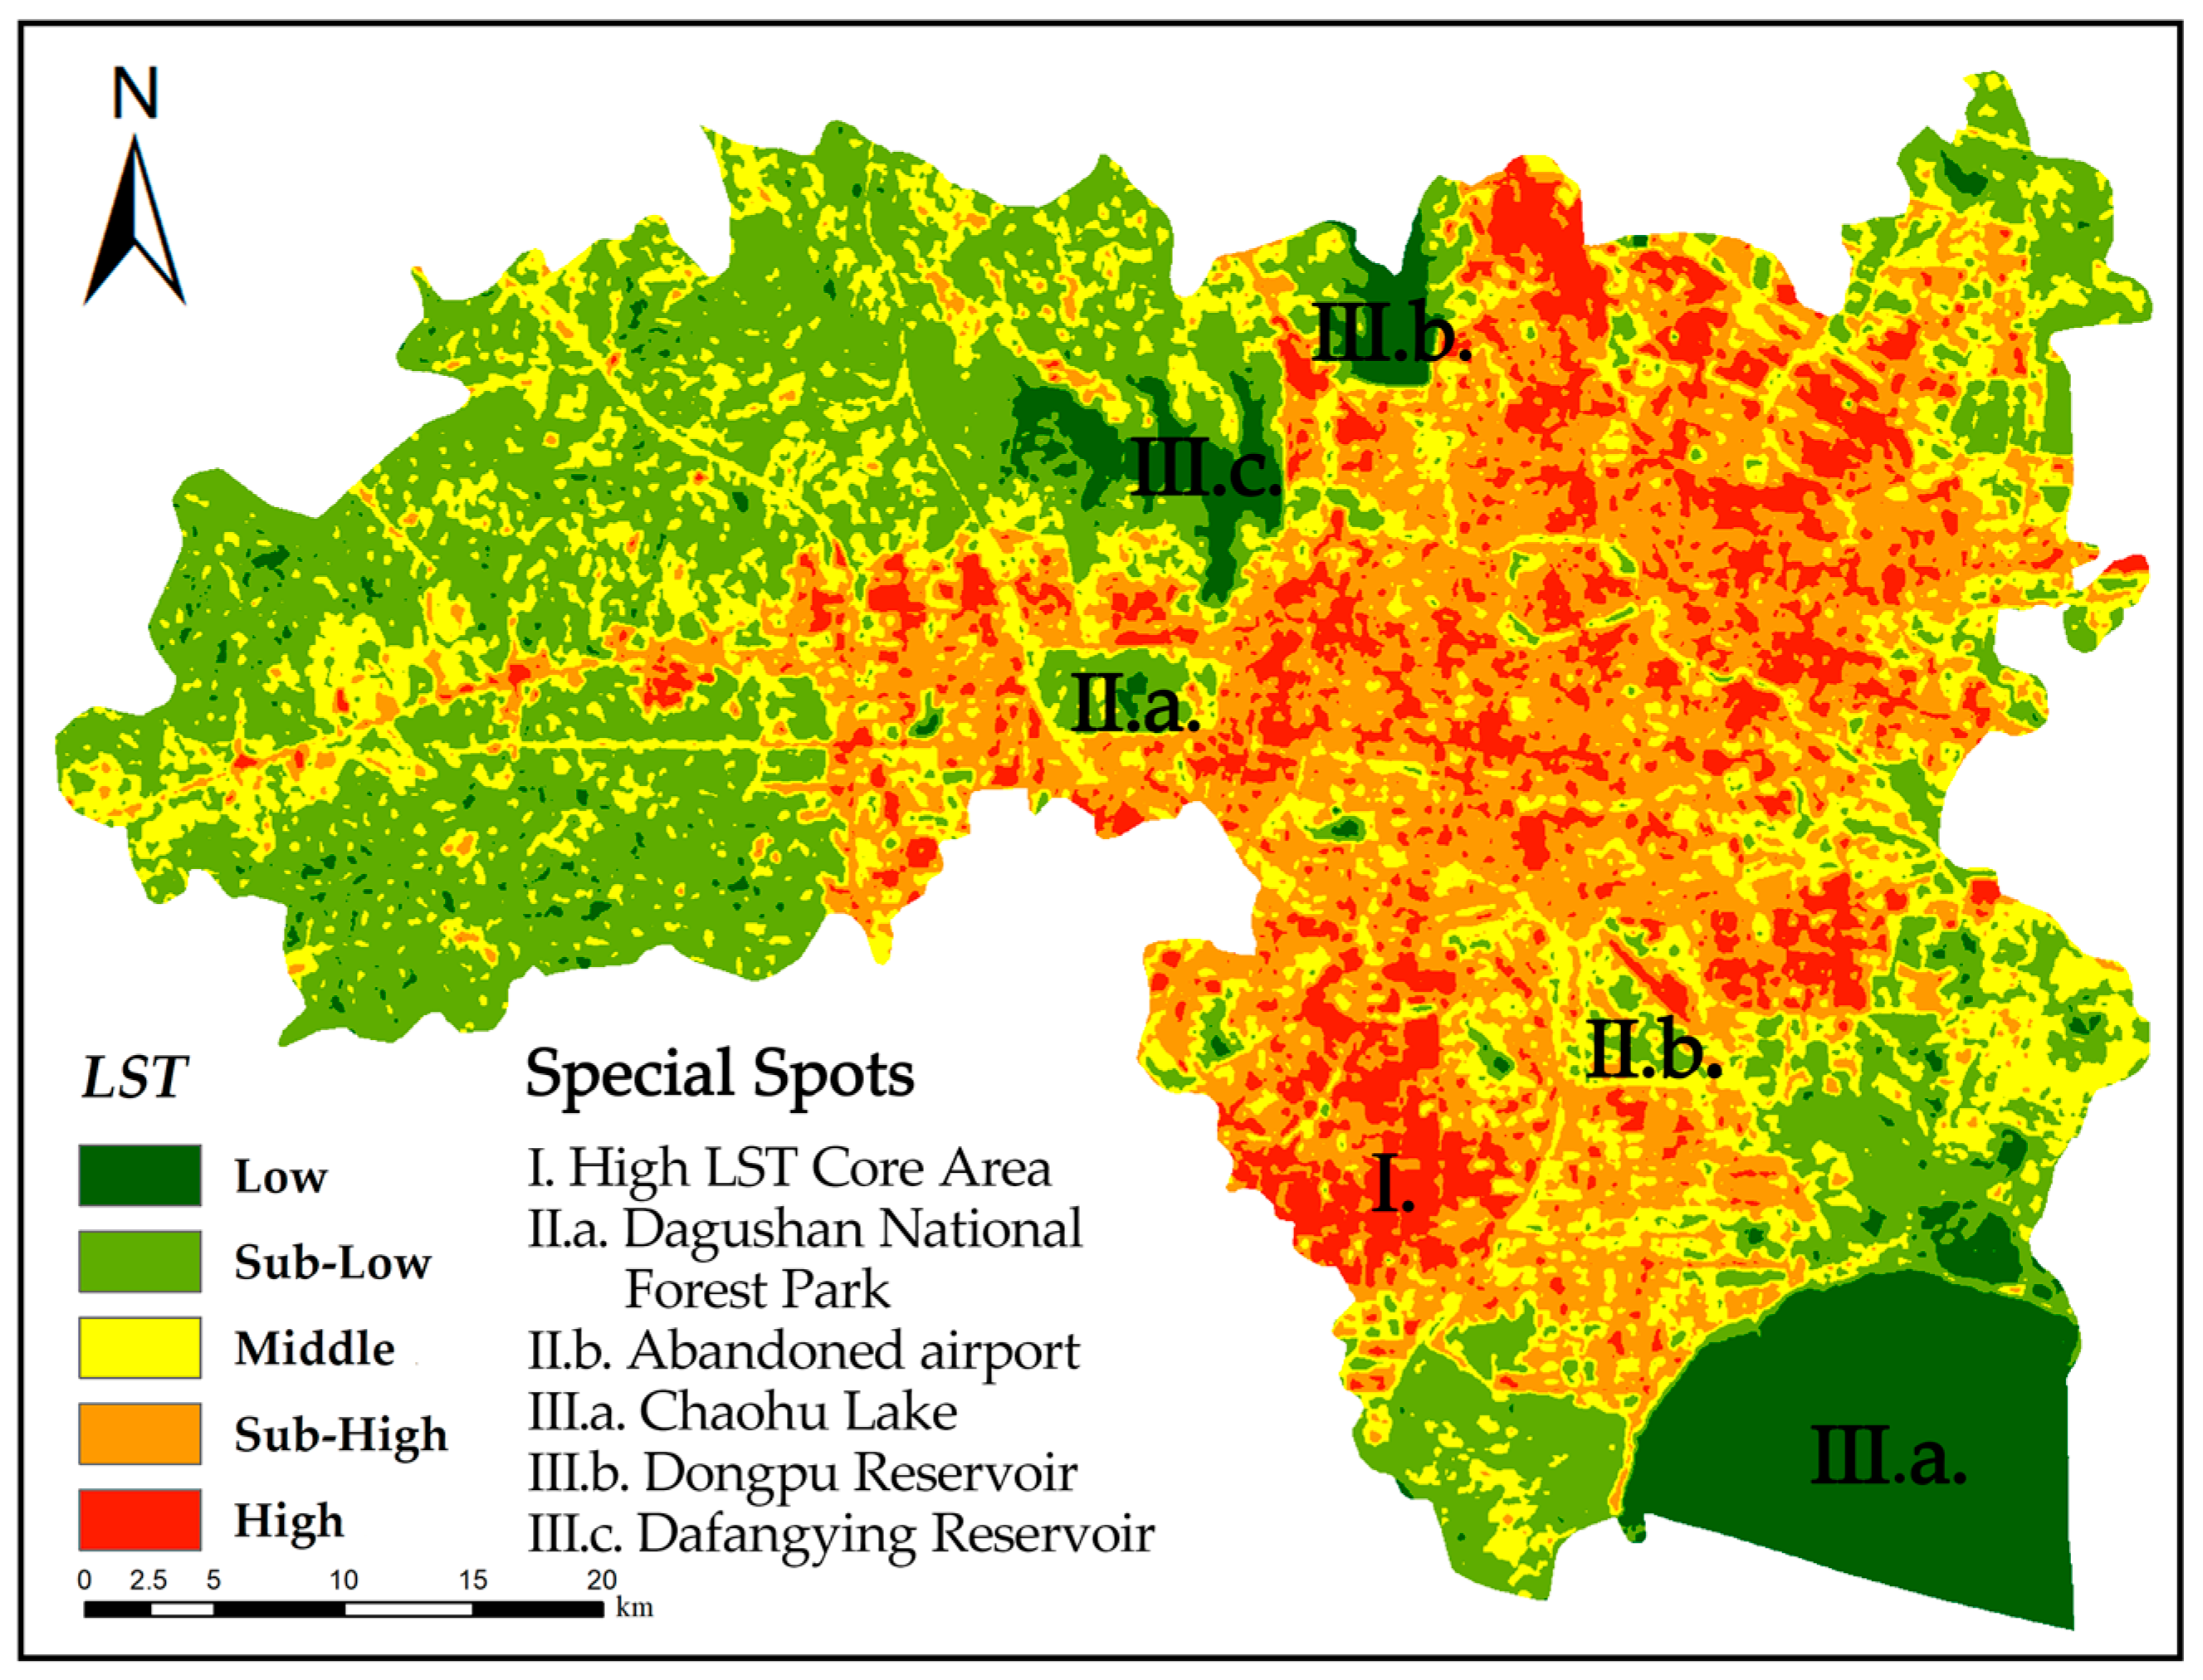
4.1. Spatial Distribution of UBD and LST
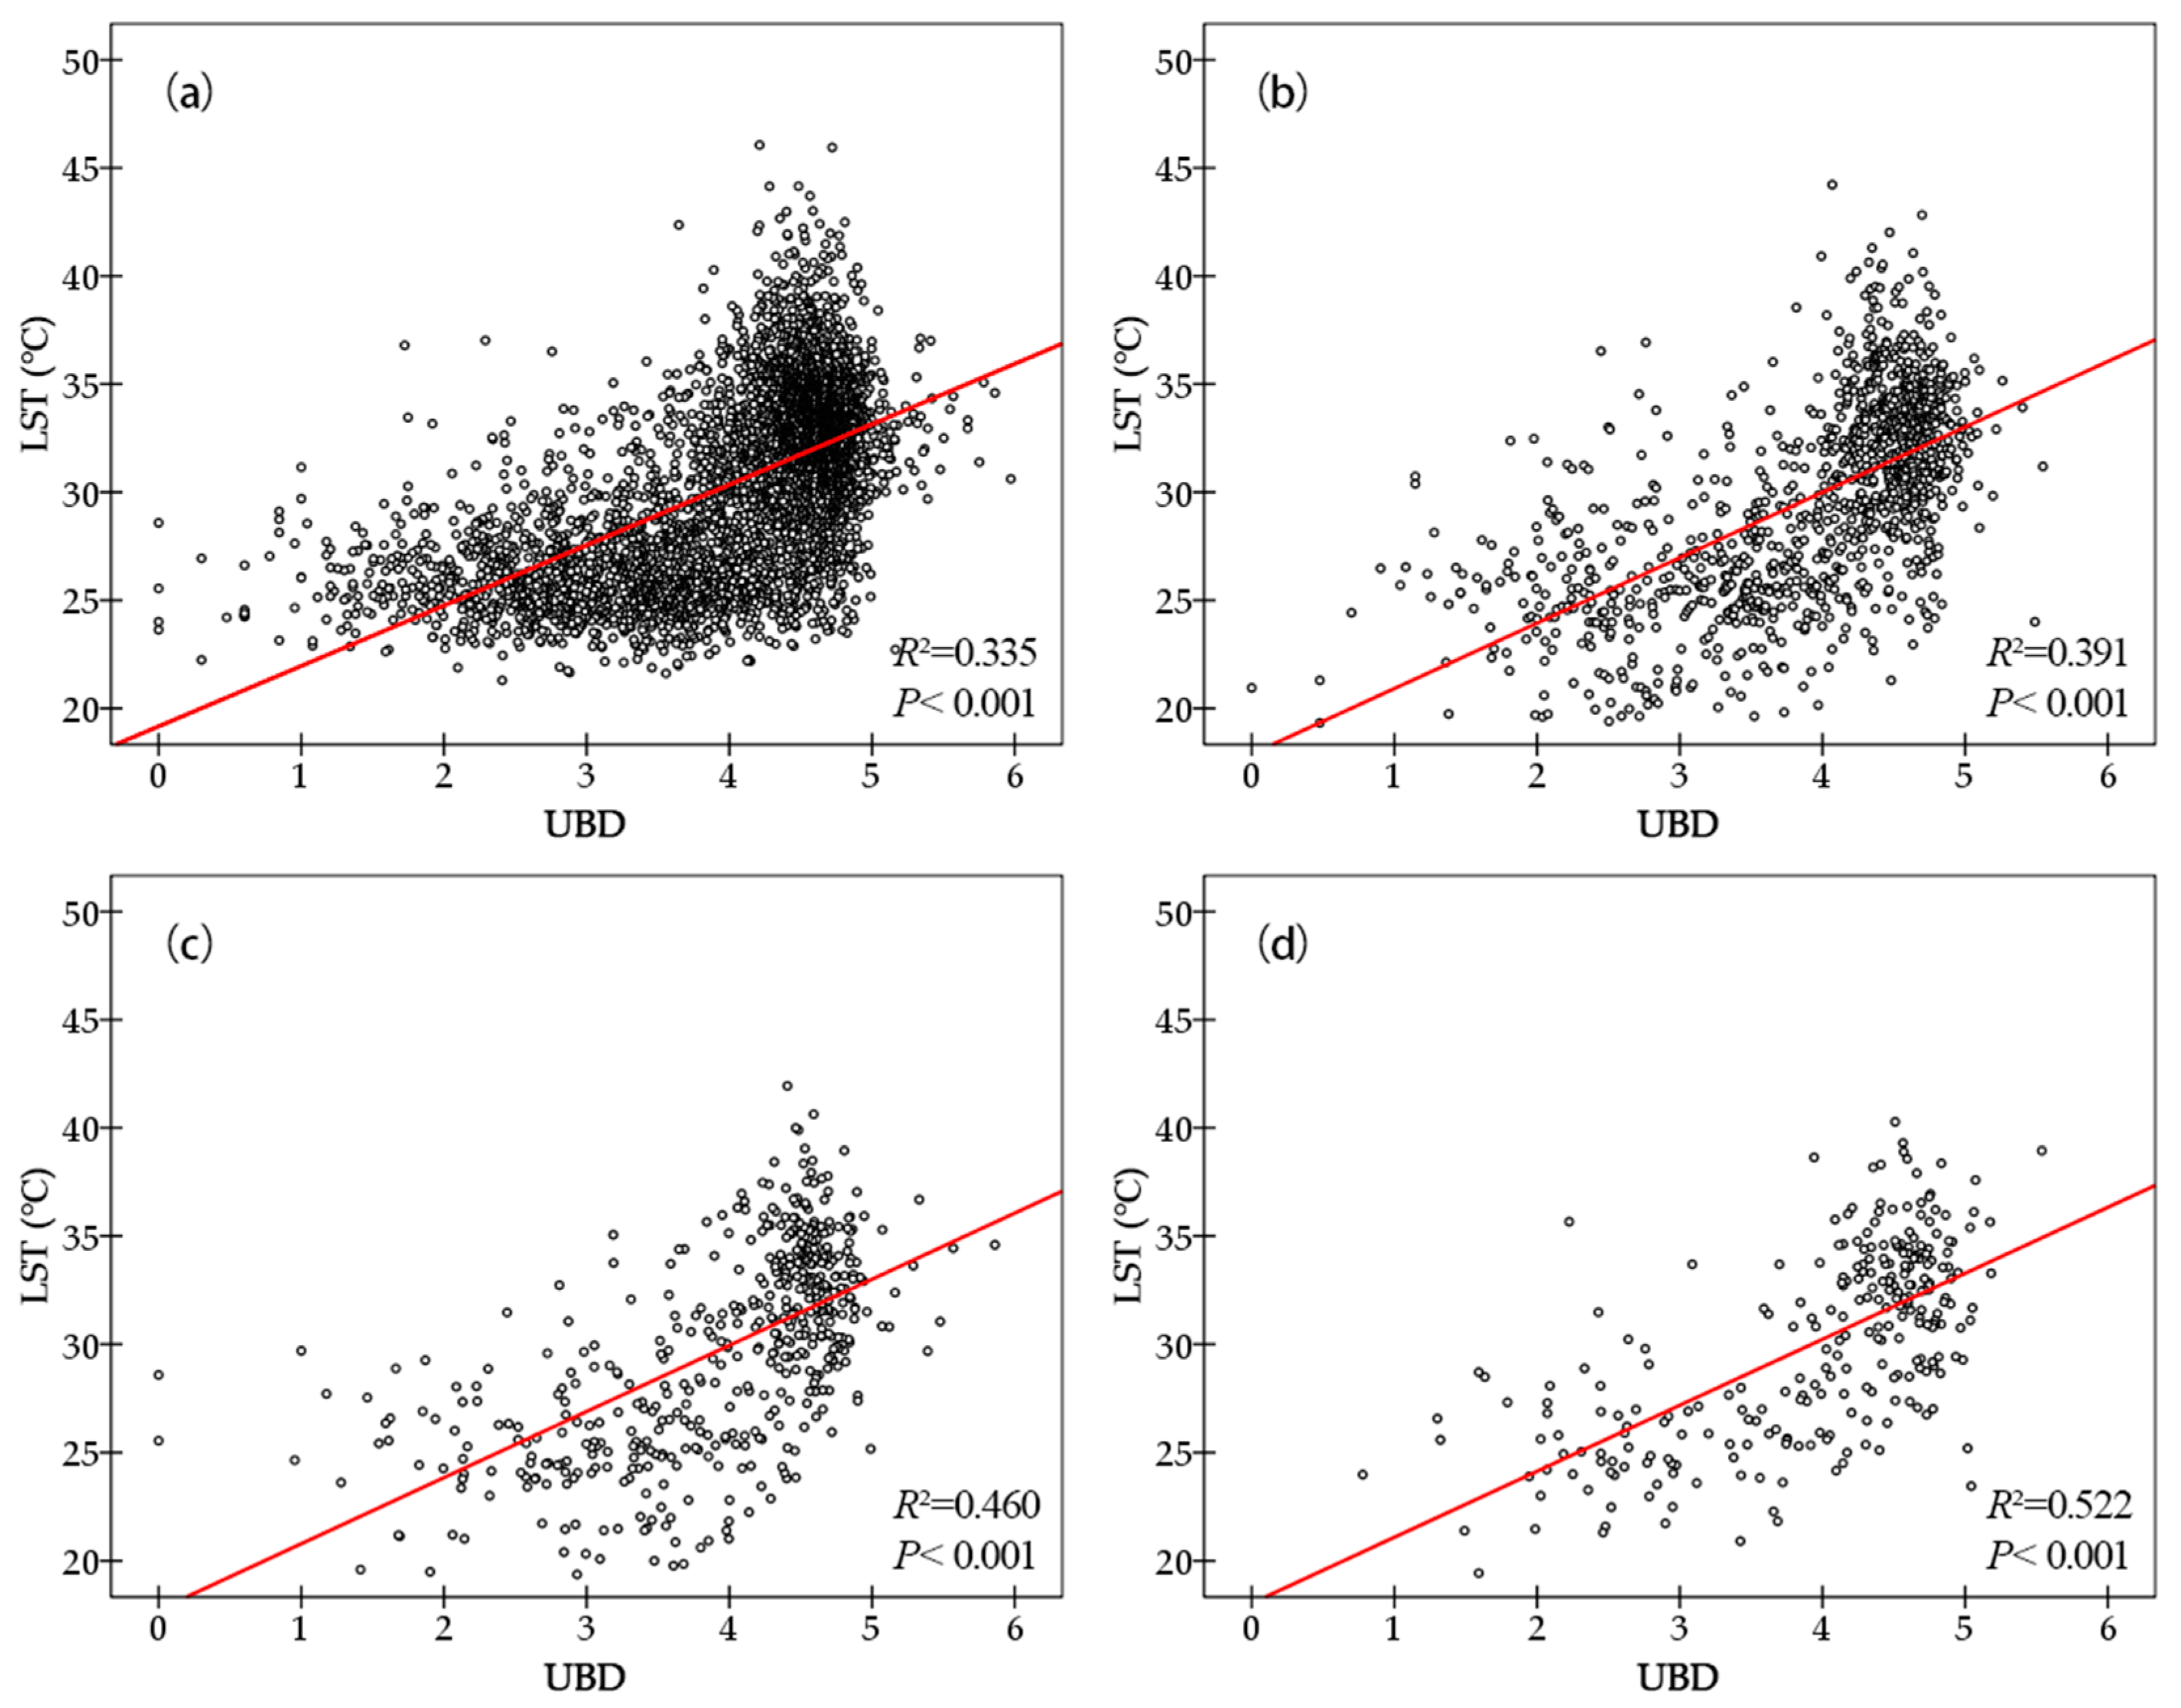
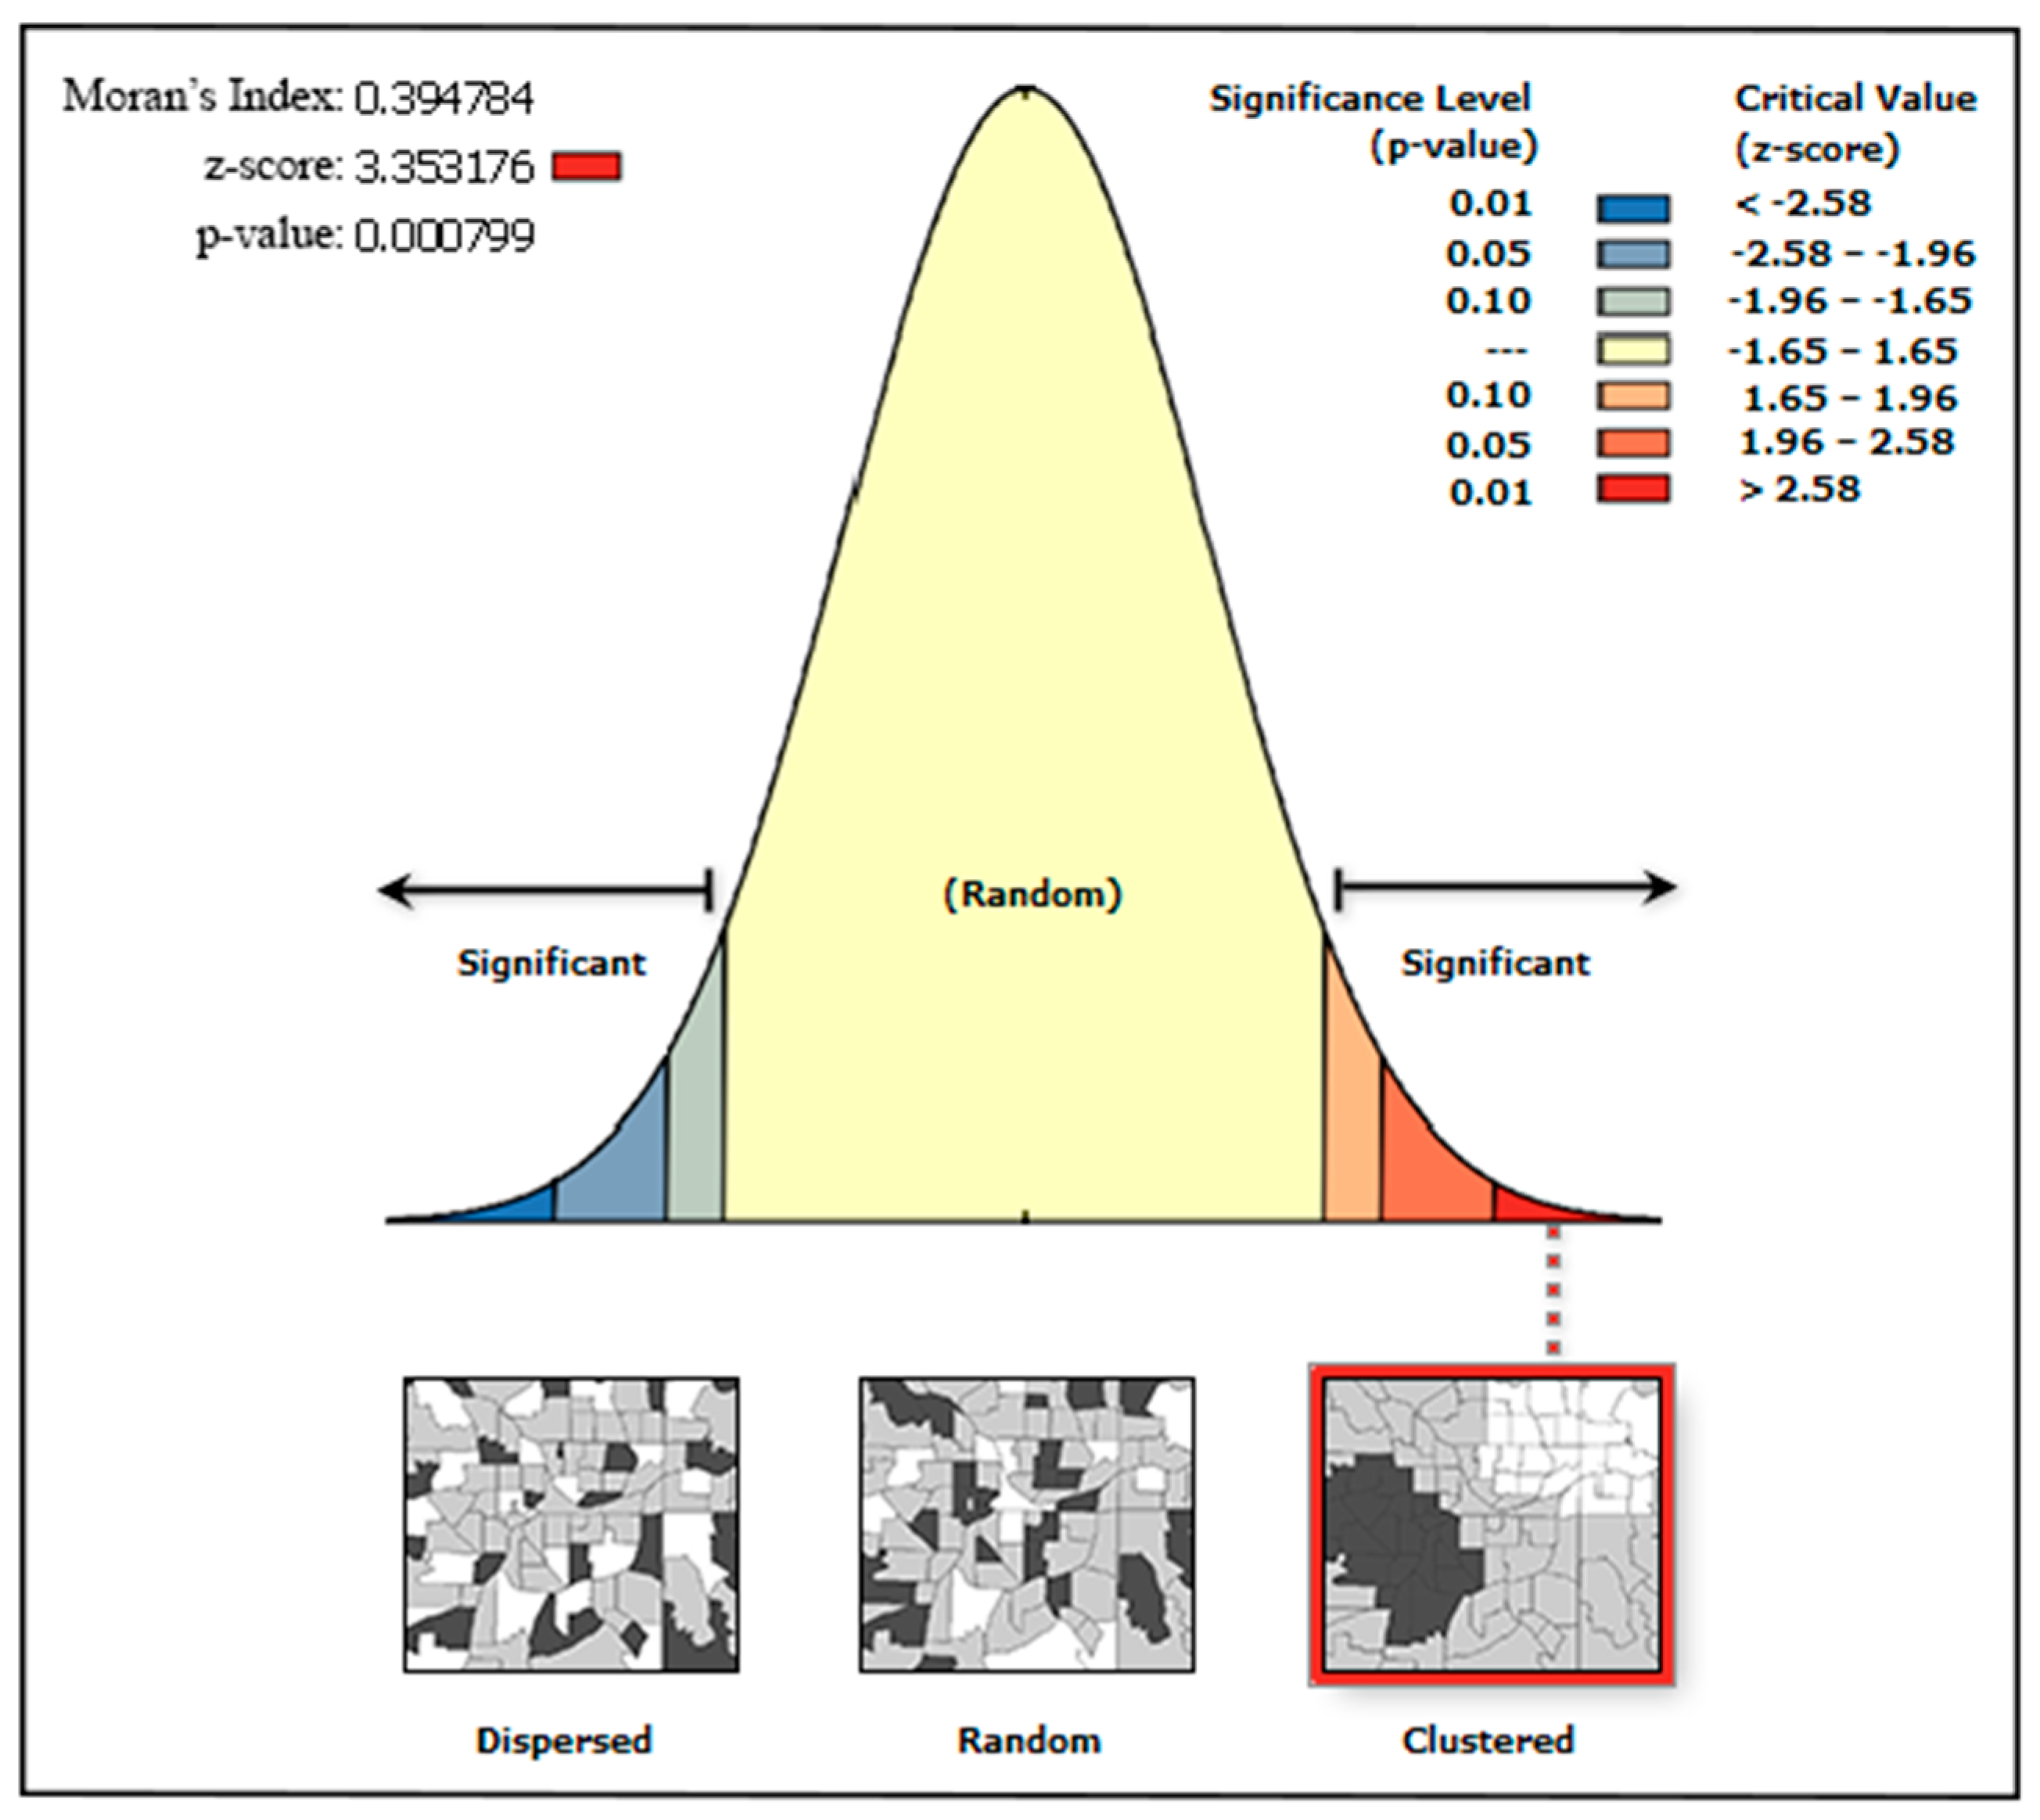
4.2. Spatial Quantitative Analysis of UBD and LST
5. Discussion
- (1)
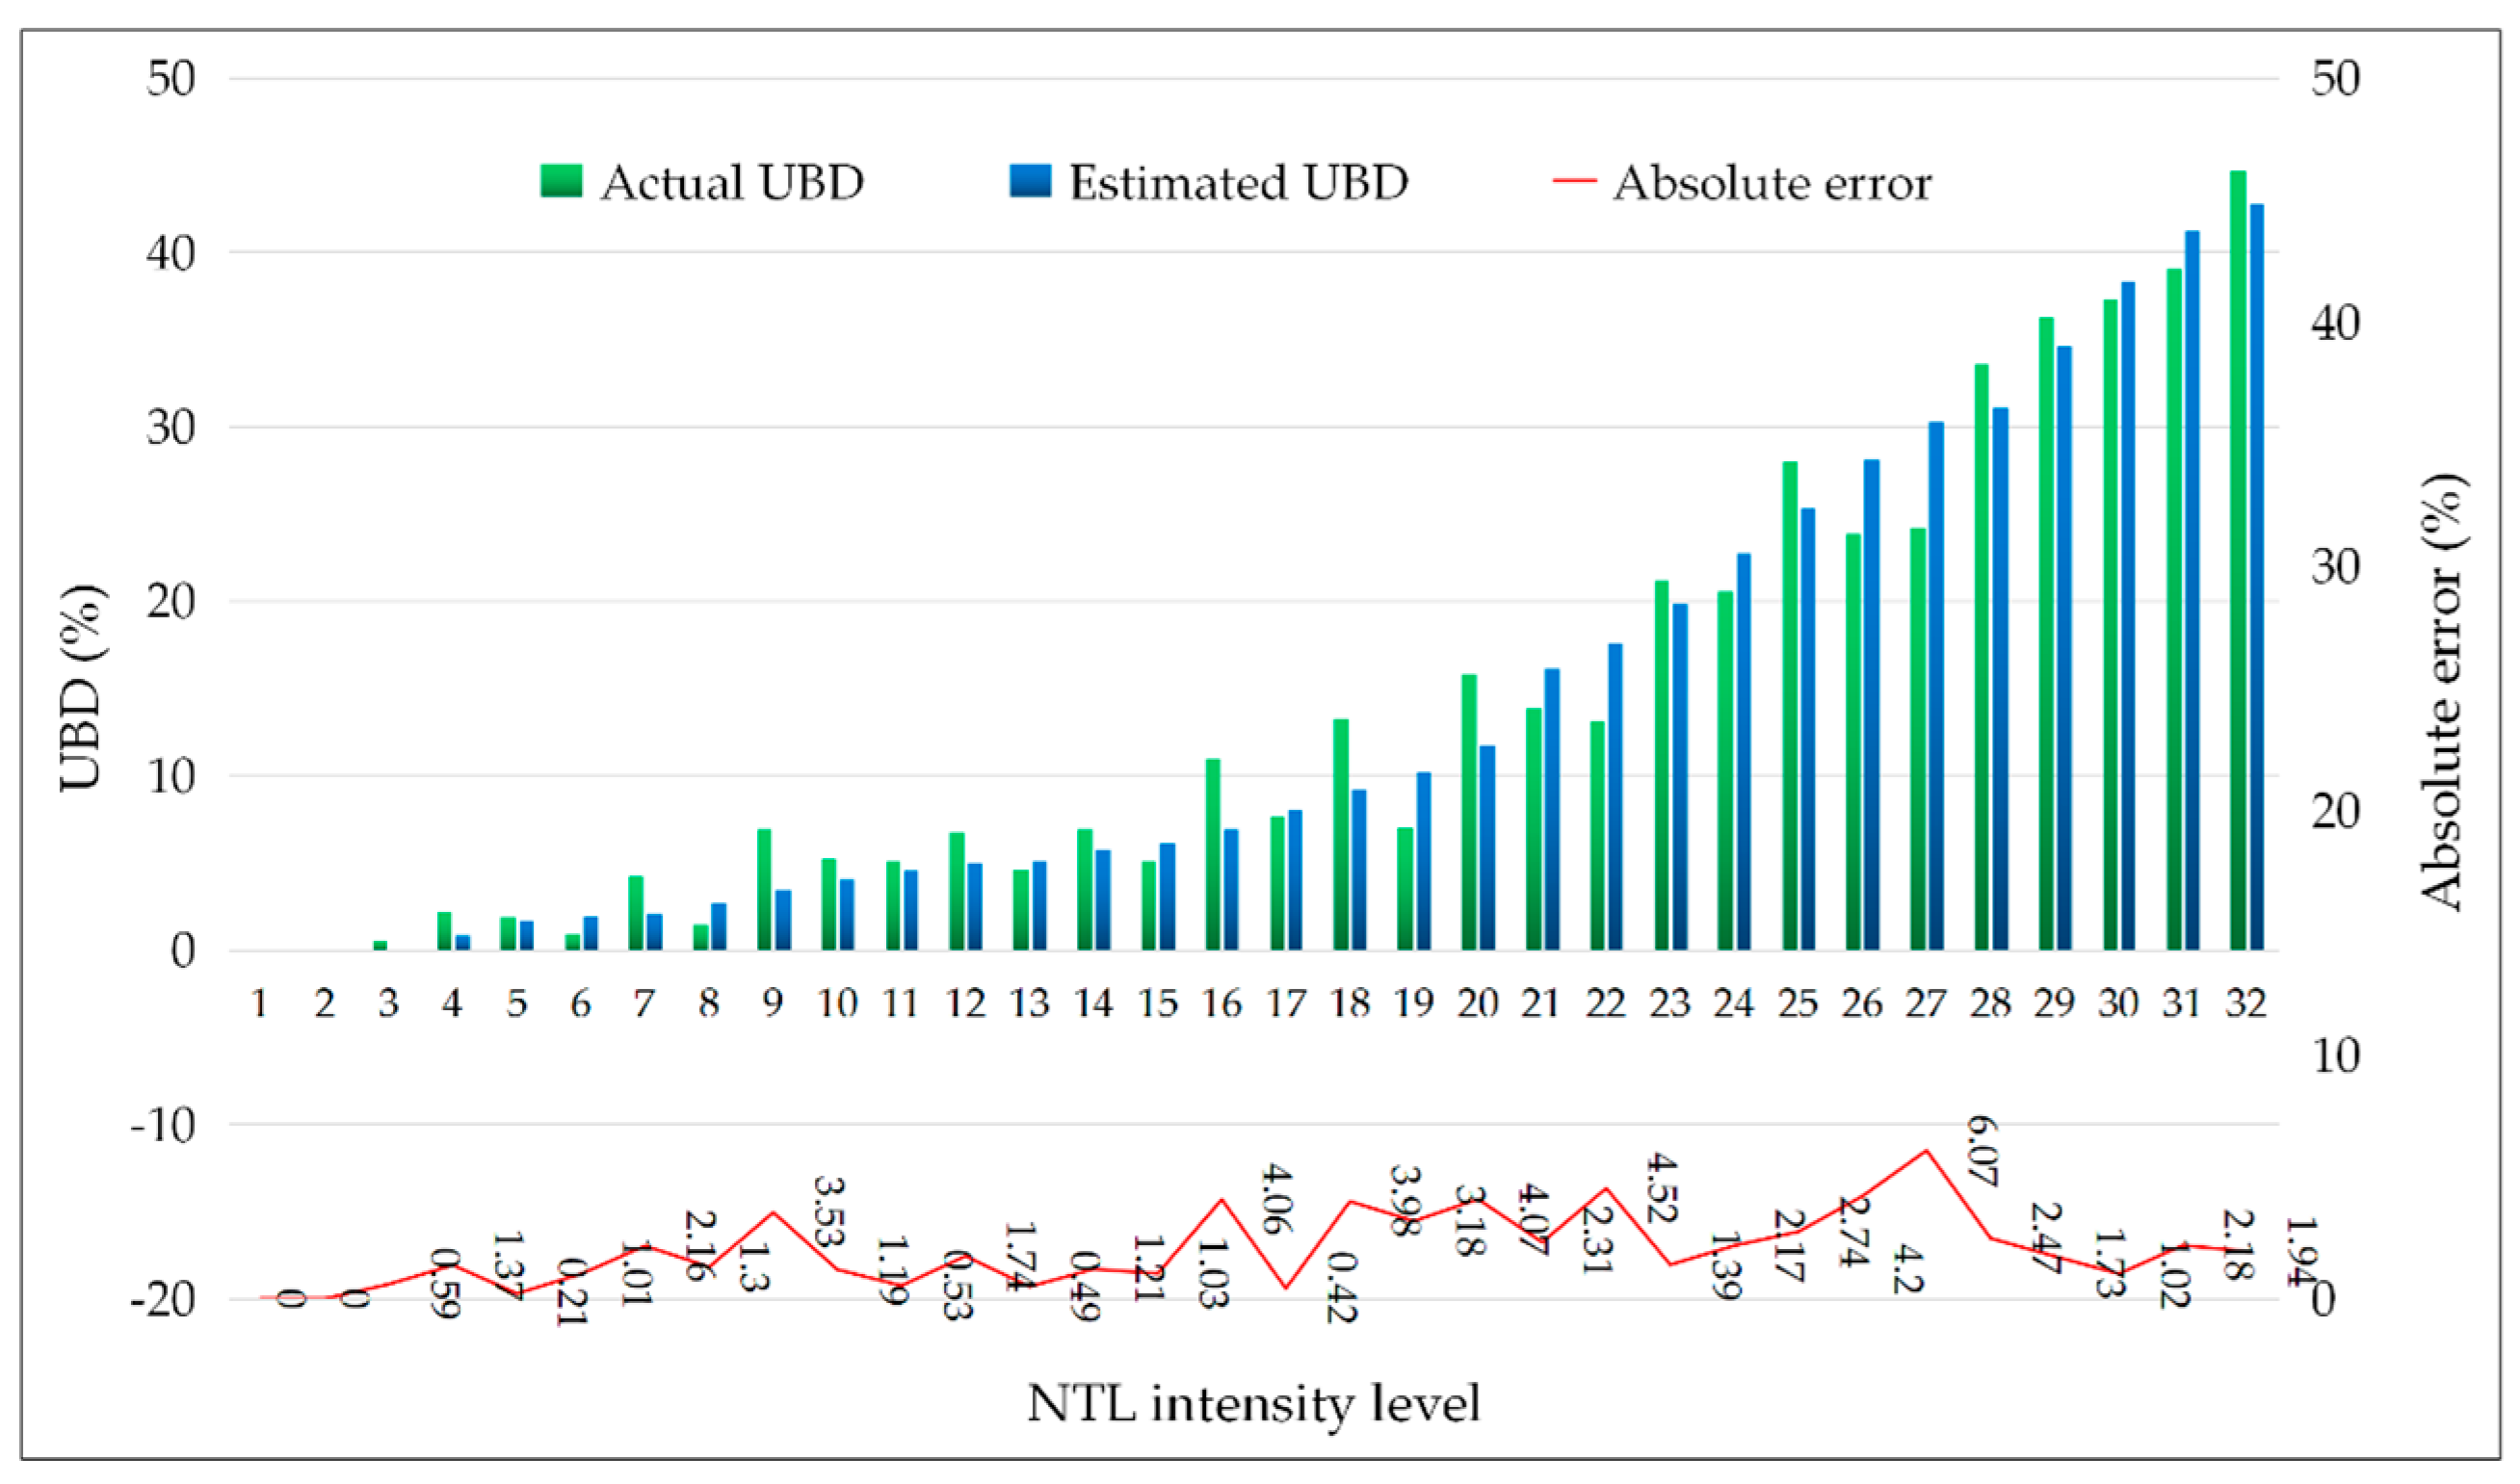
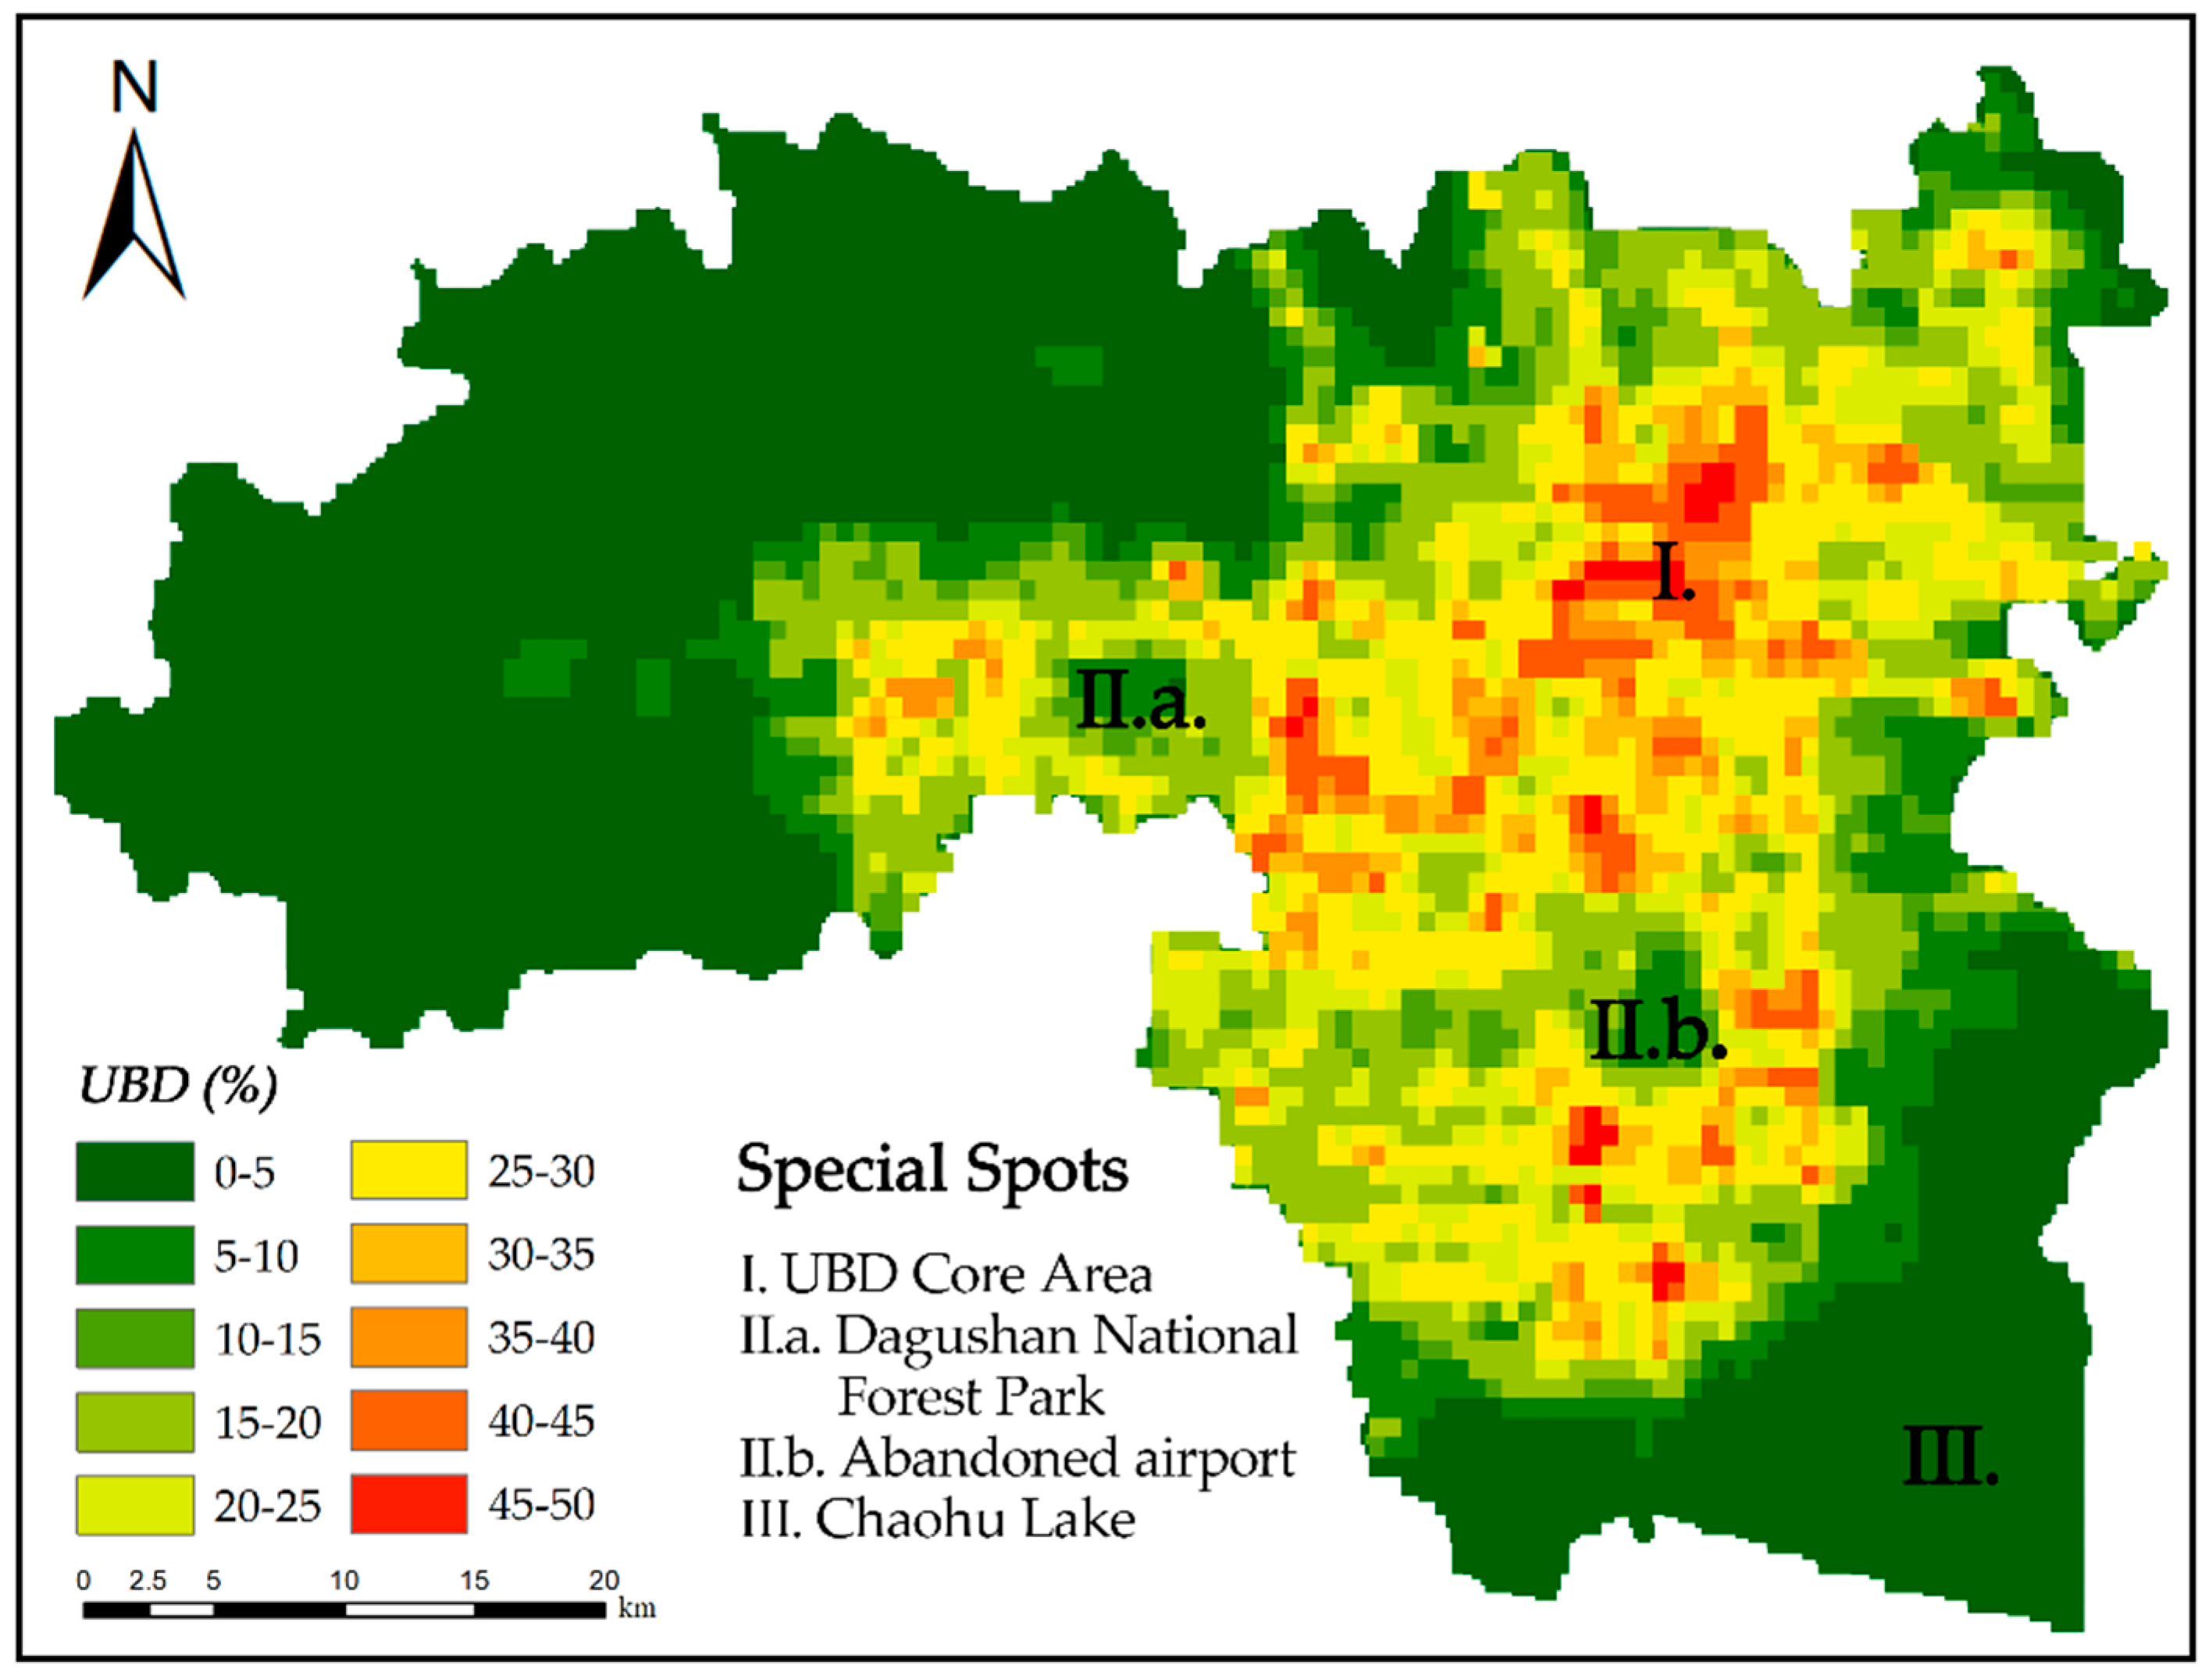
- According to the accuracy verification, the absolute error between the estimated and actual values of UBD was only 3.58%, which proves that Luojia1-01 NTL imagery has strong potential for UBD estimation. The UBD can better reflect the aggregation degree in the built-up area of Hefei and is a full expression of urbanization. Its main feature is that UBD decreases from the interior to the periphery. The areas with high UBD are concentrated in the interior. Where the buildings are dense, the UBD index is large and concentrated, while the lower UBD areas are mostly scattered in the outer suburbs with more vegetation.
- (2)
- UBD and LST were found to be positively spatially correlated at all four scales examined, and the larger the spatial scale, the greater the correlation found.
- (3)
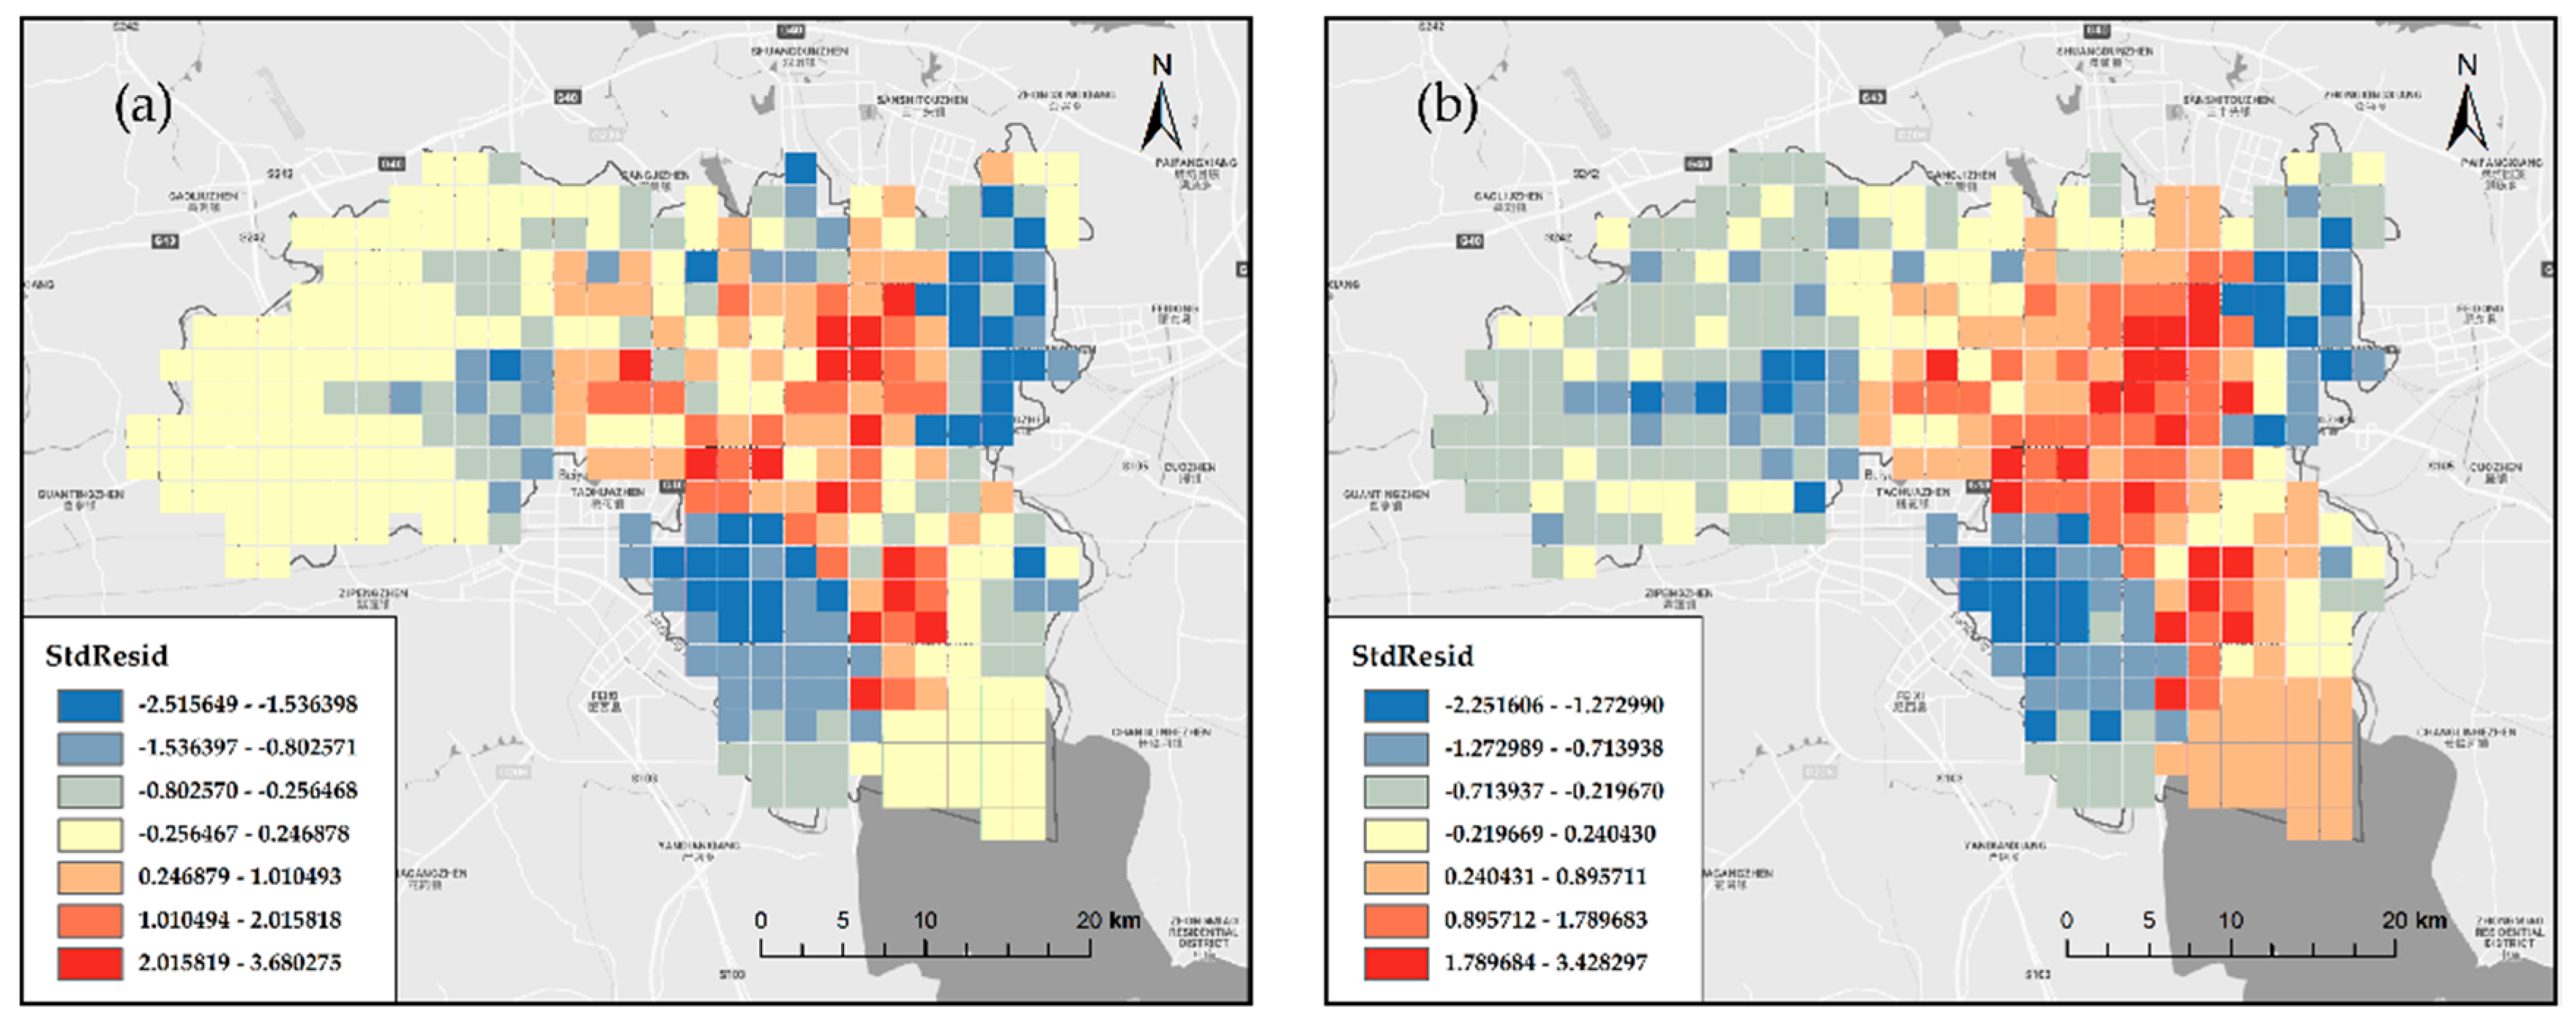
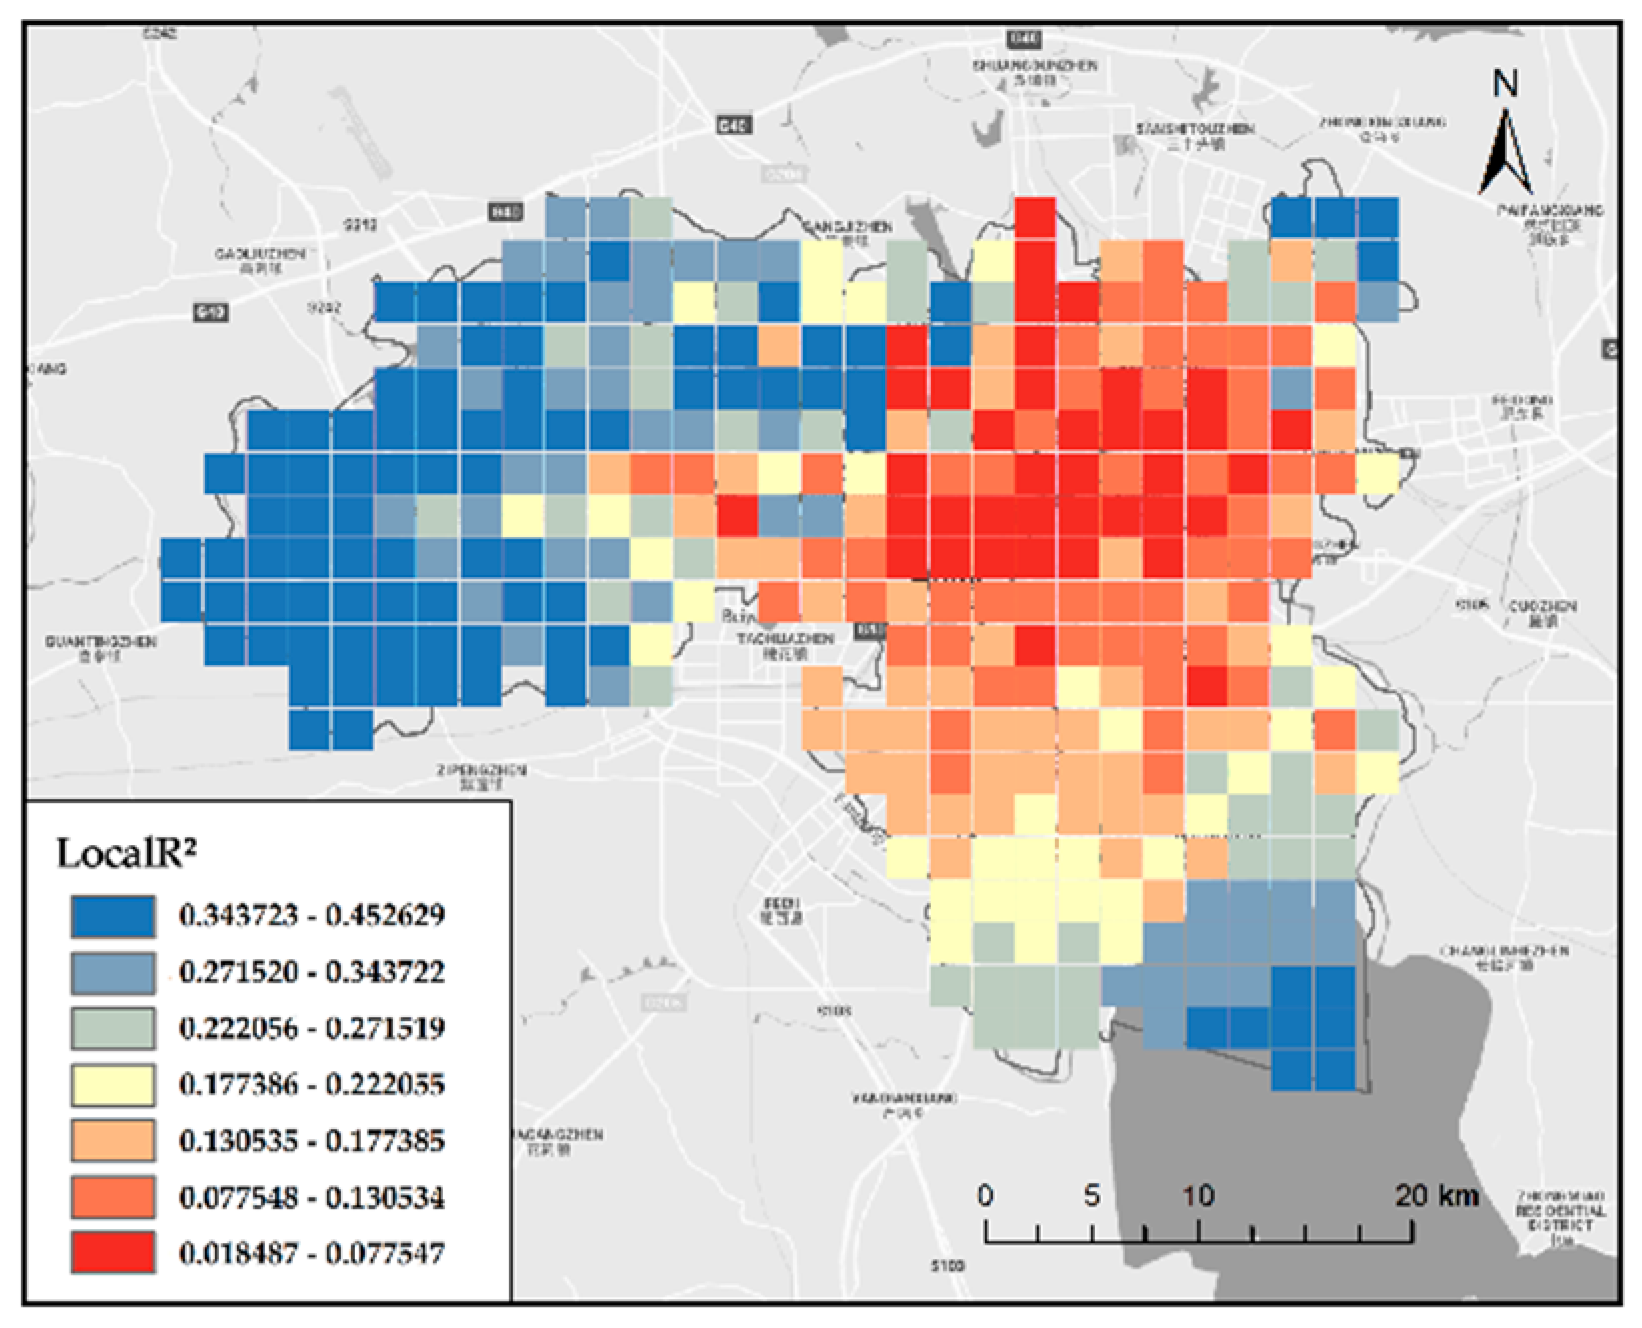
- The simulation effect of GWR was significantly better than that of OLS. GWR had the smallest and Sigma, and the largest 2, while the regression residual of OLS was higher than that of GWR. OLS overestimated or underestimated the heating or cooling capacity of different UBDs. GWR can well reflect the influence of UBD on the LST in different spatial locations, and the results showed excellent visualization effects. Therefore, when studying the relationship between UBD and LST in the city, GWR is more intuitive and accurate.
6. Conclusions
Author Contributions
Funding
Acknowledgments
Conflicts of Interest
References
- Yang, F.; Lau, S.S.Y.; Qian, F. Summertime heat island intensities in three high-rise housing quarters in inner-city Shanghai China: Building layout, density and greenery. Build. Environ. 2010, 45, 115–134. [Google Scholar] [CrossRef]
- Coseo, P.; Larsen, L. Accurate characterization of land cover in urban environments: Determining the importance of including obscured impervious surfaces in urban heat island models. Atmosphere 2019, 10, 347. [Google Scholar] [CrossRef]
- Manoli, G.; Fatichi, S.; Schläpfer, M.; Yu, K.; Crowther, T.W.; Meili, N.; Burlando, P.; Katul, G.G.; Bou-Zeid, E. Magnitude of urban heat islands largely explained by climate and population. Nature 2019, 573, 55–60. [Google Scholar] [CrossRef]
- Liu, Y.; Peng, J.; Wang, Y. Efficiency of landscape metrics characterizing urban land surface temperature. Landsc. Urban Plan. 2018, 180, 36–53. [Google Scholar] [CrossRef]
- Wang, R.; Cai, M.; Ren, C.; Bechtel, B.; Xu, Y.; Ng, E. Detecting multi-temporal land cover change and land surface temperature in Pearl River Delta by adopting local climate zone. Urban Clim. 2019, 28, 100455. [Google Scholar] [CrossRef]
- Wang, C.; Li, Y.; Myint, S.W.; Zhao, Q.; Wentz, E.A. Impacts of spatial clustering of urban land cover on land surface temperature across Köppen climate zones in the contiguous United States. Landsc. Urban Plan. 2019, 192, 103668. [Google Scholar] [CrossRef]
- Zhang, Y.; Sun, L. Spatial-temporal impacts of urban land use land cover on land surface temperature: Case studies of two Canadian urban areas. Int. J. Appl. Earth Obs. Geoinf. 2019, 75, 171–181. [Google Scholar] [CrossRef]
- Ghellere, M.; Bellazzi, A.; Belussi, L.; Meroni, I. Urban monitoring from infrared satellite images. Appl. Opt. 2016, 55, 106–114. [Google Scholar] [CrossRef]
- He, B.-J. Towards the next generation of green building for urban heat island mitigation: Zero UHI impact building. Sustain. Cities Soc. 2019, 50, 101647. [Google Scholar] [CrossRef]
- Liu, H.; Zhan, Q.; Gao, S.; Yang, C. Seasonal variation of the spatially non-stationary association between land surface temperature and urban landscape. Remote Sens. 2019, 11, 1016. [Google Scholar] [CrossRef]
- Zhou, Y.; Lin, C.; Wang, S.; Liu, W.; Tian, Y. Estimation of building density with the integrated use of GF-1 PMS and Radarsat-2 data. Remote Sens. 2016, 8, 969. [Google Scholar] [CrossRef]
- Guo, F.; Zhu, P.; Wang, S.; Duan, D.; Jin, Y. Improving natural ventilation performance in a high-density urban district: A building morphology method. Procedia Eng. 2017, 205, 952–958. [Google Scholar] [CrossRef]
- Yang, X.; Li, Y. The impact of building density and building height heterogeneity on average urban albedo and street surface temperature. Build. Environ. 2015, 90, 146–156. [Google Scholar] [CrossRef]
- Zhang, J.; Xu, L.; Shabunko, V.; Tay, S.E.R.; Sun, H.; Lau, S.S.Y.; Reindl, T. Impact of urban block typology on building solar potential and energy use efficiency in tropical high-density city. Appl. Energy 2019, 240, 513–533. [Google Scholar] [CrossRef]
- Resch, E.; Bohne, R.A.; Kvamsdal, T.; Lohne, J. Impact of urban density and building height on energy use in cities. Energy Procedia 2016, 96, 800–814. [Google Scholar] [CrossRef]
- Amaya-Espinel, J.D.; Hostetler, M.; Henríquez, C.; Bonacic, C. The influence of building density on Neotropical bird communities found in small urban parks. Landsc. Urban Plan. 2019, 190, 103578. [Google Scholar] [CrossRef]
- Chan, I.Y.S.; Liu, A.M.M. Effects of neighborhood building density, height, greenspace, and cleanliness on indoor environment and health of building occupants. Build. Environ. 2018, 145, 213–222. [Google Scholar] [CrossRef]
- Stewart, I.D.; Oke, T.R.; Krayenhoff, E.S. Evaluation of the “local climate zone” scheme using temperature observations and model simulations. Int. J. Climatol. 2014, 34, 1062–1080. [Google Scholar] [CrossRef]
- Perini, K.; Magliocco, A. Effects of vegetation, urban density, building height, and atmospheric conditions on local temperatures and thermal comfort. Urban For. Urban Green. 2014, 13, 495–506. [Google Scholar] [CrossRef]
- Yin, C.; Yuan, M.; Lu, Y.; Huang, Y.; Liu, Y. Effects of urban form on the urban heat island effect based on spatial regression model. Sci. Total Environ. 2018, 634, 696–704. [Google Scholar] [CrossRef]
- Bonafoni, S.; Keeratikasikorn, C. Land Surface Temperature and Urban Density: Multiyear Modeling and Relationship Analysis Using MODIS and Landsat Data. Remote Sens. 2018, 10, 1471. [Google Scholar] [CrossRef]
- Luxmoore, D.A.; Jayasinghe, M.T.R.; Mahendran, M. Mitigating temperature increases in high lot density sub-tropical residential developments. Energy Build. 2005, 37, 1212–1224. [Google Scholar] [CrossRef][Green Version]
- Giridharan, R.; Lau, S.S.Y.; Ganesan, S.; Givoni, B. Urban design factors influencing heat island intensity in high-rise high-density environments of Hong Kong. Build. Environ. 2007, 42, 3669–3684. [Google Scholar] [CrossRef]
- Hu, Y.; White, M.; Ding, W. An urban form experiment on urban heat island effect in high density area. Procedia Eng. 2016, 169, 166–174. [Google Scholar] [CrossRef]
- Benza, M.; Weeks, J.R.; Stow, D.A.; López-Carr, D.; Clarke, K.C. A pattern-based definition of urban context using remote sensing and GIS. Remote Sens. Environ. 2016, 183, 250–264. [Google Scholar] [CrossRef]
- Yao, R.; Wang, L.; Huang, X.; Niu, Y.; Chen, Y.; Niu, Z. The influence of different data and method on estimating the surface urban heat island intensity. Ecol. Indic. 2018, 89, 45–55. [Google Scholar] [CrossRef]
- Yu, X.; Guo, X.; Wu, Z. Land surface temperature retrieval from Landsat 8 TIRS—Comparison between radiative transfer equation-based method, split window algorithm and single channel method. Remote Sens. 2014, 6, 9829–9852. [Google Scholar] [CrossRef]
- Pan, X.-Z.; Zhao, Q.-G.; Chen, J.; Liang, Y.; Sun, B. Analyzing the variation of building density using high spatial resolution satellite images: The example of Shanghai City. Sensors 2008, 8, 2541–2550. [Google Scholar] [CrossRef]
- Huang, X.; Lu, Q.; Zhang, L. A multi-index learning approach for classification of high-resolution remotely sensed images over urban areas. ISPRS J. Photogramm. Remote Sens. 2014, 90, 36–48. [Google Scholar] [CrossRef]
- Qi, K.; Hu, Y.n.; Cheng, C.; Chen, B. Transferability of economy estimation based on DMSP/OLS night-time light. Remote Sens. 2017, 9, 786. [Google Scholar] [CrossRef]
- Wu, J.; Wang, Z.; Li, W.; Peng, J. Exploring factors affecting the relationship between light consumption and GDP based on DMSP/OLS nighttime satellite imagery. Remote Sens. Environ. 2013, 134, 111–119. [Google Scholar] [CrossRef]
- Keola, S.; Andersson, M.; Hall, O. Monitoring economic development from space: Using nighttime light and land cover data to measure economic growth. World Dev. 2015, 66, 322–334. [Google Scholar] [CrossRef]
- Ma, T.; Zhou, Y.; Zhou, C.; Haynie, S.; Pei, T.; Xu, T. Night-time light derived estimation of spatio-temporal characteristics of urbanization dynamics using DMSP/OLS satellite data. Remote Sens. Environ. 2015, 158, 453–464. [Google Scholar] [CrossRef]
- Xie, Y.; Weng, Q. Spatiotemporally enhancing time-series DMSP/OLS nighttime light imagery for assessing large-scale urban dynamics. ISPRS J. Photogramm. Remote Sens. 2017, 128, 1–15. [Google Scholar] [CrossRef]
- Xie, Y.; Weng, Q. Updating urban extents with nighttime light imagery by using an object-based thresholding method. Remote Sens. Environ. 2016, 187, 1–13. [Google Scholar] [CrossRef]
- Zhou, T.; Shi, W.; Liu, X.; Tao, F.; Qian, Z.; Zhang, R. A Novel Approach for Online Car-Hailing Monitoring Using Spatiotemporal Big Data. IEEE Access 2019, 7, 128936–128947. [Google Scholar] [CrossRef]
- Li, X.; Li, D.; Xu, H.; Wu, C. Intercalibration between DMSP/OLS and VIIRS night-time light images to evaluate city light dynamics of Syria’s major human settlement during Syrian Civil War. Int. J. Remote Sens. 2017, 38, 5934–5951. [Google Scholar] [CrossRef]
- Li, X.; Liu, S.; Jendryke, M.; Li, D.; Wu, C. Night-time light dynamics during the Iraqi Civil War. Remote Sens. 2018, 10, 858. [Google Scholar] [CrossRef]
- Falchetta, G.; Noussan, M. Interannual variation in night-time light radiance predicts changes in national electricity consumption conditional on income-level and region. Energies 2019, 12, 456. [Google Scholar] [CrossRef]
- Xie, Y.; Weng, Q. Detecting urban-scale dynamics of electricity consumption at Chinese cities using time-series DMSP-OLS (Defense Meteorological Satellite Program-Operational Linescan System) nighttime light imageries. Energy 2016, 100, 177–189. [Google Scholar] [CrossRef]
- Chen, T.-H.K.; Prishchepov, A.; Fensholt, R.; Sabel, C. Detecting and monitoring long-term landslides in urbanized areas with nighttime light data and multi-seasonal Landsat imagery across Taiwan from 1998 to 2017. Remote Sens. Environ. 2019, 225, 317–327. [Google Scholar] [CrossRef]
- Mohamadi, B.; Chen, S.; Liu, J. Evacuation priority method in tsunami hazard based on DMSP/OLS population mapping in the Pearl River Estuary, China. ISPRS Int. J. Geoinf. 2019, 8, 137. [Google Scholar] [CrossRef]
- Jiang, W.; He, G.; Long, T.; Guo, H.; Yin, R.; Leng, W.; Liu, H.; Wang, G. Potentiality of using Luojia 1-01 nighttime light imagery to investigate artificial light pollution. Sensors 2018, 18, 2900. [Google Scholar] [CrossRef] [PubMed]
- Li, X.; Zhao, L.; Li, D.; Xu, H. Mapping urban extent using Luojia 1-01 nighttime light imagery. Sensors 2018, 18, 3665. [Google Scholar] [CrossRef] [PubMed]
- Ou, J.; Liu, X.; Liu, P.; Liu, X. Evaluation of Luojia 1-01 nighttime light imagery for impervious surface detection: A comparison with NPP-VIIRS nighttime light data. Int. J. Appl. Earth Obs. Geoinf. 2019, 81, 1–12. [Google Scholar] [CrossRef]
- Zhang, G.; Guo, X.; Li, D.; Jiang, B. Evaluating the potential of LJ1-01 nighttime light data for modeling socio-economic parameters. Sensors 2019, 19, 1465. [Google Scholar] [CrossRef]
- Li, C.; Zou, L.; Wu, Y.; Xu, H. Potentiality of using Luojia1-01 night-time light imagery to estimate urban community housing price—A case study in Wuhan, China. Sensors 2019, 19, 3167. [Google Scholar] [CrossRef]
- Zhong, X.; Su, Z.; Zhang, G.; Chen, Z.; Meng, Y.; Li, D.; Liu, Y. Analysis and reduction of solar stray light in the nighttime imaging camera of Luojia-1 satellite. Sensors 2019, 19, 1130. [Google Scholar] [CrossRef]
- Liu, M.; Cao, C.; Chen, W.; Wang, X. Mapping canopy heights of poplar plantations in plain areas using ZY3-02 stereo and multispectral data. ISPRS Int. J. Geoinf. 2019, 8, 106. [Google Scholar] [CrossRef]
- Hormese, J.; Saravanan, C. Automated road extraction from high resolution satellite images. Procedia Technol. 2016, 24, 1460–1467. [Google Scholar] [CrossRef]
- Fu, Z.; Sun, Y.; Fan, L.; Han, Y. Multiscale and Multifeature Segmentation of High-Spatial Resolution Remote Sensing Images Using Superpixels with Mutual Optimal Strategy. Remote Sens. 2018, 10, 1289. [Google Scholar] [CrossRef]
- Bakhtiari, H.R.R.; ABDollahi, A.; Rezaeian, H. Semi automatic road extraction from digital images. Egypt. J. Remote Sens. Space Sci. 2017, 20, 117–123. [Google Scholar] [CrossRef]
- Mena, J.B. State of the art on automatic road extraction for GIS update: A novel classification. Pattern Recognit. Lett. 2003, 24, 3037–3058. [Google Scholar] [CrossRef]
- Ma, X.; Longley, I.; Gao, J.; Kachhara, A.; Salmond, J. A site-optimised multi-scale GIS based land use regression model for simulating local scale patterns in air pollution. Sci. Total Environ. 2019, 685, 134–149. [Google Scholar] [CrossRef]
- Zhang, L.; Gove, J.H.; Heath, L.S. Spatial residual analysis of six modeling techniques. Ecol. Model. 2005, 186, 154–177. [Google Scholar] [CrossRef]
- Lou, M.; Zhang, H.; Lei, X.; Li, C.; Zang, H. Spatial autoregressive models for stand top and stand mean height relationship in mixed quercus mongolica broadleaved natural stands of northeast China. Forests 2016, 7, 43. [Google Scholar] [CrossRef]
- Sun, Y.; Gao, C.; Li, J.; Wang, R.; Liu, J. Quantifying the effects of urban form on land surface temperature in subtropical high-density urban areas using machine learning. Remote Sens. 2019, 11, 959. [Google Scholar] [CrossRef]


| Density Class | Density Range/% | Area Percent/% |
|---|---|---|
| low | 0–5 | 38.77 |
| 5–10 | 8.29 | |
| sub-low | 10–15 | 4.34 |
| 15–20 | 10.66 | |
| middle | 20–25 | 13.01 |
| 25–30 | 11.59 | |
| sub-high | 30–35 | 5.86 |
| 35–40 | 3.11 | |
| high | 40–45 | 2.58 |
| 45–50 | 1.79 |
| Test Sample | Average NTL | Actual UBD (%) | Estimated UBD (%) | Absolute Error (%) |
|---|---|---|---|---|
| 1 | 0.034940 | 30.24 | 36.63 | 5.29 |
| 2 | 0.001009 | 0.52 | 0.57 | 0.05 |
| 3 | 16.683639 | 16.97 | 19.2 | 2.23 |
| 4 | 0.008449 | 9.08 | 13.57 | 4.49 |
| 5 | 0.037299 | 27.24 | 38.17 | 10.93 |
| 6 | 0.003676 | 2.32 | 0.02 | 2.3 |
| 7 | 0.000039 | 0 | 0 | 0 |
| 8 | 0.005766 | 7.03 | 4.48 | 2.55 |
| 9 | 0.020406 | 17.24 | 23.1 | 5.86 |
| 10 | 0.002532 | 2.83 | 1.36 | 1.47 |
| 11 | 0.043675 | 30.52 | 39.25 | 8.73 |
| 12 | 0.011192 | 8.09 | 14.02 | 5.93 |
| 13 | 0.009837 | 9.43 | 13.58 | 4.15 |
| 14 | 0.008594 | 10.35 | 17.37 | 7.02 |
| 15 | 0.000065 | 0 | 0 | 0 |
| 16 | 0.004996 | 4.57 | 2.32 | 2.25 |
| 17 | 0.027424 | 20.13 | 31.87 | 11.74 |
| 18 | 0.003096 | 2.95 | 1.62 | 1.33 |
| 19 | 0.007793 | 7.52 | 13.93 | 6.41 |
| 20 | 0.022627 | 22.02 | 29.46 | 7.44 |
| average | — | 11.45 | 15.03 | 3.58 |
| Data Sources | Maximum (°C) | Minimum (°C) | Average (°C) | Standard Deviation (°C) |
|---|---|---|---|---|
| RTE inversion value | 36.93 | 12.06 | 27.44 | 4.72 |
| MOD11A1 data | 34.07 | 15.62 | 26.31 | — |
| Temperature Class | Grading Basis | Temperature Range/°C | Area Percent/% |
|---|---|---|---|
| low | T < 23.06 | 9.04% | |
| sub-low | 23.06 ≤ T < 26.97 | 33.87% | |
| middle | 26.97 ≤ T ≤ 30.88 | 21.11% | |
| sub-high | 30.88 < T ≤ 34.93 | 25.77% | |
| high | T > 34.93 | 10.21% |
| Sigma | Residual | |||
|---|---|---|---|---|
| OLS | −717.2 | 0.338 | 2.237 | 43.13 |
| GWR | −1464.9 | 0.542 | 1.753 | 27.96 |
© 2019 by the authors. Licensee MDPI, Basel, Switzerland. This article is an open access article distributed under the terms and conditions of the Creative Commons Attribution (CC BY) license (http://creativecommons.org/licenses/by/4.0/).
Share and Cite
Wang, X.; Zhou, T.; Tao, F.; Zang, F. Correlation Analysis between UBD and LST in Hefei, China, Using Luojia1-01 Night-Time Light Imagery. Appl. Sci. 2019, 9, 5224. https://doi.org/10.3390/app9235224
Wang X, Zhou T, Tao F, Zang F. Correlation Analysis between UBD and LST in Hefei, China, Using Luojia1-01 Night-Time Light Imagery. Applied Sciences. 2019; 9(23):5224. https://doi.org/10.3390/app9235224
Chicago/Turabian StyleWang, Xing, Tong Zhou, Fei Tao, and Fengyi Zang. 2019. "Correlation Analysis between UBD and LST in Hefei, China, Using Luojia1-01 Night-Time Light Imagery" Applied Sciences 9, no. 23: 5224. https://doi.org/10.3390/app9235224
APA StyleWang, X., Zhou, T., Tao, F., & Zang, F. (2019). Correlation Analysis between UBD and LST in Hefei, China, Using Luojia1-01 Night-Time Light Imagery. Applied Sciences, 9(23), 5224. https://doi.org/10.3390/app9235224