1. Introduction
Scanning methods are widely used in the measurement and reconstruction of straightness profiles. The motion trajectory of the measuring device always plays the role of the measurement reference, of which the error will have an impact on the final reconstruction result. Especially for the on-machine measurement, as the machine tool spindle is used as a scanning stage, the error of the measurement reference is at the same level as the accuracy of the measured profiles. Therefore, the errors of the reference must be eliminated to avoid affecting the reconstruction result.
Several multi-probe methods were developed to remove the influence of reference errors. The two-point method can eliminate the straightness error of the measurement reference [
1,
2,
3,
4,
5]. Besides, the yaw error of the measuring device during scanning also affects the reconstruction result. Therefore, the three-point method [
6,
7,
8], four-point method (or the method using more than four probes) [
9,
10], the traceable multiple sensor (TMS) method [
11], etc. were invented to overcome the influence of the straightness error and eliminate the yaw error at the same time. With more probes, abundant information makes exact reconstruction possible. In some cases, the reconstruction error caused by yaw error is too small compared with that caused by straightness error, and the probe zero-adjustment error will have a significant impact on the final result due to the cumulative effect when using three or more probes. Therefore, the two-point method has not been replaced and still widely used by now. Besides, other errors that impact the reconstruction result most include the zero-adjustment error, the data processing error, and the measurement error of displacement sensors. When using scanning methods to measure and reconstruct profiles, these errors are worth considering.
Using the height difference between adjacent measurement points, the two-point method, including the sequential two-point method (STP), the generalized two-point method (GTP), and the combined two-point method (CTP), can obtain the reconstruction profile by a recursive process. In the STP method, the step distance of the measurement device is the same as the spacing between two probes, which is equal to the interval between adjacent sampling points, and the reconstruction result is not affected by the data processing error. However, due to the size of probes, the number of sampling points could be small, which means the lateral resolution could not be high enough and there is a higher probability that some key features of the measured profile will be missed. In the GTP method, the density of the sampling points is higher, as the interval between sampling points can be smaller than the probe spacing. Nevertheless, the reconstruction result suffers from data processing error on account of the higher-order harmonic component distortion. The effect of the data processing error is especially evident when there are stepwise variations in measured profiles. The CTP method [
3] combines the above two methods and achieves theoretically exact reconstruction of measured profiles. In many cases, its accuracy is hard to meet due to the assumption of a completely smooth part of the measured profile to obtain the relative relations of different groups of reconstruction points, which makes it difficult to implement in practice. Different systems and methods have been developed to improve the lateral resolution in the absence of the data processing error [
12,
13,
14,
15,
16,
17]. The common methods are using additional probes or additional scanning to obtain more measurement information. While some methods among them are affected by the zero-adjustment error of the probes placed abreast in the system.
The above methods can be used to reconstruct a single straightness profile under different conditions. In practical applications, the parameters of a pair of parallel profiles also need to be monitored. As in many types of ultra-precision equipment, linear motions are orientated by guide rails or parallel planes, whose accuracies can have a great influence on the smooth operations. On the basis of those mentioned methods, several measuring systems and methods were designed to measure and reconstruct a pair of parallel profiles including the cylinder workpiece and guide rails [
18,
19,
20]. We also designed a four-probe method to reconstruct a pair of profiles, which can eliminate the reference errors and the zero-adjustment error through two scannings [
21]. All four of these methods have the same disadvantages as the methods for a single profile that, as mentioned above, the difficulty in satisfying the exact reconstruction without data processing error and retaining a high lateral resolution at the same time. In response to this type of problem, we propose a new four-probe system and its corresponding method to achieve an exact reconstruction of a pair of parallel profiles with high-density sampling points. Using the new method, in which probes are arranged at different spacings, the measured profiles can be exactly reconstructed, and the reconstruction profiles can reflect the characteristics of the measured objects better, especially for the profiles with stepwise variations.
2. The Four-Probe System
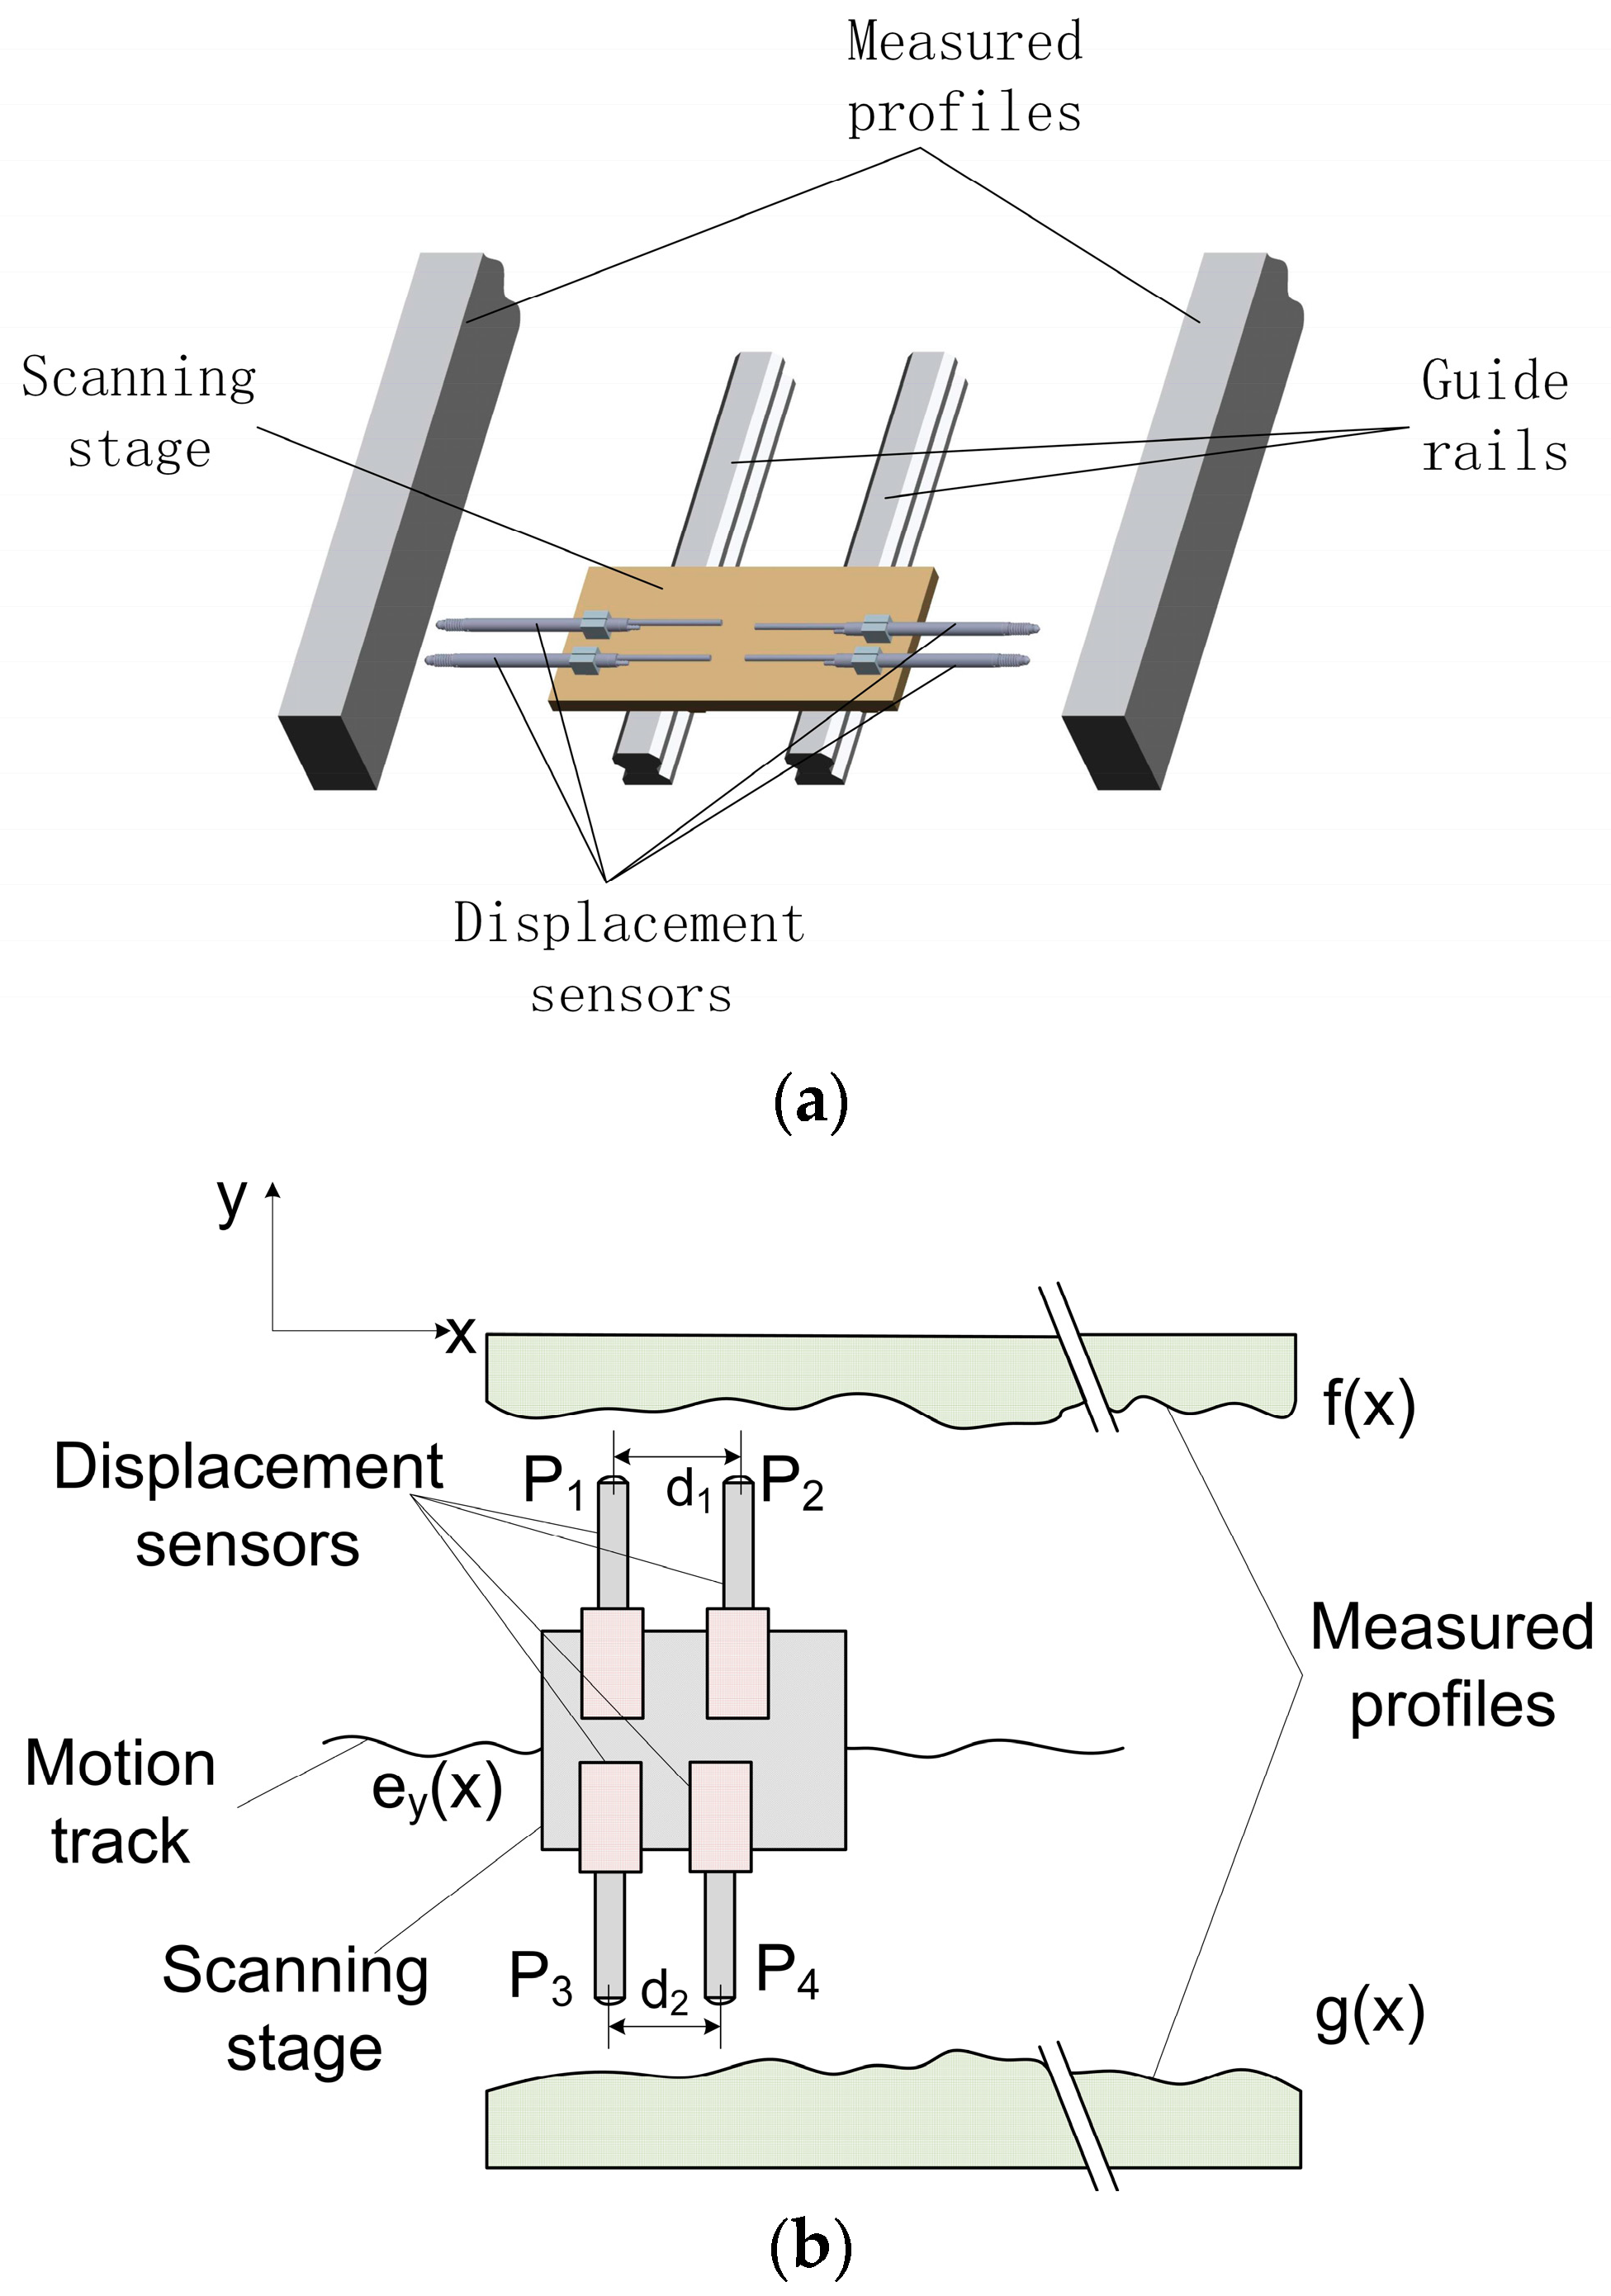
The device of the new method, whose purpose is to eliminate the data processing error and retain a high lateral resolution, is shown in
Figure 1. The measuring device is located between two measured profiles and moves along x-direction by a scanning stage. Four displacement sensors used as probes are distributed in pairs with different spacings on two sides of the measuring device and installed on the scanning stage. The probes here could be displacement sensors that utilize different principles, including contact type and non-contact type, to satisfy the service environment and measurement requirements. For convenience, the figures in this text are drawn with contact sensors.
is opposite to
. The spacing between
and
is
and the spacing between
and
is
. After stepping for
, probes collect measurement data of two profiles. What must be noted is that
, and
and
need to be integral multiples of the step distance
. When probes collect
times of data during one scanning, the outputs of the probe
can be expressed as
, where
,
. Assume that the profile heights of two measured profiles are
and
; when the y-direction straightness error, the error which affects the measurement result most, is defined as
and the yaw error of the device, the zero-adjustment error, and the sensor measurement error are ignored, the outputs of probes during the scanning can be written as:
The differential values without straightness error are defined as
and
and are calculated by the following equations:
The reconstruction profiles are denoted
and
, and using an integration process, the values of the reconstruction points are obtained by integrating the differential values in Equations (5) and (6):
When reconstructing the measured profiles using Equations (5)–(8), it can be summarized that the data processing process of the new method is equivalent to an STP process in which the probe spacing and the step distance are both equal to . Therefore, the new method is free from the data processing error and guarantees a high density of sampling points, as can be chosen independently without being limited by probe spacing. The ability of the STP method to eliminate the straightness error of the reference is retained. When the yaw error needs to be measured to reduce the reconstruction error, an additional autocollimator can be used with a target mirror mounted on the scanning stage. Therefore, ignoring the measurement errors of sensors, the new method can be used to realize exact reconstruction.
4. Experiment
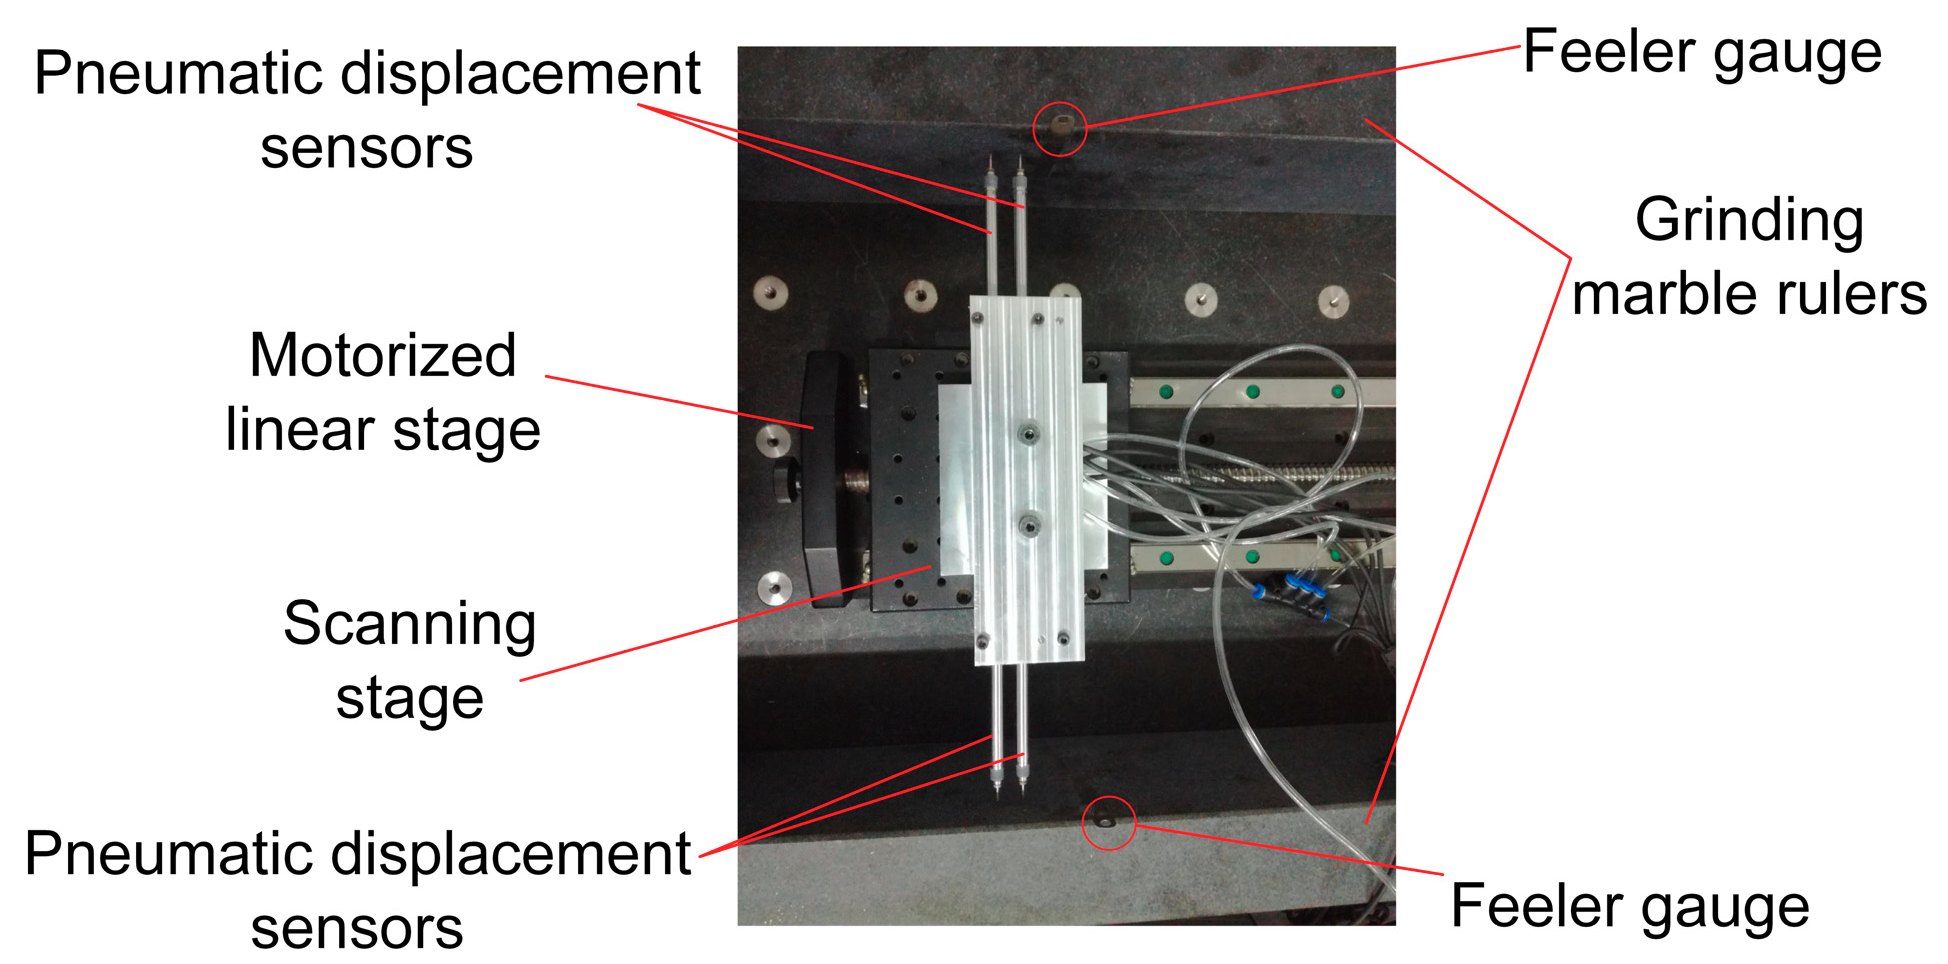
To verify the feasibility and the advantages of the new method, especially in terms of overcoming the data processing error and preventing high-order harmonic component distortion under the high lateral resolution conditions, an experimental device was constructed. As shown in
Figure 7, the measuring device, which was constructed according to
Figure 1, consisted of four pneumatic displacement sensors (Solartron DP/10/P) with the measurement range of
and was driven by a motorized linear stage. The spacing between
and
was
and
for
and
. The measured objects were a pair of grinding marble rulers. Two feeler gauges, with thicknesses of
and
, were stuck to marble rulers to simulate stepwise variations. The step distance of scanning was
, and, when the measuring device stepped 39 times, probes collected measurement data for 40 times and the reconstruction length was
.
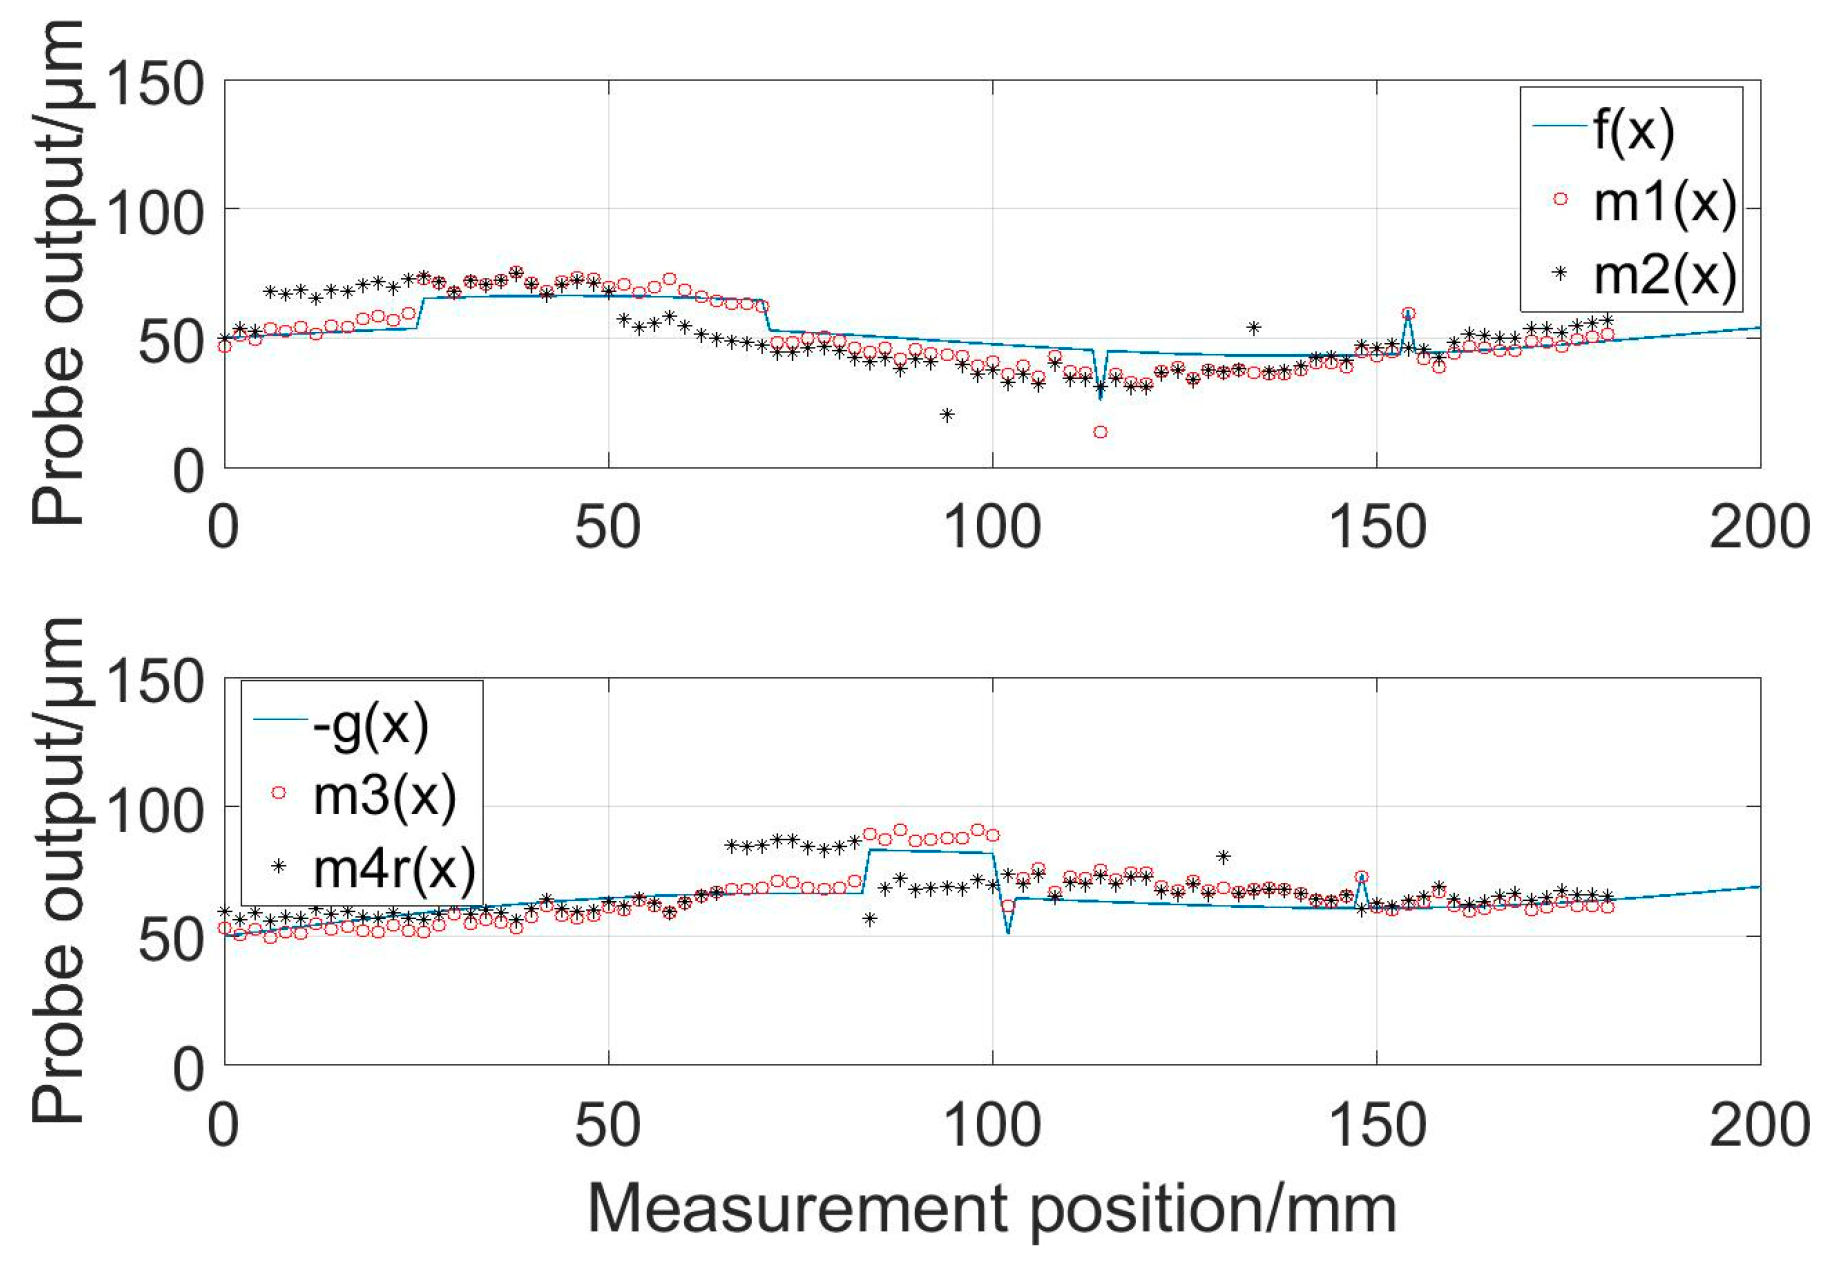
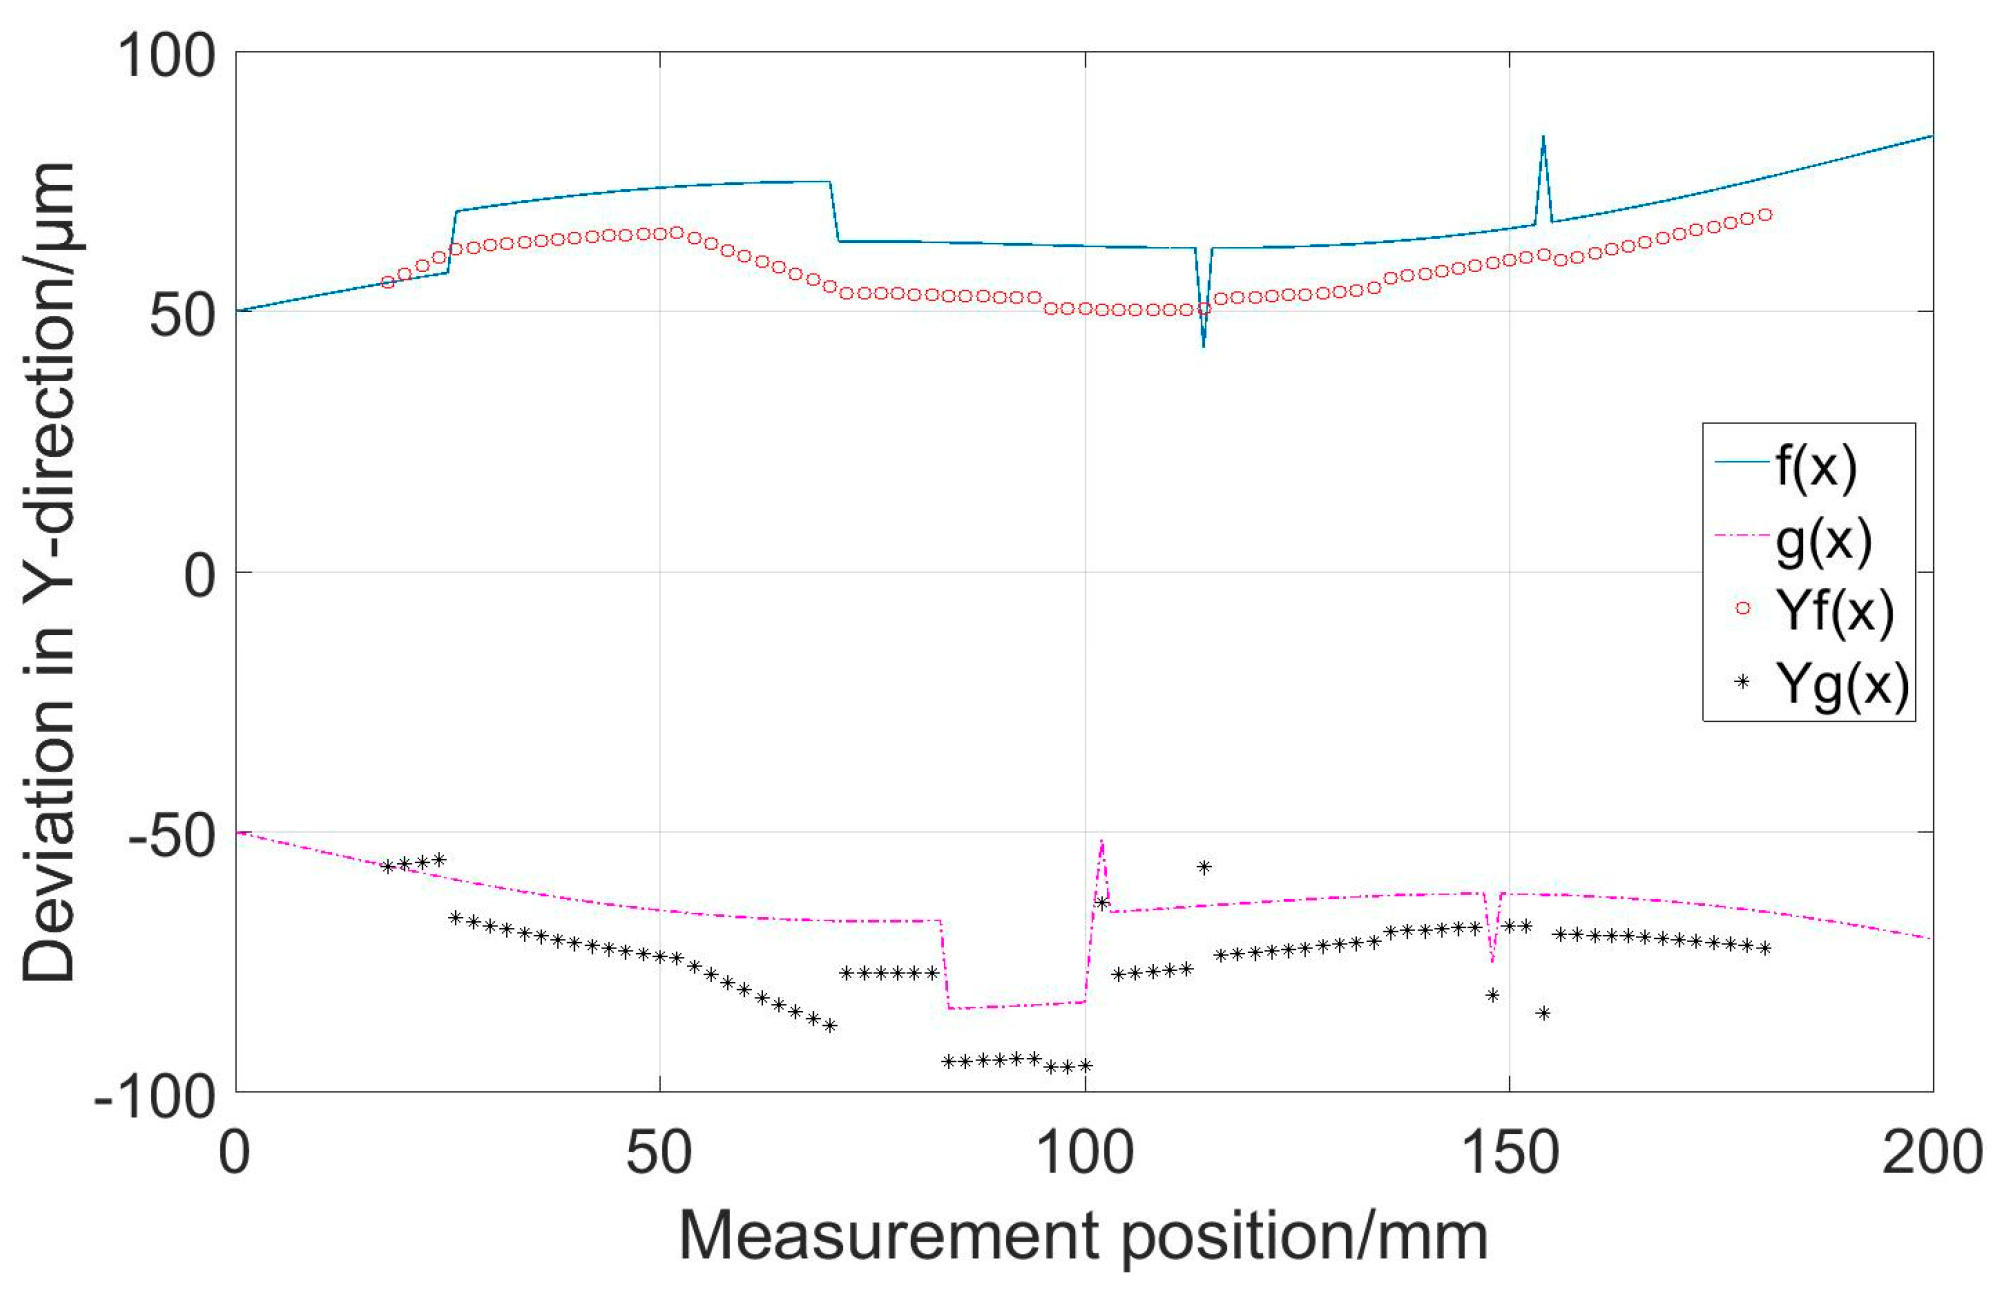
The measured profiles were reconstructed using the measurement data obtained by the same scanning and different data processing methods. As the main purpose of the experiment was to compare the ability to overcome the data processing error of the new method and the existing method, the comparison of the reconstruction results on stepwise variation parts can reflect the advantage of the new method in this respect. Using the measurement data of
,
, and
, the reconstruction profiles calculated from Equations (12)–(14) are shown as
and
in
Figure 8, while
and
in
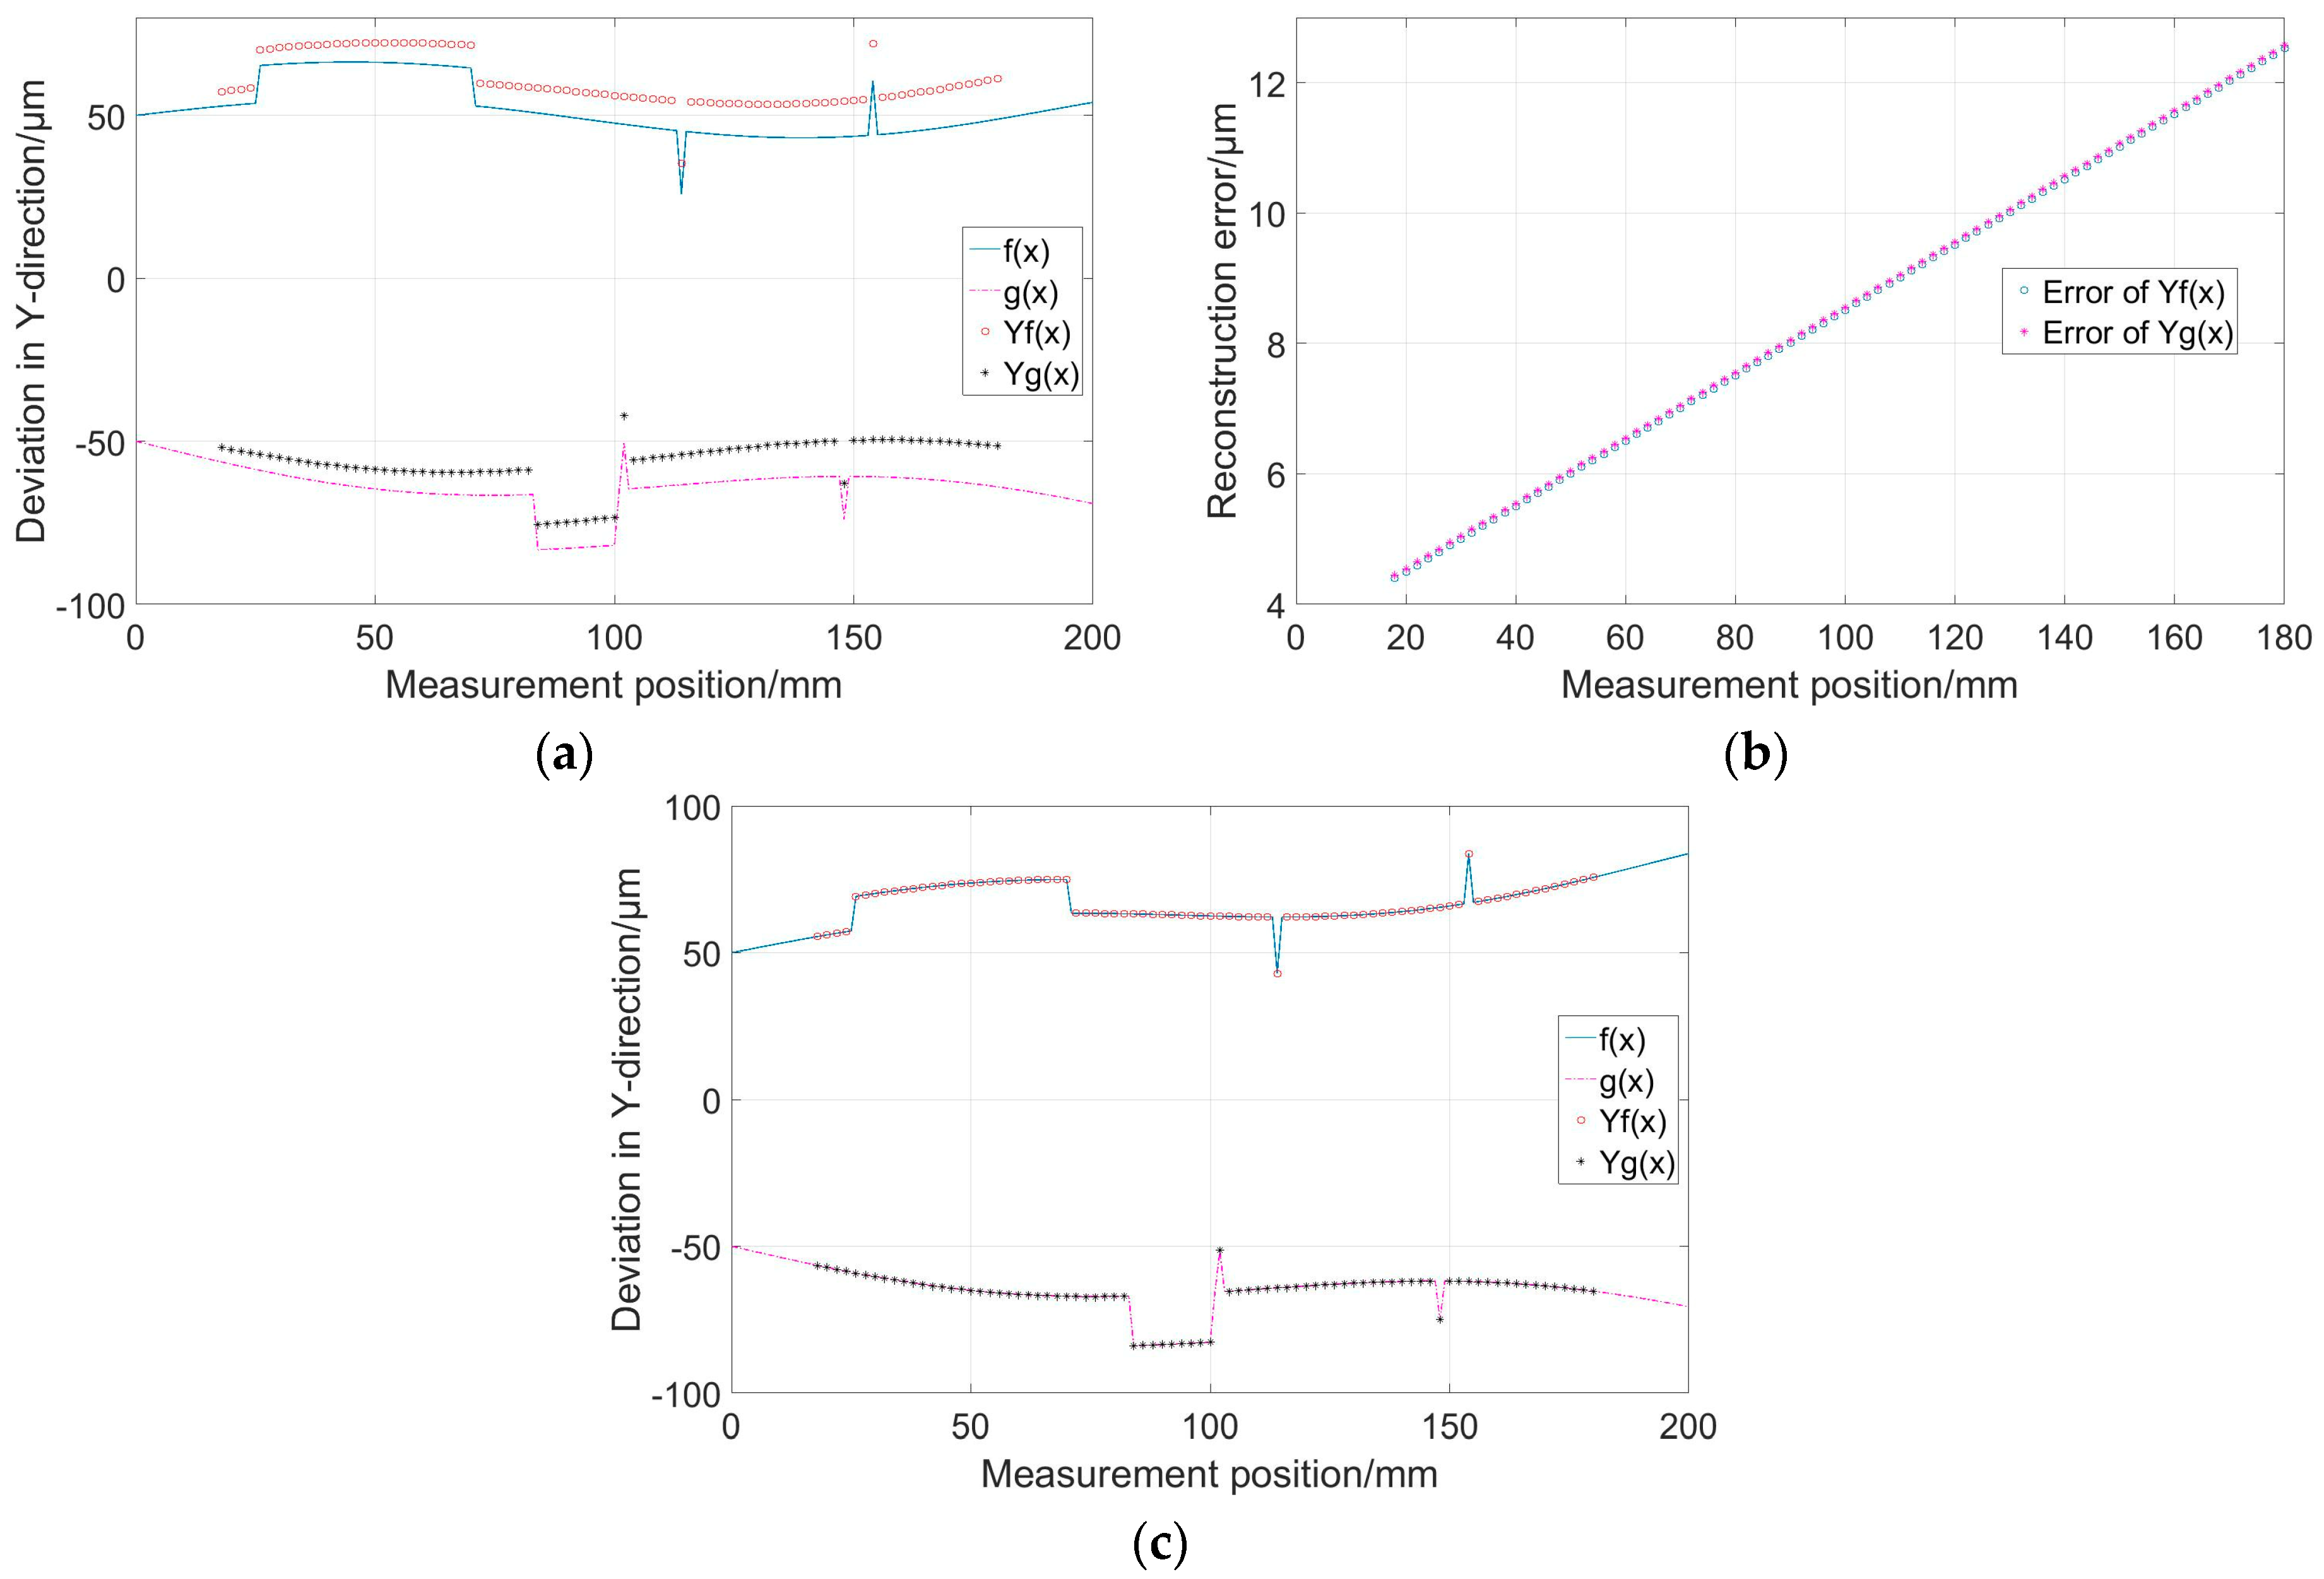
Figure 9 are reconstruction profiles obtained from the new method using measurement data of
–
. It is obvious that the stepwise variations are smoothed in
and
because of the data processing error and the new method can reflect the characteristics of measured profiles better. That is to say, the new method has a better performance when the exact reconstruction is required, especially when there are stepwise variations in measured profiles.
5. Error Analyses of the New Method
When using multi-probe methods to measure and reconstruct profiles, existing motorized stages often have better positioning accuracies, and the positioning error in the scanning direction is often negligible. The main errors that affect results include the straightness error and yaw error of the measurement reference, the data processing error, the zero-adjustment error, and the measurement error of sensors. As shown in Equations (5) and (6), the differential of measurement data can eliminate the straightness error of the reference. Under most circumstances, the yaw error is relatively small and its impact on the measurement and reconstruction results is often on a smaller order of magnitude and can be negligible. In some cases, if the yaw error is large enough to impact the measurement result and needs to be removed, an autocollimator can be used to collect measurement data of yaw error during the scanning. According to
Section 2, the four-probe method is not affected by the data processing error. Therefore, for the new method introduced in this article, we analyze the effects of the zero-adjustment error and the measurement error in the following.
5.1. The Effect of the Zero-Adjustment Error
For multi-probe methods using three or more probes, the zero-adjustment error always has a significant impact on the measurement and reconstruction results [
18]. Due to the cumulative effect, using a high precision reference surface to calibrate the zero points of probes is not good enough for eliminating this type of error. Therefore, the influence of the zero-adjustment error in the new method proposed in this paper is analyzed.
Assume that the zero-adjustment errors of probes are
; the outputs of probes in Equations (1)–(4) become:
Correspondingly, the data processing process in Equations (5) and (6) becomes:
The differential values in Equations (19) and (20) are also integrated by Equations (7) and (8). It can be seen that there is one more component due to the zero-adjustment error in and in Equations (19) and (20), which cause a rotation of the reconstruction profiles compared with the actual profiles and the tangent value of the rotation angle is .
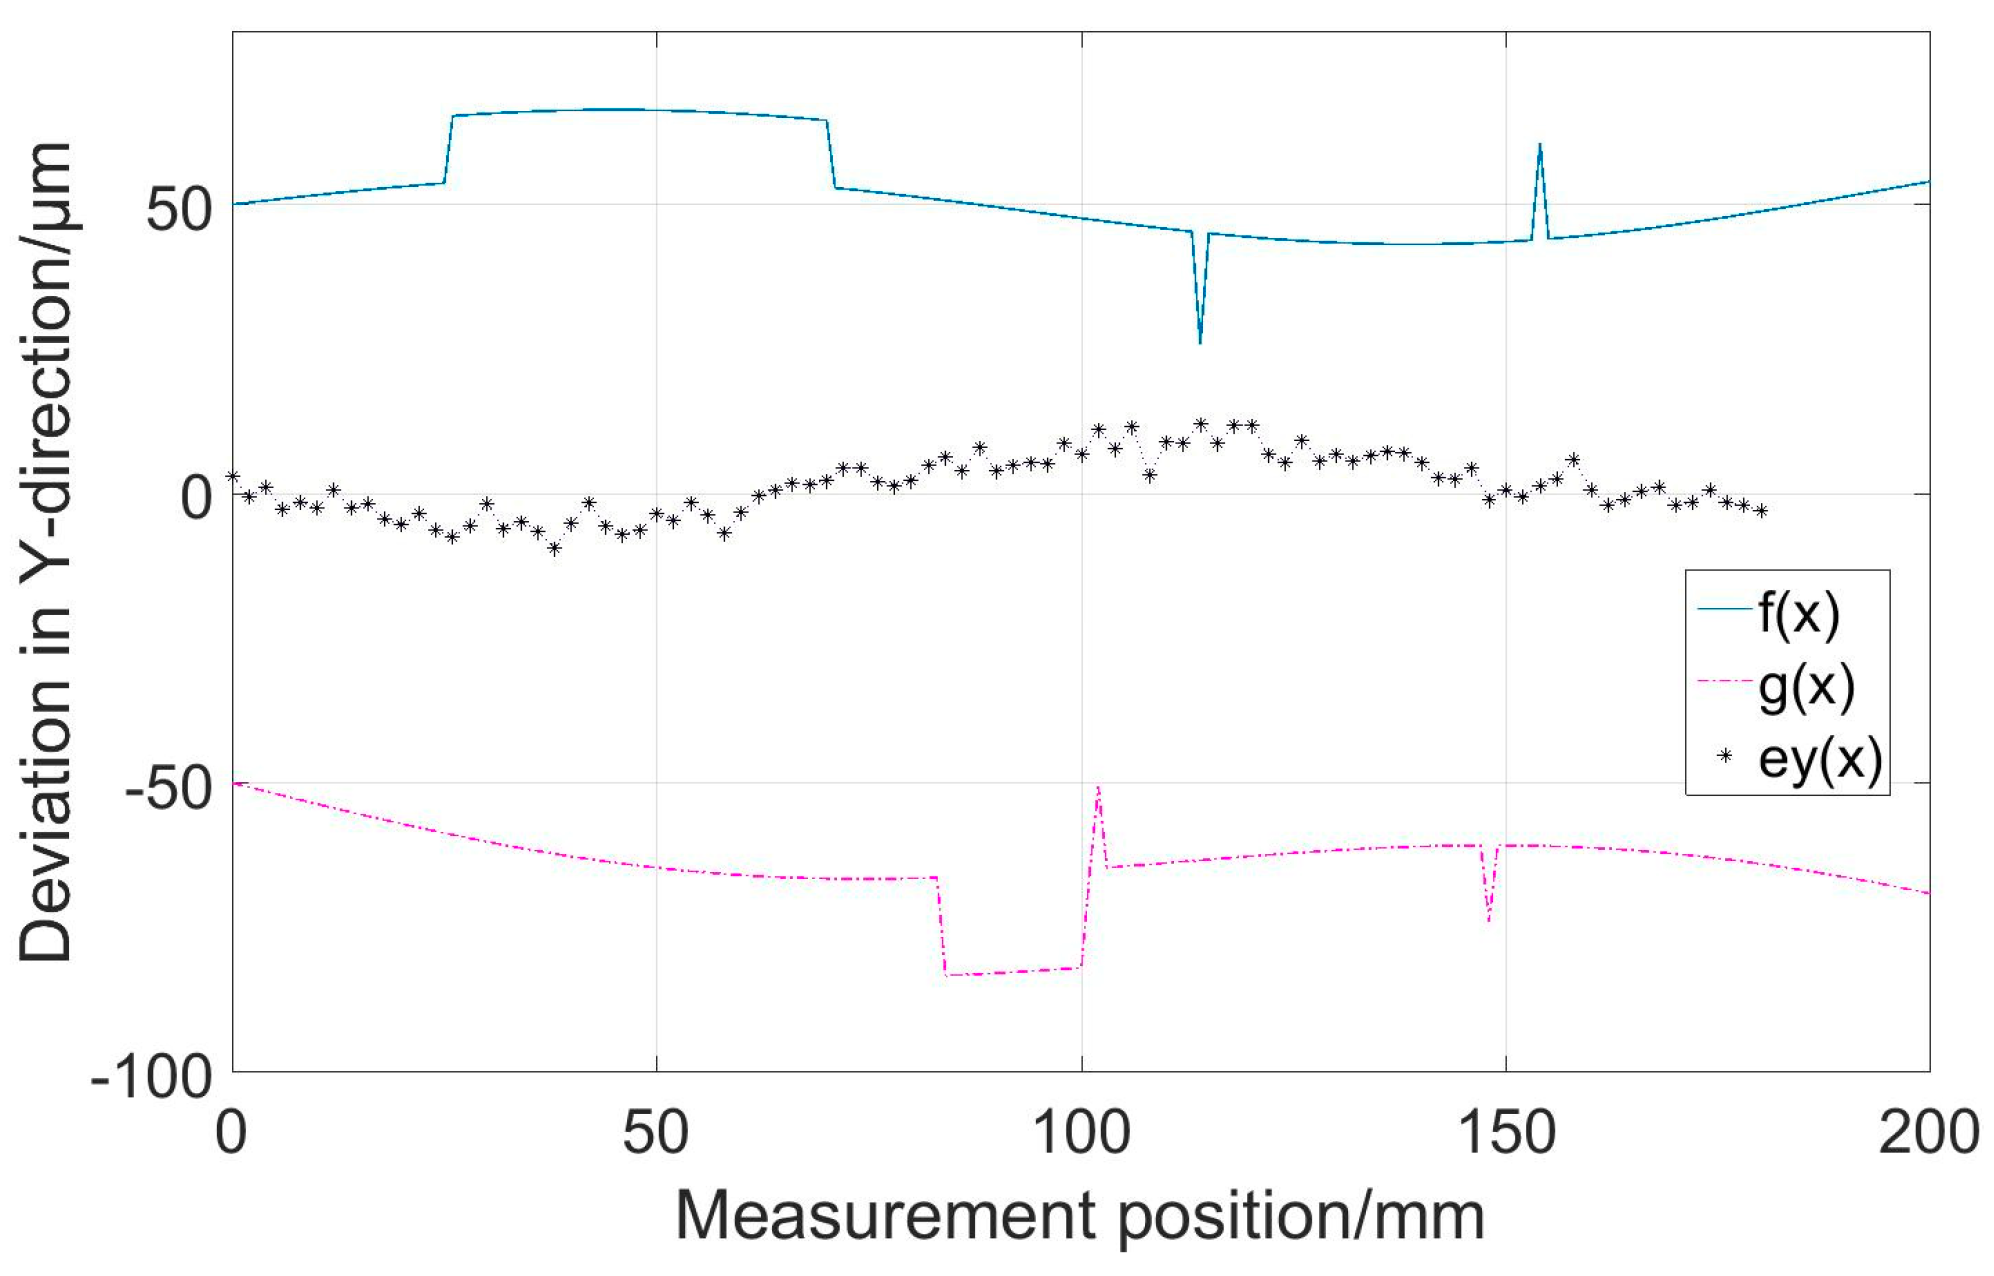
When we evaluate the geometric parameters of a pair of parallel profiles, it is more essential and difficult to evaluate the straightness and the parallelism. When the straightness is evaluated using the reconstruction profiles, the rotation of the reconstruction profiles compared with their original profiles will not affect the evaluation result. When evaluating the parallelism of a pair of parallel profiles, if the rotation angles of the two reconstruction profiles are equal, the rotation has no effects on the evaluation result. It is known that the reconstruction result of this new method belongs to the situation that two profiles rotate by the same angle, and the reconstruction errors shown in
Figure 6b are also consistent with the above analyses. Therefore, it can be concluded that the zero-adjustment error will not affect the evaluation results of the straightness and parallelism. As a result, in most cases, it is not necessary to calibrate the zero points of probes to obtain prior knowledge before measurements, which makes the new method proposed in this paper simply to operate.
5.2. The Effect of the Measurement Error of Sensors
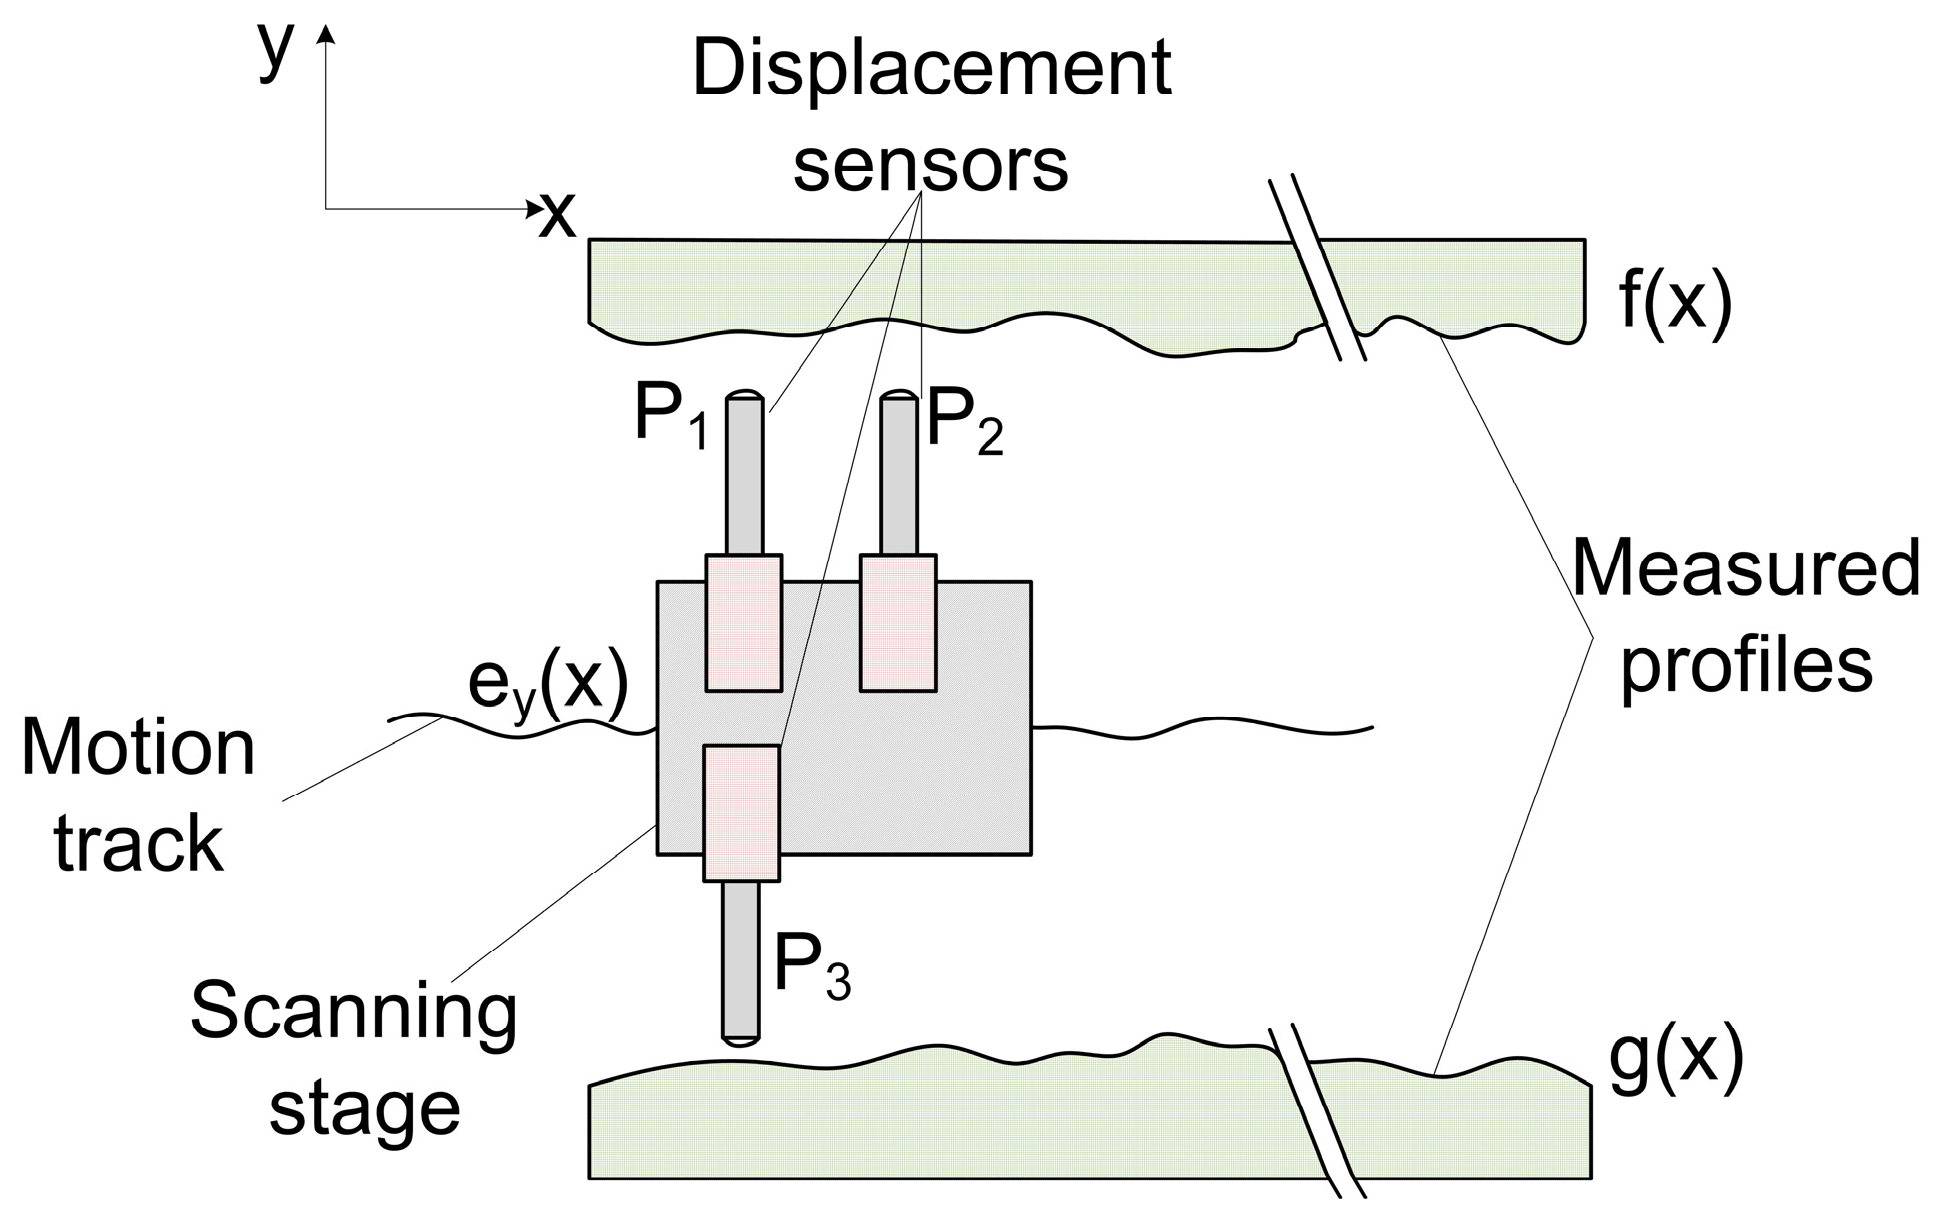
Compared with the existing method described in
Section 3.1 and
Figure 2, the result of each reconstruction point in the new method needs to use more measurement data when calculating the differential values, which means that the measurement result and the reconstruction result are more affected by the measurement error. However, considering the advantage of the new method in eliminating the data processing error, it is needed to analyze the extent to which the results are affected by the measurement error. According to the calculating process of
in Equations (5) and (6), the combined standard uncertainty of
can be expressed as:
where
is the standard uncertainty of the probe output due to the measurement error. To get the reconstruction results, the integral process in Equations (7) and (8) can be written as:
Therefore, the combined standard uncertainty of
reconstruction point, which is defined as
, can be calculated by:
Similarly, the combined standard uncertainty of
reconstruction point, which is obtained from the method described in
Figure 2 and Equations (12)–(14), can be expressed as:
It can be seen that, when the number of the measured points increases, the influence of the sensor measurement error on the reconstruction result will increase. When
takes the same values, compared with the reconstruction profiles shown in
Figure 8, whose reconstruction errors caused by data processing error are on the same magnitude as stepwise variations, the new method has better performance, as
and
are on the same magnitude.
6. Conclusions
A novel system that consists of four probes with different spacings is proposed to realize the measurement and exact reconstruction of a pair of parallel profiles. Besides the straightness error of the measurement reference, this system and method can also eliminate the data processing error and retain a high lateral resolution. Using the new method, the characteristics of the measured profiles will be retained to the maximum extent due to the controllable interval of sampling points, and the reconstruction result of measured profiles, especially the stepwise parts, will not have data processing error as the high-order harmonic component distortion will not exist. With a high spatial frequency of the measured profiles, as the data processing error can reach the same magnitude as the height difference of the profile, the advantage of the new method in improving the reconstruction accuracy is obvious. For the reconstruction of complex profiles, prior knowledge is not needed, which means the zero calibration of probes can be skipped in this new method and the measurement process is simple to operate. The exact reconstruction can be realized when the yaw error of the measurement reference and the measurement error of sensors can be obtained through other instruments or ignored. The abilities to overcome the data processing error and zero-adjustment error have been confirmed by the theoretical analyses and simulations. An experiment was also implemented to demonstrate the advantages of the new method.
