Article

Effect of Rotating Cylinder on Mixing Performance in a Cylindrical Double-Ribbon Mixer

1
School of Mechanical Engineering, Yeungnam University, Gyeongsan 38541, Korea
2
Department of Game Engineering, Tongmyong University, Busan 48520, Korea
*
Author to whom correspondence should be addressed.
These authors contributed equally to this work.
Appl. Sci. 2019, 9(23), 5179; https://doi.org/10.3390/app9235179
Submission received: 7 November 2019 / Revised: 25 November 2019 / Accepted: 25 November 2019 / Published: 29 November 2019
(This article belongs to the Special Issue Selected Papers from the ICMR 2019)

Abstract

:
Uniform mixing is highly essential in the food manufacturing, pharmaceutical, chemical, and cement industries. However, based on the various process requirements, these industries use different mixers to achieve their commercial outputs. Most of these industries rely on sample-based verification of the mixing index, which may not produce accurate results. Adopting a non-sampling mixing index method is more accurate. In this study, we used the discrete element method (DEM) to simulate the mixing of multiple components contained in a typical commercial whey protein mixture. An effective non-sampling mixing index, the subdomain-based mixing index (SMI), was incorporated to assess the mixing levels. The main motivation for this study was to acquire a high mixing index in the least possible mixing time to boost the manufacturing rate. For this purpose, a half-filled cylindrical double ribbon mixer was simulated, and the SMI outputs are presented for the following four cases: (1) rotating ribbon, (2) rotating cylinder, (3) rotating cylinder with a static ribbon, and (4) rotating cylinder and ribbon. For the given simulation conditions, the SMI values ranged from 0 (segregation condition) to 0.91–0.94 (fully randomly mixed condition) within a time range of 0–60 s.

1. Introduction

Uniform mixing is essential in various industries, including the chemical [1], pharmaceutical [2], cement [3], and food processing [4] industries. Homogeneity is the main requirement for the final products. To meet this requirement, the mixing performance in the mixing equipment must be investigated and improved. The mixing quality can be generally distinguished into three types—segregated, randomly mixed, and perfectly mixed conditions [5]. Use of a specific mixer is dependent on the type of materials being mixed. In the process industry, a wide range of mixers, including ribbon, tumbler, screw, plowshare, and convective mixers, are used in particle mixing [6,7,8,9,10,11,12]. Among them, cylindrical ribbon mixers are extensively used in various mixing industries and hence have attracted research attention to enhance their mixing performances. Recent studies also show the importance of using cylindrical helical ribbons for mixing viscous fluids [11]. Cylindrical ribbon mixers are further classified by their structures into horizontal [13] and vertical [14], and both types have been studied to determine the mixing times [15], mixing performances [16,17], power requirements [18], and power consumption [15] during operation.
Generally, whey protein is extracted from cow’s milk, and the benefits of using it as a supplement were well-explained by M.C. Devries et al. [19] and S. Pal et al. [19,20]. Whey protein contains all nine essential amino acids, known as branched-chain amino acids (BCAA) [21], which are capable of improving the immune system of asthma patients. Athletes across the globe consume whey protein as a supplement to improve their athletic stamina. Motivated by these widespread advantages, we examined whey protein concentrates and numerically analyzed the mixing performance of a vertical cylindrical ribbon mixer during the mixing of commercially produced whey protein concentrates.
Several parameters, such as the rotational speeds of the ribbon, cylinder (with and without a ribbon), and a combination (simultaneous cylinder and ribbon rotation), impact the mixing performance in a vertical cylindrical ribbon VCR mixer. These effects are difficult to analyze experimentally. Discrete element method (DEM) simulations [10,22,23,24,25] have been widely used to examine the effects of the operational parameters prior to actual experimentation. These simulations can be used to analyze the operating conditions in industrial mixing. Furthermore, simulations can be used to increase the manufacturing rate if the conditions are modeled appropriately. Hence, a novel approach has been proposed to optimize the mixing performance of VCR mixers by adopting an appropriate non-sampling mixing index and simulating the rotational movement of the cylinder to attain a uniform mixture in the smallest possible amount of time.

2. Overview of Mixing Indices and Subdomain Mixing Index (SMI)

Mixing quality plays an important role in all the major mixing industries, especially those related to pharmaceutical, chemical, and food manufacturing. This motivated several researchers worldwide to develop a wide range of mixing indices to evaluate the quality of mixing. Of these, the Lacey mixing index (LMI) [26,27], generalized mean mixing index (GMMI) [28], and modified generalized mean mixing index (MGMMI) [29] are the most commonly used mixing indices. LMI is a sample-based mixing index that yields statistical analysis considering the standard deviation, variation, and the coefficient of variation. Sample-based mixing indices may not produce accurate results, as they purely depend on the sampling size and conditions. GMMI and MGMMI are not sample-based, and hence, these methods consider all the particles in a computational domain. The major issue of over-predicting the mixing degree (index higher value greater than 1) by GMMI was addressed by MGMMI, which can only have values between 0 and 1. However, a disadvantage of the MGMMI is that it overestimates the mixing value, even in segregated conditions.
To circumvent the above-mentioned issues, a new non-sampling mixing index, called a subdomain-based mixing index (SMI), was introduced by Migyung Cho et al. [5]. The advantages of the SMI over the other mentioned indices were illustrated in their study. According to their study, SMI can be explained as follows.
When a computational domain Z is divided into n w , n h ,and n d elements for the width, height, and depth, respectively, then the total number of subdomains ( Q ) is given as
Q = n w × n h × n d .
Assuming that the domain contains M types of particles, the number of particles of type k ( 1 k M ) in the ith subdomain ( S i ) is denoted as n k i . Hence the total number of particles of all types in S i corresponds to k = 1 M n k i . Thus, the total number of particles (N) for the entire domain Z is given as follows:
N = i = 1 Q k = 1 M n k i .
If all the particle types have the same particle counts, then the fraction of k-type particles with respect to the maximum number of particles among the various types in subdomain Si is given as
P k i = n k i max ( n 1 i , n 2 i , n 3 i , n M i ) 1 , 1 k M .
If two or more types of particles possess the same maximum number of particles in a subdomain, only one of these types of particles is selected to determine the denominator in Equation (3). Finally, the SMI for S i can simply be obtained from the arithmetic mean of the individual fractions of each particle type k, with the exception of the fraction of the majority type, as follows:
S M I ( S i ) = 1 M 1 ( k = 1 M P k i 1 ) .
If all the particle types have the same particle counts in the subdomain, then the value of S M I ( S i ) is 1. The S M I ( S i ) is 0 when only one type of particle exists in the subdomain. Cases where there are no particles in the subdomain are not considered, and S M I ( S i ) is not defined. Hence, the value of SMI is always bound between 0 (segregation condition) and 1 (perfectly mixed condition). SMI values close to 1 generally represent randomly mixed conditions.
If each type of particle has a different particle count, then the fractional participation of k-type particles (where 1 k M ; assuming that the domain contains M types of particles) is given as follows:
f k = max ( i = 1 Q n 1 i , i = 1 Q n 2 i , i = 1 Q n 3 i , i = 1 Q n M i ) i = 1 Q n k i .
Equation (3) can be modified by incorporating Equation (5) as follows:
P k i = n k i f k max ( ( n 1 i f 1 ) , ( n 2 i f 2 ) , ( n 3 i f 3 ) , ( n M i f M ) ) 1 , 1 k M .
Henceforth, the SMI value with respect to the domain Z (containing Q subdomains) for the current event is given by combining Equations (4) and (6) as follows:
S M I = 1 N i = 1 Q [ S M I ( S i ) k = 1 M ( n k i ) ] .
The SMI value in Equation (7) is 1 (perfectly mixed condition) if each particle type has equal particle counts in all the subdomains. The value is 0 (segregated condition) at the initial stage i.e., at t = 0 s. The value approaching 1 indicates a randomly mixed condition.
Use of this SMI definition for the whey protein mixing simulations is discussed further in the following sections. In this work, we have considered n w = n h = n d = 5 , dividing the domain into 125 subdomains. The model geometry and the DEM adopted for the model are discussed in Section 3. The numerical simulation results for each case and the graphical representation of the SMI are presented in Section 4, followed a summary of the conclusions in Section 5.

3. Simulation Method
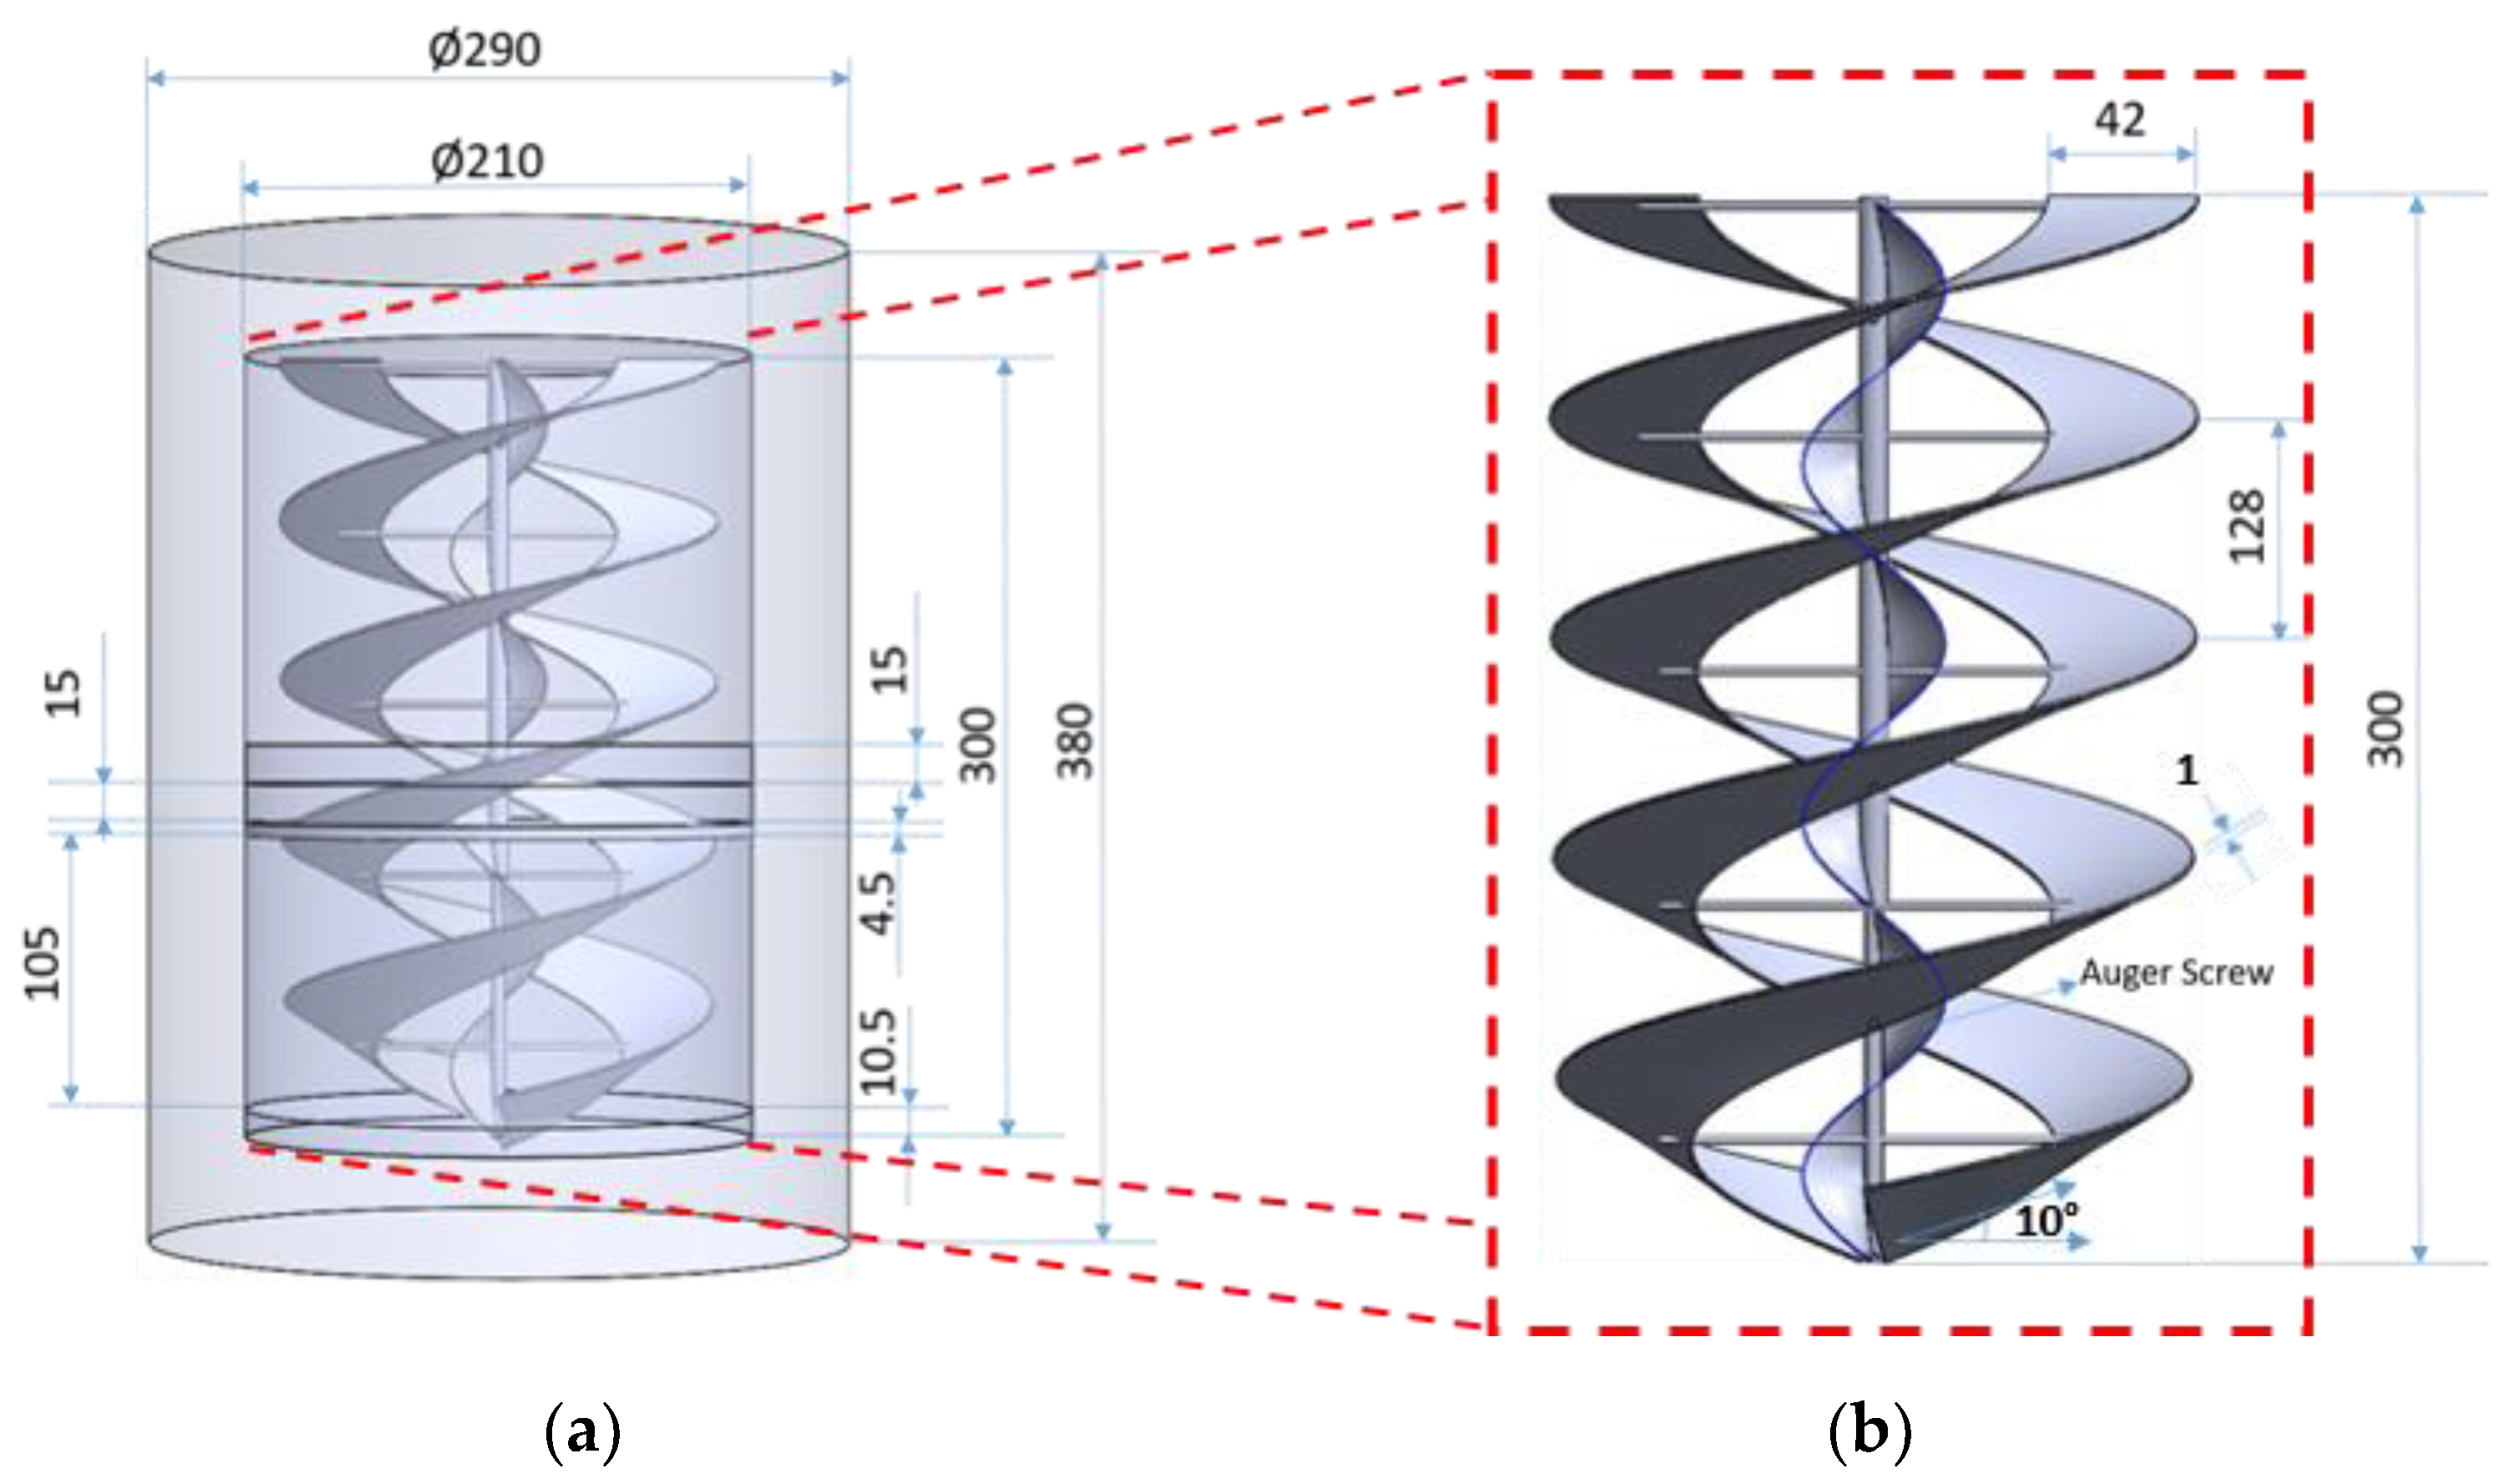
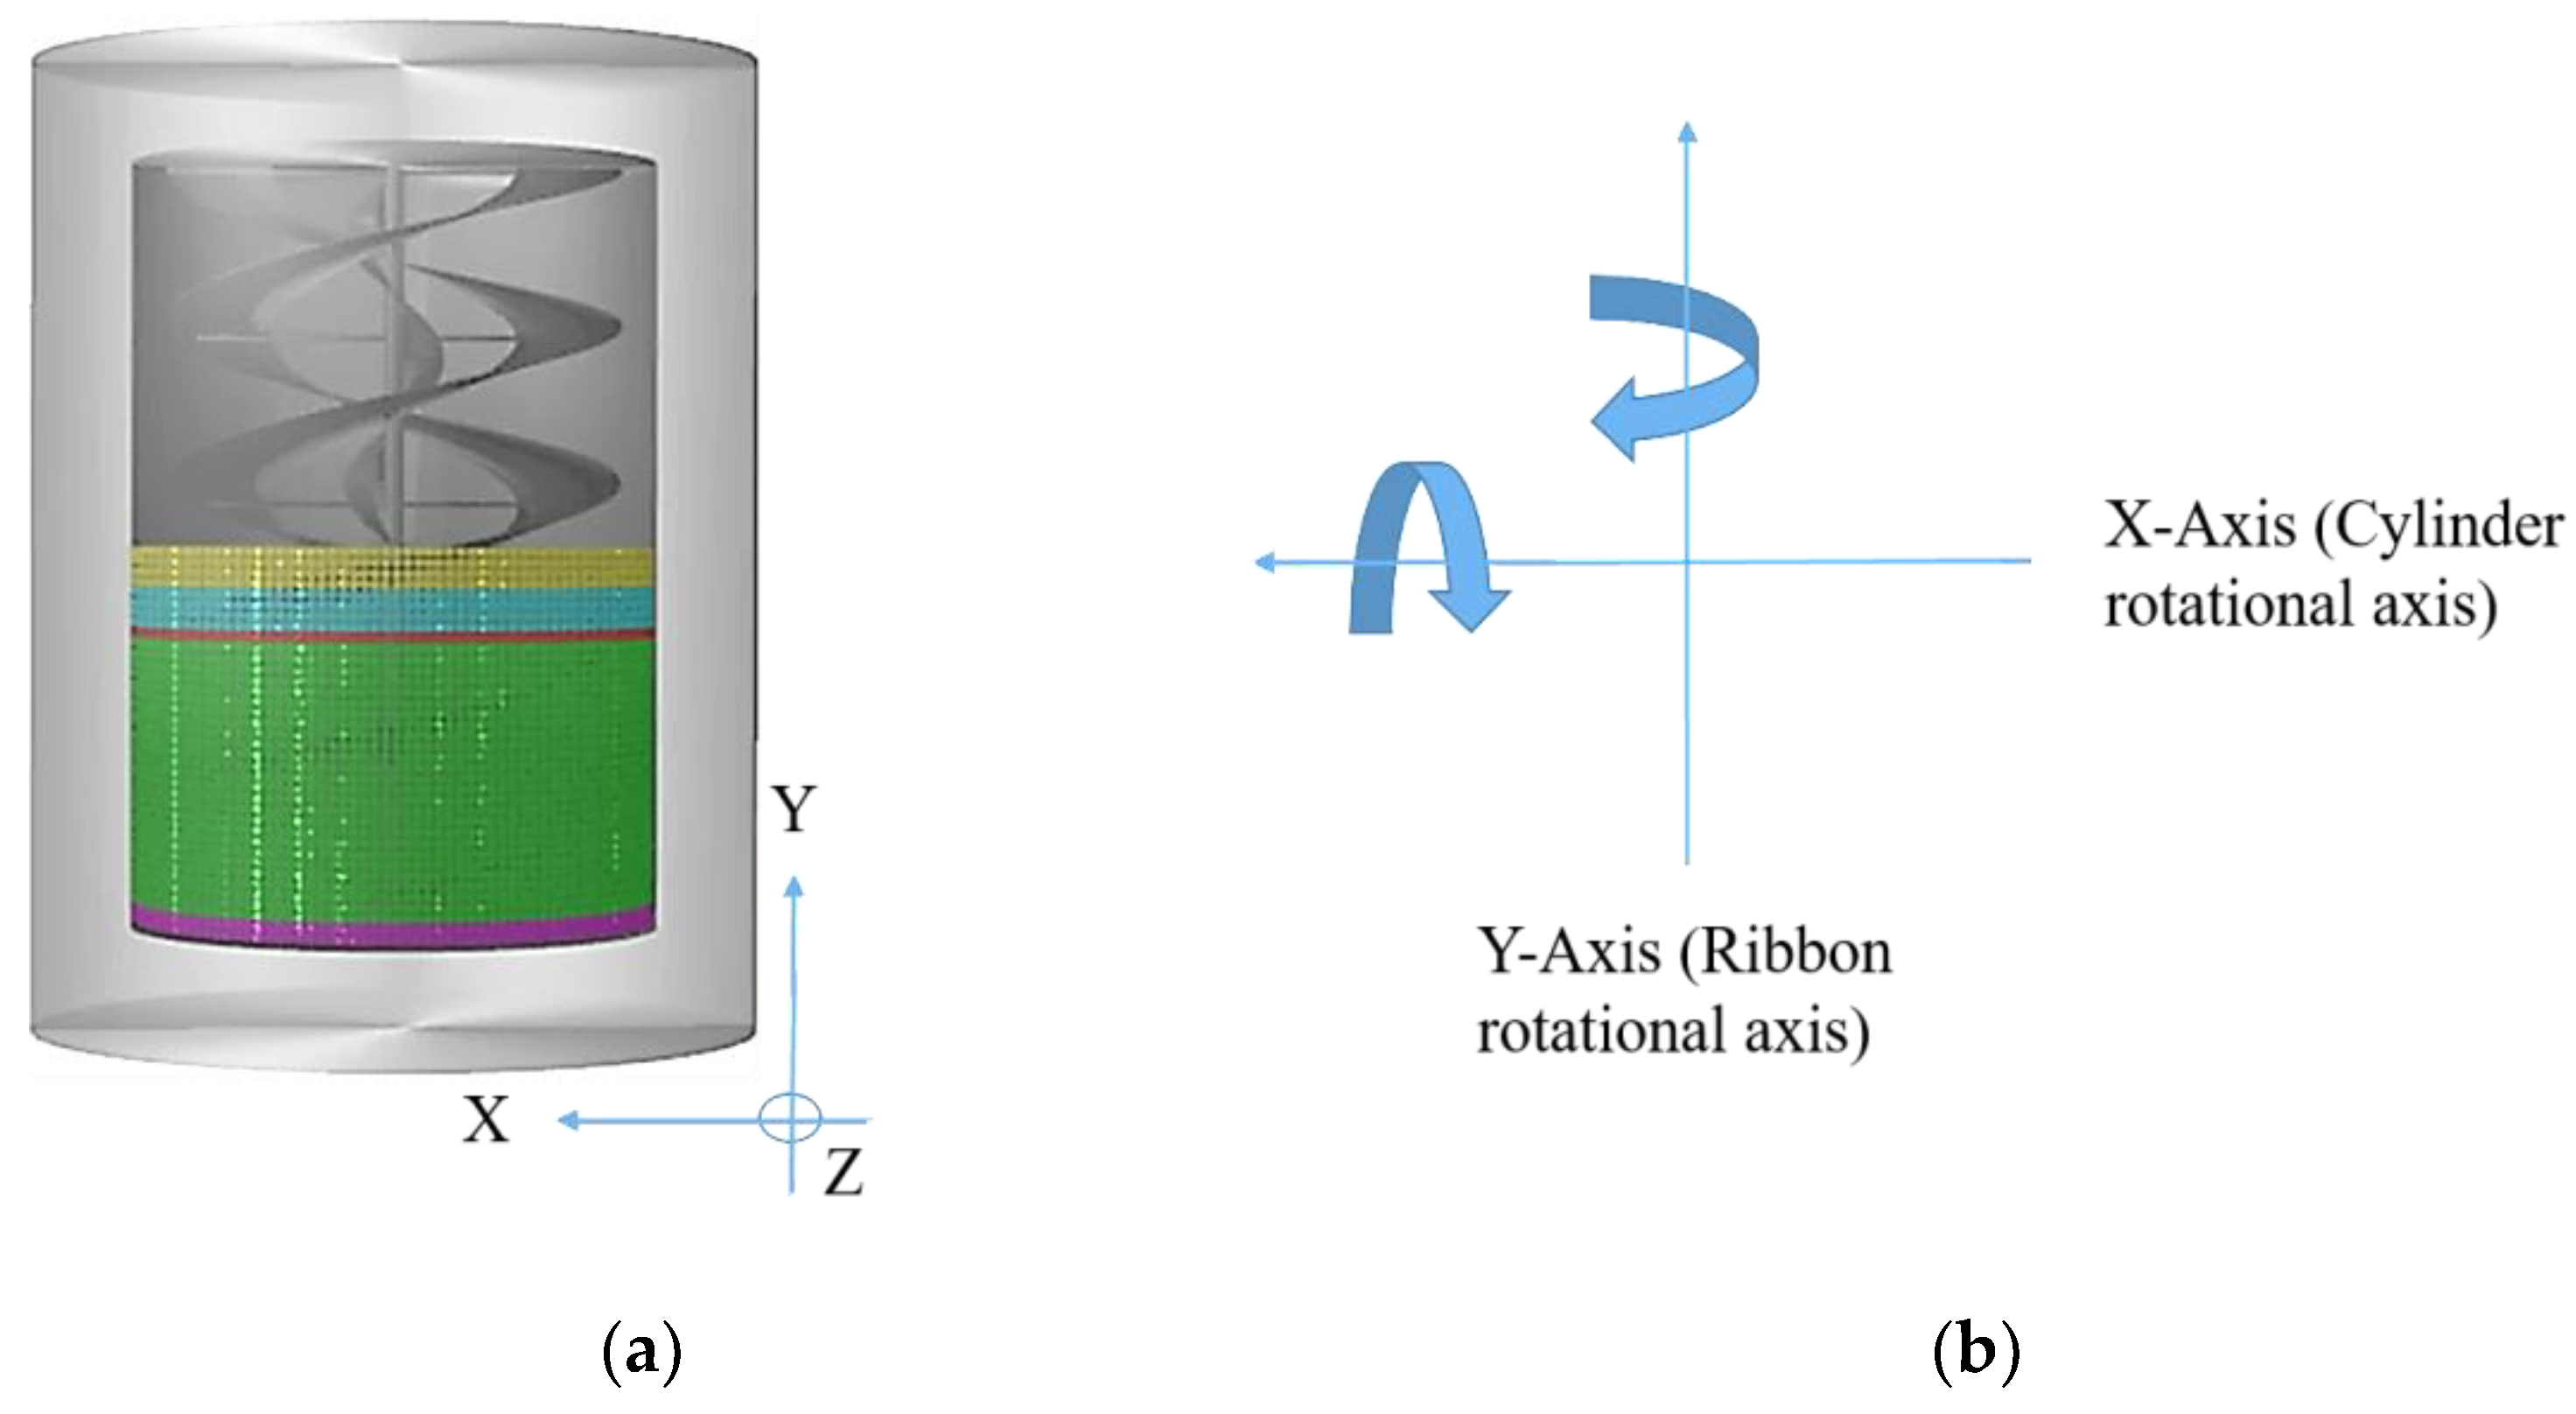
3.1. Model System

In general, a commercial whey protein mixture comprises carbohydrates, proteins, fiber, salts (e.g., sugar, sodium, and flavorings), and saturated fats. The densities and approximate percentages in 1000 g of the mixture are shown in Table 1. A VCR mixer was employed for the simulation of the mixing process, as shown in Figure 1a. The total cylinder volume was 10,385,550 mm3 (~10.4 L), of which 50% was filled with the commercial whey protein ingredients. Beginning from the bottom of the cylinder, the carbohydrates were filled to a height of 10.5 mm, after which the proteins were filled to 105 mm. The height of the added fiber was 4.5 mm, and those of the salts and saturated fats were 15 mm each.
The ribbon specifications are shown in Figure 1b. The width, pitch, and height of the ribbon were 42, 128, and 300 mm, respectively. Each ribbon had a thickness of 1 mm and a taper of 10°. An auger screw ran along the shaft of the ribbon with a thickness, pitch, and width of 0.5, 100, and 20 mm, respectively. A total of ten spokes were designed to support the ribbons, of which five are visible from the front view, as shown in Figure 1b. Each spoke was given a span of 120 mm and a diameter of 2 mm to strengthen the ribbons. A geometrically similar model was used to simulate the flow and mixing performance in helical ribbon mixers by M. Robinson and P.W. Cleary [16].

3.2. Computational Model

The above-mentioned model, which was designed using SolidWorks 2017 software, was imported to the Particle Works 5.1.1 software to perform the computational simulation process, which is shown in Figure 2a. The ingredients were converted to spherical particles. The radii, assigned colors, and number of particles generated for each ingredient are tabulated in Table 2. The mechanical properties, such as the coefficients of restitution, static friction, and dynamic friction are listed in Table 3. A total of 74,286 particles were generated in the computational domain. In the initial stage, all the ingredients were completely segregated, as shown in Figure 2a. The rotational axes of the ribbon and cylinder are shown in Figure 2b.

3.3. DEM

The discrete element method (DEM) is a method for analyzing particle behavior by following individual powder particles using the equations of motion. The equations of motion for the translational and rotational motion of the particles are as follows:
m d d t v = F
I d d t ω = T ,
where m is the mass, v is the velocity, F is the force, I is the moment of inertia, ω is the rotational velocity, and T is the torque. Since we have considered spherical particles, the moment of inertia can be expressed as follows:
I = 2 5 m a 2 ,
where a is the radius of the spherical particle.
The contact forces (repulsive force, energy decay, and sliding due to friction) account for the interactions between the particles. The magnitudes of the contact forces are defined as
F D E M n = k n δ n η n ( v i n v j n )
F D E M t = k t δ t η t { ( r i × ω i ) + ( r j × ω j ) } ,
where k is the spring constant, δ is the overlap, η is the viscous damping coefficient, v is the velocity, and r is the distance from the center of gravity of the particle to a contact point. As shown in Figure 3, thesuperscripts n and t represent the normal and tangential components of the contact forces, respectively, and the subscripts i and j denote the particle numbers.
When the ratio of the tangential and normal components of the contact force exceeds a friction coefficient µ , the powder particle slides, which is expressed as
F D E M t > μ F D E M n .

4. Results and Discussions

4.1. Effect of Ribbon Rotational (RR) Speed

In industrial applications, VCR mixers operate with various ribbon rotational speeds. It is crucial to optimize the rotation speed (rpm, rotation per minute) of the ribbon in order to achieve effective mixing in a specific duration. In order to optimize the rotation speed and determine the appropriate time interval to ensure uniform mixing, DEM simulations were performed with ribbon rotational speeds of 100, 200, and 300 rpm for 60 s. The simulation results are shown in Figure 4. By general observation of the particle mixing simulation result, such as those at 10 s, we show that the mixing at 200 rpm is more uniform than that at 100 rpm.
Figure 5a shows the variations of the mixing index over time. An SMI of 0.58 was achieved at a ribbon rotation speed of 100 rpm, and when the rotation speed was increased to 200 and 300 rpm, SMIs of 0.92 were achieved. Figure 5b marks the approach of a stable SMI over time. A stable SMI of 0.58 was attained at 3 s at a rotation speed of 100 rpm, and a stable SMI of 0.92 was attained at 59 and 56 s at rotation speeds of 200 and 300 rpm, respectively. Though a stabilized SMI was attained faster at 100 rpm than at the higher rotation speeds, the SMI value was very small and the mixing was non-uniform. Figure 6 shows a single particle path for various ribbon rotation speeds for 60 s. The particle motion does not indicate effective mixing performance when the ribbon is rotating at 100 rpm, as shown in Figure 6a, but as the rotation speed increases, the enhanced mixing performance is evident by the particle movement, as shown in Figure 6b,c.

4.2. The Effect of Cylinder Rotational Speed

The cylinder rotation speed is another significant parameter for mixers. To analyze the mixing performance due to the cylinder rotation, we considered two cases: (i) cylinder rotation effect without a ribbon and (ii) cylinder rotation effect with a static ribbon, discussed in Section 4.2.1 and Section 4.2.2, respectively.

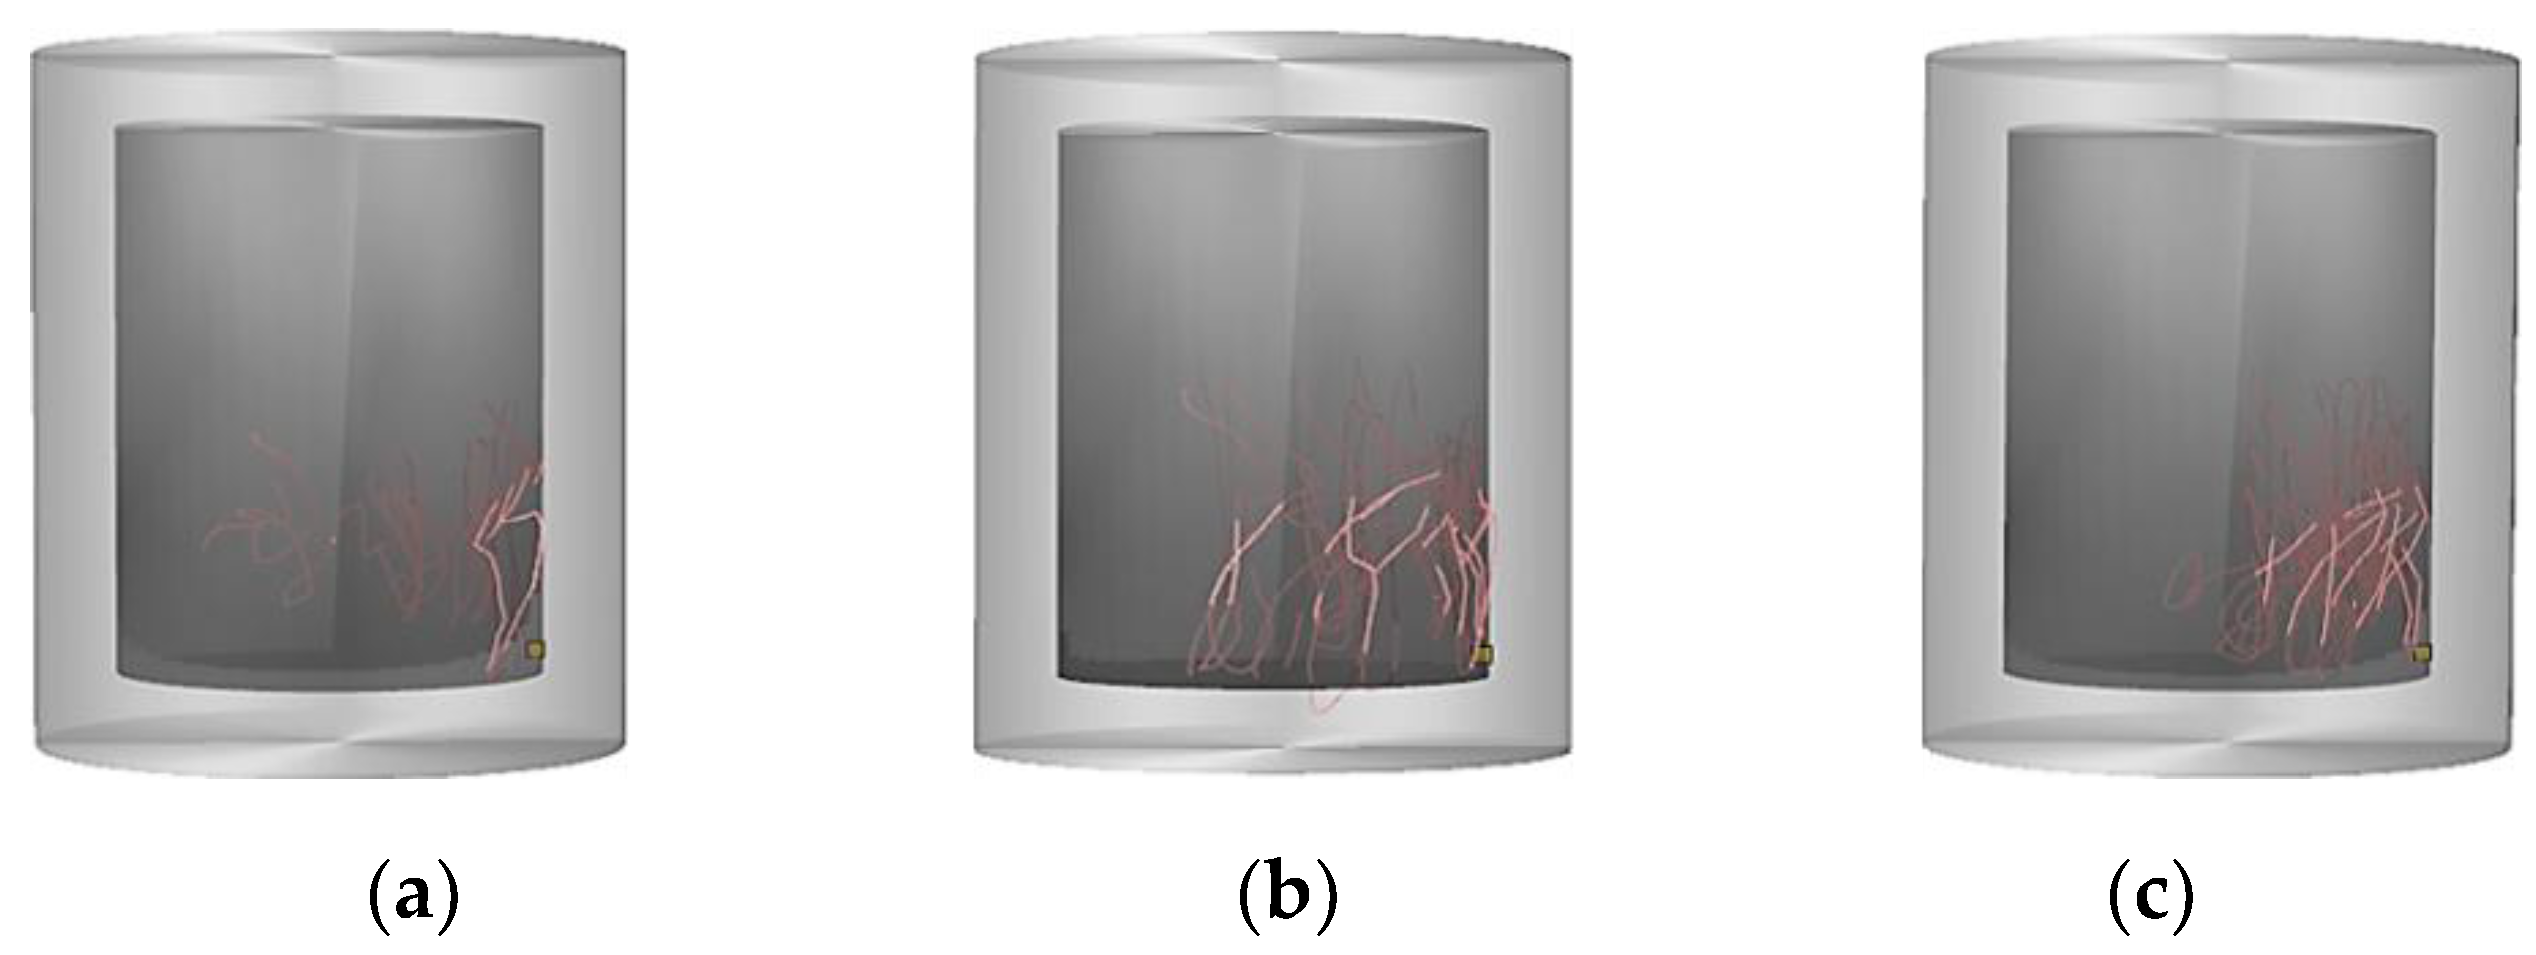
4.2.1. The Effect of Cylinder Rotational (CR) Speed without Ribbon

The cylinder rotation, as shown in Figure 2b, was about the X-axis i.e., perpendicular to ribbon rotational axis. The cylinder rotation speeds were set at 10, 15, and 20 rpm; the numerical simulation results are shown in Figure 7. The mixing index variations over time plotted in Figure 8a show that all the rotation rates produced uniform mixing, but rapid mixing was achieved as the rotation rate increased. Thus, the cylinder rotation affects the mixing performance in VCR mixers. Figure 8b shows that a stable SMI of 0.91 was achieved at 57, 56, and 51 s at cylinder rotation rates of 10, 15, and 20 rpm, respectively. Particle tracings are shown in Figure 9 for the three rotation speeds, illustrating the mixing process.

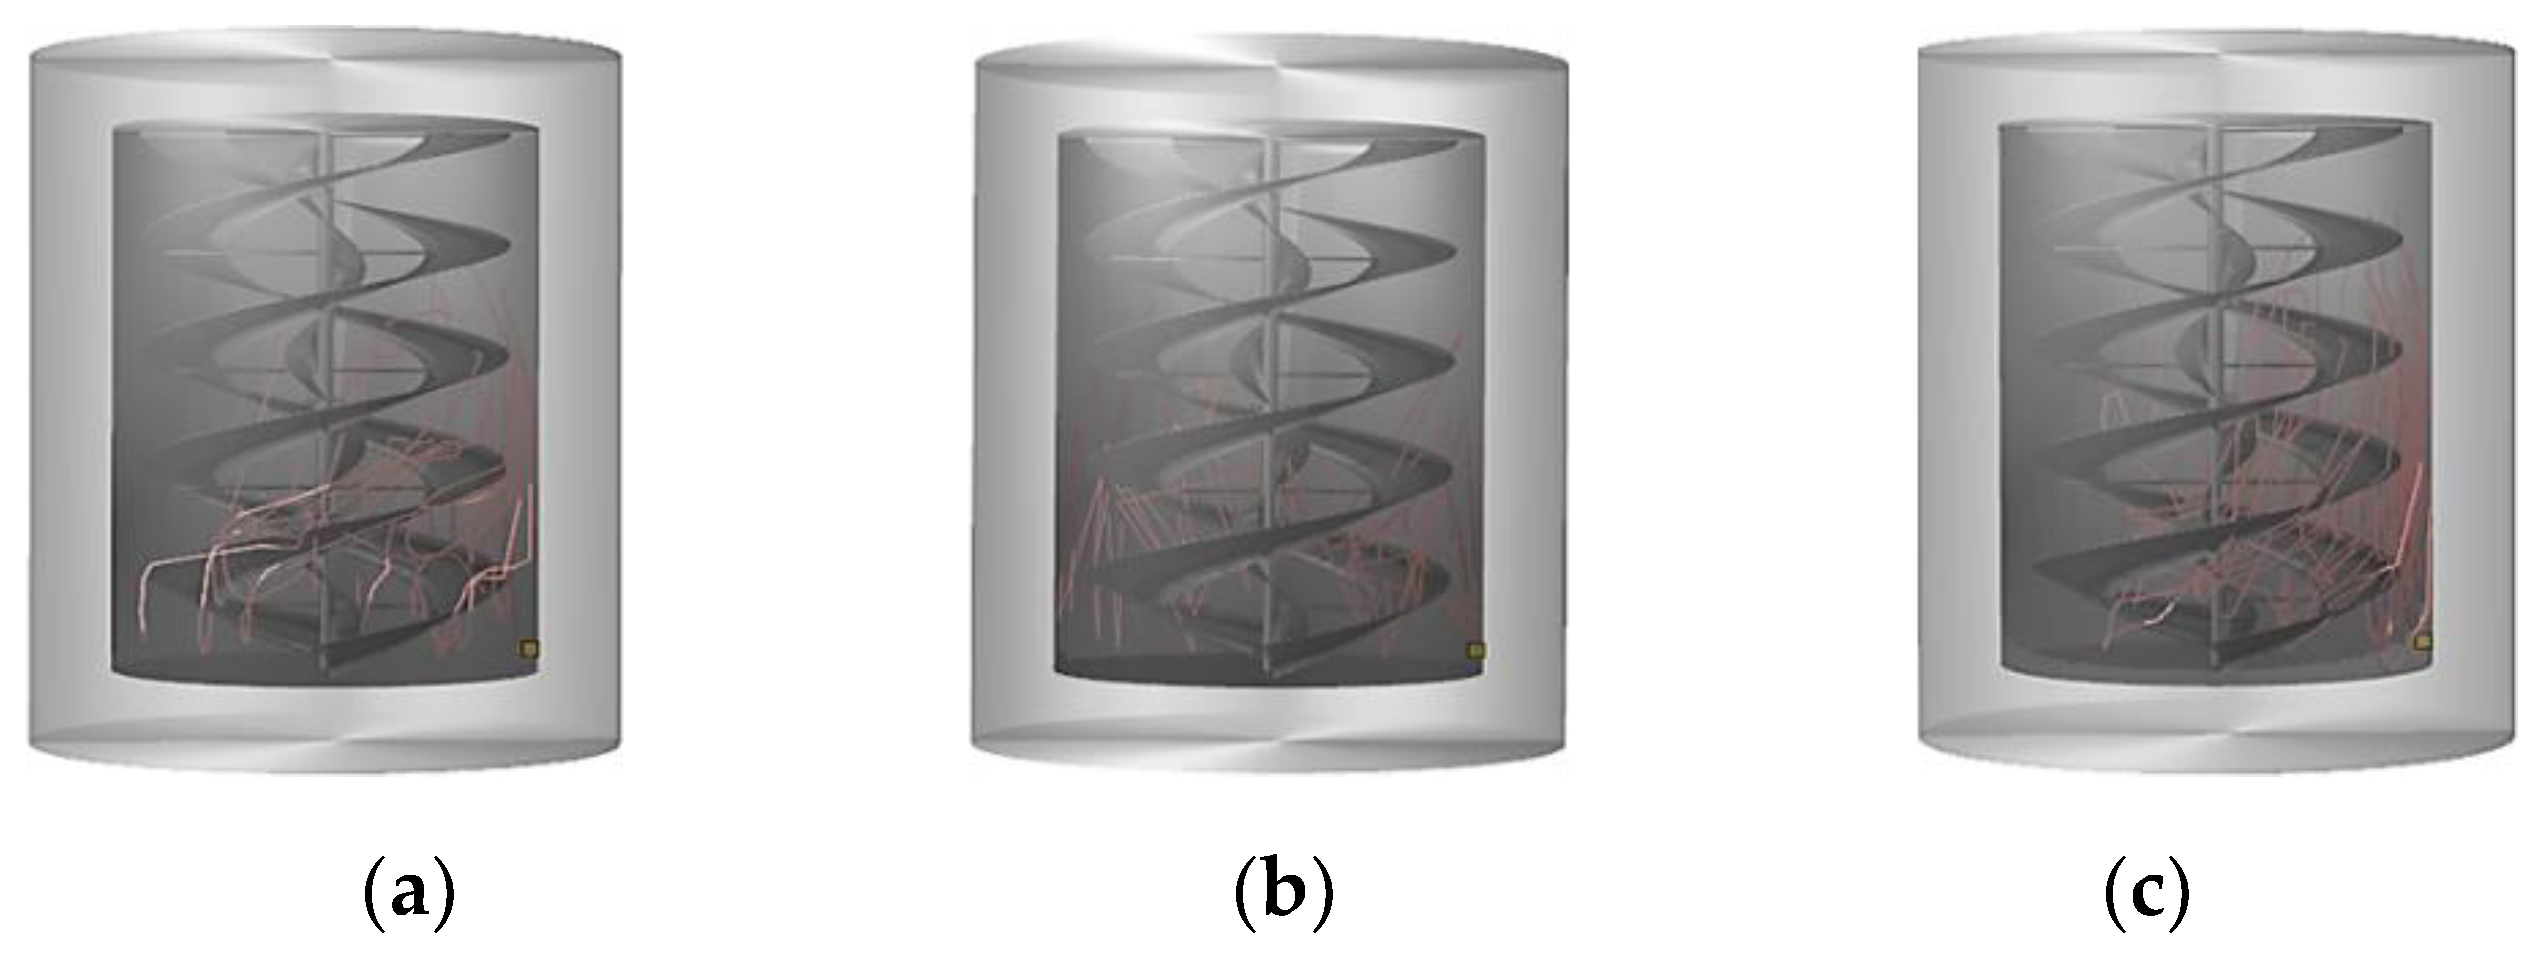
4.2.2. The Effect of Cylinder with Static Ribbon Rotational Speed (CSRR)

In this condition, a static ribbon is included in the mixer and the cylinder rotation speeds were 10, 15, and 20 rpm. As shown in Figure 10, uniform mixing was achieved for all the conditions. This is also clear in Figure 11a, in which the mixing index is plotted over time, as the curves for all rotational speeds were similar after 20 s.
Figure 11b shows that a stable SMI of 0.92 was achieved at 28, 24, and 20 s for cylinder rotation rates of 10, 15, and 20 rpm respectively. Thus, the ribbon enhances the mixing performance significantly. Figure 12 shows the particle tracing at the three rotation speeds.

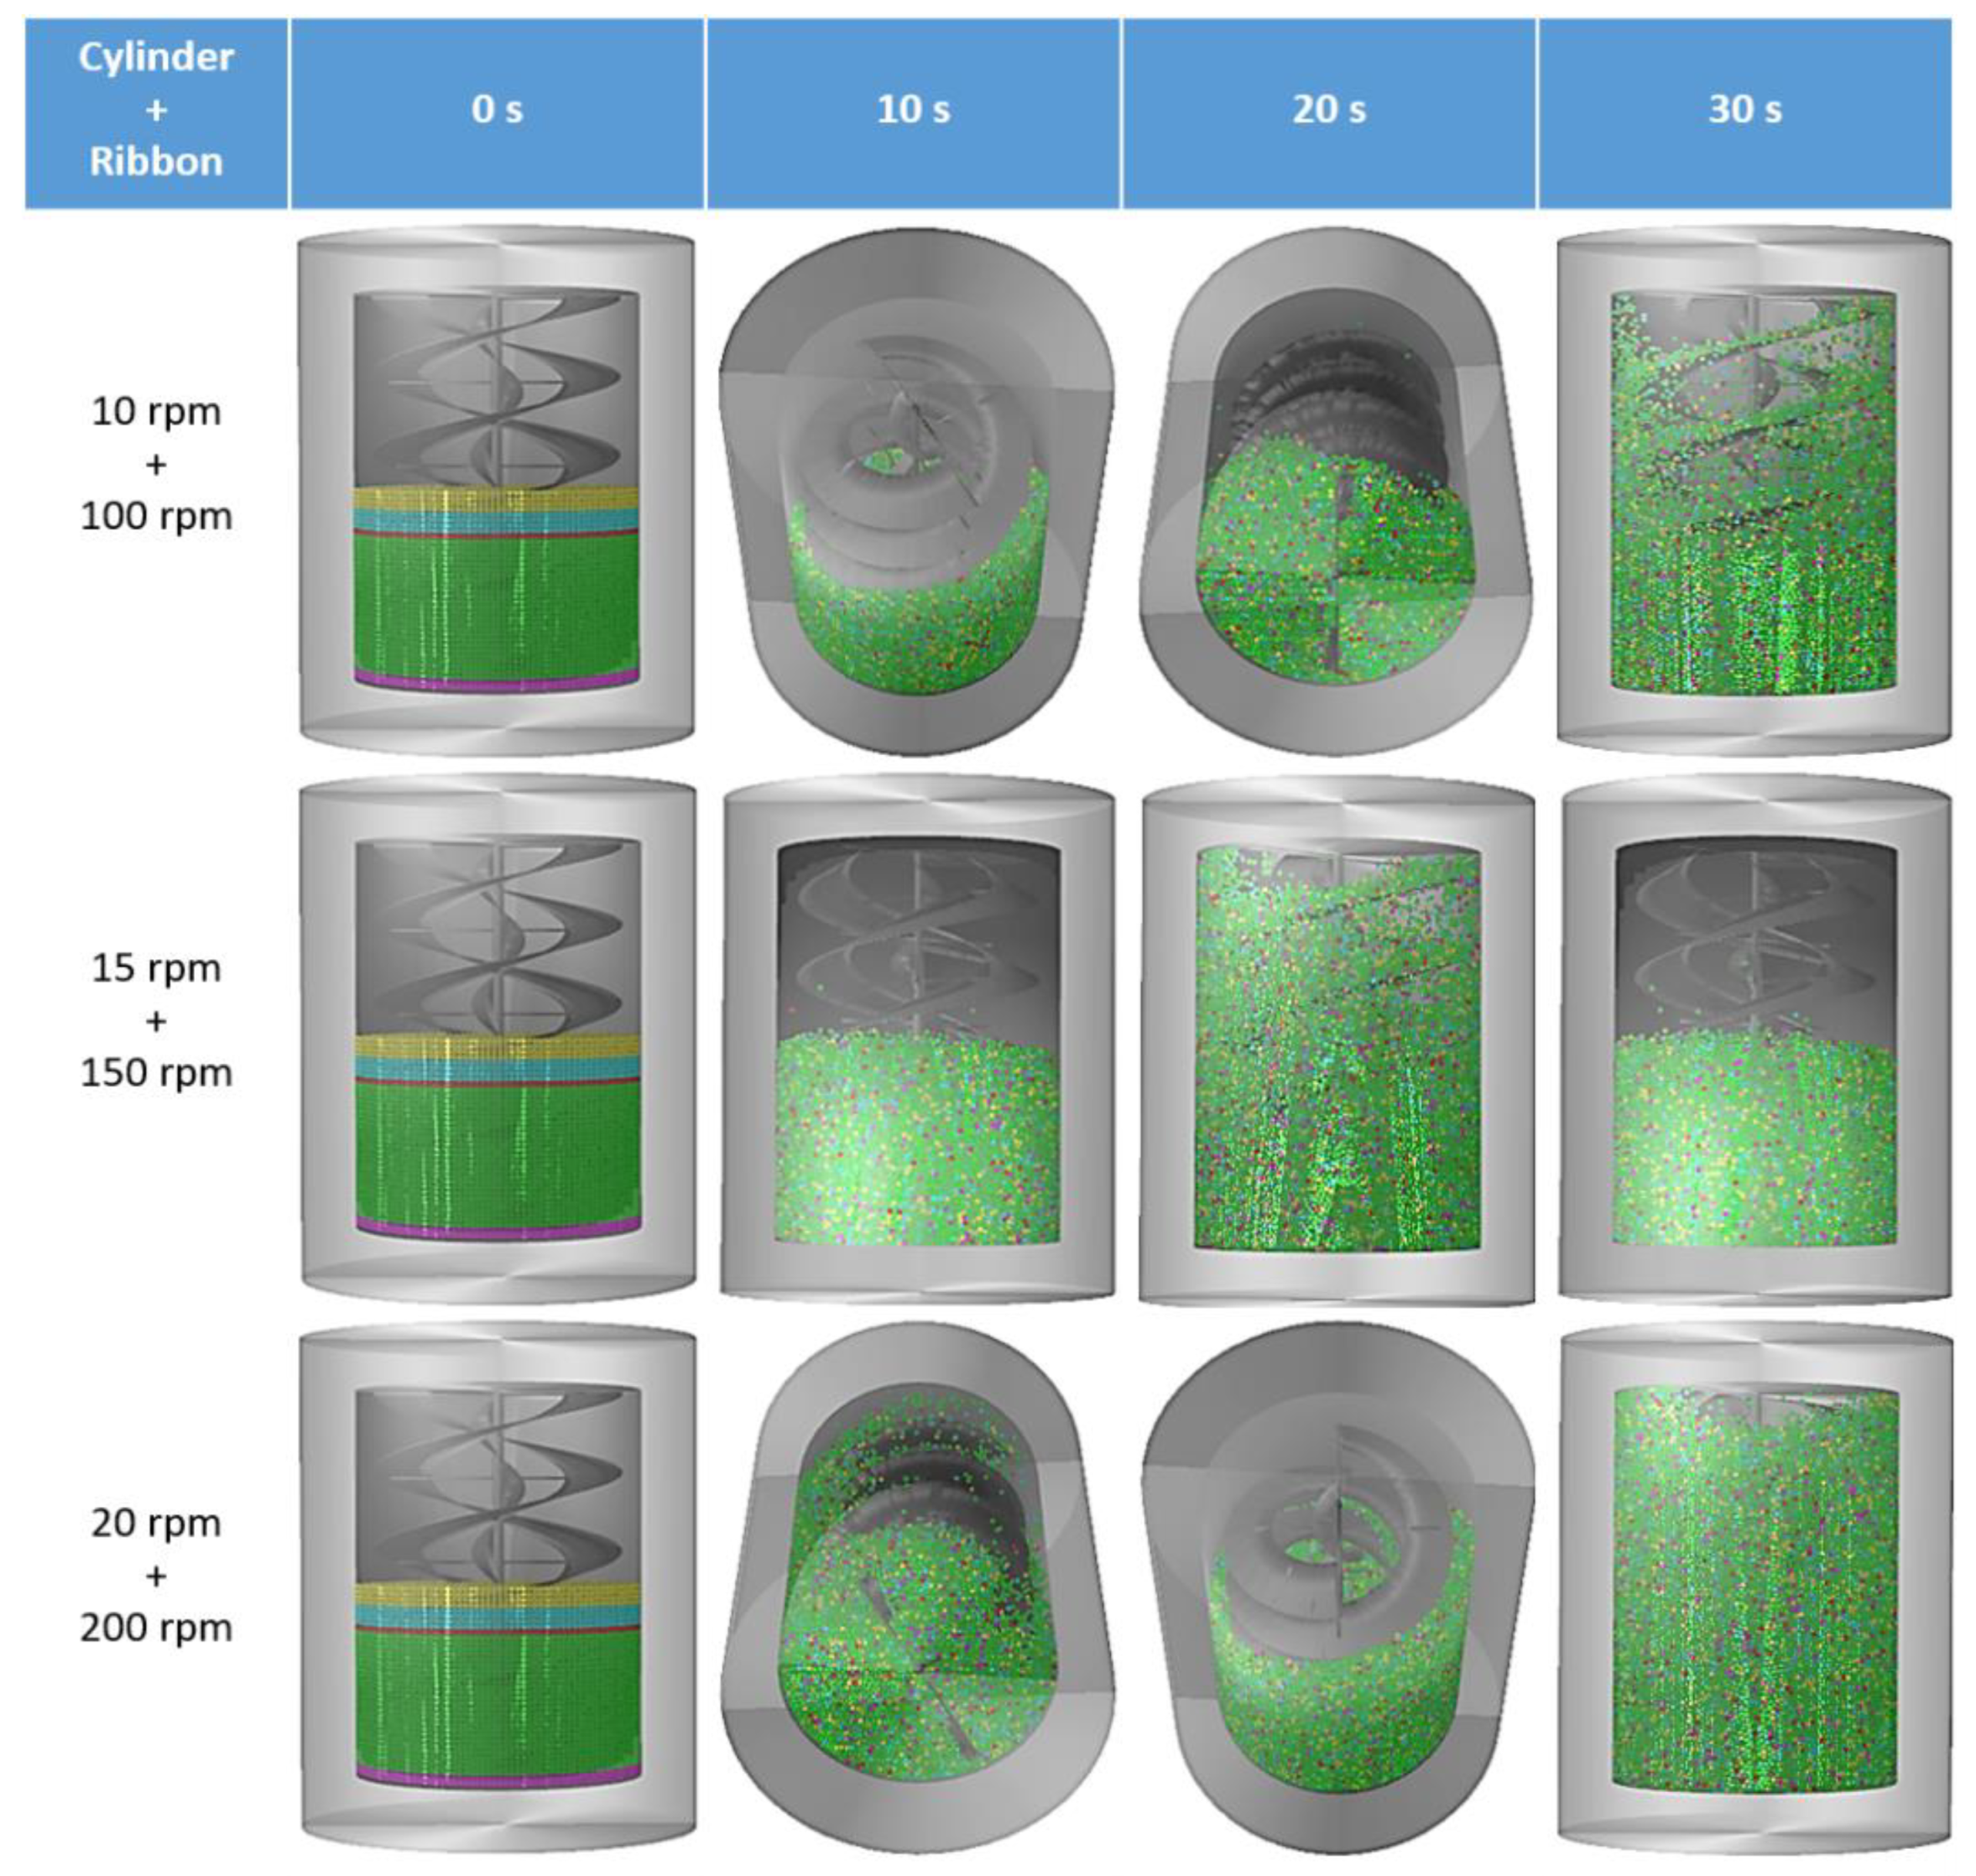
4.3. Effect of Combination (Cylinder + Ribbon) Rotational Speed

Simultaneous cylinder and ribbon rotation (CRR) were simulated to analyze the effect on the mixing performance. Three combinational rotational speeds—(i) 10 +100, (ii) 15+150, and (iii) 20+200 rpm—were considered, with the first and second numbers corresponding to the cylinder and ribbon rotation speeds, respectively. The simulation results in Figure 13 show that a fully randomly mixed condition was achieved in all three conditions. This is an intense rapid mixing condition, and an SMI of 0.93 was achieved in a short time span, as shown in Figure 14a. Figure 14b shows that a stable SMI of 0.93 was achieved at 21, 18, and 16 s for cases i, ii, and iii, respectively. The particle tracing in Figure 15 shows the rapid movement of particles within the domain. Although the CRR condition showed a rapid mixing rate, this condition would require high power consumption in industrial applications.

4.4. Comparison

A comparison of the results from the four conditions simulated is made to understand the significance of cylinder rotation in VCR mixers. Figure 16a shows the SMI graph over time for the four conditions: (i) ribbon rotation (RR) at 100 rpm, (ii) cylinder rotation (CR) without ribbon at 10 rpm, (iii) cylinder with static ribbon rotation (CSRR) at 10 rpm, and (iv) cylinder and ribbon rotation i.e., combination rotation (CRR) at 10+100 rpm. In the cases with cylinder rotation with and without a ribbon, a rapid mixing rate was achieved. As shown in Figure 16b, a stable SMI of 0.92 was achieved at 57 and 28 s for CR and CSRR, respectively, when the cylinder rotation speed was 10 rpm. This implies that a randomly mixed condition can be attained for the CSRR condition in less than 50% of the time required for the CR condition.

5. Conclusions

The mixing performance in VCR mixers was numerically investigated using DEM simulations. The mixing of commercial whey protein mixture components in a VCR mixer was simulated. Four conditions—RR, CR, CSRR, and CRR—were studied. As the rotation speeds increase for each condition, there was an improvement in mixing performance. The smallest rotation speed simulated for the RR condition did not result in uniform mixing. The CSRR condition achieved uniform mixing in less than half the time required for the CRR condition at 10 rpm. In the CSRR condition, the ribbon is kept static, and only the cylinder is rotated, whereas in the CRR condition, both the ribbon and cylinder are rotated, which requires additional power. Hence, the CSRR condition is recommended for industrial applications to attain uniform mixing or a fully randomly mixed condition in the least possible time span. Also, based on the achieved encouraging results, future work on optimizing and analyzing the mixing performances of viscous fluids and ternary particles is anticipated.

Author Contributions

Conceptualization, V.V.N.H. and J.S.; Methodology, V.V.N.H., M.C. and J.S.; Software, V.V.N.H., M.C. and J.S.; Validation, V.V.N.H.; Formal Analysis, V.V.N.H. and J.S.; Investigation, V.V.N.H.; Resources, V.V.N.H., M.C. and J.S.; Data Curation, V.V.N.H.; Writing-Original Draft Preparation, V.V.N.H.; Writing-Review & Editing, V.V.N.H. and J.S.; Visualization, V.V.N.H.; Supervision, M.C. and J.S.; Project Administration, M.C. and J.S.; Funding Acquisition, M.C. and J.S.

Funding

This research was supported by the National Research Foundation of Korea (NRF) funded by the Korea government (2019R1F1A1060655 and 2018R1A2B6002849).

Conflicts of Interest

The authors declare no conflict of interest.

Abbreviations

SMISubdomain-based mixing index
RRRibbon rotation
CRCylinder rotation
CSRRCylinder with static ribbon rotation
CRRCylinder and ribbon rotation

References

  1. Thakur, R.K.; Vial, C.; Nigam, K.D.P.; Nauman, E.B.; Djelveh, G. Static Mixers in the Process Industries—A Review. Chem. Eng. Res. Des. 2003, 81, 787–826. [Google Scholar] [CrossRef]
  2. Badawy, S.I.F.; Lee, T.J.; Menning, M.M. Effect of drug substance particle size on the characteristics of granulation manufactured in a high-shear mixer. AAPS PharmSciTech 2000, 1, 55–61. [Google Scholar] [CrossRef] [PubMed]
  3. Hoornahad, H.; Koenders, E.A.B. Towards Simulation of Fresh Granular-Cement Paste Material Behavior. Adv. Mater. Res. 2011, 295, 2171–2177. [Google Scholar] [CrossRef]
  4. Radl, S.; Kalvoda, E.; Glasser, B.J.; Khinast, J.G. Mixing characteristics of wet granular matter in a bladed mixer. Power Technol. 2010, 200, 171–189. [Google Scholar] [CrossRef]
  5. Cho, M.; Dutta, P.; Shim, J. A non-sampling mixing index for multicomponent mixtures. Power Technol. 2017, 319, 434–444. [Google Scholar] [CrossRef]
  6. Harnby, N.; Edwards, M.F.; Nienow, A.W. Mixing in the Process Industries, 2nd ed.; Butterworth-Heinemann: Oxford, UK; Boston, MA, USA, 1992; 414p. [Google Scholar]
  7. Laurent, B.F.C.; Bridgwater, J.; Parker, D.J. Motion in a particle bed agitated by a single blade. AIChE J. 2004, 46, 1723–1734. [Google Scholar] [CrossRef]
  8. Corrsin, S. Simple theory of an idealized turbulent mixer. AIChE J. 1957, 3, 329–330. [Google Scholar] [CrossRef]
  9. Qi, F.; Heindel, T.J.; Wright, M.M. Numerical study of particle mixing in a lab-scale screw mixer using the discrete element method. Power Technol. 2017, 308, 334–345. [Google Scholar] [CrossRef]
  10. Alian, M.; Ein-Mozaffari, F.; Upreti, S.R. Analysis of the mixing of solid particles in a plowshare mixer via discrete element method (DEM). Power Technol. 2015, 274, 77–87. [Google Scholar] [CrossRef]
  11. Ameur, H.; Kamla, Y.; Sahel, D. Performance of Helical Ribbon and Screw Impellers for Mixing Viscous Fluids in Cylindrical Reactors. ChemEngineering 2018, 2, 26. [Google Scholar] [CrossRef]
  12. Zhang, J.; Luo, X. Mixing Performance of a 3D Micro T-Mixer with Swirl-Inducing Inlets and Rectangular Constriction. Micromachines 2018, 9, 199. [Google Scholar] [CrossRef] [PubMed]
  13. Gao, W.; Liu, L.; Liao, Z.; Chen, S.; Zang, M.; Tan, Y. Discrete element analysis of the particle mixing performance in a ribbon mixer with a double U-shaped vessel. Granul. Matter 2019, 21, 12. [Google Scholar] [CrossRef]
  14. Mihailova, O.; Mothersdale, T.; Rodgers, T.; Ren, Z.; Watson, S.; Lister, V.; Kowalski, A. Optimisation of mixing performance of helical ribbon mixers for high throughput applications using computational fluid dynamics. Chem. Eng. Res. Des. 2018, 132, 942–953. [Google Scholar] [CrossRef]
  15. Masiuk, S. Power consumption, mixing time and attrition action for solid mixing in a ribbon mixer. Power Technol. 1987, 51, 217–229. [Google Scholar] [CrossRef]
  16. Robinson, M.; Cleary, P.W. Flow and mixing performance in helical ribbon mixers. Chem. Eng. Sci. 2012, 84, 382–398. [Google Scholar] [CrossRef]
  17. Muzzio, F.J.; Llusa, M.; Goodridge, C.L.; Duong, N.-H.; Shen, E. Evaluating the mixing performance of a ribbon blender. Power Technol. 2008, 186, 247–254. [Google Scholar] [CrossRef]
  18. Basiński, H.; Rzyski, E. Power requirements of helical ribbon mixers. Chem. Eng. J. 1980, 19, 157–160. [Google Scholar] [CrossRef]
  19. Devries, M.C.; Phillips, S.M. Supplemental Protein in Support of Muscle Mass and Health: Advantage Whey. J. Food Sci. 2015, 80, A8–A15. [Google Scholar] [CrossRef]
  20. Pal, S.; Ellis, V.; Dhaliwal, S. Effects of whey protein isolate on body composition, lipids, insulin and glucose in overweight and obese individuals. Br. J. Nutr. 2010, 104, 716–723. [Google Scholar] [CrossRef]
  21. Morifuji, M.; Koga, J.; Kawanaka, K.; Higuchi, M. Branched-Chain Amino Acid-Containing Dipeptides, Identified from Whey Protein Hydrolysates, Stimulate Glucose Uptake Rate in L6 Myotubes and Isolated Skeletal Muscles. J. Nutr. Sci. Vitaminol. 2009, 55, 81–86. [Google Scholar] [CrossRef]
  22. Basinskas, G.; Sakai, M. Numerical study of the mixing efficiency of a ribbon mixer using the discrete element method. Power Technol. 2016, 287, 380–394. [Google Scholar] [CrossRef]
  23. Vu-Quoc, L.; Zhang, X.; Walton, O.R. A 3-D discrete-element method for dry granular flows of ellipsoidal particles. Comput. Methods Appl. Mech. Eng. 2000, 187, 483–528. [Google Scholar] [CrossRef]
  24. Luding, S. Introduction to discrete element methods. Eur. J. Environ. Civ. Eng. 2008, 12, 785–826. [Google Scholar] [CrossRef]
  25. Deng, R.; Tan, Y.; Zhang, H.; Xiao, X.; Jiang, S. Experimental and DEM studies on the transition of axial segregation in a truck mixer. Power Technol. 2017, 314, 148–163. [Google Scholar] [CrossRef]
  26. Lacey, P.M.C. Developments in the theory of particle mixing. J. Appl. Chem. 1954, 4, 257–268. [Google Scholar] [CrossRef]
  27. Lacey, P.M.C. The mixing of solid particles. Chem. Eng. Res. Des. 1997, 75, S49–S55. [Google Scholar] [CrossRef]
  28. Asmar, B.N.; Langston, P.A.; Matchett, A.J. A generalised mixing index in distinct element method simulation of vibrated particulate beds. Granul. Matter 2002, 4, 129–138. [Google Scholar] [CrossRef]
  29. Siraj, M.S.; Radl, S.; Glasser, B.J.; Khinast, J.G. Effect of blade angle and particle size on powder mixing performance in a rectangular box. Power Technol. 2011, 211, 100–113. [Google Scholar] [CrossRef]
Figure 1. (a) Vertical cylindrical double ribbon mixer geometry. (b) Ribbon specifications. All dimensions are shown in mm.
Applsci 09 05179 g001
Figure 2. (a) Schematic view of vertical cylindrical double ribbon mixer imported to ParticleWorks software. (b) Representation of rotational axes.
Applsci 09 05179 g002
Figure 3. Interaction between DEM–DEM particles.
Applsci 09 05179 g003
Figure 4. Simulation results for particle mixing at various ribbon rotation rates at different times.
Applsci 09 05179 g004
Figure 5. (a) SMI plot and (b) stable SMI vs. time for different ribbon rotation speeds.
Applsci 09 05179 g005
Figure 6. Particle tracing illustrating the mixing process for ribbon rotation rates of (a) 100, (b) 200, and (c) 300 rpm.
Applsci 09 05179 g006
Figure 7. Simulation results for particle mixing at three cylinder rotation speeds at different times.
Applsci 09 05179 g007
Figure 8. (a)SMI plot and (b) stable SMI vs. time for different cylinder rotations without ribbon.
Applsci 09 05179 g008
Figure 9. Particle tracing illustrating the mixing process for cylinder rotation without ribbon at (a) 10, (b) 15, and (c) 20 rpm.
Applsci 09 05179 g009
Figure 10. Simulation results of particle mixing for various cylinder rotation rates with a static ribbon at different times.
Applsci 09 05179 g010
Figure 11. (a) SMI plot and (b) stable SMI vs. time for different cylinder rotation speeds with static ribbon.
Applsci 09 05179 g011
Figure 12. Particle tracing illustrates the mixing process for cylinder rotation at (a) 10, (b) 15, and (c) 20 rpm with static ribbon.
Applsci 09 05179 g012
Figure 13. Simulation results of particle mixing corresponding to the combinational rotation at different times.
Applsci 09 05179 g013
Figure 14. (a) SMI plot and (b) stable SMI vs. time for different combination rotation speeds.
Applsci 09 05179 g014
Figure 15. Particle tracing illustrating the mixing process for combination rotation at various rotational speeds: (a)10+100, (b)15+150, and (c) 20+200 rpm.
Applsci 09 05179 g015
Figure 16. (a) SMI plot and (b) stable SMI vs. time to compare the above four cases.
Applsci 09 05179 g016
Table 1. Ingredients and average compositions in 1000 grams of whey protein mixture.
IngredientsPercentage (%)Weight (g)Density (kg/m2)
Saturated fats 10 100917.2
Salts (sugar, sodium, flavor, etc) 101001203.5
Fibers 3 30 1300.5
Protein 70 700 1319.5
Carbohydrates 7 70 1592.9
Table 2. Input parameters for discrete element method (DEM) simulation.
IngredientsNumber of particlesRadius (mm)Assigned color
Saturated fats80142Yellow
Salts (sugar, sodium, flavor, etc) 80062Sky Blue
Fibers 20072Red
Protein 521402Green
Carbohydrates 41192Pink
Table 3. Particle–particle and particle–wall mechanical properties.
IngredientsValue
Coefficient of restitution0.5
Coefficient of static friction 0.3
Coefficient of dynamic friction 0.03

