Article

Analysis of Protein–Receptor Interactions on an Example of Leptin–Leptin Receptor Interaction Using the Resonant Recognition Model

1
AMALNA Consulting, Black Rock, Melbourne VIC 3193, Australia
2
College of Science, Engineering and Health, RMIT University, Melbourne VIC 3000, Australia
3
Tithon Biotech Inc., San Diego, CA 92127, USA
*
Author to whom correspondence should be addressed.
Appl. Sci. 2019, 9(23), 5169; https://doi.org/10.3390/app9235169
Submission received: 8 September 2019 / Revised: 25 November 2019 / Accepted: 27 November 2019 / Published: 28 November 2019
(This article belongs to the Special Issue Electromagnetic Radiation in Biology and Health)

Abstract

:

Featured Application

The results of this research can be used in combating obesity and overweight, which are becoming increasing health problems in modern society.

Abstract

Obesity is a medical condition in which excess body fat may have a negative effect on health and lifestyle, and it is becoming an increasing problem within modern society. Leptin is the key protein that regulates body energy balance by inhibiting hunger, and it could potentially be used in treatment of obesity and overweight. Here, we applied our own Resonant Recognition Model, which is capable of analyzing the selectivity of any protein–receptor interaction on an example of leptin–leptin receptor. We have identified a specific characteristic parameter for leptin activity through the leptin receptor, and this parameter could be used in development of new treatments for obesity.

1. Introduction

Proteins are the main biomolecular forces that are involved in controlling most biological processes in living cells, tissues, and organisms. They exhibit their biological functions through selective interactions with other molecules, which could also be proteins and/or DNA. The most complex protein interactions are interactions between proteins and their receptors, which are proteins or complexes of proteins that selectively drive specific biological pathways. Currently, the selectivity of interactions between proteins and their receptors are investigated mostly using 3D matching between interacting proteins, which is not explicit enough to explain the high specificity of these interactions. Experimentally, protein–receptor interactions are investigated by a number of techniques including X-ray, MRI, spectroscopy, etc. However, all these techniques are very expensive and time consuming. Thus, there is a need for a biophysical approach that can investigate protein–receptor interactions with more specificity than 3D matching.
Here, we present the ability of the Resonant Recognition Model (RRM) [1,2,3,4,5,6,7], which is a biophysical model based on the finding that certain periodicities (frequencies), in distribution of free electron energies along the protein and corresponding electromagnetic radiation, are critical for protein biological function and selective interaction with receptors. The RRM model has already been tested in numerous examples including fibroblast growth factor (FGF) and its receptor [4], insulin and its receptor [5], tumor necrosis factor (TNF) and its receptor [6], and interleukin-12/23 and their receptors [7]. Here, we present the RRM concept for analysis of protein receptor recognition on an example of leptin and leptin receptor.
Leptin is a hormone that regulates energy balance within the organism by inhibiting hunger by acting on cell receptors in the brain. Leptin is potentially identified to sustain weight loss and could be used in treatment of obesity and overweight. Overweight and obesity are huge health problems within modern society. Obesity is medical condition in which excess body fat has accumulated to such an extent that it may have a negative effect on health and lifestyle [8]. Obesity could be involved in the development of various diseases and conditions, particularly cardiovascular diseases, type 2 diabetes, obstructive sleep apnea, certain types of cancer, osteoarthritis, and depression [8,9]. Obesity is commonly caused by a combination of excessive food intake, lack of physical activity, and genetic factors [10]. Thus, there is a need to find out how to control and overcome factors that cause obesity. There are many possible mechanisms involved in the development and maintenance of obesity, and one of the approaches to solve this problem is to be able to control the feeling of hunger and subsequently control food intake. This could be achieved by controlling the protein cascade that controls hunger and energy balance within the body. Leptin is a crucial protein in such a cascade, which is involved in limiting hunger. Thus, by using leptin or mimicking leptin activity, the appetite of obese and overweight individuals can be controlled. Leptin acts on leptin receptors located in the hypothalamus to regulate appetite to achieve energy homeostasis [11]. Leptin also binds to neuropeptide Y (NPY) in NPY neurons, decreasing activity of NPY neurons. In addition, neuropeptide Y is inhibited by activated leptin receptors. Thus, NPY neurons are also the key element in the regulation of hunger [12].
We used the Resonant Recognition Model (RRM) to analyze leptins, leptin receptors, and neuropeptides Y, with the aim to find out which parameter (electromagnetic resonant frequency) characterizes leptin main activity of recognition and interaction with leptin receptors and neuropeptide Y. Such a parameter can be used for developing treatments to achieve hunger control and subsequent energy balance (homeostasis) within the body.

2. Methods and Materials

2.1. Methods—Resonant Recognition Model (RRM)

Here, we utilized the RRM model to analyze leptins, leptin receptors, and related neuropeptides Y with the aim of finding out the common RRM frequency characterizing the control of hunger and energy balance within the organism.
The RRM model is based on the findings that certain periodicities within the distribution of energy of delocalized electrons along protein/DNA molecules are critical for protein/DNA biological functions and/or interactions with their targets [1,2,3,4,5,6,7]. In the case of protein–protein receptor interactions, it has been found that phases at the characteristic interaction frequency should be opposite, i.e., should be close to π (3.14 rad) [1,2,3,4,5,6,7]. If charge transfer through these macromolecules is introduced, then charge moving through the macromolecular backbone can produce electromagnetic radiation, absorption, and resonance, with spectral characteristics corresponding to the energy distribution and charge velocity [1,2,3,13,14,15,16]. These wavelengths are found to correspond to electromagnetic radiation wavelengths in the range of far infra-red, infra-red, visible, and ultra-violet spectrum. The relationship between calculated RRM frequencies and corresponding electromagnetic radiation wavelengths has been empirically derived [1,2,3] as the following:
λ = K/frrm
where λ is the wavelength of light radiation in nanometers (nm), which can influence particular biological process; frrm is the RRM numerical frequency; and K is the coefficient that is obtained empirically to be K = 201 [1,2,3,4,5,6,7].
This concept has been further experimentally tested on electromagnetic frequencies activating l-lactate dehydrogenase [17], photon emission from dying melanoma cells [18], photon emission from lethal and non-lethal Ebola strains [19], JAK-STAT signaling pathway [20], as well as more recently on osteoblastic differentiation of stem cells by photo biomodulation [21]. Even more, the RRM model, for the first time, explains how and why external blue light can be used in treatment of Crigler–Najjar syndrome [16]. This means that, by radiating the whole body with specific RRM frequency, the desired health and medical effects can be achieved.
Keeping all this in mind, we propose that the RRM concept is an excellent predictor for proteins and DNA-selective interactions, biological processes, and pathways in living cells. In our previous work, we calculated a large number of specific frequencies for different protein and DNA biological functions and interactions, as presented in Figure 1.
Once the characteristic frequency for biological function of the protein is identified, it is possible to design de novo proteins with desired frequency components and subsequently with desired biological functions [1,2,3,6]. The design of bioactive peptides using the RRM concept has been already successfully experimentally tested in the design of FGF analogue [1,2,3,4], HIV envelope protein analogue [1,2,3,22,23,24], IL-12 analogue [25], and peptide to mimic Myxoma virus oncolytic function [26,27].
When the characteristic frequency of protein–protein receptor interaction is identified, it is possible to interfere in a desired manner with this interaction, either by designing peptides using this characteristic frequency or by directly applying electromagnetic radiation of identified frequency. Such interference can achieve certain desired medical or health effects.
The RRM concept has been already extensively published [1,2,3,4,5,6,7,13,14,15,16,21] and is presented in detail within the Supplementary Material.

2.2. Materials—Protein Sequences Analyzed by RRM

The following protein sequences from the UniProt database have been analyzed using the RRM:

2.2.1. Twenty Leptin Proteins:

>sp|P41160|LEP_MOUSE Leptin OS=Mus musculus GN=Lep PE=1 SV=1
>sp|P50596|LEP_RAT Leptin OS=Rattus norvegicus GN=Lep PE=1 SV=1
>sp|P41159|LEP_HUMAN Leptin OS=Homo sapiens GN=LEP PE=1 SV=1
>sp|Q29406|LEP_PIG Leptin OS=Sus scrofa GN=LEP PE=2 SV=1
>sp|Q9N2C1|LEP_FELCA Leptin OS=Felis catus GN=LEP PE=2 SV=1
>sp|P50595|LEP_BOVIN Leptin OS=Bos taurus GN=LEP PE=2 SV=1
>sp|O02720|LEP_CANLF Leptin OS=Canis lupus familiaris GN=LEP PE=2 SV=2
>sp|Q28504|LEP_MACMU Leptin OS=Macaca mulatta GN=LEP PE=2 SV=1
>sp|O02750|LEP_PANTR Leptin OS=Pan troglodytes GN=LEP PE=2 SV=1
>sp|O42164|LEP_CHICK Leptin OS=Gallus gallus GN=LEP PE=2 SV=1
>sp|Q9TU09|LEP_HORSE Leptin (Fragment) OS=Equus caballus GN=LEP PE=2 SV=2
>sp|Q5J732|LEP_BUBBU Leptin OS=Bubalus bubalis GN=LEP PE=3 SV=1
>sp|Q257X2|LEP_CAPHI Leptin OS=Capra hircus GN=LEP PE=3 SV=1
>sp|Q1XG29|LEP_URSTH Leptin OS=Ursus thibetanus GN=LEP PE=2 SV=1
>sp|Q28603|LEP_SHEEP Leptin OS=Ovis aries GN=LEP PE=2 SV=2
>sp|Q706D0|LEP_HALGR Leptin OS=Halichoerus grypus GN=LEP PE=2 SV=1
>sp|Q706D1|LEP_PHOVI Leptin OS=Phoca vitulina GN=LEP PE=2 SV=1
>sp|Q9XSW9|LEP_SMICR Leptin OS=Sminthopsis crassicaudata GN=LEP PE=2 SV=1
>sp|Q95189|LEP_GORGO Leptin OS=Gorilla gorilla gorilla GN=LEP PE=3 SV=1
>sp|Q95234|LEP_PONPY Leptin OS=Pongo pygmaeus GN=LEP PE=3 SV=1

2.2.2. Five Leptin Receptor Proteins:

>sp|P48356|LEPR_MOUSE Leptin receptor OS=Mus musculus GN=Lepr PE=1 SV=1
>sp|P48357|LEPR_HUMAN Leptin receptor OS=Homo sapiens GN=LEPR PE=1 SV=2
>sp|Q62959|LEPR_RAT Leptin receptor OS=Rattus norvegicus GN=Lepr PE=1 SV=1
>sp|Q9MYL0|LEPR_MACMU Leptin receptor OS=Macaca mulatta GN=LEPR PE=2 SV=2
>sp|O02671|LEPR_PIG Leptin receptor OS=Sus scrofa GN=LEPR PE=2 SV=3

2.2.3. Five Neuropeptide Y Proteins:
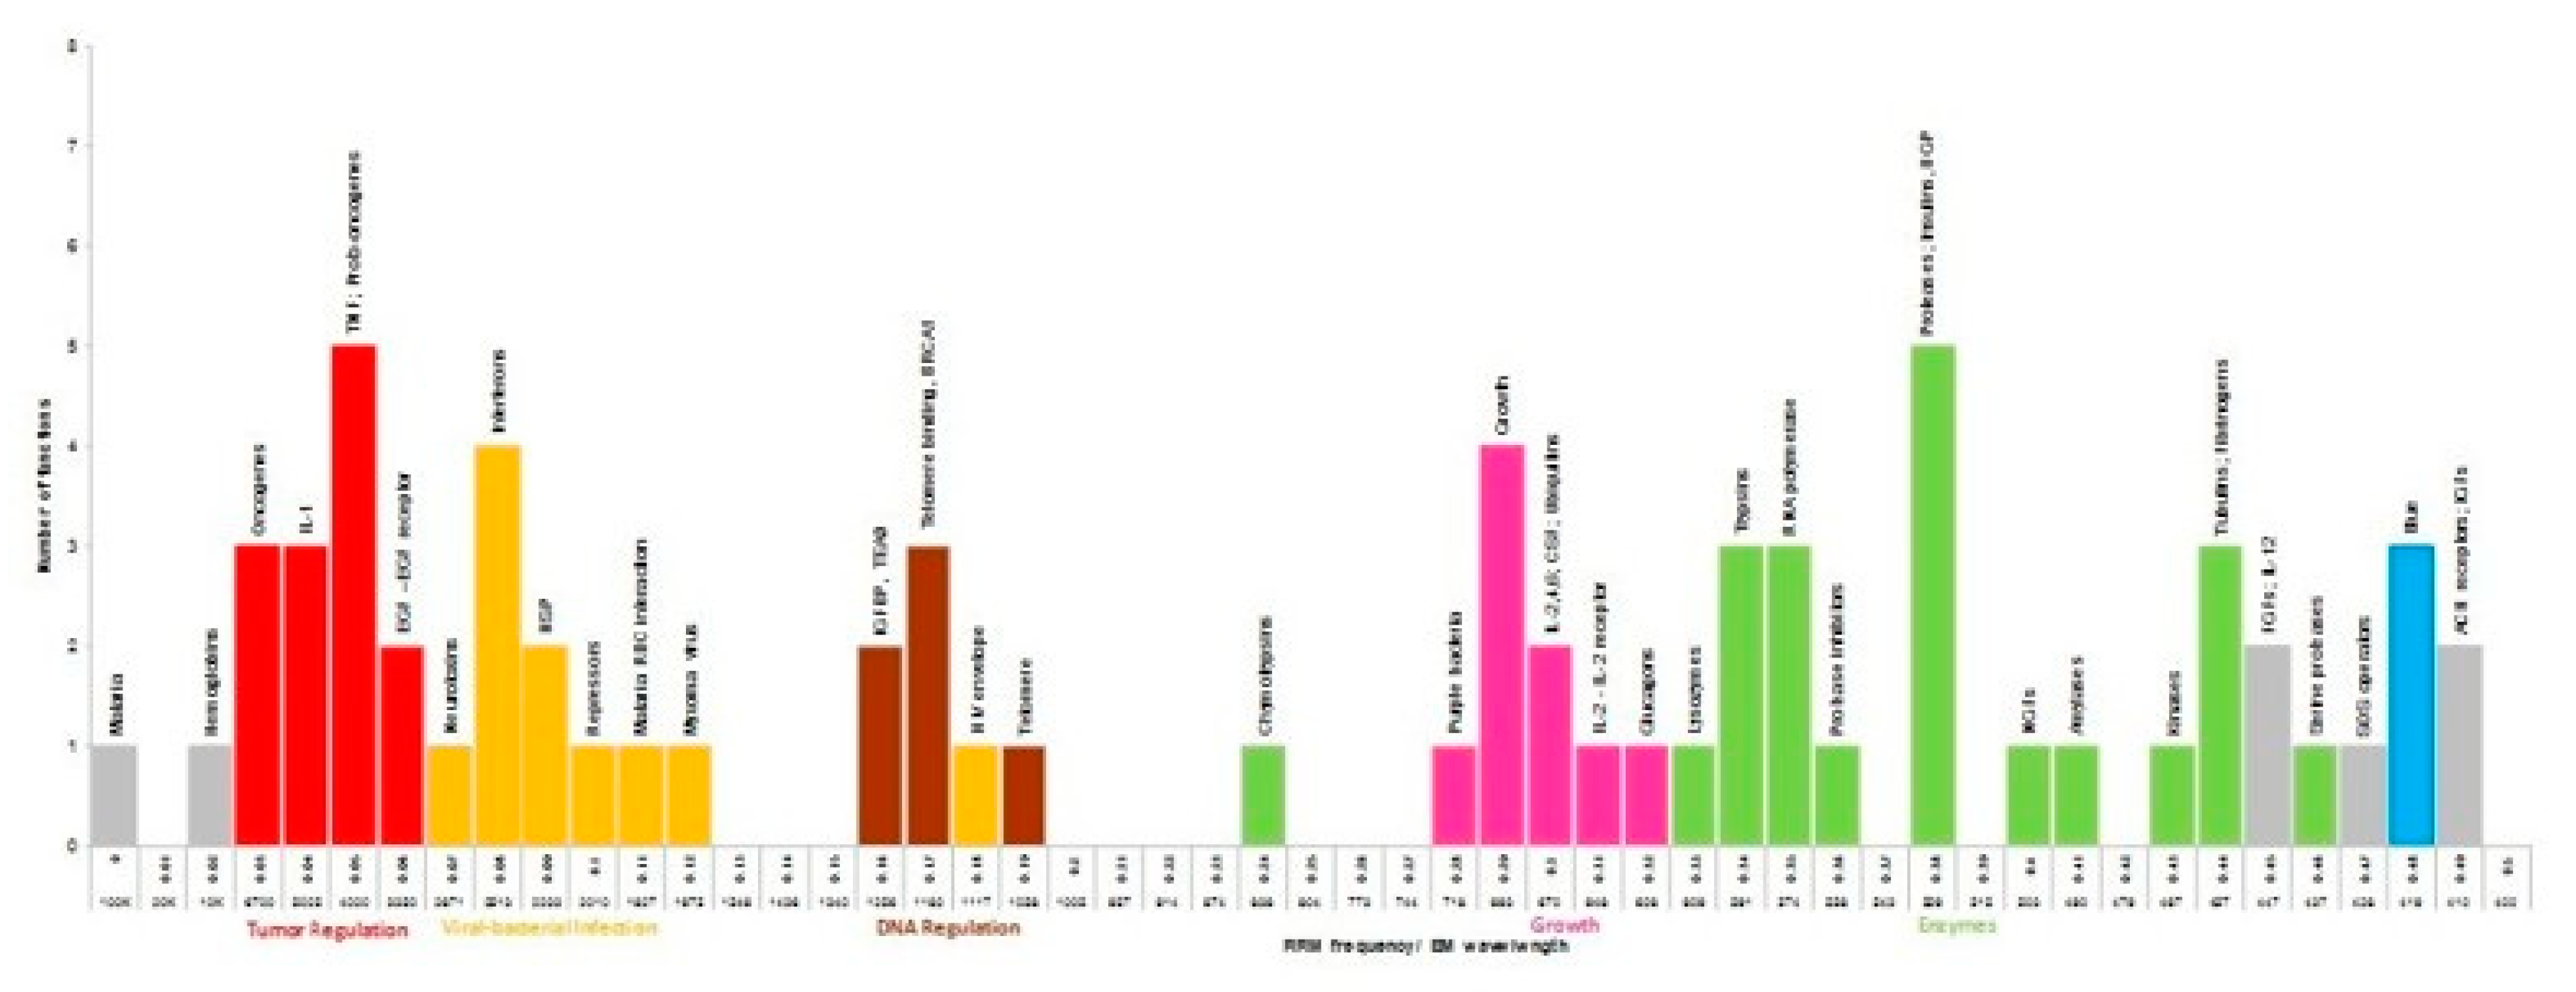
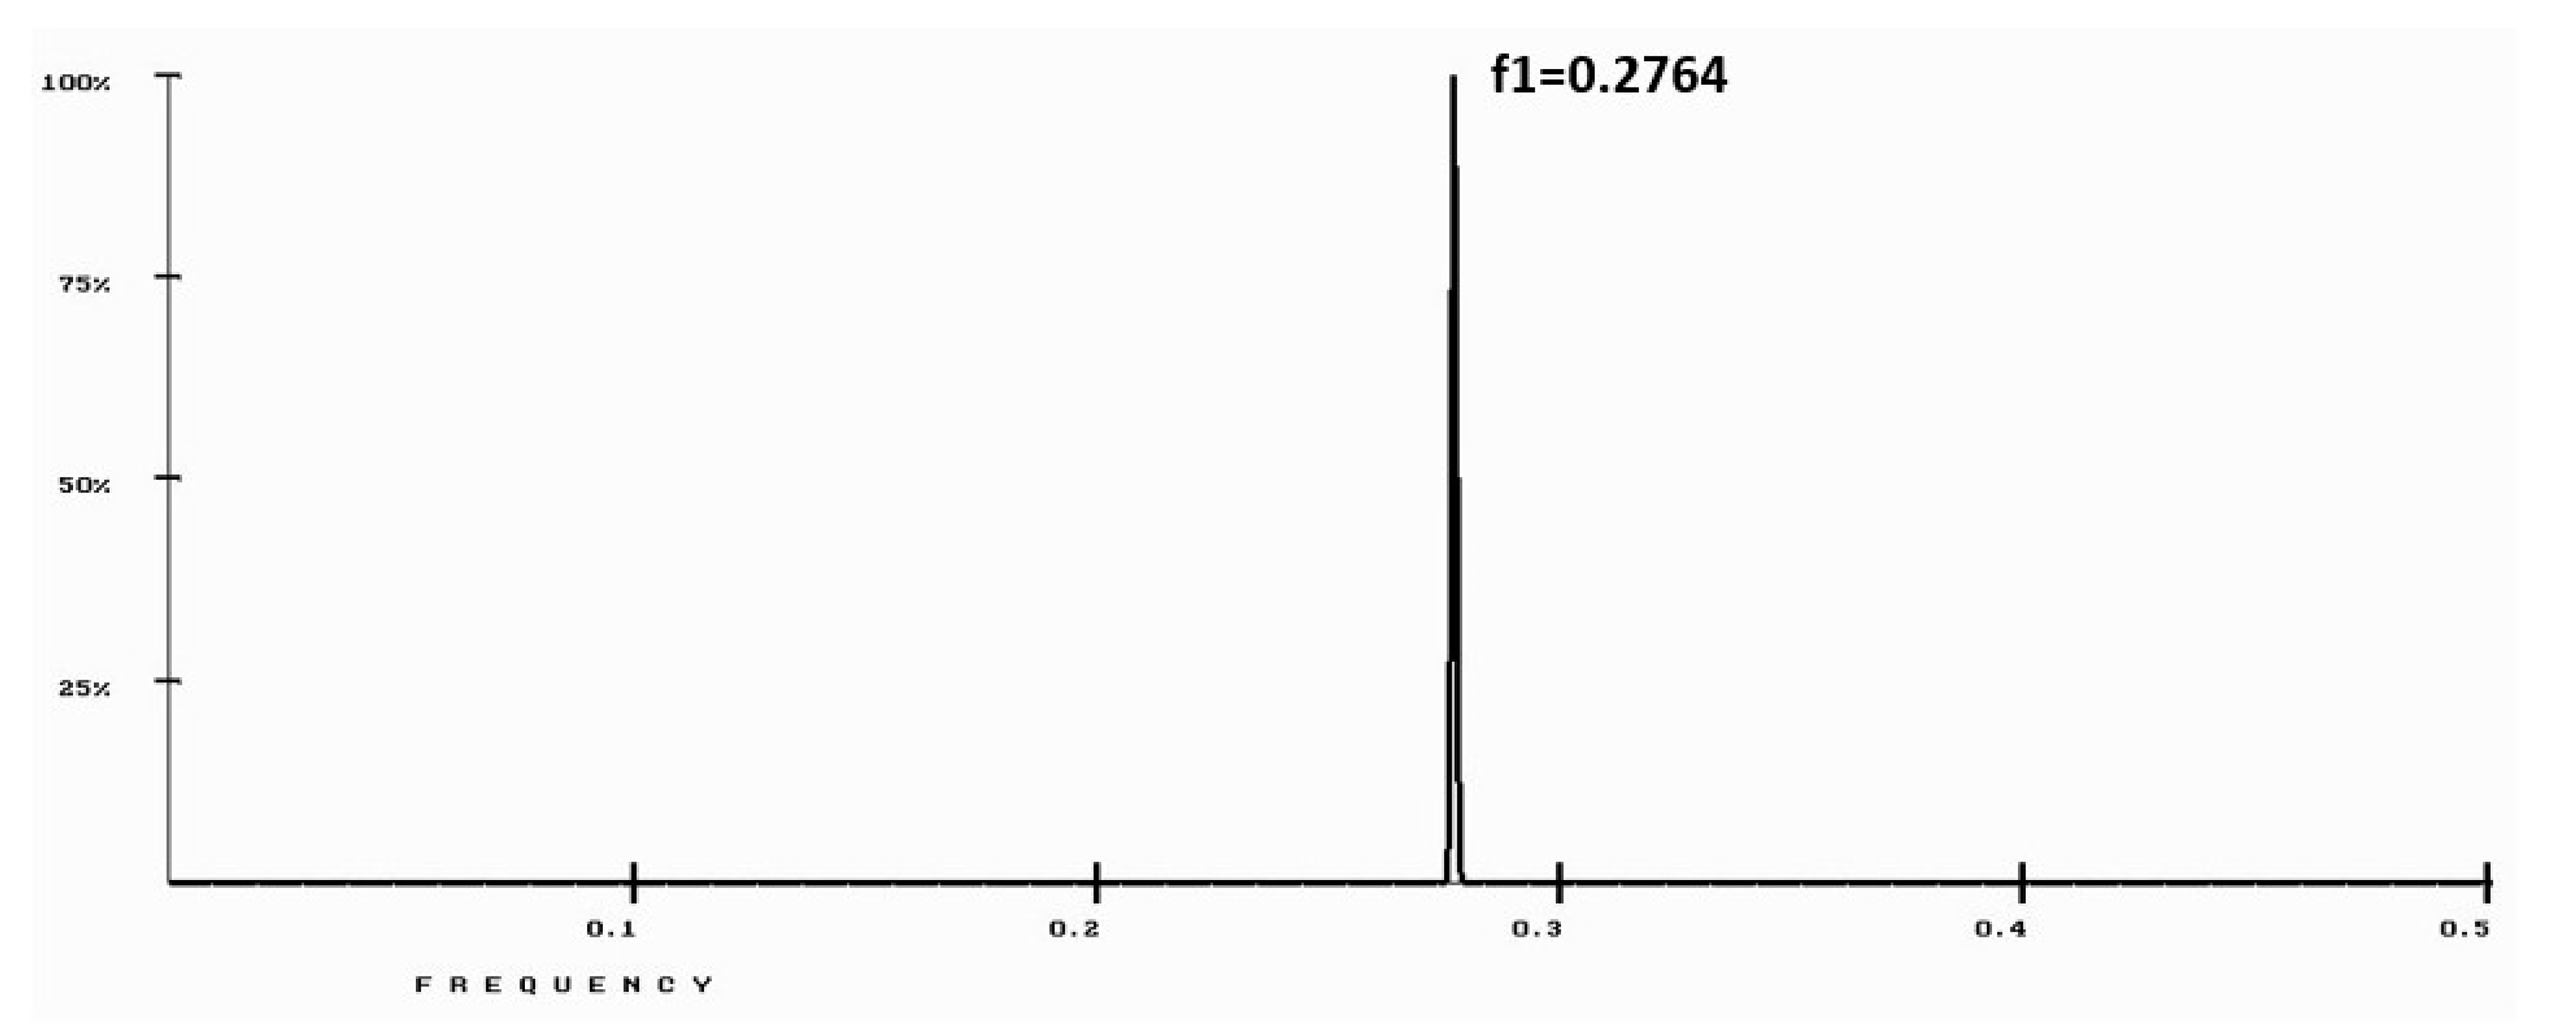
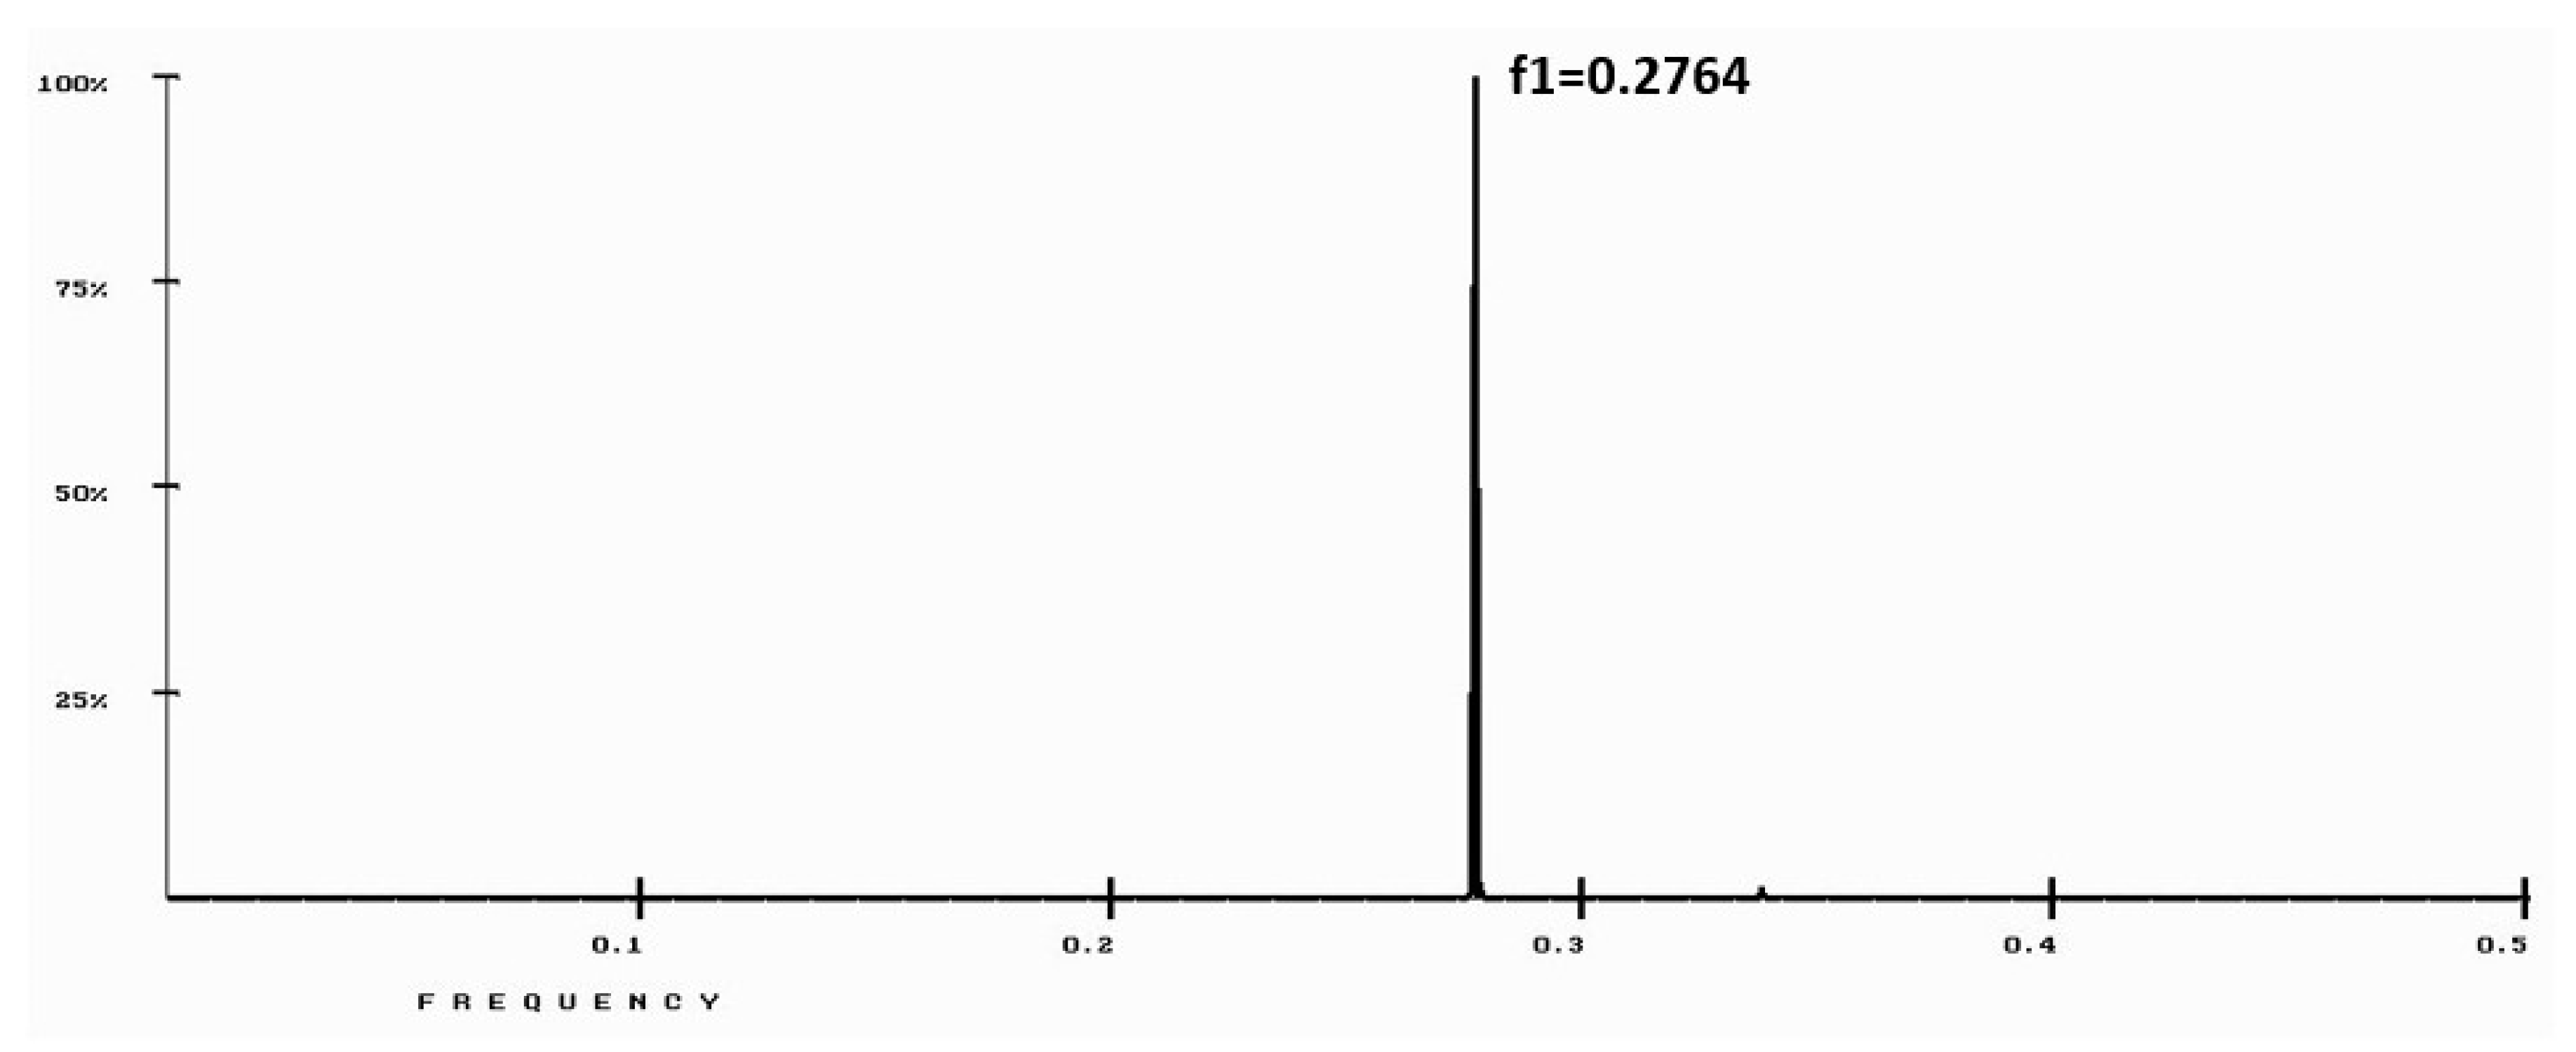
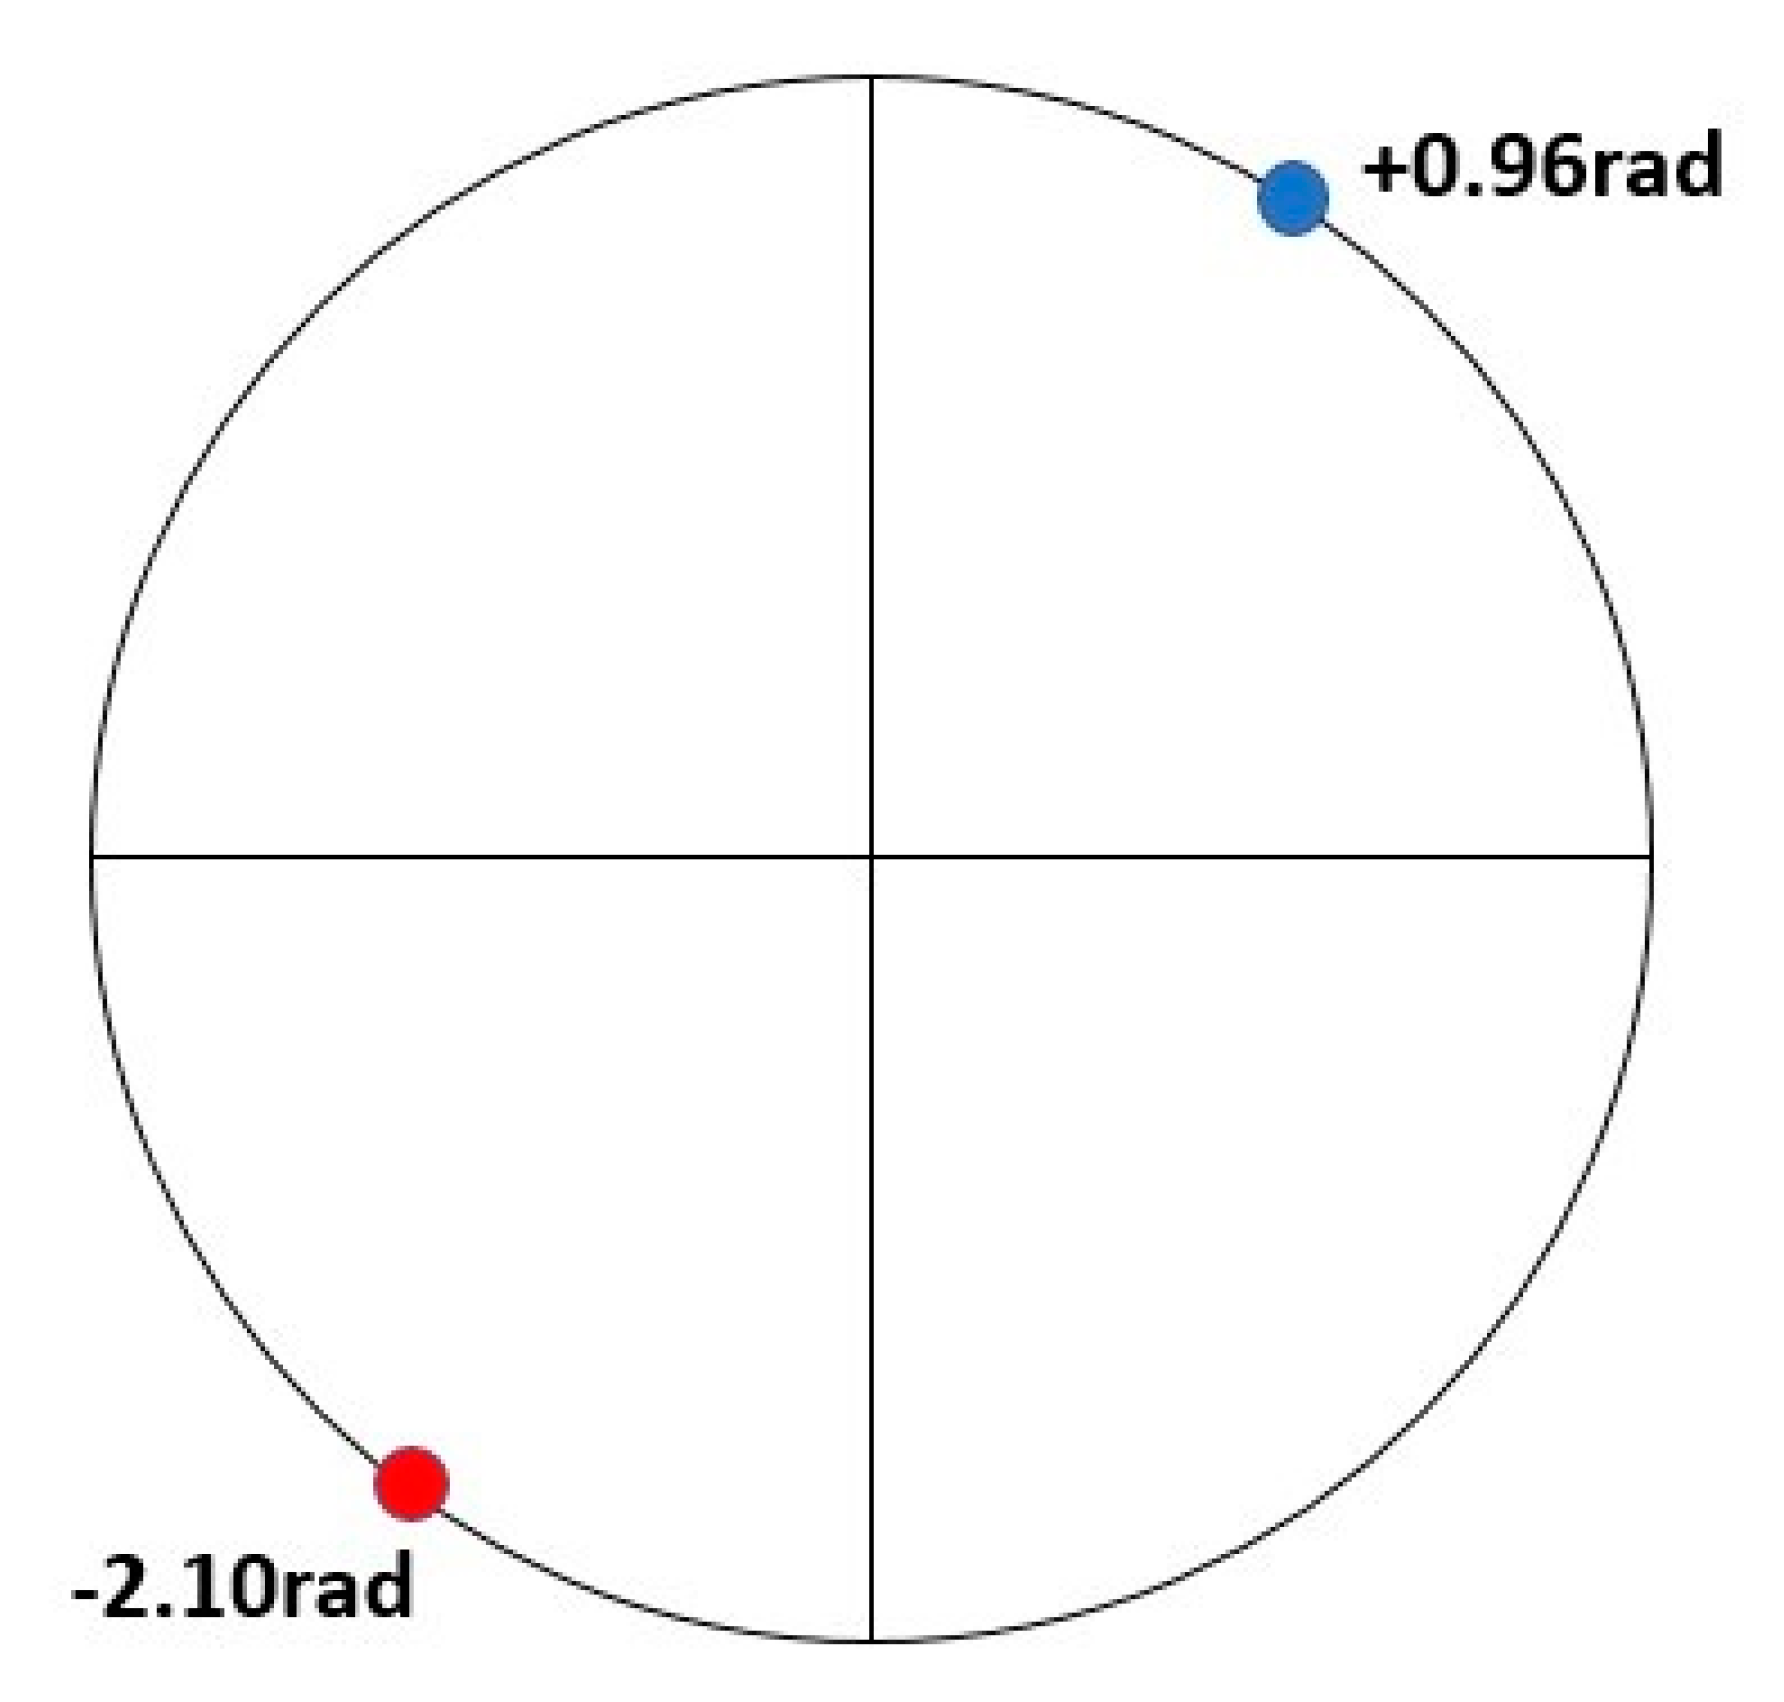
>sp|P01303|NPY_HUMAN Pro-neuropeptide Y OS=Homo sapiens GN=NPY PE=1 SV=1
>sp|P07808|NPY_RAT Pro-neuropeptide Y OS=Rattus norvegicus GN=Npy PE=1 SV=1
>sp|P57774|NPY_MOUSE Pro-neuropeptide Y OS=Mus musculus GN=Npy PE=1 SV=2
>sp|P14765|NPY_SHEEP Pro-neuropeptide Y OS=Ovis aries GN=NPY PE=1 SV=2
>sp|Q6RUW3|NPY_BOVIN Pro-neuropeptide Y OS=Bos taurus GN=NPY PE=3 SV=1

3. Results

The analysis of specificity of protein-receptor interaction has been presented here with the example of interaction between leptin and leptin receptors. As mentioned above, leptin acts on leptin receptors in the hypothalamus to regulate appetite. In addition, leptin also binds neuropeptide Y in NPY neurons by decreasing the activity of these neurons, while leptin receptor activation inhibits neuropeptide Y. Here, we analyzed all three groups of proteins involved in the regulation of hunger: leptin, leptin receptor, and neuropeptide Y [10].
To find out the RRM characteristic frequency relevant to the activity of leptin proteins, i.e., regulation of hunger and energy balance, we initially compared leptin proteins from the UniProt database, as listed in the Materials section. The single common RRM frequency was found at f1 = 0.2764 ± 0.0103, as presented in Figure 2. According to the relationship between calculated RRM frequencies and corresponding electromagnetic radiation wavelengths, as described in the Methods section, frequency f1 represents an electromagnetic radiation wavelength of 727 nm, which is within the red-light spectrum.
To check if frequency f1 is characterized by recognition between leptins and leptin receptors, we compared, using the RRM model, leptins and leptin receptors from the UniProt database, as listed in the Materials section. The same common RRM frequency of f1 = 0.2764 ± 0.0103 (727 nm) was found, as presented in Figure 3. This result confirms indeed that frequency f1 is characterized by recognition between leptins and leptin receptors, and thus can be proposed to be crucial for control of hunger and energy balance.
As it has been shown that leptins and activated leptin receptors interact with neuropeptide Y [10], we compared, using the RRM model, leptins, leptin receptors, and neuropeptides Y from the UniProt database, as listed in the Materials section. The same characteristic RRM frequency of f1 = 0.2764 ± 0.0103 appeared to be common for all three groups of proteins, as presented in Figure 4. This result shows that the whole cascade of leptin-related interactions is characterized by only one RRM frequency of f1 = 0.2764 ± 0.0103 (727 nm), indicating that this frequency f1 is crucial for leptin-related hunger control and energy balance within the body.
For protein and receptor recognition, apart from common frequency, it is necessary that the phase at this frequency is opposite to that of the protein–receptor pair, as explained in the Methods section and presented in detail within the Supplementary Material. As an example, we analyzed here phases at RRM characteristic frequency f1 = 0.2764 ± 0.0103 for human leptin and human leptin receptors. It was found that, for human leptin at frequency f1, the phase was +0.96 rad, while, for the same frequency f1, the phase for human leptin receptor was −2.10 rad, as presented in Figure 5 within the phase circle. This means that the phase difference between human leptin and leptin receptor is 3.06 rad, which is very close to 3.14 rad, supporting again the RRM approach that protein and protein receptors should have opposite phases at RRM frequency characterizing their recognition and interaction.
According to all the results above, it can be concluded that RRM frequency f1 = 0.2764 ± 0.0103 (727 nm) characterizes the leptin interaction cascade and thus is crucial for hunger control and energy balance within the body. In addition, the frequency f1 has been compared against the large number of previously obtained RRM frequencies and their super families, as presented in Figure 1. It can be observed that frequency f1 is within the range of general growth activity, which is expectable for a frequency that characterizes food intake and energy balance.
Having all these results in mind, it would be possible to design de novo peptides, which would have only the characteristic frequency with required phases. These peptides are expected to have biological function within the cascade of leptin activity.

4. Discussion

Obesity and overweight are becoming more prevalent problems in modern society, which are related to an increase in various diseases and health conditions, particularly cardiovascular diseases, type 2 diabetes and possibly many others. Obesity is most commonly caused by a combination of inappropriate nutrition, lack of physical activity, and genetical predisposition. Although there are some dietary and exercise approaches to obesity, there is a steel need to find more efficient and easier ways to combat this problem. One of the possible approaches to solve obesity problem is to achieve control of hunger and subsequently control food intake. This can be achieved by controlling leptin activity through the cascade of its interactions with related targets, which is a crucial pathway in controlling hunger and energy balance within the body.
To introduce a novel approach to combat obesity, we utilized the RRM model, which is capable of analyzing protein–receptor interactions, and proposes that such interactions are based on resonant electromagnetic energy transfer. Here, we applied the RRM model to analyze leptins and related leptin receptors, as well as neuropeptides Y, which binds both to leptins and leptin receptors [3]. We found that common RRM frequency for leptin is at f1 = 0.2764 ± 0.0103 (727 nm), which is within the red-light spectrum. The same frequency f1 = 0.2764 ± 0.0103 (727 nm) is also common between leptins and leptin receptors, as well as their interactions with neuropeptides Y. So, we can propose that RRM frequency f1 = 0.2764 ± 0.0103 (727 nm) characterizes their mutual interactions. As leptin activity is crucial for control of hunger, leptin can be and is used to control appetite for overweight and obese individuals. If predicted RRM frequency f1 = 0.2764 ± 0.0103 (727 nm) characterizes leptin activity and interactions then, by exposing overweight and obese individuals to this specific red-light frequency radiation, may have the same effect of controlling the appetite as leptin does. If it is possible, it would be a much simpler and cheaper way for obesity treatment without using any chemicals and without side effects. On the other hand, as RRM characteristic frequency and related phases for leptin activity pathway have been already identified, it would be possible to design de novo bioactive peptides, which would mimic leptin related activity, and thus could control hunger and ultimately achieve energy balance within the body.

5. Conclusions

Our manuscript researched possible novel directions towards treatments of obesity by finding out indicators of leptin activity. These indicators have been identified by analyzing the specificity of leptin–leptin receptor interactions using the Resonant Recognition Model, which proposes that selective protein–protein receptor interaction is based on resonant energy transfer between interacting macromolecules. When an indicator characterizing leptin–leptin receptor interaction is identified as resonant electromagnetic radiation specific frequency, it is possible to radiate patients with this specific frequency to mimic leptin activity and subsequently control hunger and energy balance. The concept of mimicking protein activity by electromagnetic radiation of specific frequency has been already tested in the case of treatment of Crigler–Najjar syndrome by blue light, where certain frequencies of blue light can mimic the activity of healthy UDP protein [16].
In the case of obesity treatment, the calculated resonant electromagnetic radiation frequency of 727 nm, which is within red-light spectrum, is proposed here to be used to radiate patients. In future, to apply this idea to patients within clinical settings, it is necessary to identify appropriate sources of radiation and parameters of delivery.

Supplementary Materials

The following are available online at https://www.mdpi.com/2076-3417/9/23/5169/s1.

Author Contributions

Conceptualization, I.C. and V.P.; methodology, I.C. and D.C.; software, D.C.; resources, V.P.; writing—original draft preparation—review and editing, I.C., V.P., and D.C.

Funding

This research received no external funding.

Conflicts of Interest

The authors declare no conflicts of interest.

References

  1. Cosic, I. Macromolecular Bioactivity: Is it Resonant Interaction between Macromolecules? Theory and Applications. IEEE Trans Biomed. Eng. 1994, 41, 1101–1114. [Google Scholar] [CrossRef] [PubMed]
  2. Cosic, I. Virtual spectroscopy for fun and profit. Biotechnology 1995, 13, 236–238. [Google Scholar] [CrossRef] [PubMed]
  3. Cosic, I. The Resonant Recognition Model of Macromolecular Bioactivity: Theory and Applications; Birkhauser Verlag: Basel, Switzerland, 1997. [Google Scholar]
  4. Cosic, I.; Drummond, A.E.; Underwood, J.R.; Hearn, M.T.W. In vitro inhibition of the actions of basic FGF by novel 16 amino acid peptides. Mol. Cell. Biochem. 1994, 130, 1–9. [Google Scholar] [CrossRef] [PubMed]
  5. Cosic, I.; Cosic, D. Balancing insulin stability and activity—Rational approach. Med. Data 2014, 6, 7–10. [Google Scholar]
  6. Cosic, I.; Cosic, D.; Lazar, K. Analysis of Tumor Necrosis Factor Function Using the Resonant Recognition Model. Cell Biochem. Biophys. 2015. [Google Scholar] [CrossRef]
  7. Cosic, I.; Paspaliaris, V.; Cosic, D.; Kolios, G. Analysis of Interleukin-12 and Interleukin-23 Pathways to Distinguish between Immune Activation and Inflammation Functions. Med. Data 2019, 11, 7–14. [Google Scholar]
  8. Haslam, D.W.; James, W.P. Obesity. Lancet 2005, 366, 1197–1209. [Google Scholar] [CrossRef]
  9. Luppino, F.S.; de Wit, L.M.; Bouvy, P.F.; Stijnen, T.; Cuijpers, P.; Penninx, B.W.; Zitman, F.G. Overweight, obesity, and depression: A systematic review and meta-analysis of longitudinal studies. Arch. Gener. Psychiatry 2010, 67, 220–229. [Google Scholar] [CrossRef]
  10. Yazdi, F.T.; Clee, S.M.; Meyre, D. Obesity genetics in mouse and human: Back and forth, and back again. PeerJ 2015, 3, e856. [Google Scholar] [CrossRef]
  11. Brennan, A.M.; Mantzoros, C.S. Drug Insight: The Role of Leptin in Human Physiology and Pathophysiology—Emerging Clinical Applications. Nat. Clin. Pract. Endocrinol. Metab. 2006, 2, 318–327. [Google Scholar] [CrossRef]
  12. Baicy, K.; London, E.D.; Monterosso, J.; Wong, M.L.; Delibasi, T.; Sharma, A.; Licinio, J. Leptin Replacement Alters Brain Response to Food Cues in Genetically Leptin-Deficient Adults. Proc. Natl. Acad. Sci. USA 2007, 104, 18276–18279. [Google Scholar] [CrossRef] [PubMed]
  13. Cosic, I.; Lazar, K.; Cosic, D. Prediction of Tubulin resonant frequencies using the Resonant Recognition Model (RRM). IEEE Trans. Nanobiosci. 2015, 12, 491–496. [Google Scholar] [CrossRef] [PubMed]
  14. Cosic, I.; Cosic, D.; Lazar, K. Is it possible to predict electromagnetic resonances in proteins, DNA and RNA? Nonlinear Biomed. Phys. 2015, 3. [Google Scholar] [CrossRef]
  15. Cosic, I.; Cosic, D.; Lazar, K. Environmental Light and Its Relationship with Electromagnetic Resonances of Biomolecular Interactions, as Predicted by the Resonant Recognition Model. Int. J. Environ. Res. Public Health 2016, 13, 647. [Google Scholar] [CrossRef] [PubMed]
  16. Cosic, I.; Cosic, D. The Treatment of Crigler-Najjar Syndrome by Blue Light as Explained by Resonant Recognition Model. EPJ Nonlinear Biomed. Phys. 2016, 4. [Google Scholar] [CrossRef]
  17. Vojisavljevic, V.; Pirogova, E.; Cosic, I. The Effect of Electromagnetic Radiation (550nm-850nm) on I-Lactate Dehydrogenase Kinetics. Int. J. Radiat. Biol. 2007, 83, 221–230. [Google Scholar] [CrossRef]
  18. Dotta, B.T.; Murugan, N.J.; Karbowski, L.M.; Lafrenie, R.M.; Persinger, M.A. Shifting wavelength of ultraweak photon emissions from dying melanoma cells: Their chemical enhancement and blocking are predicted by Cosic’s theory of resonant recognition model for macromolecules. Naturwissenschaften 2014, 101. [Google Scholar] [CrossRef]
  19. Murugan, N.J.; Karbowski, L.M.; Persinger, M.A. Cosic’s Resonance Recognition Model for Protein Sequences and Photon Emission Differentiates Lethal and Non-Lethal Ebola Strains: Implications for Treatment. Open J. Biophys. 2014, 5, 35. [Google Scholar] [CrossRef]
  20. Karbowski, L.M.; Murugan, N.J.; Persinger, M.A. Novel Cosic resonance (standing wave) solutions for components of the JAK-STAT cellular signalling pathway: A convergence of spectral density profiles. FEBS Open Bio 2015, 5, 245–250. [Google Scholar] [CrossRef]
  21. Cosic, I.; Paspaliaris, V.; Cosic, D. Explanation of Osteoblastic Differentiation of Stem Cells by Photo Biomodulation Using the Resonant Recognition Model. Appl. Sci. 2019, 9, 1979. [Google Scholar] [CrossRef]
  22. Krsmanovic, V.; Biquard, J.M.; Sikorska-Walker, M.; Cosic, I.; Desgranges, C.; Trabaud, M.A.; Whitfield, J.F.; Durkin, J.P.; Achour, A.; Hearn, M.T. Investigation Into the Cross-reactivity of Rabbit Antibodies Raised against Nonhomologous Pairs of Synthetic Peptides Derived from HIV-1 gp120 proteins. J. Peptide Res. 1998, 52, 410–412. [Google Scholar] [CrossRef] [PubMed]
  23. Hearn, M.T.W.; Biquard, J.M.; Cosic, I.; Krsmanovic, V. Peptides Immunologically related to proteins expressed by a viral agent, having a sequence of amino acids ordered by means of protein informational method. US Patent 6,294,174, 2001. [Google Scholar]
  24. Achour, A.; Biquard, J.M.; Krsmanovic, V.; M’Bika, J.P.; Ficheux, D.; Sikorska, M.; Cozzone, A.J. Induction of Human Immunodeficiency Virus (HIV-1) Envelope Specific Cell-Mediated Immunity by a Non-Homologus Synthetic Peptide. PLoS ONE 2007, 11, 1–12. [Google Scholar] [CrossRef]
  25. Pirogova, E.; Istivan, T.; Gan, E.; Cosic, I. Advances in Methods for Therapeutic Peptide Discovery, Design and Development. Curr. Pharm. Biotechnol. 2011, 12, 1117–1127. [Google Scholar] [CrossRef]
  26. Almansour, N.; Pirogova, E.; Coloe, P.; Cosic, I.; Istivan, T. Investigation of cytotoxicity of negative control peptides versus bioactive peptides on skin cancer and normal cells: A comparative study. Future Med. Chem. 2012, 4, 1553–1565. [Google Scholar] [CrossRef]
  27. Istivan, T.; Pirogova, E.; Gan, E.; Almansour, N.; Coloe, P.; Cosic, I. Biological effects of a De Novo designed myxoma virus peptide analogue: Evaluation of cytotoxicity on tumor cells. PLoS ONE 2011, 6, 1–10. [Google Scholar] [CrossRef] [Green Version]
Figure 1. Number of functional groups within each Resonant Recognition Model (RRM) frequency range of 0.01. X-axis represents RRM frequency in steps of 0.01, as well as corresponding electromagnetic frequency in nm. Y-axis represents the number of functional groups. Names of functional groups are written on the top of each bar. Functional super families are differently colored and labelled below the X-axis.
Applsci 09 05169 g001
Figure 2. RRM cross-spectrum of twenty leptins. The common characteristic frequency is at f1 = 0.2764 ± 0.0103, which represents an electromagnetic radiation wavelength of 727 nm. X-axis represents numerical RRM frequency, which could reach a maximum of 0.5, and Y-axis represents percentages of maximum peak, which could reach a maximum of 100%.
Applsci 09 05169 g002
Figure 3. RRM cross-spectrum of twenty leptins and five leptin receptors. The common characteristic frequency for these proteins is at f1 = 0.2764 ± 0.0103, which represents an electromagnetic radiation wavelength of 727 nm. X-axis represents numerical RRM frequency, which could reach a maximum of 0.5, and Y-axis represents percentages of maximum peak, which could reach a maximum of 100%.
Applsci 09 05169 g003
Figure 4. RRM cross-spectrum of twenty leptins, five leptin receptors, and five neuropeptides Y. The common characteristic frequency for these proteins is at f1 = 0.2764 ± 0.0103, which represents an electromagnetic radiation wavelength of 727 nm. X-axis represents numerical RRM frequency, which could reach a maximum of 0.5, and Y-axis represents percentages of maximum peak, which could reach a maximum of 100%.
Applsci 09 05169 g004
Figure 5. Phase circles at RRM frequency f1 = 0.2764 ± 0.0103 (727 nm) for human leptin protein (+0.96 rad) in blue and human leptin receptor protein (−2.10 rad) in red. It can be easily observed that these phases are opposite to each other, supporting the RRM approach that protein and protein receptors should have opposite phases at RRM frequency characterizing their recognition and interaction.
Applsci 09 05169 g005

