Article

Effect of Chromatographic Conditions on Supercoiled Plasmid DNA Stability and Bioactivity

1
CICS-UBI—Health Sciences Research Centre, University of Beira Interior, 6201-506 Covilhã, Portugal
2
CDRSP—Centre for Rapid and Sustainable Product Development, Polytechnic Institute of Leiria, 2430-028 Marinha Grande, Portugal
3
CICECO—Aveiro Institute of Materials, Chemistry Department, University of Aveiro, 3810-193 Aveiro, Portugal
*
Author to whom correspondence should be addressed.
Appl. Sci. 2019, 9(23), 5170; https://doi.org/10.3390/app9235170
Submission received: 17 October 2019 / Revised: 20 November 2019 / Accepted: 24 November 2019 / Published: 28 November 2019
(This article belongs to the Section Applied Biosciences and Bioengineering)

Abstract

:
The dysfunction of the tumor suppressor gene TP53 has been associated with the pathogenesis of the majority of the cases of cancer reported to date, leading the cell to acquire different features known as the cancer hallmarks. In normal situations, the protein p53 protects the cells against tumorigenesis. By detecting metabolic stress or DNA damage in response to stress, p53 can lead the cell to senescence, autophagy, cell cycle arrest, DNA repair, and apoptosis. Thus, in the case of p53 mutations, it is reasonable to assume that the reestablishment of its function, may restrain the proliferation of cancer cells. The concept of cancer gene therapy can be based on this assumption, and suitable biotechnological approaches must be explored to assure the preparation of gene-based biopharmaceuticals. Although numerous procedures have already been established to purify supercoiled plasmid DNA (sc pDNA), the therapeutic application is highly dependent on the biopharmaceutical’s activity, which can be affected by the chromatographic conditions used. Thus, the present work aims at comparing quality and in vitro activity of the supercoiled (sc) isoform of the p53 encoding plasmid purified by three different amino acids-based chromatographic strategies, involving histidine–agarose, arginine–macroporous, and histidine–monolith supports. The B-DNA topology was maintained in all purified pDNA samples, but their bioactivity, related to the induction of protein p53 expression and apoptosis in cancer cells, was higher with arginine–macroporous support, followed by histidine–monolith and histidine–agarose. Despite the purity degree of 92% and recovery yield of 43% obtained with arginine–macroporous, the sc pDNA sample led to a higher expression level of the therapeutic p53 protein (58%) and, consequently, induced a slightly higher apoptotic effect (27%) compared with sc pDNA samples obtained with histidine–monolithic support (26%) and histidine–agarose support (24%). This behavior can be related to the mild chromatographic conditions used with arginine–macroporous support, which includes the use of low salt concentrations, at neutral pH and lower temperatures, when compared to the high ionic strength of ammonium sulfate and acidic pH used with histidine-based supports. These results can contribute to field of biopharmaceutical preparation, emphasizing the need to control several experimental conditions while adapting and selecting the methodologies that enable the use of milder conditions as this can have a significant impact on pDNA stability and biological activity.

Graphical Abstract

1. Introduction

Up to date more than 200 types of cancer have been described and characterized, and in all these cases, changes in the genome are involved, proving the complexity of this disease [1,2]. When some mutations occur and are accumulated, the tumorigenesis process can start, leading the cell to gain different characteristics, namely: self-sufficiency in growth signals, insensitivity to antigrowth signals, sustained angiogenesis, capacity of invasion and metastasis, limitless replicative potential, and evasion of programmed cell death (apoptosis) [2]. The DNA mutations can occur not only by abiotic factors, such as environment exposure, but also could happen due to biotic factors, such as DNA replication errors or virus infection [3]. Cells have tumor suppressor genes that are responsible for the inhibition of cell growth and/or induction of cellular apoptosis, which therefore prevent cancer development. Amongst all the tumor suppressor genes, one of the most important/relevant is p53. Different research studies have demonstrated that it is mutated or deleted in more than 50% of all human cancers [4,5]. In response to stress, p53 can induce cell senescence, autophagy, cell cycle arrest, DNA repair, and apoptosis [6]. Concerning this, the p53 gene has attracted much attention as a candidate for cancer gene therapy, since the replacement of the abnormal gene by the normal counterpart could restore the protective function of the cell guardian. The manufacturing process of therapeutic molecules to be used in gene therapy encompasses an initial upstream stage foreseeing the production of this biomolecule by bacterial fermentation and a downstream stage comprising the its recovery and purification, usually based on chromatography, aiming for the removal of host’s impurities, ensuring at the end of the process a high degree of purity of the purified supercoiled plasmid DNA (sc pDNA) according to some parameters established by regulatory agencies, such as the Food and Drug Administration (FDA) and the European Medicine Agency (EMA) [7,8]. Among these parameters are the product appearance (clear, colorless solution), the plasmid homogeneity (≥90% supercoiled (sc) pDNA) and impurities levels (RNA and proteins should be undetectable, the amount of genomic DNA (gDNA) must be lower than 0.01 µg/µg of pDNA and the level of endotoxins should not be higher than 0.1 EU/µg of pDNA) [9]. All these impurities are derived from bacteria host cells used in the biosynthesis of plasmids and share some physicochemical characteristics with the target molecule, namely negative charge and molecular weight, which may hinder the pDNA purification [2]. Each impurity can promote some adverse effects on human cells, for example, gDNA can integrate in the cell genome, suppressing genes or even activating oncogenes [10], while the silencing of some cellular products can occur by bacterium RNA pairing with the messenger RNA of transfected cells. Moreover, endotoxins exhibit pyrogenic activities and may promote irreversible septic shock [11], as bacterial proteins can trigger several immunological responses, even if they are present in small amounts [12]. The need to obtain the sc pDNA topology is also related to its effectiveness in cell transfection and product expression, in comparison to other isoforms (open circular (oc) and linear (ln)). To purify the target molecule, following all requirements of regulatory agencies, affinity chromatography has shown to be a useful tool, mainly because of its ability to promote multiple reversible and specific interactions between biomolecules and ligands [13]. However, the chromatographic conditions used to bind and elute the target molecule also can irreversibly influence the plasmid stability, reducing its bioactivity or even making the therapeutic gene function unfeasible. In this way, the importance of the salt effect (type and ionic strength applied) once it can induce changes in DNA conformation should be remarked upon. In fact, the literature reports that some kinds of salts are more effective than other in dehydrating the DNA by displacing water molecules from the hydration layer which can promote the binding or elution between of the target molecule and matrices [9]. Also, the pH of buffer used on the mobile phase also plays an important role and should be carefully adjusted in order to maintain the ideal ionization point, both in ligands and lysate molecules, for the successful separation by chromatography. The depurination is the main problem associated with this parameter, which may cause irreversible damage to DNA structure [9,14]. Finally, temperature can weaken or even disrupt the hydrogen bonds established between base pairs, also influencing the torsion of the pDNA molecule, mainly in the sc pDNA isoform [15]. Thus, the adjustment of all parameters can promote the best purification methodology, attaining high pharmaceutical purity and high recovery yield for the target molecule without compromising its bioactivity, which represents the major barrier to be overcome by the pharmaceutical industry. In this context, this research work is focused on the study of the effect of different chromatographic conditions (such as salt type and concentration, pH, and temperature) on the stability and bioactivity of the recovered sc p53 encoding plasmid. To achieve this goal, the effect of these parameters was evaluated on the samples purified by three different chromatographic supports, namely histidine–agarose (Figure 1A), arginine–macroporous (Figure 1B), and histidine–monolith (Figure 1C). Besides the quality assays used to check the purity degree of sc pDNA, the topology of supercoiled was also evaluated by circular dichroism, zeta potential of samples in the buffer was measured, and finally the bioactivity of the therapeutic molecule tells us about the most appropriate strategy used in this work, in the function of expression of p53 and apoptosis of cells.

2. Materials and Methods

2.1. Materials

The 6.07 kbp pcDNA3–FLAG–p53 plasmid was purchased from Addgene (Cambridge, MA, USA—plasmid 10838) [16]. The NZYtech Maxi Prep Kit was purchased from NZYTech (Lisbon, Portugal). L-histidine-agarose matrix was purchased from Sigma–Aldrich (St. Louis, MO, USA). CIMacTM L-histidine analytical column was kindly modified and provided by BIA Separations (Ajdovščina, Slovenia). Toyopearl® AF-Epoxy-650M was kindly provided by Tosoh Bioscience (Stuttgart, Germany). Sodium chloride (NaCl) was purchased to Sigma-Aldrich, ammonium sulphate [(NH4)2SO4] was purchased from VWR, tris(hydroxymethyl) aminomethane (Tris) was from Merck (Darmstadt, Germany). EDTA was purchased from VWR (Alfragide, Portugal). Binding and elution buffers were filtered through a 0.20 µm pore size membrane (Schleicher Schuell, Dasel, Germany) and degassed ultrasonically. HeLa cells were purchased from ATCC (Middlesex, UK), the transfection reagent Lipofectamine 2000® was obtained from Invitrogen (Carlsbad, CA, USA). p53 (human) ELISA kit was purchased from Enzo Life Sciences (Farmingdale, NY, USA). HT TiterTACSTM Assay Kit was purchased from Trevigen, Inc. (Gaithersburg, CA, USA). All the reagents used in bacterial growth were obtained from Sigma–Aldrich (St. Louis, MO, USA). All reagents used in this work were analytical grade and the buffers were freshly prepared with deionized ultrapure-grade water, purified with a Milli-Q system from Millipore (Billerica, MA, USA).

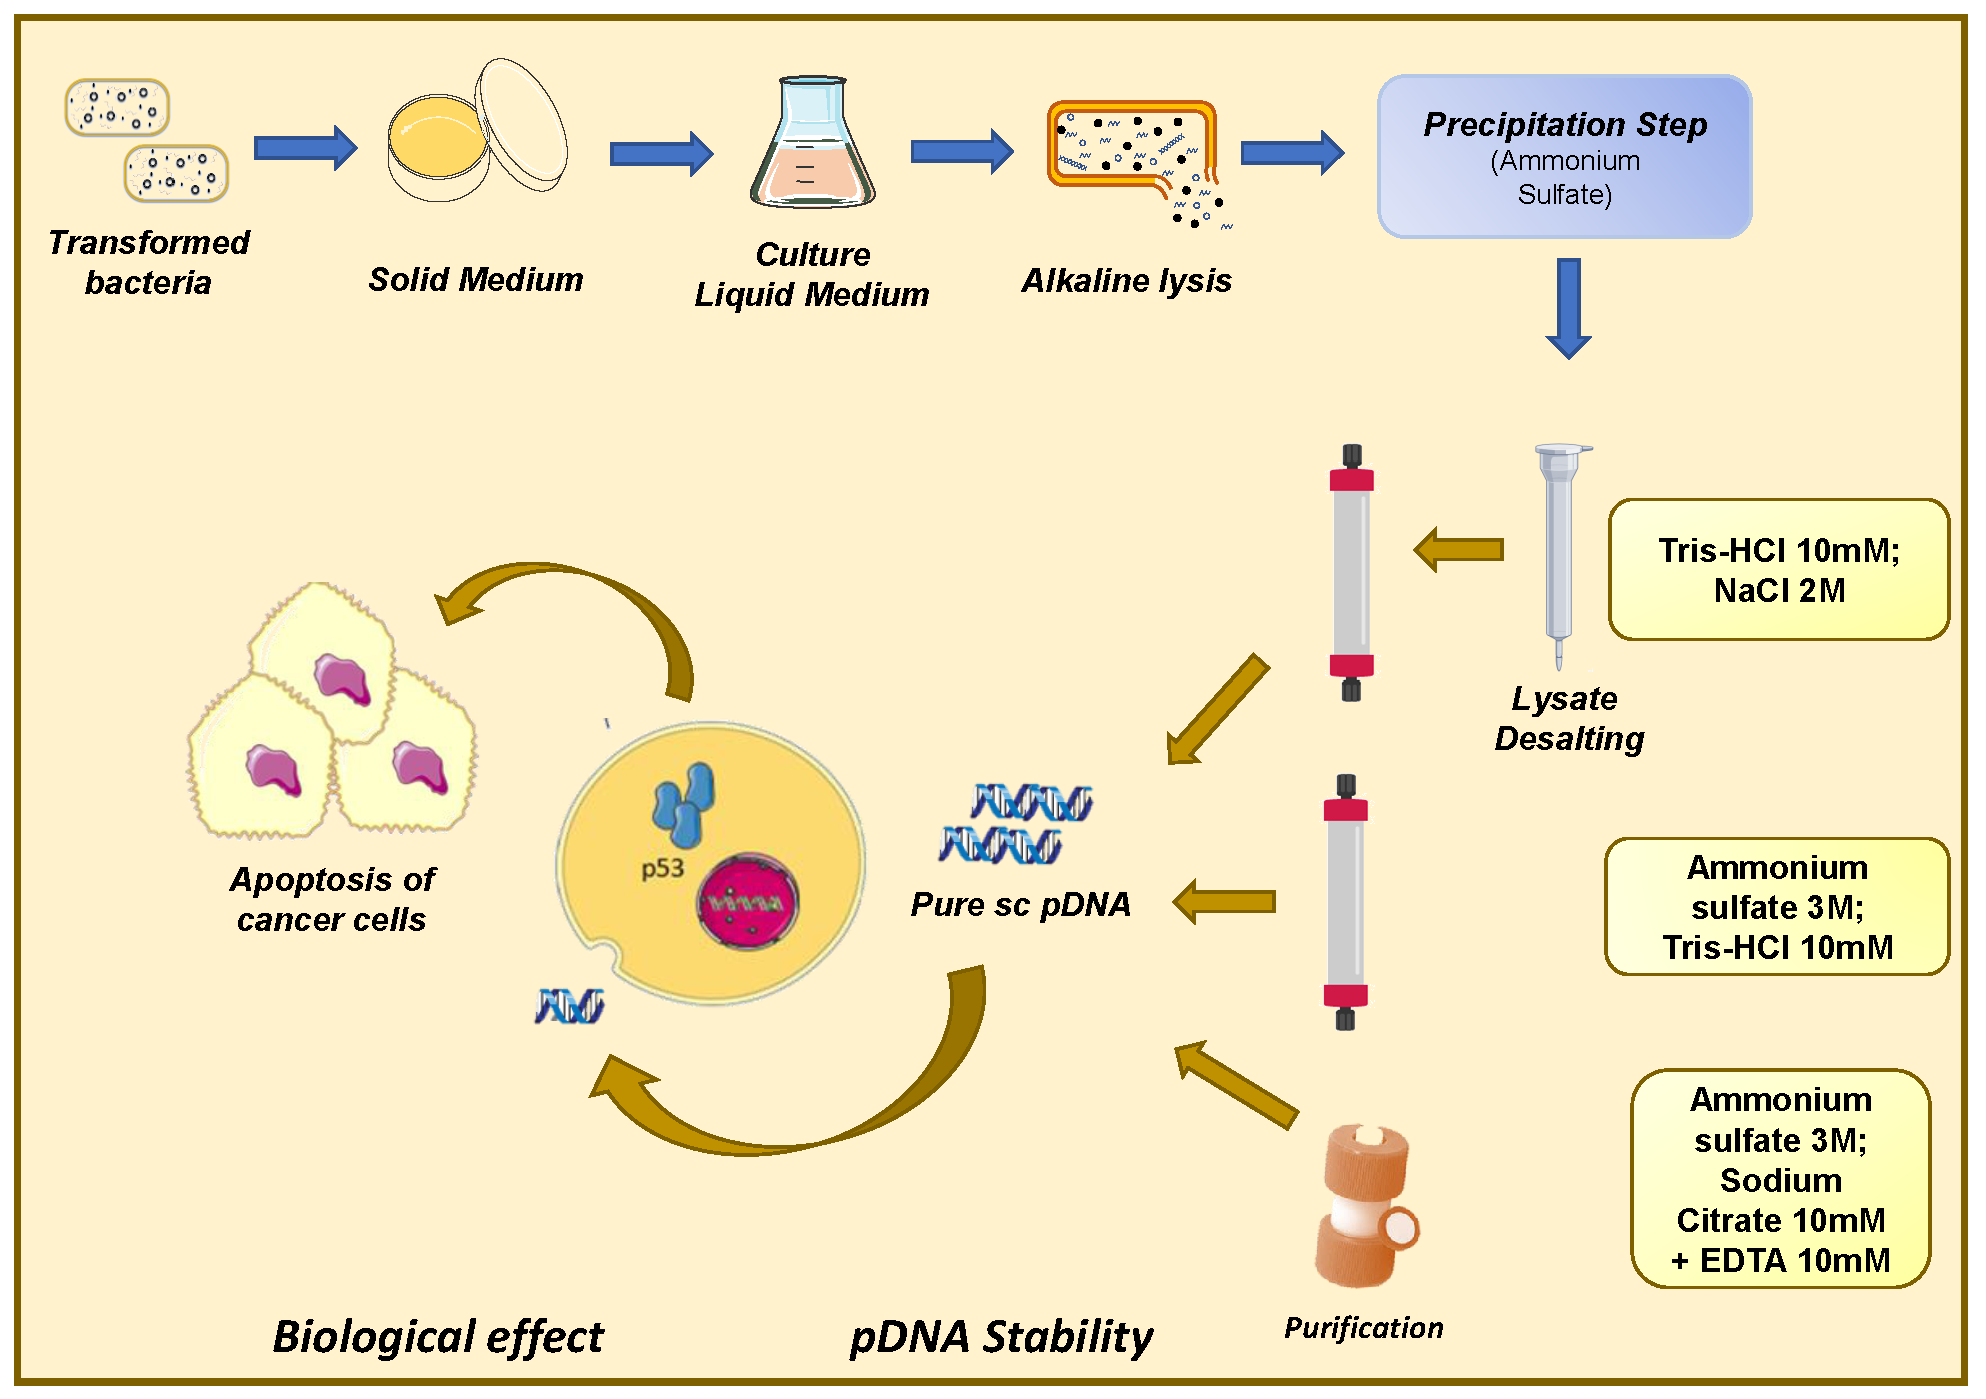
2.2. Plasmid Biosynthesis and Recovery

The 6.07 kbp plasmid pcDNA3-FLAG-p53 was amplified in a Escherichia coli (E. coli) DH5α cell culture at 37 °C in an Erlenmeyer flask with 250 mL of Terrific Broth medium (20 g/L of tryptone, 24 g/L of yeast extract, 4 mL/L of glycerol, 0.017 M KH2PO4, 0.072 M K2HPO4) supplemented with 30 μg/mL of ampicillin. The cells were grown until the late log phase (OD600 nm ± 9), and then were collected by centrifugation and stored at −20 °C. For the recovery of nucleic acids, cells were lysed using the modified alkaline lysis method [17,18]. Briefly, cell pellets were resuspended in 10 mL of solution I (50 mM glucose, 25 mM Tris–HCl and 10 mM ethylene–diamine tetra acetic acid (EDTA), pH 8.0). Alkaline lysis was performed by adding 10 mL of solution II (200 mM NaOH and 1% (w/v) sodium dodecyl sulphate). After 5 min of incubation at room temperature, cellular debris, gDNA, and proteins were precipitated by gently adding and mixing 10 mL of prechilled solution III (3 M potassium acetate, pH 5.0), followed by 20 min incubation on ice. Cellular debris was removed by centrifuging twice at 20,000 g for 30 min, at 4 °C. For the concentration and clarification [18], the pDNA in the supernatant was precipitated by adding 0.7% (v/v) of isopropanol and recovered by centrifugation at 15,000 g for 30 min at 4 °C. The pellets were then dissolved in 2 mL of 10 mM Tris–HCl buffer, pH 8.0. In the next step, ammonium sulfate was dissolved in the pDNA solution up to a final concentration of 2.5 M. Following a 15 min incubation on ice, precipitated proteins and RNA were removed by centrifugation at 10,000 g for 20 min at 4 °C. To obtain the native pDNA (oc + sc) the NZYtech Maxi Prep Kit was used, according to the manufacturer’s instructions.

2.3. Preparative Chromatography

All chromatographic experiments were performed in an ÄKTA Pure system with UNICORNTM version 5.11 software (GE Healthcare Biosciences, Uppsala, Sweden) and absorbance was continuously monitored at 260 nm. The flow rate used was of 1 mL/min and the sample injection volume was of 100 µL in the case of arginine–macroporous support and histidine–monolith and of 200 µL in the case of histidine–agarose matrix. After chromatographic experiments, samples were desalted and concentrated with Vivaspin concentrators (Vivascience, Hanover, Germany) according to the manufacturer’s instructions. Moreover, 0.8% agarose gel electrophoresis (Hoefer, San Francisco, CA, USA), stained with GreenSafe Premium (0.01%) (NZYTech, Lisbon, Portugal), was performed to analyze the peak fractions recovered from the chromatographic experiments. Electrophoresis was carried out at 110 V with TAE buffer (40 mM Tris base, 20 mM acetic acid, and 1 mM EDTA, pH 8.0). The gel was visualized under UV light in a Vilber Lourmat system (ILC Lda, Lisbon, Portugal).

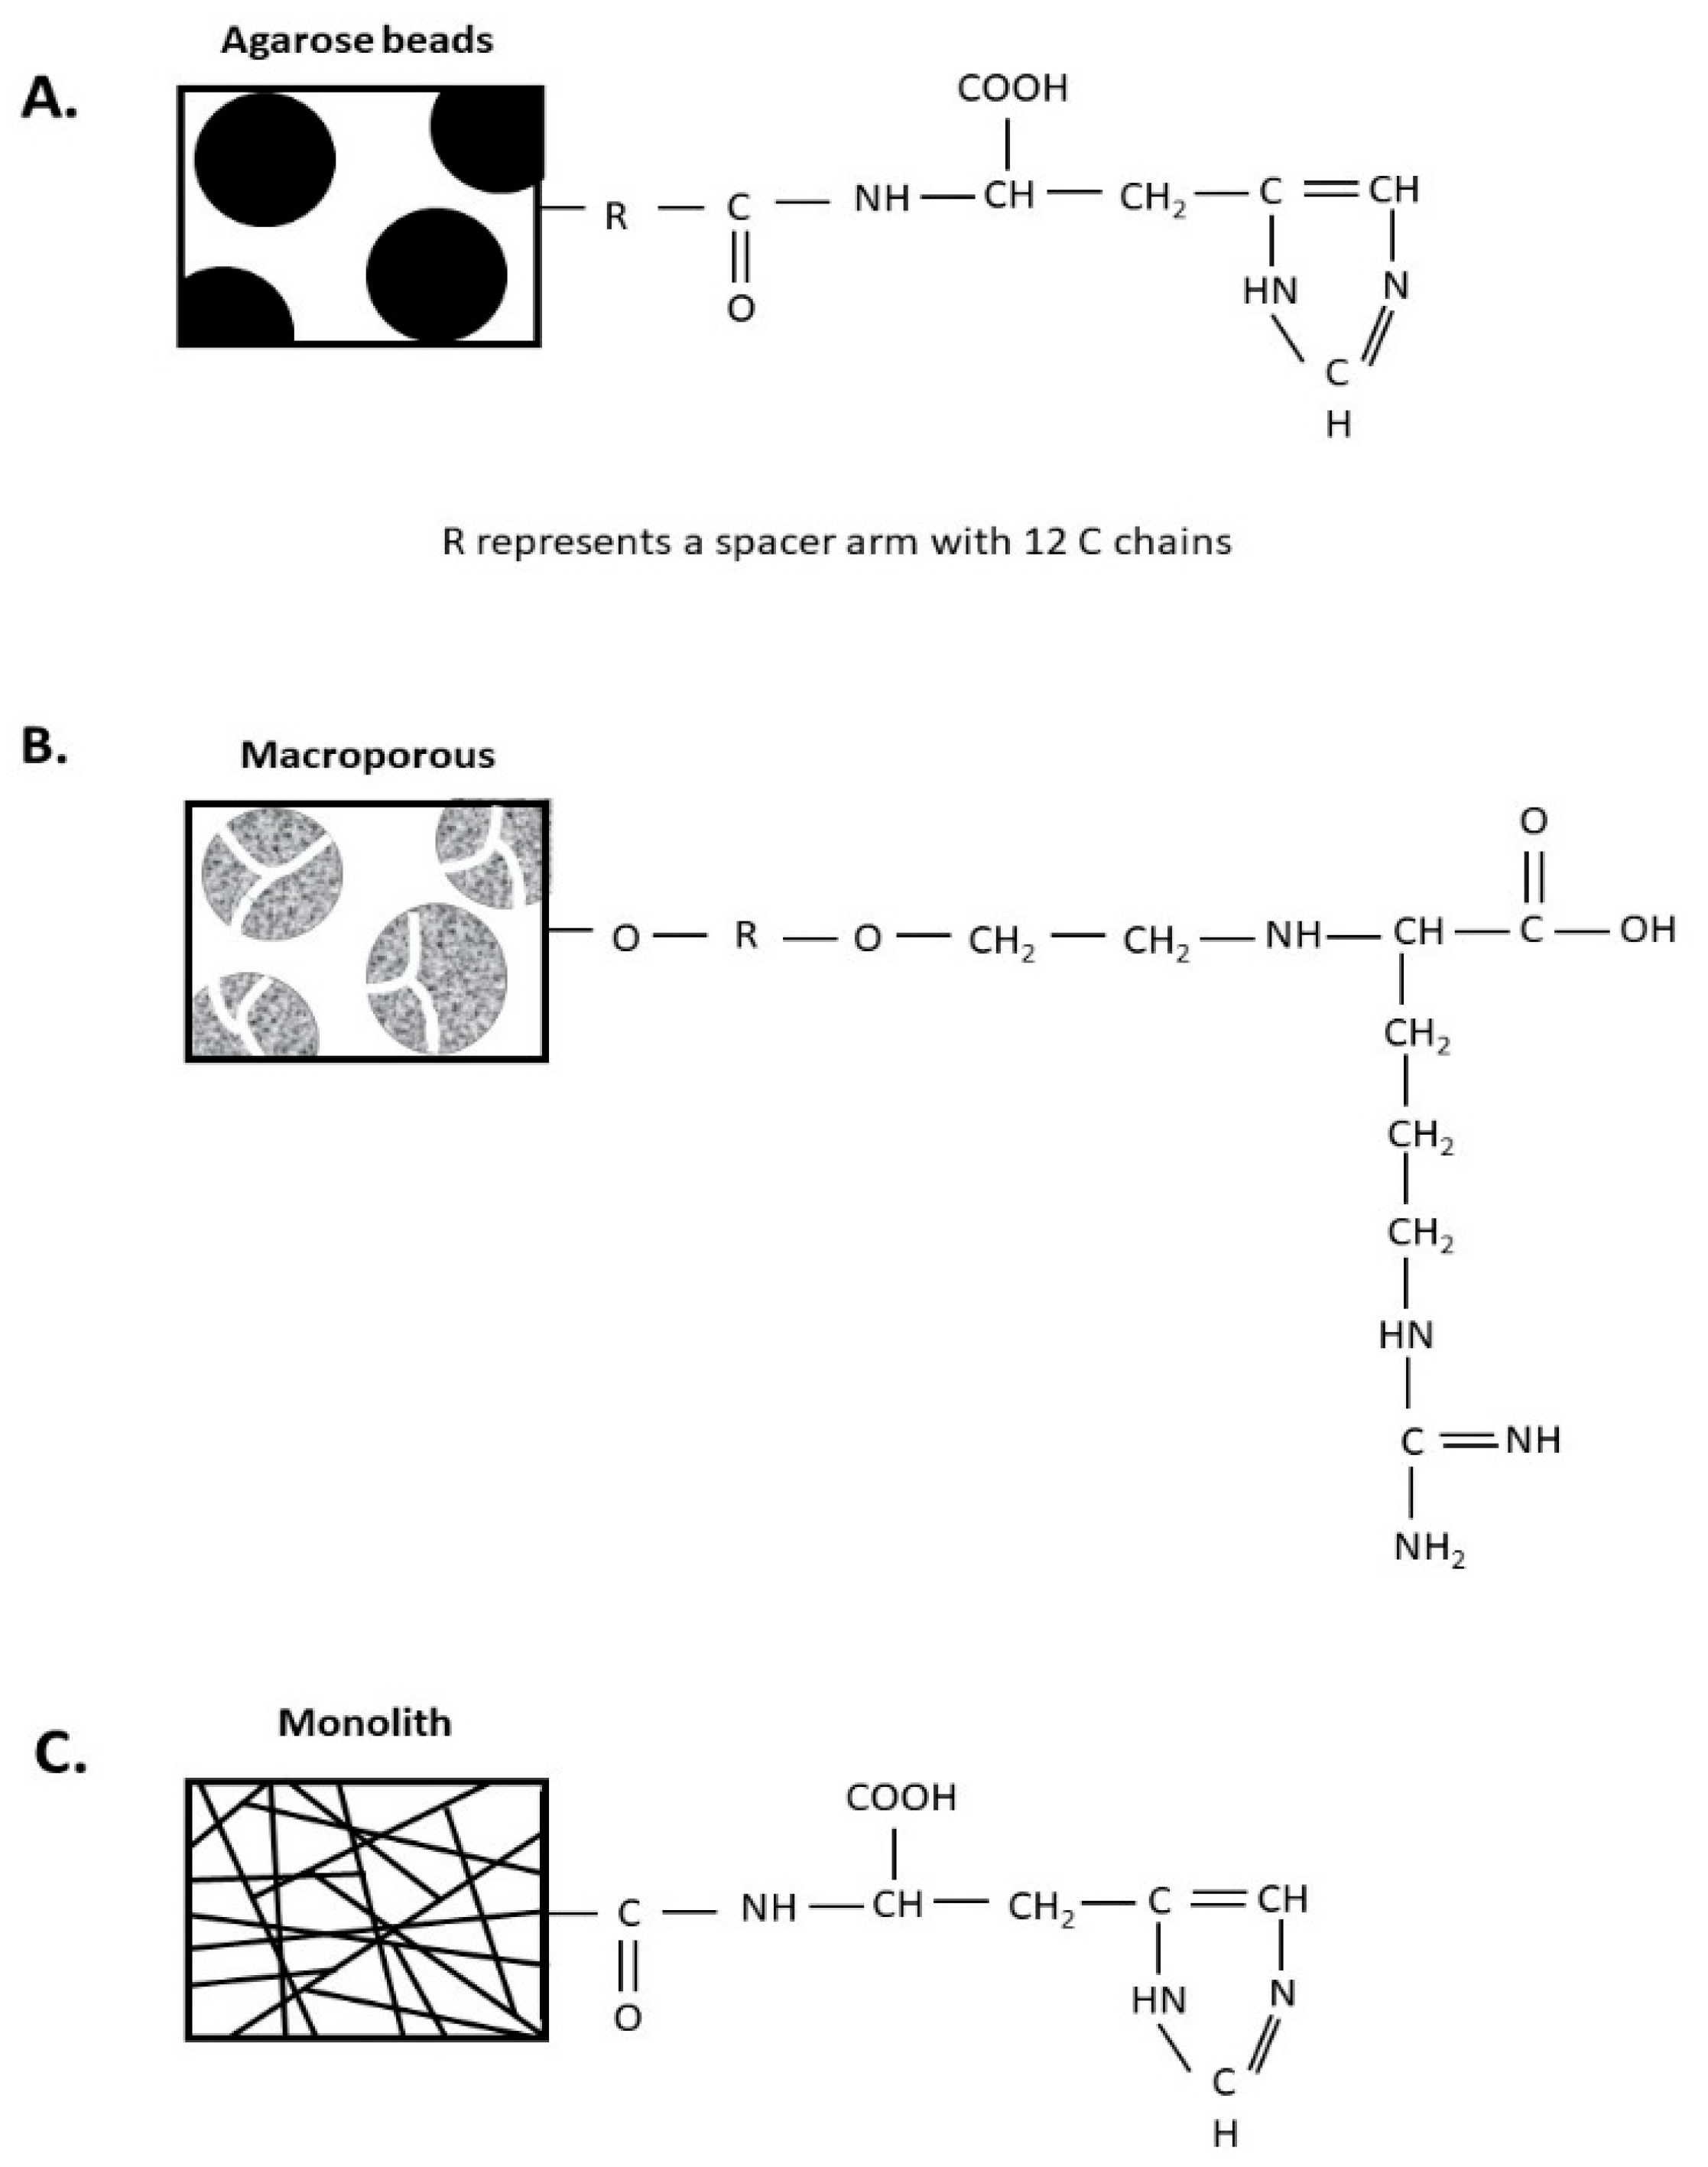
2.3.1. Histidine–Agarose Support

In the case of the L-histidine–agarose matrix, a 16 × 30 mm (about 6 mL) column was packed. The water-jacketed column was connected to a circulating water bath to maintain the appropriate temperature at 4 °C. The column was equilibrated with 2.3 M (NH4)2SO4 in 10 mM Tris buffer, pH 8.0. The elution was carried out using a 60 min linear gradient decreasing the ionic strength of the buffer to 1.7 M (NH4)2SO4 in 10 mM Tris buffer, pH 8.0 and finally, tightly bound molecules were removed by changing to salt-free 10 mM Tris buffer, pH 8.0.

2.3.2. Arginine–Macroporous Support

The commercial support Toyopearl Epoxy was modified with amino acid arginine as a ligand, following the method described in the literature [19]. After being synthesized, the arginine–macroporous matrix was packed on the chromatographic column 10 × 20 mm (about 1.6 mL). The water-jacketed column was connected to a circulating water bath to maintain the appropriate temperature at 5 °C. Before injection, the sample was desalted using a PD10 column. The arginine–macroporous column was equilibrated with 96 mM of NaCl in 10 mM Tris buffer (pH 8.0) and then the ionic strength was increased to 500 mM and, finally to 2 M of NaCl, to sequentially elute the bound species.

2.3.3. Histidine–Monolithic Support

These assays were carried out in a CIMacTM L-histidine analytical column with 0.1 mL bed volume, provided by BIA Separations (Ajdovščina, Slovenia). Monolith was equilibrated with 3 M (NH4)2SO4 in 10 mM citrate–EDTA buffer, pH 5.0. The lysate sample was injected after adjusting the ionic strength and then a stepwise gradient was applied, first decreasing the salt concentration to 2.52 M and, finally to 0 M (NH4)2SO4 in 10 mM citrate–EDTA buffer, pH 5.0. These chromatographic experiments were performed at room temperature.

2.4. Quality Assessment of Purified pDNA

2.4.1. Plasmid Quantification by Analytical Chromatography

The purity and recovery yield of the sc pDNA was evaluated by an analytical method based on ion exchange chromatography using the commercial analytical monolith CIMacTM (BIA Separations) and as previously described [20]. To use this method, a calibration curve was first constructed in the pDNA concentration range of 1–25 μg/mL by considering the peak area corresponding to sc pDNA standards. The recovery yield was calculated by the ratio between the obtained sc pDNA concentration and the sc pDNA concentration present in the lysate sample, while purity was calculated by the ratio between sc pDNA peak area and total peak area present in the analytic chromatogram.

2.4.2. Proteins, Endotoxins, and Genomic DNA Quantification

The total protein content in purified pDNA samples was determined using the micro-BCA (bicinchoninic acid) protein assay kit from Pierce (Rockford, IL, USA) following the manufacturer’s recommendations. The calibration curve was performed with the standard bovine serum albumin (0.01–0.1 mg/mL) diluted in 10 mM Tris–HCl, pH 8.0 or in 10 mM of sodium citrate buffer, pH 5.0. To evaluate the endotoxins levels, a ToxiSensorTM Chromogenic Limulus Amoebocyte Lysate (LAL) kit (GenScript, New Jersey, USA) was applied, in accordance with the manufacturer’s instructions. Briefly, a calibration curve was performed (from 0.005 to 0.1 EU/mL) using a stock solution of 8 EU/mL. To avoid the external endotoxin interference, all the samples were diluted or dissolved in non-pyrogenic water, which was also used as the blank. All the tubes and tips used to perform this analysis were endotoxin-free. The procedure was performed inside a laminar flow cabinet to assure aseptic conditions. Quantitative polymerase chain reaction (qPCR) was applied to quantify the amount of gDNA in the purified pDNA samples. To accomplish this analysis, an iQ5 Multicolor real-time PCR detection system (Bio-Rad) was used, as previously described [21]. To perform qPCR, primers able to amplify a 181-bp fragment of the 16S rRNA gene (sense (5′-ACACGGTCCA GAACTCCTACG-3′) and antisense (5′-CCGGTGCTTCTTCTGCGGGT AACGTCA-3′)) were used. Moreover, for the gDNA quantification in lysate samples, a 100-fold dilution was prepared. The PCR amplicons were quantified by following the change in fluorescence of the DNA binding dye SYBR Green (Bio-Rad). Nonetheless, a calibration curve performed through consecutive dilutions of the purified E. coli DH5α gDNA in the 0.005 to 50 ng/µL range was obtained to measure the concentration of the gDNA obtained. Negative controls (no template) were run at the time of each analysis.

2.5. Structural Analysis of pDNA

2.5.1. Circular Dichroism

The topology of pDNA samples (100 µg/mL) purified by each chromatographic strategy was evaluated by a Jasco J-1850 Spectrophotometer (Jasco, Easton, MD, EUA) with a rectangular quartz cell (Hellma Analytics, Müllheim, Germany) and an optical path of 1 mm. The spectra were obtained at a scanning speed of 10 nm/min, in an absorbance range between 210–320 nm and a spectral bandwidth of 1 nm. All assays were performed under a constant flow of nitrogen, thereby purging the ozone that is generated by the light source (xenon lamp) of the equipment. Data were collected in triplicate (n = 3) and the means represented in a single spectrum. At the end of each run, the noise was removed using the Jasco J1850 Software to obtain a more linear spectrum without distortion of the peaks of the positive (270 and 220 nm) and negative (245 nm) bands, characteristic of the pDNA.

2.5.2. Zeta Potential

The equipment Zetasizer Nano-ZS (Malvern Instruments, Worcestershire, UK) was used to evaluate the superficial density of charge of pDNA in disposable capillary cells at 25 °C. The value of zeta potential was calculated using the models of Henry (F (Ka) 1.5) and Smoluchowsky. The mean values of the zeta potential measurements were calculated from the data obtained from three replicates ± SD.

2.6. Bioactivity of pDNA

2.6.1. Cell Culture and Transfection

Cell culture experiments were performed with the HeLa cervix cancer cell line and the non-malignant cell line, human dermal Fibroblasts. Cells were cultured in Dulbecco’s Modified Eagle Medium (DMEM)-F12 medium supplemented with 10% (v/v) heat activated Fetal Bovine Serum (FBS) and streptomycin (100 μg/mL) at 37 °C, under a 5% CO2 humidified atmosphere. In vitro transfection experiments were carried out by seeding 1 × 10⁴ cells in a 96 well plate with 200 µL of DMEM-F12 complete medium and incubated for 24 h. Afterwards, the complete medium was replaced by DMEM-F12 medium without FBS and without antibiotic, in order to promote transfection. The transfection of cells with the purified pDNA obtained from the different chromatographic strategies was performed with a commercially available transfection reagent (Lipofectamine 2000 (Lipo2000)). Briefly, in each well of the 96-well plate, 0.28 µL of Lipo2000 and 0.14 µg of pDNA were diluted in 5.15 µL of Opti-MEM® I medium, according to the supplier protocol. Before the complexation reaction, Lipo2000-pDNA complexes were incubated for 5 min at room temperature and then added to cells. Cells were incubated for a period of 6 h after which the medium was exchanged for DMEM-F12 complete medium.

2.6.2. Cytotoxicity Assays

The cytotoxicity of liposomal-pDNA formulations was evaluated by using the resazurin assay (Sigma–Aldrich, St Louis, MO, USA). For this evaluation, HeLa and human dermal fibroblast cells were seeded in 96-well plates, as described above. Two days after transfection, 10 μL of resazurin (2.5 mM) was added to each well and incubated for 4 h, at 37 °C, in a humidified atmosphere of 5% CO2 and in the dark. Non-transfected cells were used as negative controls for cytotoxicity (K−), and ethanol treated cells were used as positive controls (K+). Following incubation, the resulting resofurin was quantified by using a plate reader spectrofluorometer (Spectramax Gemini XS, Molecular Devices LLC, San Jose, CA, USA), at an excitation/emission wavelength of λex = 560 nm and λem = 590 nm. Data represent the mean of three independent experiments.

2.6.3. p53 Expression and Quantification

The p53 ELISA kit Enzo Life Sciences (Farmingdale, NY, USA) was employed to quantify the p53 protein expression after cell transfection with purified p53-pDNA vector. Briefly, after transfection with the different pDNA samples, HeLa and human dermal fibroblast cells were rinsed with ice-cold phosphate buffered saline (PBS) and homogenized in cell lysis buffer: 25 mM Tris–HCl buffer, pH 7.4; 2.5 mM of Ethylenediamine tetraacetic acid (EDTA); 1% Triton X-100; 2.5 mM of Ethylene Glycol Tetraacetic Acid (EGTA); 25 mM phenylmethylsulfonyl fluoride and complete, EDTA-free protease inhibitor cocktail (Roche). Cell extracts were then centrifuged at 11,500  rpm for 7  min at 4  °C and the supernatant was analyzed using the Bradford protein assay (BioRad, Hercules, CA, USA), according to the supplier’s instructions. Then, the protocol supplied by Enzo life Sciences for the ELISA was applied and the p53 protein expression was measured in a plate reader spectrofluorometer (Spectramax Gemini XS, Molecular Devices LLC, San Jose, CA, USA), using an absorbance of 450 nm. Data represent the mean of two independent experiments.

2.6.4. p53 Mediated Apoptosis in Malignant Cells

The apoptotic process was evaluated by measuring the DNA fragmentation of the HeLa cancer cells due to the endonuclease activity. To perform this experiment, 1 × 10⁴ HeLa cells were seeded in a 96 well plate. After 48 h following transfection, the plate was centrifuged at 1000 g for 3 min at room temperature and then the cell culture medium was discharged and the cells were rinsed with PBS and fixed with a paraformaldehyde solution (7 min). Following this, samples were incubated for 20 min at room temperature with 100% methanol. The number of apoptotic cells was measured using an in situ colorimetric method, the HT TiterTACSTM assay (Trevigen, Gaithersburg, MD, USA) in accordance with the manufacturer’s instructions. Finally, the obtained results were measured in a plate reader using an absorbance of 450 nm. Non-transfected cells were used as negative control and the positive control was performed with cells treated with an endonuclease solution provided by the kit supplier. Data represent the mean of three independent experiments.

2.6.5. Statistical Analysis

Each experience was performed at least two or three times. Data are expressed as a mean  ± standard error (SD). The statistical analysis performed was one-way analysis of variance (ANOVA), followed by multiple comparison test Turkey. A p-value   below 0.05 was considered statistically significant. Data analysis and statistical tests were performed in GraphPad Prism 6 software.

3. Results and Discussion

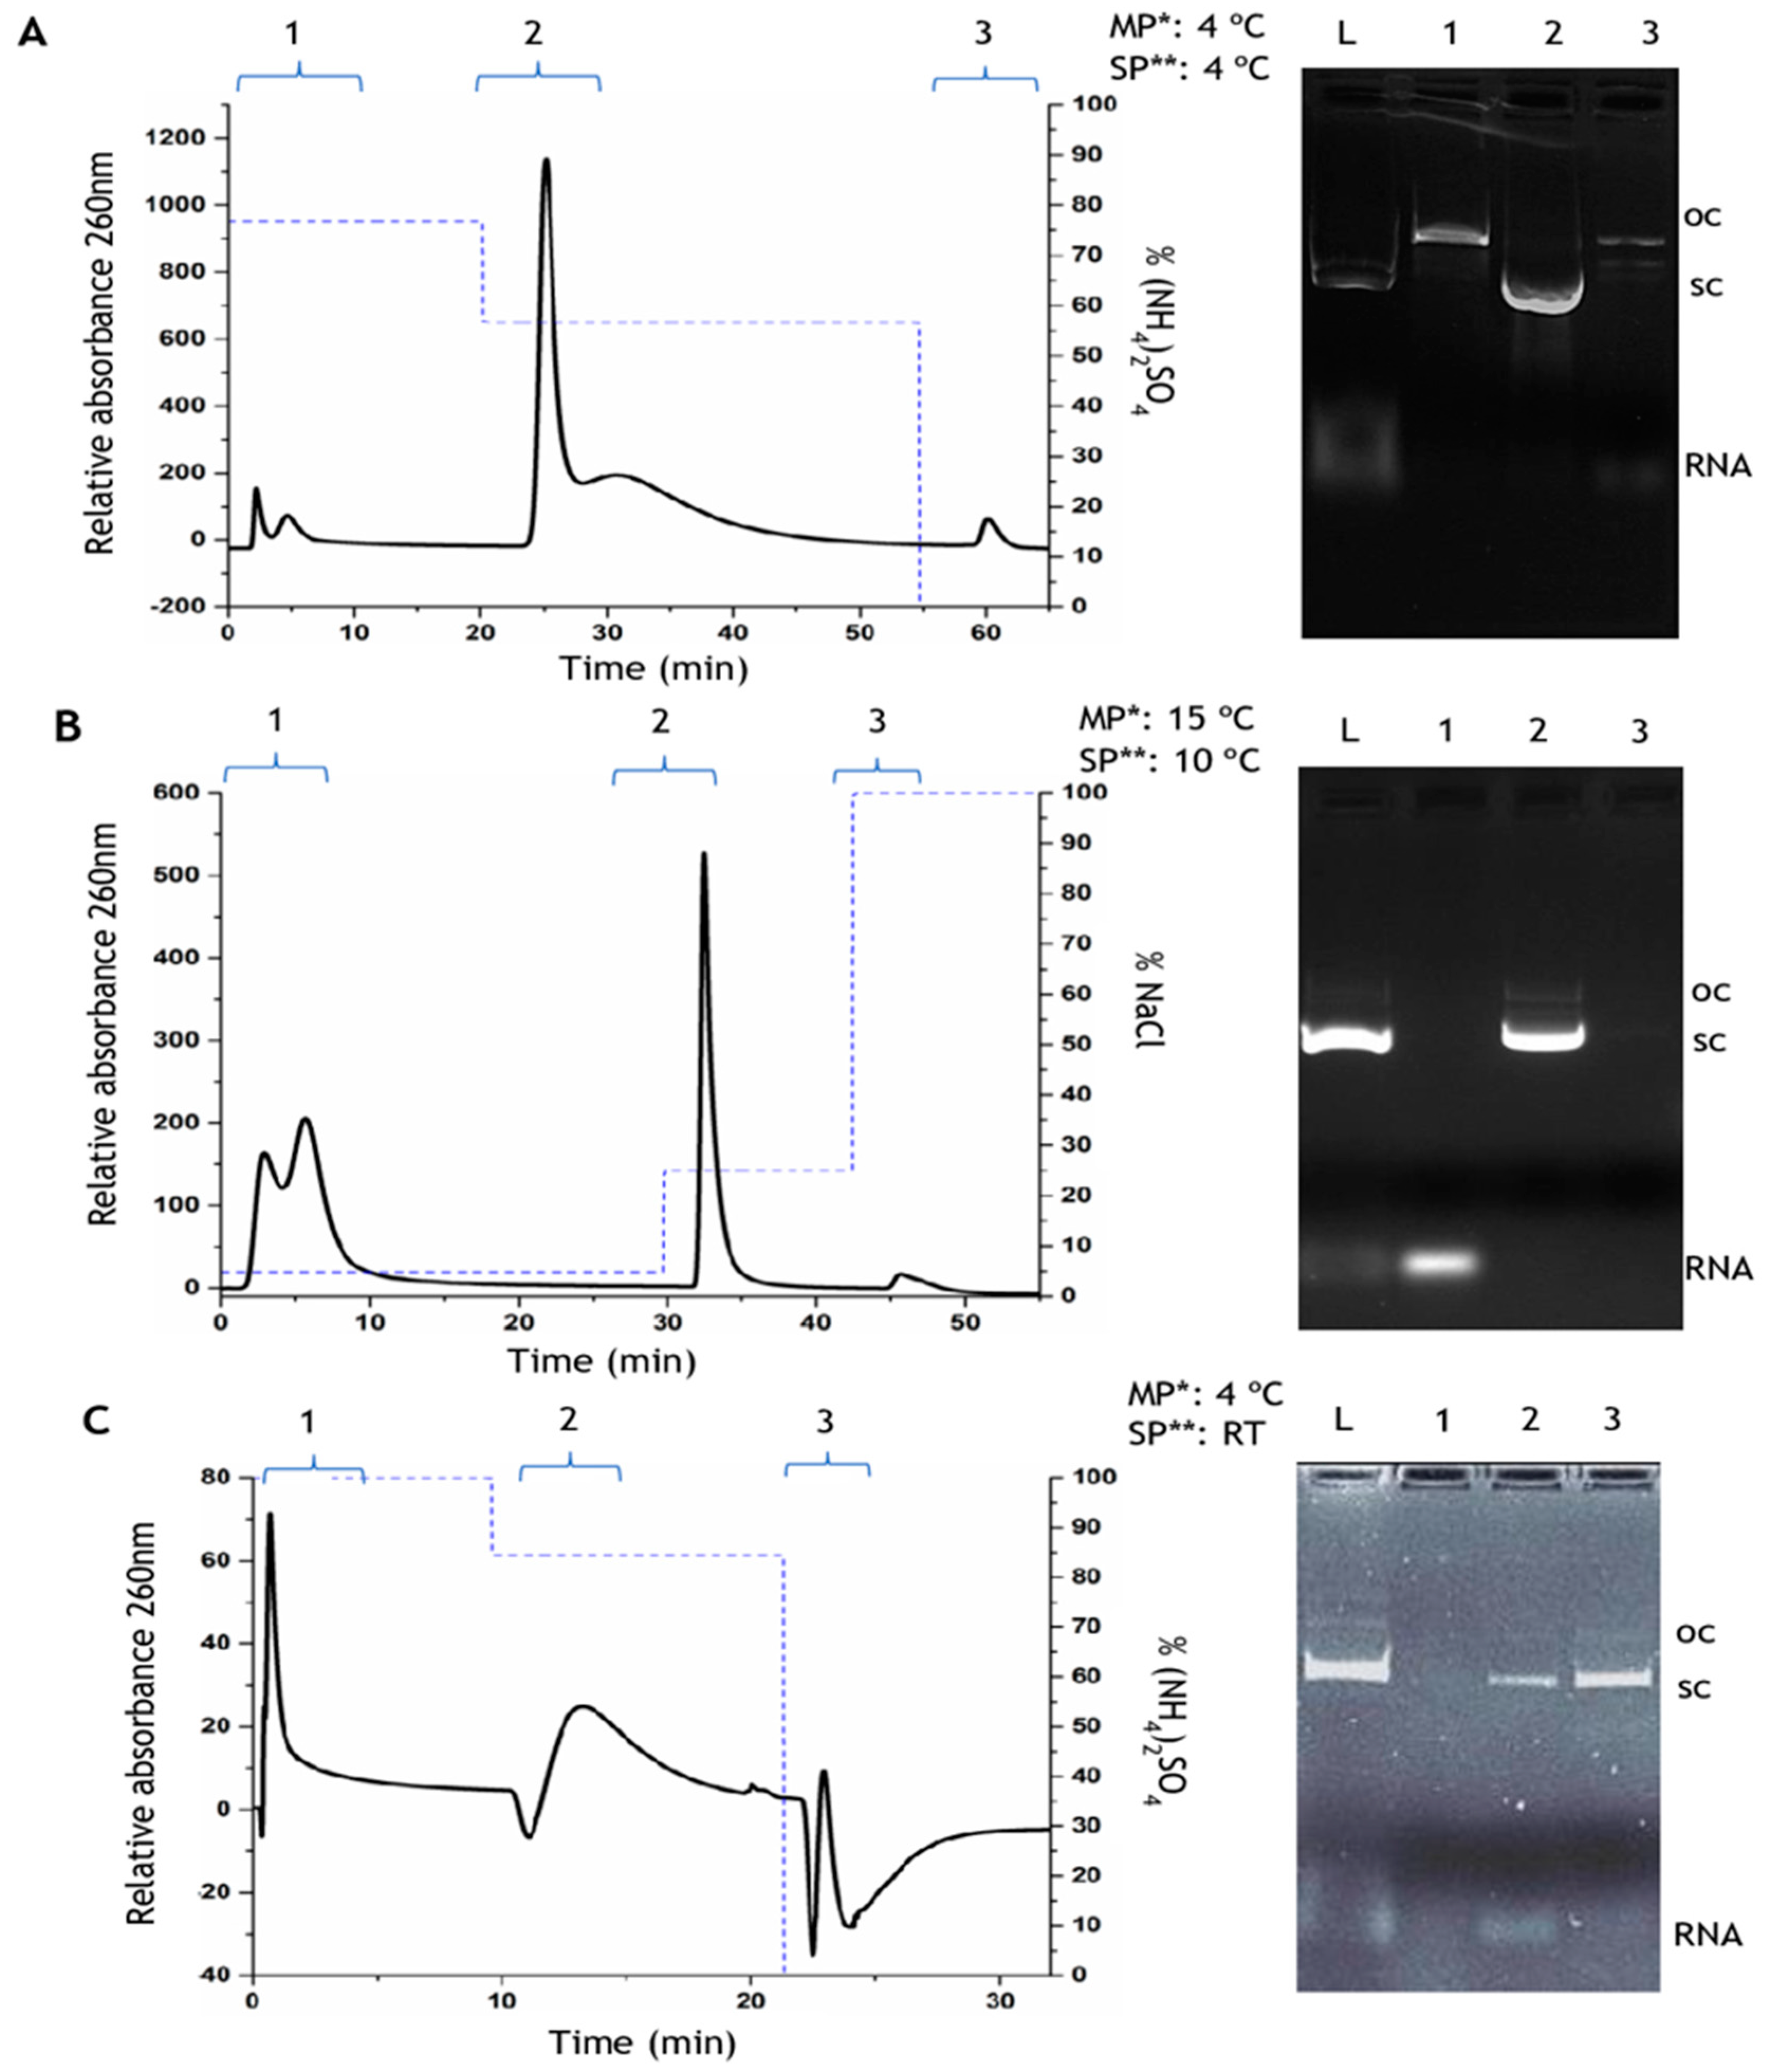
3.1. Preparative Chromatography

The clarification procedure performed after cell lysis enables the preparation of an extract enriched in sc pDNA and simultaneously promotes the reduction of the impurities content, although it is not possible to fully eliminate species such as RNA, gDNA, endotoxins, or host proteins. Therefore, affinity chromatography using amino acids as ligands has been extensively used by our research group to obtain a final pDNA sample fulfilling the requirements of regulatory agencies [22,23,24]. Of all the amino acids studied, arginine and histidine have shown to be the most promising chromatographic ligands, allowing the purification of different plasmids with high recovery yield and purity degree [24,25]. In the present study, the selection of these amino acids was also performed because they present completely different chromatographic behaviors for the isolation of sc pDNA. In fact, through the literature, it is possible to conclude that although multiple interactions occur between the nucleic acids and these amino acids, the main interactions established with arginine are ionic interactions, while the histidine ligand mainly promotes hydrophobic interactions. This information will influence the choice of the type of salt and gradient to be applied but other parameters such as temperature or pH are crucial to establish the ideal conditions for sc pDNA purification while ensuring its stability. In this way, the main goal of this study is to understand how different chromatographic approaches influence the bioactivity of the recovered sc pDNA. Initially, three different supports were applied for the isolation and purification of sc p53 encoding pDNA, according to the optimized strategies described in Figure 2.
It is possible to observe the difference of the binding behavior represented on the three chromatographic profiles. The histidine–agarose support was used to purify the sc pDNA from the clarified lysate sample by a decreasing stepwise gradient of ammonium sulfate (Figure 2A). The open circular (oc) pDNA isoform was eluted in peak 1 with 2.3 M (NH4)2SO4 in 10 mM Tris–HCl buffer (pH 8.0), as it can be visualized in lane 1 of the agarose gel electrophoresis (Figure 2A). The sc pDNA isoform was eluted in the second peak, at 1.7 M (NH4)2SO4 (lane 2 of agarose electrophoresis—Figure 1A), and finally, the third peak corresponds to the elution of more strongly bound molecules, recovered with 10 mM Tris–HCl buffer (pH 8.0), as observed in lane 3 of the agarose gel electrophoresis, by the presence of RNA and small amounts of other molecular species (Figure 2A). The dominant interactions responsible for the nucleic acid binding behavior on this column are the hydrophobic ones since the imidazole ring is able to promote interactions with nitrogenous bases of nucleic acids, due to the influence of high ionic strength on the mobile phase. The hydrophobic interactions are favored by the use of high (NH4)2SO4 concentrations, since the kosmotropic ions influence the exposure of hydrophobic regions of molecules [26]. Considering the pDNA isoforms, sc pDNA has some hydrophobic regions, naturally exposed because of its conformational torsions [27], and this effect can be enhanced under high (NH4)2SO4 concentrations, allowing the establishment of hydrophobic interactions between non-polar regions of the ligands and the sc pDNA. On the other hand, the oc isoform has the bases inward and they are less available to interact with histidine even in the concentration of 2.3 M (NH4)2SO4, being immediately eluted in the first step. Concerning RNA, the bases are more exposed because of its main single-stranded nature, being in this way more available to interact with the matrix. The decrease of the (NH4)2SO4 concentration increases the reorganization of water molecules, consequently minimizing the hydrophobic effects, and disfavoring these interactions. Despite the dominant effect of ring stacking/hydrophobic interactions, the water-mediated hydrogen bonds and van der Waals forces are also present between histidine–agarose matrix and pDNA [28,29], evidencing the affinity character of this matrix. The results obtained in Figure 2A are in accordance with other works, made under the same conditions but using other plasmids [23,24].
Figure 2B exhibits the chromatographic profile of the clarified lysate in arginine–macroporous support, as well as the respective agarose gel electrophoresis. Here, an increasing gradient of NaCl was used to elute the bound molecules. First, RNA was eluted in peak 1 at 124 mM NaCl in 10 mM Tris–HCl buffer (pH 8.0), as confirmed by the agarose gel electrophoresis (lane 1, Figure 2B). The sc pDNA isoform was then eluted in peak 2, at 500 mM NaCl, together with a small amount of oc pDNA (lane 2 Figure 2B). A final step of 2 M NaCl was used to confirm the elution of all retained species. The arginine ligands immobilized in the macroporous support, under the influence of the mobile phase, mainly promote electrostatic interactions, not disregarding the involvement of other non-covalent interactions occurring between the lysate molecules and the arginine ligand [21,23]. The negatively charged groups in the pDNA backbone interact with the positive groups of the arginine support, and as expected these molecules bind more strongly than RNA, because pDNA has a double stranded negatively charged chain, while RNA is smaller and presents a single-stranded nature [28,29].
The histidine–monolithic support was applied to purify the sc pDNA from the clarified lysate sample by using a decreasing stepwise gradient of ammonium sulfate (Figure 2C). The first step was established at 3 M (NH4)2SO4 in 10 mM citrate–EDTA buffer, pH 5.0, to promote the retention of all biomolecules present on the monolithic column. The RNA and a small fraction of sc pDNA were eluted in the second gradient step (peak 2) at 2.52 M (NH4)2SO4, as it can be observed in the agarose gel electrophoresis (lane 2, Figure 2C). Finally, the more tightly bound biomolecules were eluted in the third peak by a decrease in the ionic strength to 10 mM Tris–HCl (pH 8), which correspond to sc pDNA as visualized in lane 3 of the agarose gel electrophoresis (Figure 2C). In this particular case, due to the pH 5 of the mobile phase, the imidazole ring of histidine is protonated and hence positively charged, which favors the establishment of electrostatic interactions between nucleic acids and the stationary phase, in addition to the hydrophobic effects previously discussed. Actually, the difference on the chromatographic elution behavior found on the histidine–monolith and the histidine–agarose can be related to the additional electrostatic effect resultant from the pH 5.0 used in this study, as it was already observed by Amorim and co-workers to purify the HPV-16 E6/E7 pDNA [25].
Plasmid purification by chromatography deals with some concerns associated with the diversity of biomolecules present in the lysate extracts and their characteristics such as: size, shape, conformation, and rheological properties. Moreover, most impurities like RNA, gDNA, or endotoxins share with pDNA some properties of molecular mass, charge, or hydrophobicity [30]. Thus, the applied chromatographic methods must guarantee the presence of a final sc pDNA sample with the purity degree in accordance with the regulatory agency requirements (Table 1). Nonetheless, the residual amounts of proteins, gDNA, and endotoxins also need to be quantified to ensure that these values are in accordance with these specifications of the regulatory agencies. To accomplish that, several specific analyses were performed on the purified sc pDNA fractions and the observed results are presented in Table 1.
Regarding the overall quality of purified sc pDNA fractions, it should be remarked that all samples were colorless and both proteins and RNA were undetectable. The endotoxin content was also quantified by the LAL method that revealed the reduction of this impurity to acceptable levels when the sc pDNA was purified by histidine–agarose and arginine–macroporous supports. However, the sc pDNA purified through the histidine–monolithic support presented a slightly higher content of endotoxins (Table 1), resulting in a value above the limit established by the regulatory agencies. Endotoxins are part of the cell wall constitution of the host and as mentioned above, must be removed from the lysate, being acceptable only at minimal amounts (<0.1 EU/μg pDNA), because they exhibit pyrogenic activity when they are present in high doses [11]. The amphipathic feature of endotoxins makes the process of eliminating this component more difficult [31]. Actually, some authors have described the high affinity of histidine for endotoxins [32]. In our work, despite the use of two different supports functionalized with histidine, the histidine–sepharose support was more effective at eliminating the endotoxins, while histidine–monolith was not so effective. This difference can be justified by the different pH conditions, where at pH 8.0 the major interactions that are promoted are hydrophobic, while at pH 5.0, the imidazole ring becomes protonated, and both electrostatic and hydrophobic interactions are explored. Therefore, it is reasonable to hypothesize that this combined effect can favor the endotoxin adsorption onto the histidine–monolith. The endotoxin levels present in sc pDNA purified by histidine–monolith were above the maximum limit established by FDA, a previous study indicates that the use of acidic pH can promote irreversible changes which may deactivate its biological activity [33]. In what concerns the gDNA, it was also verified the reduction of this impurity to residual levels in the three samples purified through the different chromatographic strategies, and the final pDNA samples were characterized with a gDNA content below the limit established by the regulatory agencies, thus evidencing the efficiency of the three chromatographic matrices in removing this impurity (Table 1). This assessment is extremely important because some studies demonstrated that the existence of gDNA in a purified plasmid sample for clinical application was directly related with necrosis of the muscle cells [34].
After endogenous biosynthesis of therapeutic plasmid in the E. coli host, the alkaline lysis used to extract this molecule can induce some structural damage in the plasmid, converting the sc pDNA in other isoforms such as linear (ln) or oc pDNA. For this reason, the chromatographic supports explored in this work must be able to purify the most biologically active conformation, namely sc pDNA, and homogeneity higher than 90% of this topology must be obtained. Therefore, the global sc pDNA isoform purity obtained using the distinct chromatographic matrices was assessed quantitatively by the CIMac analytical column and the results showed that the histidine–monolith allowed the recovery of the sc pDNA with a higher purity degree (100%), followed by histidine–agarose (97%) and arginine–macroporous (92%) (Table 1). The recovery yield was also higher in samples purified through the histidine–monolith (71.6%), followed by the other two supports (43%) (Table 1). Overall, although a higher recovery yield and purity degree were achieved with histidine–monolith, it was not possible to eliminate endotoxins to levels that meet the requirements of regulatory agencies. Moreover, the arginine–macroporous support allowed the use of milder conditions and the recovery yield and purity levels were also acceptable, which make this support an interesting alternative for pDNA purification.

3.2. Structural Analysis of pDNA

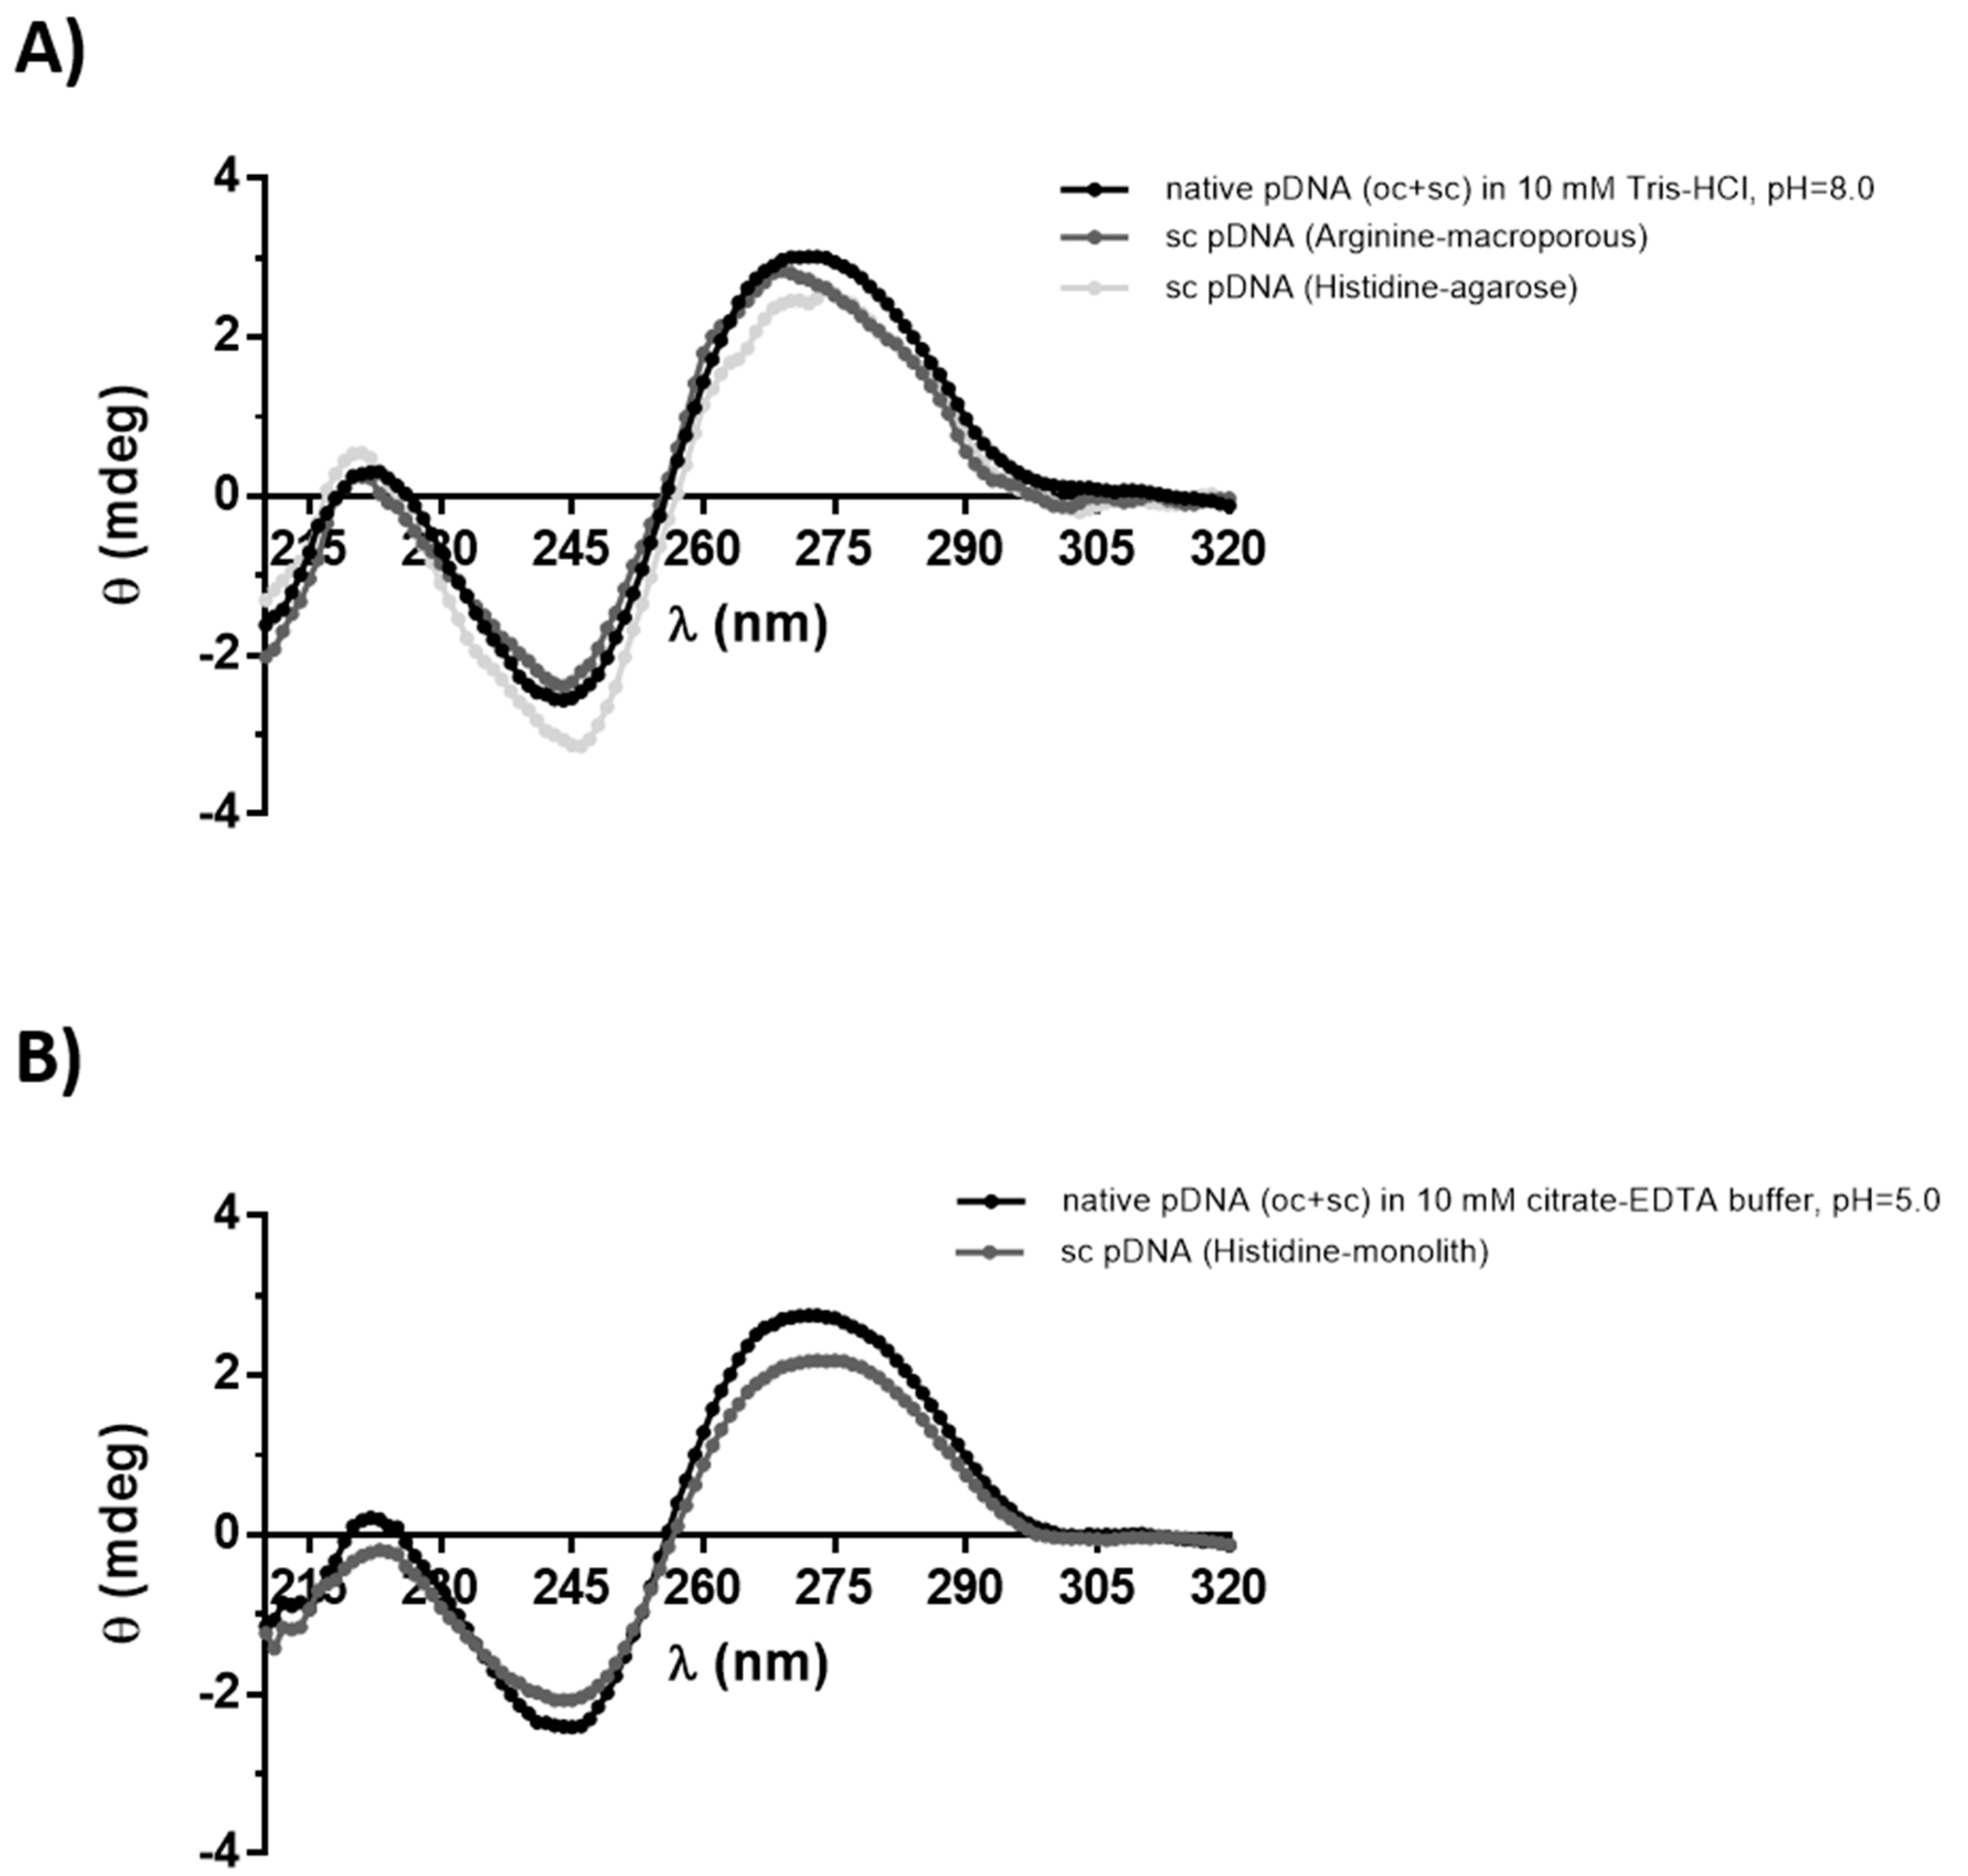
3.2.1. Circular Dichroism

The structural stability of purified sc pDNA was assessed by circular dichroism (CD), to evaluate if the distinct chromatographic strategies induce any changes in the topology of purified sc pDNA. Besides the information about the structural conformation of pDNA, this technique also shows the stability of the target molecule. Figure 3 shows the CD spectra of the sc pDNA samples recovered from the three different purification strategies, and for comparison purposes, a sample containing oc and sc pDNA obtained with a commercial kit (oc + sc) was also analyzed. The CD spectra of the pDNA (oc + sc) samples obtained using the commercial kit were very similar for both buffers used (Figure 3A,B), and it was possible to identify two positive ellipticity peaks at 220 nm and 275 nm and a negative at 245 nm, which are indicative of the typical topology of B-DNA [35,36]. This result demonstrates that these buffers did not induce significant changes to pDNA structure. When comparing these spectra with the ones obtained for the pDNA samples purified by our chromatographic methodologies, some minor alterations to the signals can be observed (Figure 3). These slight changes in the bands’ magnitude or deviations of the maximum can be associated with little changes in the pDNA molecules caused by the different chromatographic conditions used during the purification process, namely different temperature, ionic strength, and pH. These differences are most evidenced in the samples purified by the supports modified with the histidine ligand, where we can note less intense bands. As reported in the literature, during the purification procedure, several parameters should be considered and modulated, such as the mobile phase conditions, pH, or temperature, in order to reach a better interaction between the ligands and the target. However, these parameters may also cause conformational changes in the molecule, which should be avoided [36,37]. In the present study, the different conditions and interaction profiles occurring between the target molecule and the supports can explain the small differences achieved on the CD spectra of samples purified with the histidine matrices. Both strategies were based on the use of a decreasing ammonium sulfate gradient, but they differ in the pH used. Thus, some structural changes can occur on pDNA due to the acidic conditions, as the low pH can lead to subtle depurination of pDNA, which can be detected by CD. On the other hand, it is feasible to relate some CD differences to the ionic strength used, as the salt concentration can modify the double-helix condensation, depending on the amount of available ions, especially cations [9], and in some extreme cases, it can undergo transition to A or Z-DNA conformation [38]. It is noteworthy that the signal of the sc pDNA purified by arginine–macroporous present a small deviation referring to the positive region for approximately 270 nm, while those purified by histidine point to 275 nm. This detail may also be a reflection of the binding conditions of the target molecule to the matrix promoted by the mobile phase buffer, since CD is known to reflect little conformational DNA changes [39], or just a reflection of the presence of a small amount of oc pDNA isoform (Figure 3B).

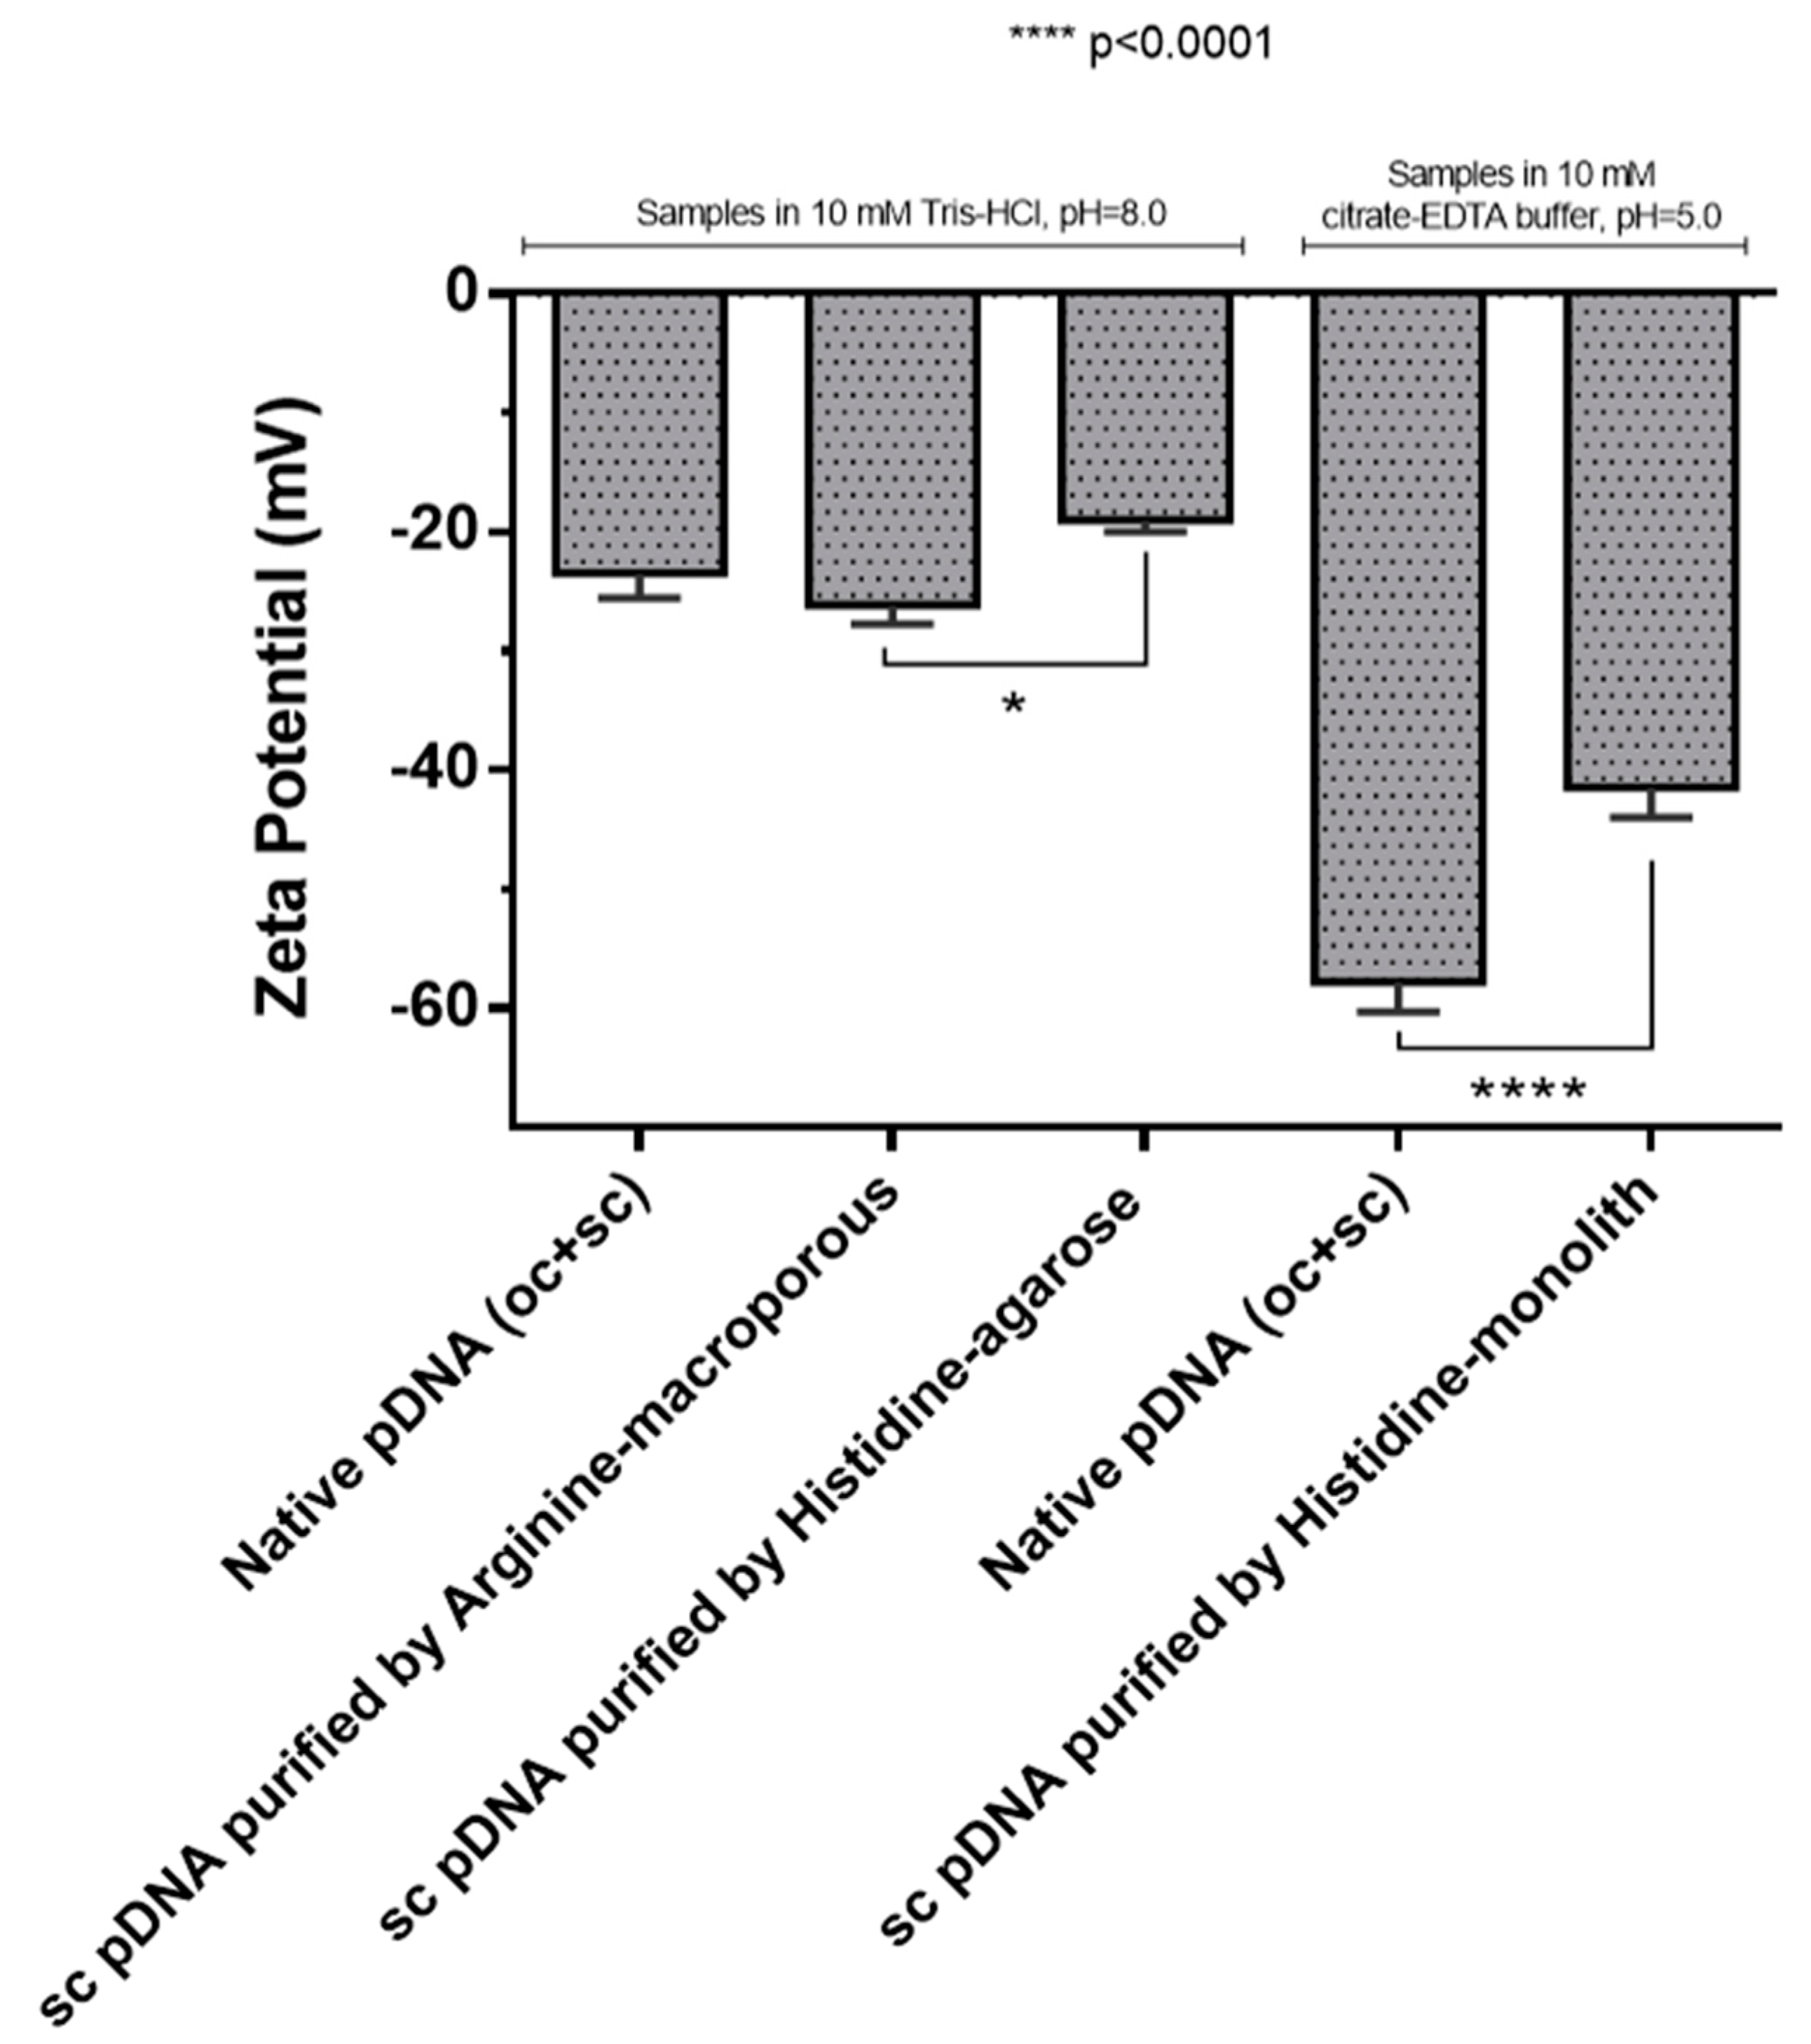
3.2.2. Zeta Potential

The zeta potential of sc pDNA solutions purified using the distinct chromatographic supports were evaluated using the Zetasizer Nano-ZS aiming to determine if the chromatographic conditions exert any change on the electric charge of sc pDNA. Thus, the zeta potential, which is established through the molecule surface charges and the concentration and types of ions present in the solution, was assessed. Through light scattering, the charge density was measured, and the result is shown in Figure 4. The pDNA molecules present negative charges on their surface and in solution they interact electrostatically with the available ions, resulting in repulsion or agglutination of these molecules. For the interaction and the equilibrium of the system, the tendency is the formation of a layer of counterions, in this case positive ions that adhere strongly to the negatively charged groups on the surface of the pDNA molecule, resulting in a compact layer or stern layer where the ions are immobilized [40]. This layer is then surrounded by ions with opposite charges that agglomerate together to neutralize the charged molecules, and these ions are in motion and hence the layer is called the diffuse layer [40]. The stability of the suspended molecule is dependent on both van der Waals forces and the double electric layer formed by ions and counterions, which in the case of therapeutic products also can influence the cellular uptake and intracellular traffic [41]. The zeta potential, which is determined by the composition of ions involved in these layers, can be altered by both the ionic strength and pH of the solution [42]. In Figure 4, it is possible to observe that the samples obtained by the commercial kit (oc + sc) clearly demonstrate a difference in the zeta potential values, mainly influenced by the pH difference of the buffers, 10 mM Tris–HCl buffer, pH 8.0 (−22 mV) and 10 mM citrate–EDTA buffer, pH 5.0 (−55 mV). Regarding the pDNA samples purified by the chromatographic strategies where the Tris–HCl buffer was used, it is also verified that there was a slight difference between them, even considering the same pH 8.0. This fact can be attributed to the salts used in the elution gradients established for the purification procedures, that even after the sample desalination can be present in trace amounts or can be responsible for some structural changes on pDNA which influence the charged group exposure, being sufficient to alter the ionic constitution of the electric double layer of the colloid. A more significant difference was achieved for the pDNA purified samples, present in buffers with different pH, namely Tris–HCl (pH 8.0) and citrate–EDTA buffer (pH 5.0), where the zeta potential values for pH 8 varied between −20 and −25 mV and −40 mV to pH 5, respectively (Figure 4). Also, these results indicate that a decrease of pH can increase the negative zeta potential, improving the stability of pDNA on the formulation. In the case of this work, the protons in acidic pH can alter the electrical double layer, leading to a reduction of the attraction forces and consequently the interaction between therapeutic molecules in the medium. As reported in literature, the agglomeration of biopharmaceuticals on the medium are associated with the low quality of product [42] and this agglomeration could occur mainly due to van der Waals forces, according the DLVO theory [43].

3.3. Bioactivity of pDNA

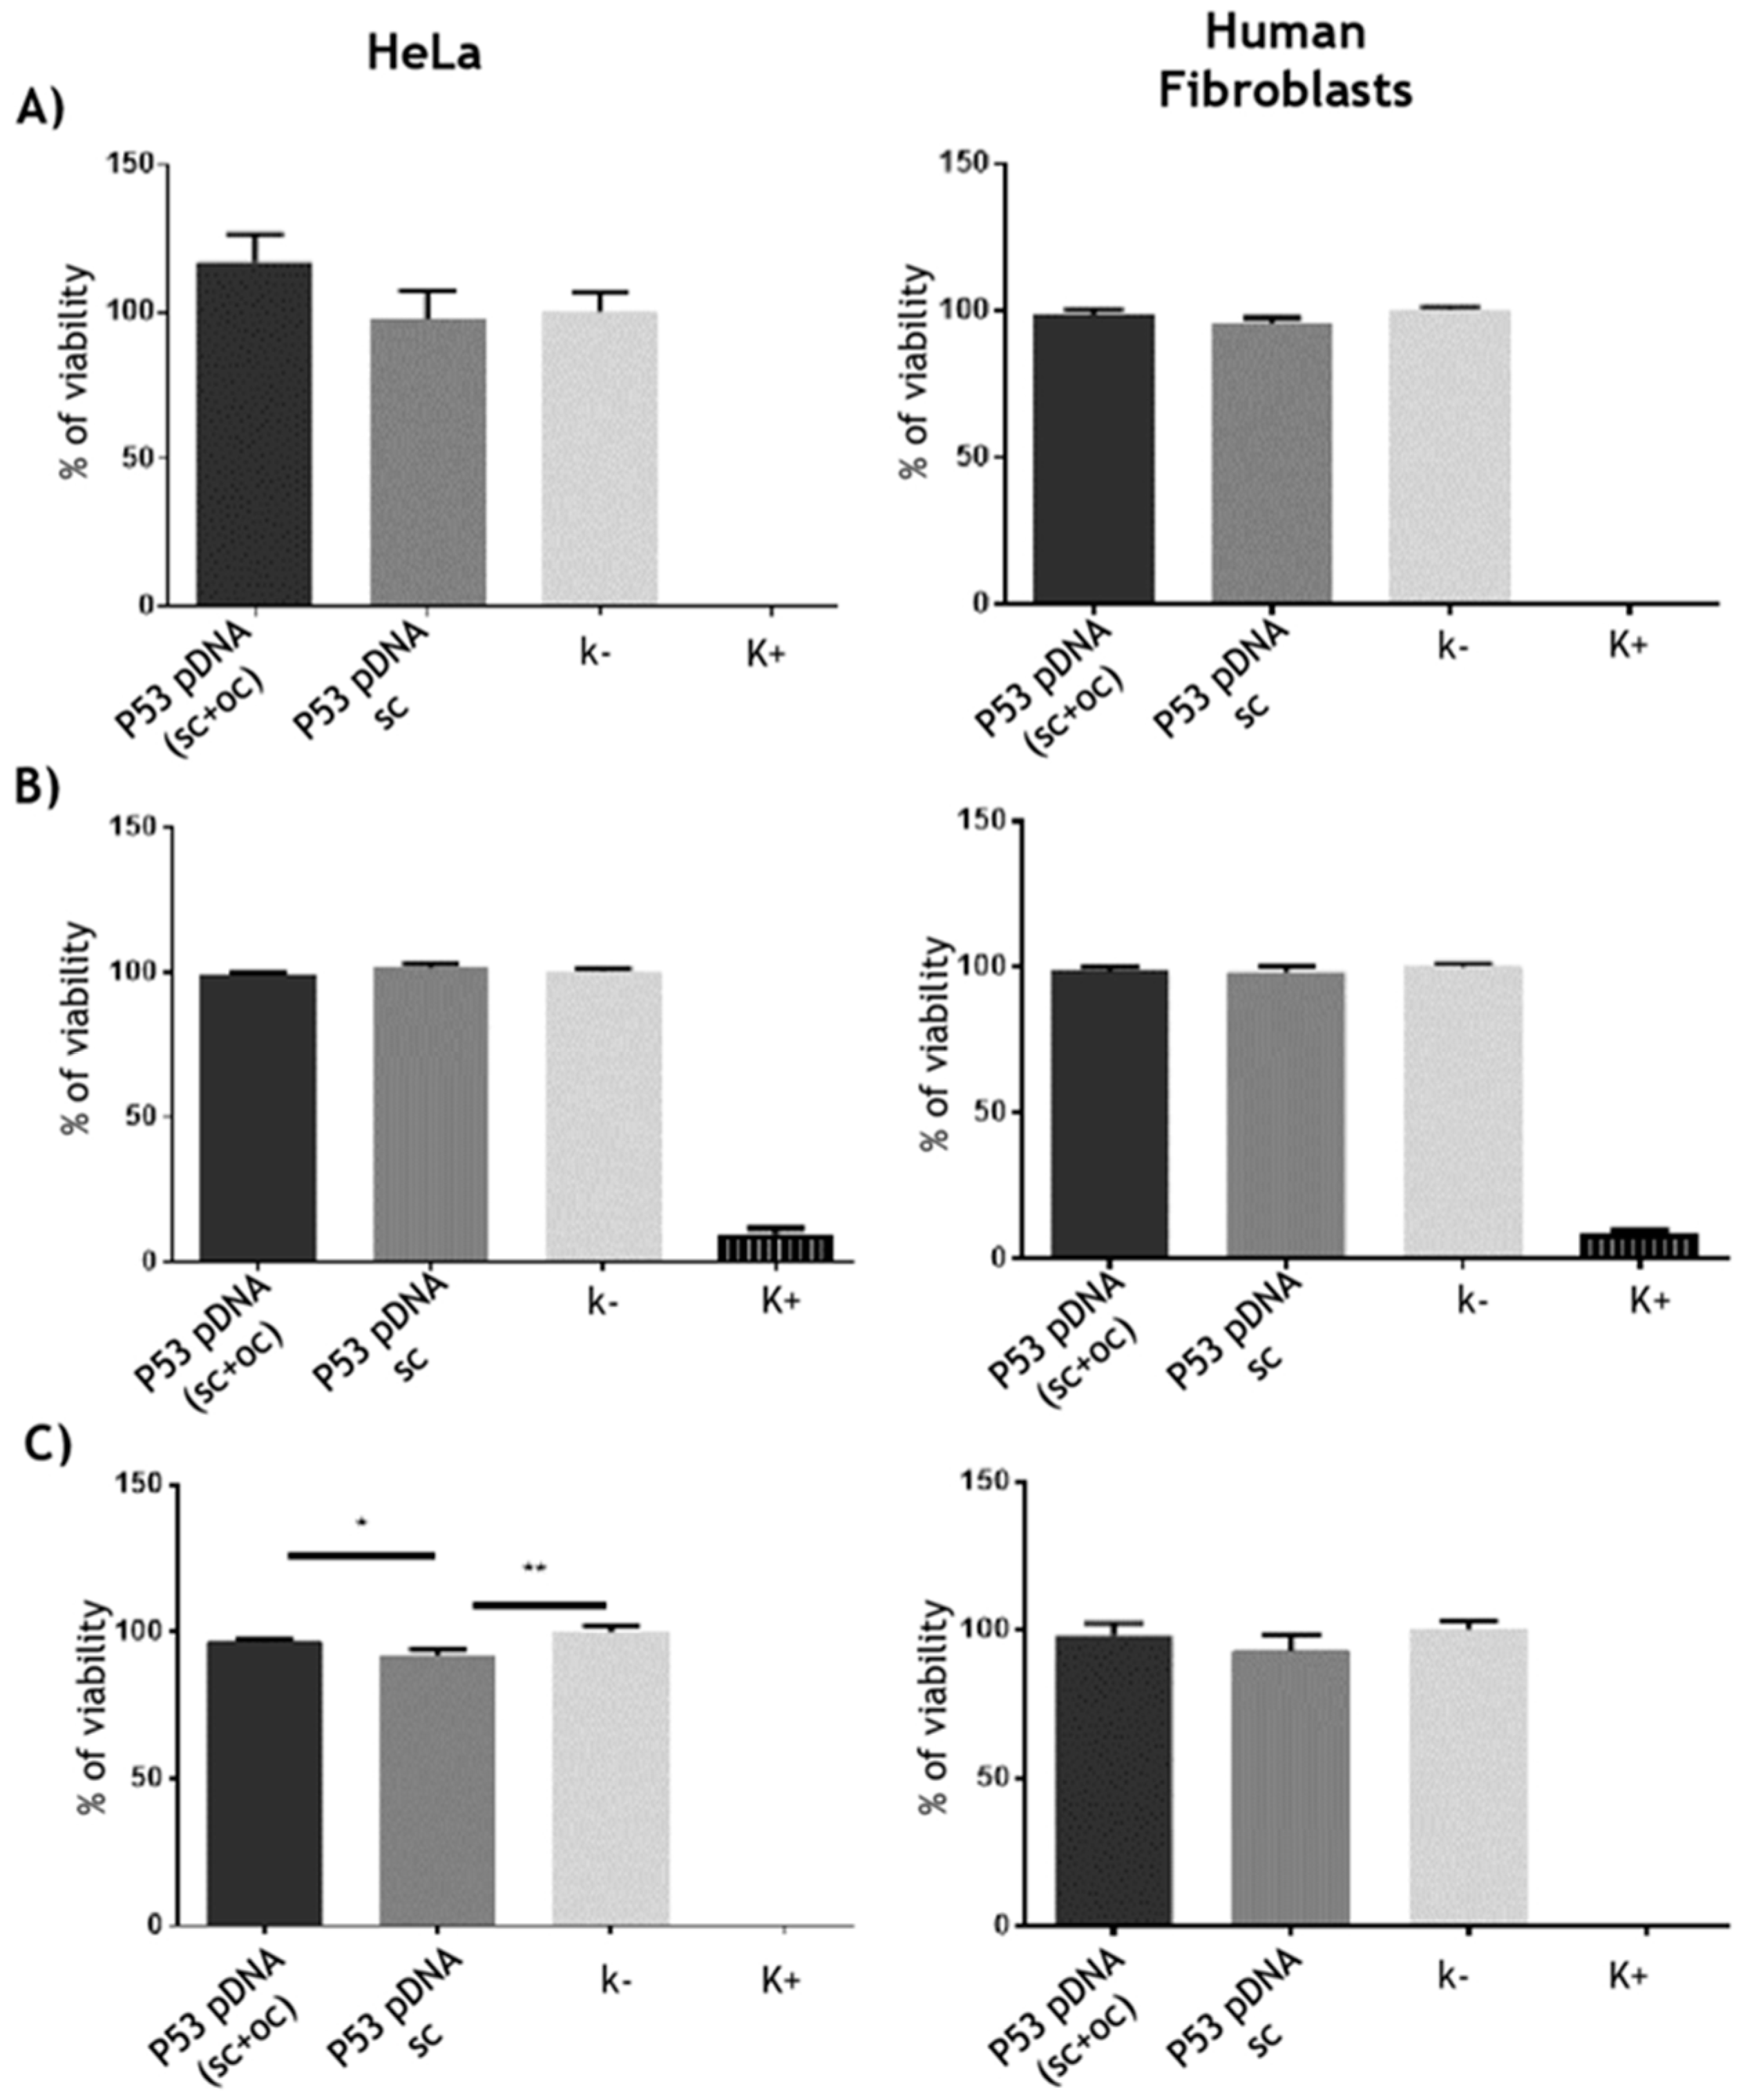
3.3.1. Cytotoxicity Assays

The cytotoxicity studies were performed by using a resazurin assay in order to evaluate if there was any toxicity related with the sc pDNA samples recovered from different supports (Figure 5). The results for human dermal fibroblasts did not revealed significant cytotoxic effects after transfection with the purified sc p53 encoding pDNA samples. In the case of HeLa cell line, a slightly cytotoxic behavior was observed in the cells transfected with the sc p53-pDNA samples recovered from the histidine-based columns, and among these samples, a more pronounced cytotoxic effect was verified when the sc pDNA was obtained from the histidine–monolithic support (Figure 5). These results could suggest that the buffer conditions used for the recovery of sc pDNA (high ammonium sulfate concentration in the histidine–agarose and acidic pH in the histidine–monolith) could cause some slight cytotoxicity. The samples purified with the arginine–macroporous support did not induce any cytotoxic effect which can be related to the milder conditions used during the purification process, namely the low NaCl concentration and pH 8.0. Overall, in this case, the cell viability can be affected by the pDNA sample (resulting from different preparation conditions), or some effect can also be related to the apoptosis induced by transfection. Actually, this phenomenon was previously observed and discussed by Valente et al. (2018). In that research work, it was verified that the reduction of cell viability was not directly related to the toxicity of the formulation, but it was more related with a higher p53 protein expression, resulting in a higher apoptotic effect for HeLa cancer cells [44]. Therefore, in our work, and considering the small cytotoxicity observed, further tests were performed to assess the pDNA bioactivity, namely regarding the ability to induce the p53 protein expression as well as the apoptotic effect induced on the HeLa cancer cells.

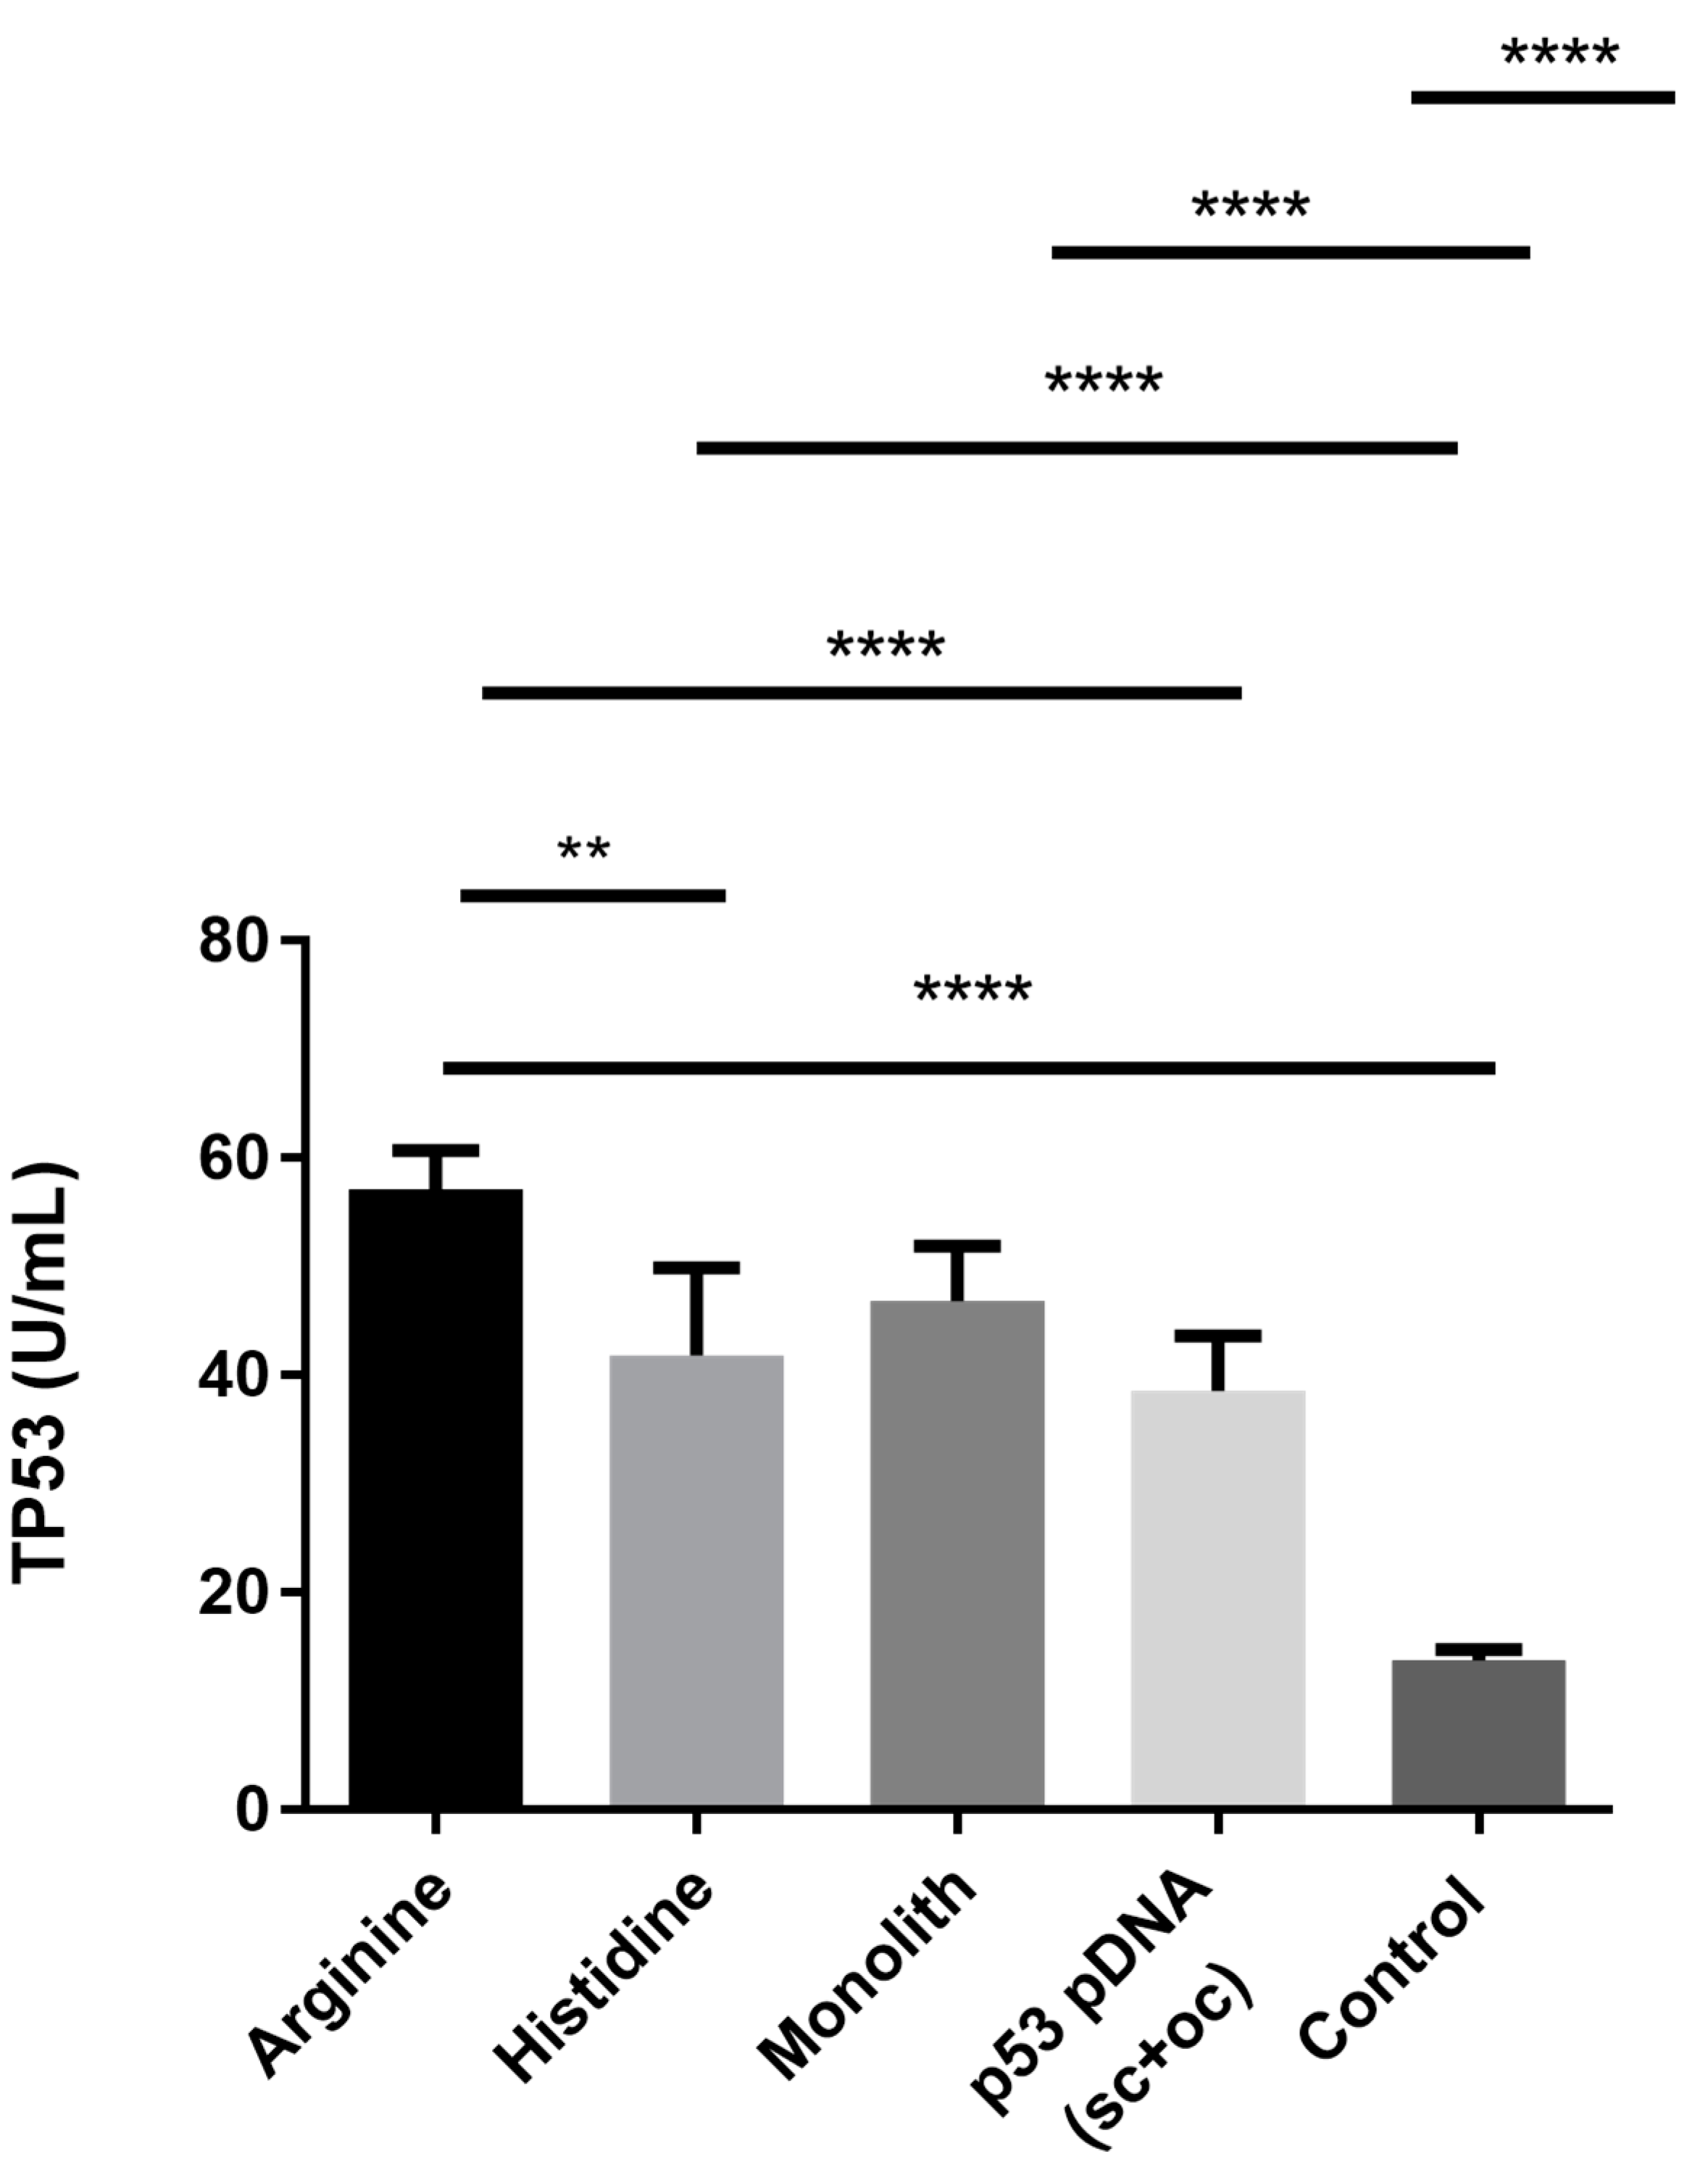
3.3.2. Analysis of the p53 Protein Expression

To better understand the bioactivity of the sc p53-pDNA isoform purified by the different chromatographic strategies, an ELISA assay was performed to evaluate the expression of p53 protein, after 48 h of HeLa cells transfection with the different samples (Figure 6). For the control group, non-transfected HeLa cancer cells were used and basal p53 expression levels were obtained. The low p53 levels presented by this kind of cells are described as a result of the degradation of this protein by the E6 and E7 oncoproteins from the HPV (human papillomavirus) [44]. Also, a native p53-pDNA sample extracted through a commercial kit was used in this experiment to evaluate the bioactivity performance of a native sample (containing both isoforms, oc + sc) and compare with the efficiency found for the different sc pDNA samples obtained from different chromatographic supports used in this research work. The p53 expression induced by the cell transfection with the plasmid extracted through the commercial kit also presents satisfactory results. However, this kind of sample is not suitable for in vivo use, since the procedure applied uses RNase from an animal source, which is not acceptable for the regulatory agencies and, in addition, it increases the costs of the process. Figure 6 shows that the bioactivity of the sc p53 encoding plasmid remains independent of the chromatographic method chosen and cells transfected with the isolated sc isoform presented higher p53 expression than cells transfected with a native sample (oc + sc). This kind of behavior presented by HeLa cells when transfected with the sc pDNA isoform has been already explored and reported by other authors [44,45], whicht reinforces the importance of working with the sc topology, the most active form of pDNA. This ability of sc pDNA isoforms to promote a higher protein expression has been related to the maintenance of the genetic information integrity [46], which can be different when a native pDNA sample is delivered. Furthermore, sc pDNA samples obtained from different chromatographic strategies induced different p53 protein expression levels. A higher value was achieved for the sc pDNA purified with the arginine–macroporous, followed by the histidine–monolith, and finally the pDNA recovered from the histidine–agarose support. Actually, the sc p53-pDNA purified by the arginine–macroporous matrix induced an expression of the p53 protein 4 times higher than the control. In addition, this sample was statistically more relevant when compared, for example, with the p53 protein expression promoted by the histidine–agarose sample. Considering these results and relating them with the quality control tests (Table 1), it is verified that, although the sc p53-pDNA sample purified by the arginine–macroporous matrix presents the lower purity level (92%), it induced a higher p53 protein expression. These results suggest that the kind of gradient or general conditions used during the plasmid purification process is of extreme importance for pDNA activity. The fact that milder conditions have been used, with a lower salt concentration and using a salt with lower environmental impact (NaCl), resulted in a non-significant effect on pDNA structure, which can be reflected in the pDNA bioactivity. Also, the low salt concentration used in the elution step (500 mM NaCl) required less manipulation of the sample during the desalting of the purified pDNA, possibly favoring the pDNA stability. Otherwise, samples purified through histidine–monolith and histidine–agarose, even with a higher purity level (100%) when compared with the samples recovered from arginine–macroporous support, showed lower efficiency at inducing the p53 expression. This result was even more pronounced for the sc p53-pDNA obtained by the histidine–agarose support, as the pDNA purified by the histidine–monolith resulted in a slightly higher p53 expression. This tendency can be related to the fact that the sc pDNA was eluted from the histidine–monolith with 0 M (NH4)2SO4, which also required lower desalting manipulation. In addition, the use of monoliths allowed the establishment of faster chromatographic runs, which can also help with the preservation of the structural stability of pDNA. In summary, it is clear that pH, ionic strength and type of salt, temperature, as well as manipulation time influence not only the structure of pDNA, but also its bioactivity.

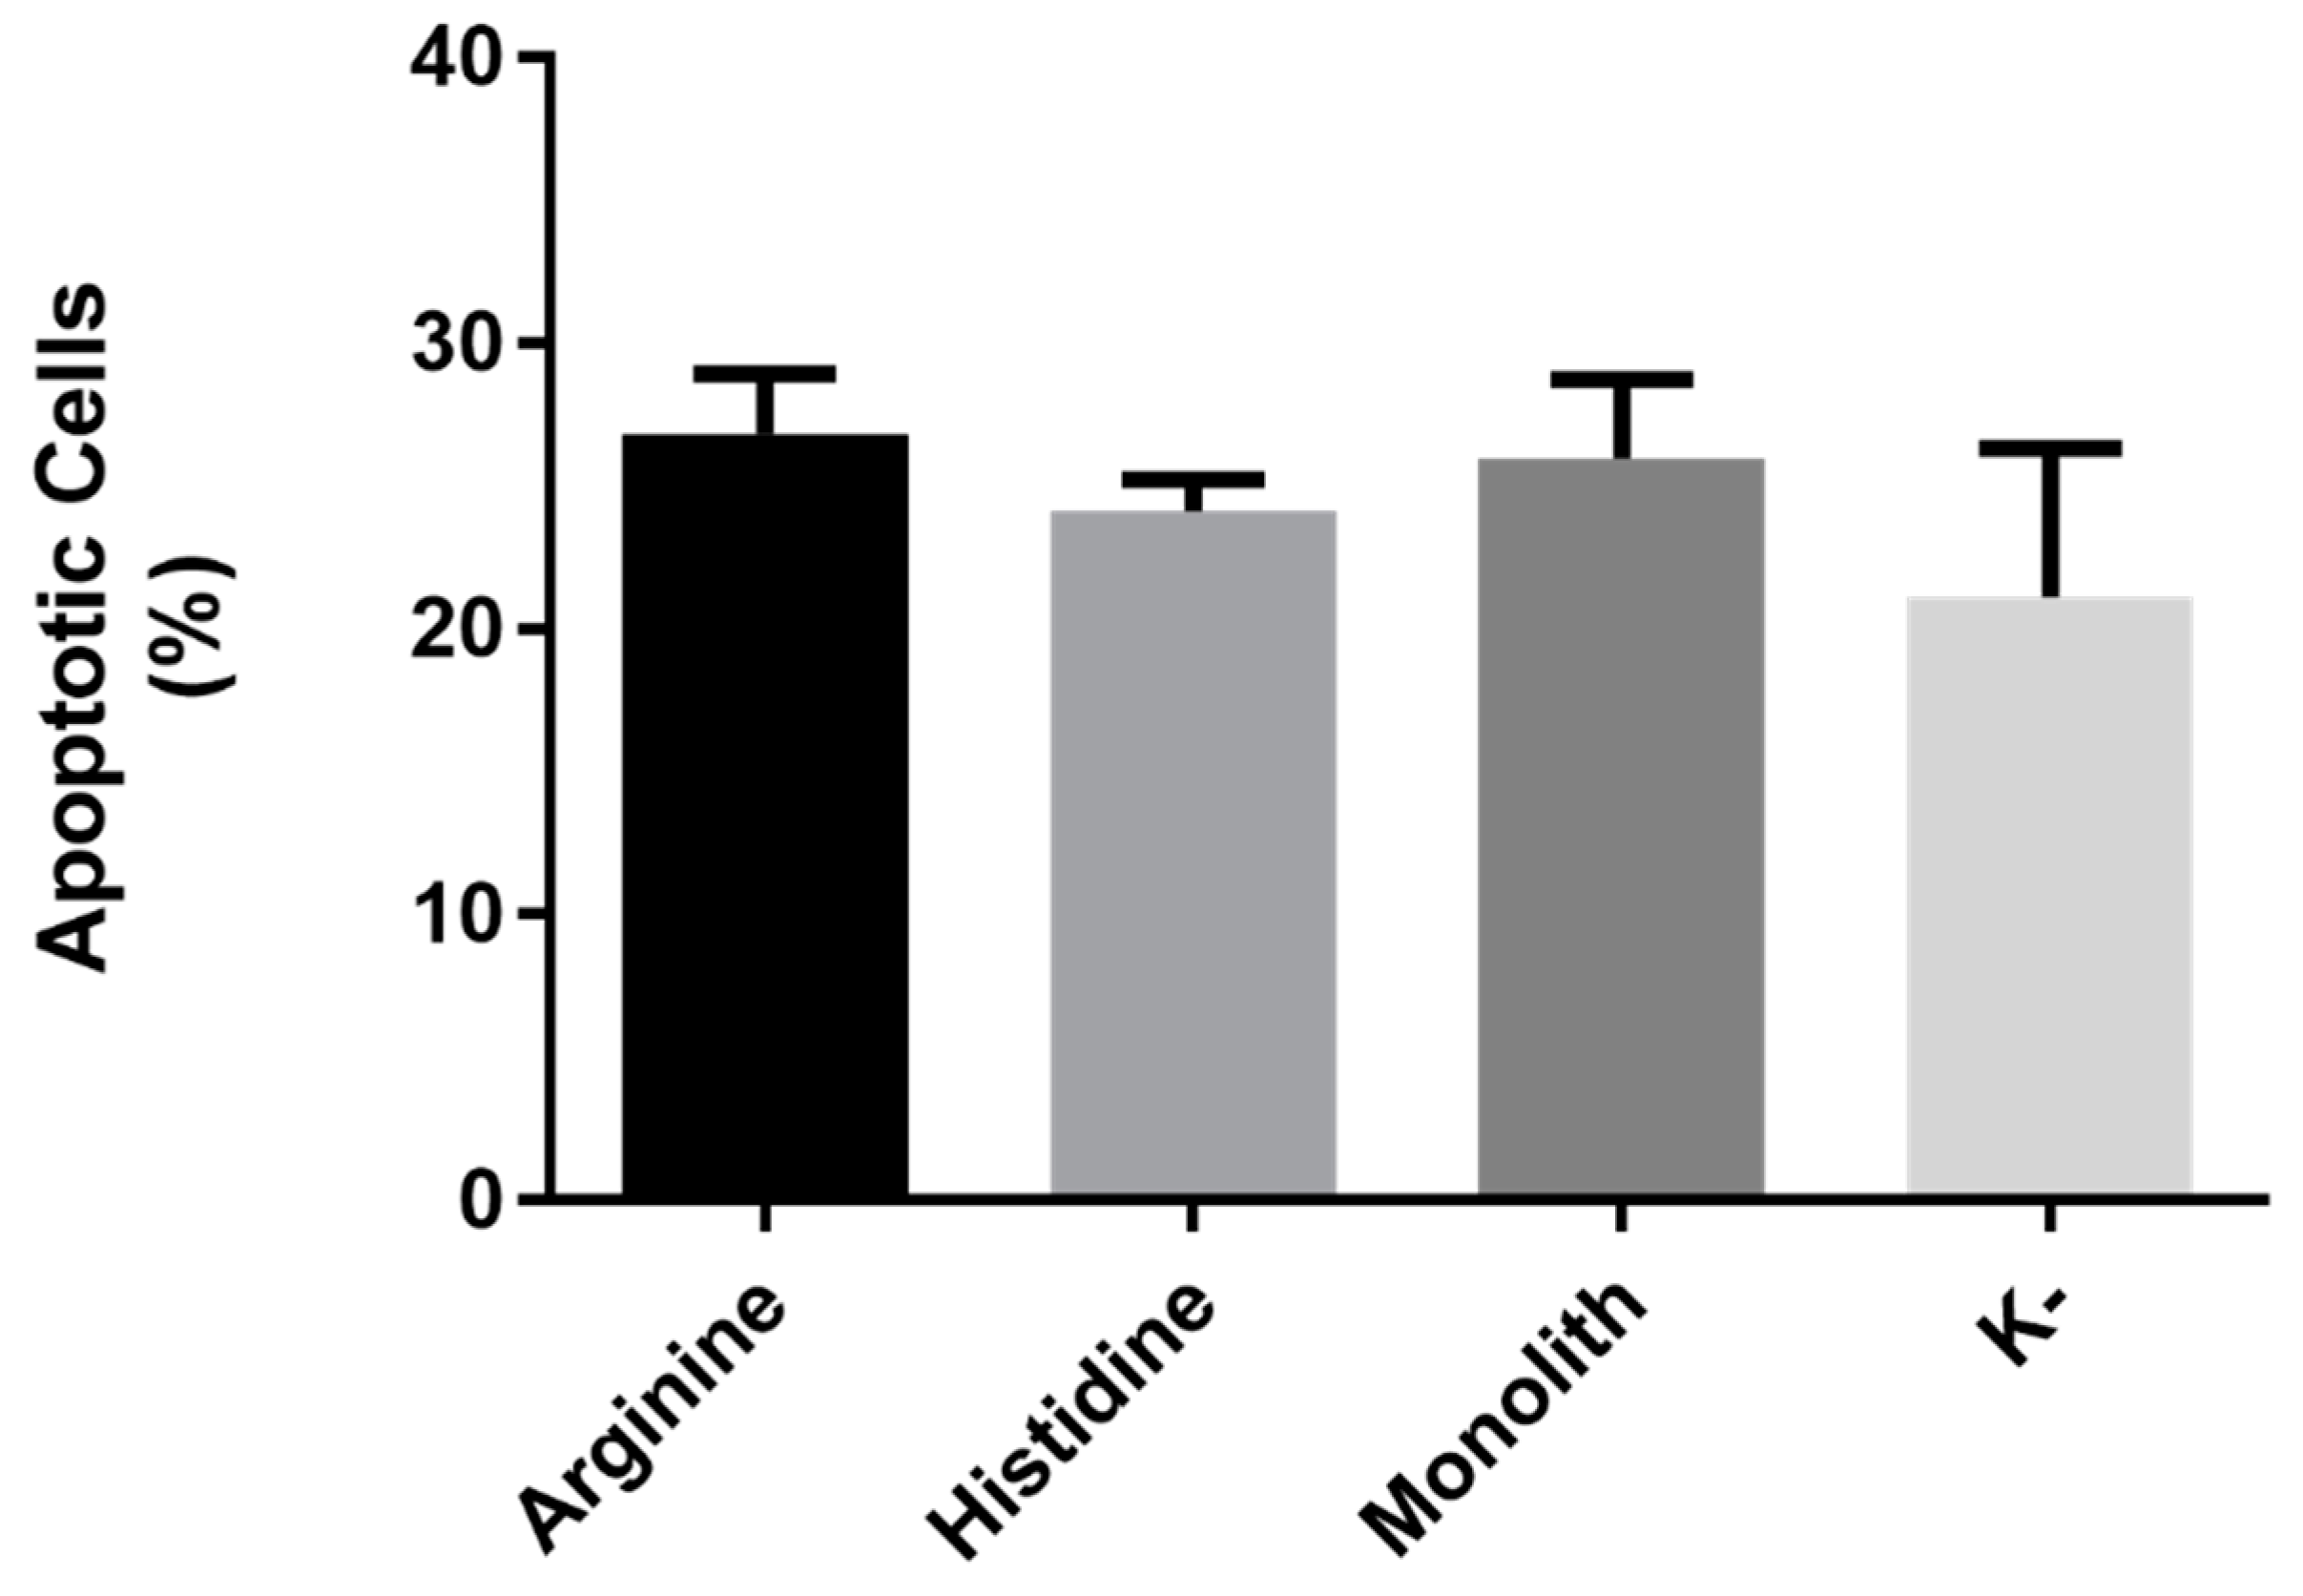
3.3.3. p53 Mediated Apoptosis in HeLa Cells

The cellular apoptosis mediated by the p53 protein was evaluated in HeLa cancer cells. Figure 7 shows the results of apoptosis concerning the pDNA products purified by the three different chromatographic matrices. The results reflect an apoptosis rate of approximately 6%, 3%, and 5% for cells transfected with pDNA purified by arginine–macroporous support, histidine–agarose, and histidine–monolith, respectively, when compared to the control group (K–). Comparing the results of p53 protein expression (Figure 6) with the apoptosis (Figure 7), it is possible to observe a pattern, because the conditions that allowed a higher p53 expression also resulted in higher rates of apoptosis mediated by the therapeutic gene, following the trend in the arginine–macroporous, histidine–monolith, and histidine–agarose samples. If we take into consideration the protein expression levels that were achieved, we could expect higher apoptosis rates, following transgene levels, but actually we observe relatively low levels of apoptosis. Although the literature reports that p53 is the major tumor suppressor gene, there are also other proteins involved in the pathway of apoptosis and the inactivity or reduced activity of any of these proteins could also compromise the apoptotic cycle. Although these were relatively low apoptotic values, it a higher apoptotic rate in cells transfected with sc pDNA purified from arginine–macroporous support was obtained, which also presented high expression levels of the therapeutic gene (Figure 6). However, if we consider the complexity of cancer, we understand that not only one, but several genes in the genome can be affected by different types of mutations and in the same way promoter sequences of these genes may be inactivated or even reduce the expression of a particular protein. There are known cases, such as colon, breast, brain, or pancreas cancers, which average 33 to 66 different types of genetic mutations and in other cases up to 200 types of genetic material damage are detected [47]. Based on this information, we may consider that other genes involved in the cascade that triggers apoptosis may also be inactivated. In addition, it is recognized that a cancer cell is in constant mutation, aiming at greater propagative advantage, guaranteeing not only suppression of any mechanism of programmed cell death but also the specialization of growth genes [48]. In a study that reveals the intricate genetic structure after successive mutational events occurring in HeLa cells almost 70 years after the extraction of the cells from the patient Henrietta Lacks, researchers have shown that genetic aberrations during these years may have unknown implications in biological experiments, since these cells have a genomic instability typical of tumors [49,50].

4. Conclusions

Three methods involving histidine–agarose, arginine–macroporous, and histidine–monolith supports were applied to isolate sc pDNA encoding p53, by manipulating the chromatographic conditions: pH, temperature, ionic strength, and kind of salt in the binding/elution buffers. These main parameters of the mobile phases influenced not only the physical structure of the plasmid but also the bioactivity of this therapeutic molecule. With the topology studies it was verified that, despite small non-significant differences detected by dichroism signals, the CD spectra clearly show that the B topology of pDNA was maintained in the samples purified through the three chromatographic supports. In zeta potential assay, the results suggested that the colloidal stability of purified samples inside formulations are preserved and the more stable formulation follow the order of the purification with histidine–monolith > arginine–macroporous > histidine–agarose. Overall, the bioactivity assays indicate that the arginine–macroporous seems to be the most efficient matrix used in this work, despite the 92% of purity degree and the 43% of recovery yield. In addition, cells transfected with this sample have a tendency to induce the expression of higher amounts of the therapeutic p53 protein and also induce higher levels of apoptosis in cancer cells. This behavior can be related to the chromatographic conditions, namely the use of a milder salt (NaCl), the low ionic strength, neutral pH, and the low temperatures used in arginine–macroporous when compared to the high ionic strength of ammonium sulfate and room temperature or acidic pH used in histidine-based columns. The data obtained in this work show the features of each purification condition and this information allows the elaboration of good chromatographic strategies based on arginine which, in addition to purifying pDNA with a high pharmaceutical grade, was efficient in preserving the bioactivity of the plasmid.

Author Contributions

G.M.A. and J.F.A.V. designed the concept and developed the practical work. A.S. helped on the measurability of the DNA bioactivity and P.P. and A.Q.P. helped on the structural analysis of the DNA. F.S. and J.A.Q. provided scientific and technical advice as well as critical revision of the manuscript. All authors provided critical feedback in the revision of the manuscript.

Funding

This work was supported by FEDER funds through the POCI—COMPETE 2020 Operational Programme Competitiveness and Internationalization in Axis I—Strengthening research, technological development, and innovation (Project POCI-01-0145-FEDER-007491), and National Funds by FCT Foundation for Science and Technology (Project UID/Multi /00709/2013). This work was also developed within the scope of the project CICECO-Aveiro Institute of Materials, FCT Ref. UID/CTM/50011/2019, financed by national funds through the FCT/MCTES. G.M. Azevedo acknowledges the support and fellowship of Conselho Nacional de Desenvolvimento Científico e Tecnológico (CNPq/203482/2014-0). J.F.A. Valente acknowledges the PhD fellowship (Ref SFRH/BD/96809/2013) from FCT.

Acknowledgments

The authors would like to thank Thomas Roberts for providing the pcDNA3–FLAG–p53 construct through Addgene, ref: 10838.

Conflicts of Interest

The authors declare no conflicts of interest.

References

  1. Tomczak, K.; Czerwińska, P.; Wiznerowicz, M. The Cancer Genome Atlas (TCGA): An immeasurable source of knowledge. Contemp. Oncol. 2015, 19, A68–A77. [Google Scholar] [CrossRef] [PubMed]
  2. Hanahan, D.; Weinberg, R.A. The hallmarks of cancer. Cell 2000, 100, 57–70. [Google Scholar] [CrossRef]
  3. Fouad, Y.A.; Aanei, C. Revisiting the hallmarks of cancer. Am. J. Cancer Res. 2017, 7, 1016–1036. [Google Scholar] [PubMed]
  4. Chen, F.; Wang, W.; El-Deiry, W.S. Current strategies to target p53 in cancer. Biochem. Pharm. 2010, 80, 724–730. [Google Scholar] [CrossRef]
  5. Kim, M.P.; Zhang, Y.; Lozano, G. Mutant p53: Multiple Mechanisms Define Biologic Activity in Cancer. Front. Oncol. 2015, 5, 249. [Google Scholar] [CrossRef]
  6. Kruse, J.P.; Gu, W. Modes of p53 regulation. Cell 2009, 137, 609–622. [Google Scholar] [CrossRef]
  7. Sousa, A.; Sousa, F.; Queiroz, J.A. Advances in chromatographic supports for pharmaceutical-grade plasmid DNA purification. J. Sep. Sci. 2012, 35, 3046–3058. [Google Scholar] [CrossRef]
  8. Hardee, C.L.; Arévalo-Soliz, L.M.; Hornstein, B.D.; Zechiedrich, L. Advances in Non-Viral DNA Vectors for Gene Therapy. Genes 2017, 8, 65. [Google Scholar] [CrossRef]
  9. Prazeres, D.M.F. Plasmid Biopharmaceuticals: Basics, Applications, and Manufacturing; John Wiley & Sons: Hoboken, NJ, USA, 2011. [Google Scholar]
  10. Doerfler, W.; Hohlweg, U.; Müller, K.; Remus, R.; Heller, H.; Hertz, J. Foreign DNA integration-perturbations of the genome—oncogenesis. Ann. New York Acad. Sci. 2001, 945, 276–288. [Google Scholar] [CrossRef]
  11. Petsch, D.; Anspach, F.B. Endotoxin removal from protein solutions. J. Biotechnol. 2000, 76, 97–119. [Google Scholar] [CrossRef]
  12. Briggs, J.; Panfili, P.R. Quantitation of DNA and protein impurities in biopharmaceuticals. Anal. Chem. 1991, 63, 850–859. [Google Scholar] [CrossRef] [PubMed]
  13. Sousa, F.; Prazeres, D.M.F.; Queiroz, J.A. Affinity chromatography approaches to overcome the challenges of purifying plasmid DNA. Trends Biotechnol. 2008, 26, 518–525. [Google Scholar] [CrossRef] [PubMed]
  14. Evans, R.K.; Xu, Z.; Bohannon, K.E.; Wang, B.; Bruner, M.W.; Volkin, D.B. Evaluation of degradation pathways for plasmid DNA in pharmaceutical formulations via accelerated stability studies. J. Pharm. Sci. 2000, 89, 76–87. [Google Scholar] [CrossRef]
  15. Kundu, S.; Mukherjee, S.; Bhattacharyya, D. Effect of temperature on DNA double helix: An insight from molecular dynamics simulation. J. Biosci. 2012, 37, 445–455. [Google Scholar] [CrossRef]
  16. Gjoerup, O.; Zaveri, D.; Roberts, T.M. Induction of p53-Independent Apoptosis by Simian Virus 40 Small t Antigen. J. Virol. 2001, 75, 9142–9155. [Google Scholar] [CrossRef]
  17. Dong, L.; LÜ, L.B.; Lai, R. Molecular cloning of Tupaia belangeri chinensis neuropeptide Y and homology comparison with other analogues from primates. Zool Res. 2013, 33, 75–78. [Google Scholar] [CrossRef]
  18. Diogo, M.M.; Queiroz, J.A.; Monteiro, G.A.; Martins, S.A.; Ferreira, G.N.; Prazeres, D.M. Purification of a cystic fibrosis plasmid vector for gene therapy using hydrophobic interaction chromatography. Biotechnol. Bioeng. 2000, 68, 576–583. [Google Scholar] [CrossRef]
  19. Pitiot, O.; Vijayalakshmi, M.A. Immobilized histidine ligand affinity chromatography. In Biochromatography; CRC Press: Boca Raton, FL, USA, 2002. [Google Scholar]
  20. Mota, É.; Sousa, Â.; Černigoj, U.; Queiroz, J.A.; Tomaz, C.T.; Sousa, F. Rapid quantification of supercoiled plasmid deoxyribonucleic acid using a monolithic ion exchanger. J. Chromatogr. A 2013, 1291, 114–121. [Google Scholar] [CrossRef]
  21. Konishi, M.; Kawamoto, K.; Izumikawa, M.; Kuriyama, H.; Yamashita, T. Gene transfer into guinea pig cochlea using adeno-associated virus vectors. J. Gene. Med. 2008, 10, 610–618. [Google Scholar] [CrossRef]
  22. Soares, A.; Queiroz, J.A.; Sousa, F.; Sousa, A. Purification of human papillomavirus 16 E6/E7 plasmid deoxyribonucleic acid-based vaccine using an arginine modified monolithic support. J. Chromatogr. A 2013, 1320, 72–79. [Google Scholar] [CrossRef]
  23. Sousa, F.; Matos, T.; Prazeres, D.M.F.; Queiroz, J.A. Specific recognition of supercoiled plasmid DNA in arginine affinity chromatography. Anal. Biochem. 2008, 374, 432–434. [Google Scholar] [CrossRef] [PubMed]
  24. Sousa, F.; Freitas, S.; Azzoni, A.R.; Prazeres, D.M.F.; Queiroz, J. Selective purification of supercoiled plasmid DNA from clarified cell lysates with a single histidine-agarose chromatography step. Biotechnol. Appl. Biochem. 2006, 45, 131–140. [Google Scholar] [PubMed]
  25. Amorim, L.F.A.; Gaspar, R.; Pereira, P.; Černigoj, U.; Sousa, F.; Queiroz, J.A.; Sousa, Â. Chromatographic HPV-16 E6/E7 plasmid vaccine purification employing L-histidine and 1-benzyl-L-histidine affinity ligands. Electrophoresis 2017, 38, 2975–2980. [Google Scholar] [CrossRef] [PubMed]
  26. Roettger, B.F.; Myers, J.A.; Ladisch, M.R.; Regnier, F.E. Adsorption Phenomena in Hydrophobic Interaction Chromatography. Biotechnol. Prog. 1989, 5, 79–88. [Google Scholar] [CrossRef]
  27. Sousa, F.; Tomaz, C.T.; Prazeres, D.M.F.; Queiroz, J.A. Separation of supercoiled and open circular plasmid DNA isoforms by chromatography with a histidine–agarose support. Anal. Biochem. 2005, 343, 183–185. [Google Scholar] [CrossRef]
  28. Luscombe, N.M.; Laskowski, R.A.; Thornton, J.M. Amino acid-base interactions: A three-dimensional analysis of protein-DNA interactions at an atomic level. Nucleic Acids Res. 2001, 29, 2860–2874. [Google Scholar] [CrossRef]
  29. Hoffman, M.M. AANT: The Amino Acid-Nucleotide Interaction Database. Nucleic Acids Res. 2004, 32, 174–181. [Google Scholar] [CrossRef]
  30. Ghanem, A.; Healey, R.; Adly, F.G. Current trends in separation of plasmid DNA vaccines: A review. Anal. Chim. Acta 2013, 760, 1–15. [Google Scholar] [CrossRef]
  31. Hirayama, C.; Sakata, M. Chromatographic removal of endotoxin from protein solutions by polymer particles. J. Chromatogr. B 2002, 781, 419–432. [Google Scholar] [CrossRef]
  32. Matsumae, H.; Minobe, S.; Kindan, K.; Watanabe, T.; Sato, T.; Tosa, T. Specific removal of endotoxin from protein solutions by immobilized histidine. Biotechnol. Appl. Biochem. 1990, 12, 129–140. [Google Scholar]
  33. Rajani, S.; Archana, R.; Indla, Y.R.; Rajesh, P. Beneficial Effects of Yogasanas and Pranayama in limiting the Cognitive decline in Type 2 Diabetes. Natl. J. Physiol. Pharm. Pharmacol. 2017, 7, 232–235. [Google Scholar] [PubMed]
  34. Wooddell, C.; Subbotin, V.M.; Sebestyén, M.G.; Griffin, J.B.; Zhang, G.; Schleef, M.; Braun, S.; Huss, T.; Wolff, J.A. Muscle damage after delivery of naked plasmid DNA into skeletal muscles is batch dependent. Hum. Gene Ther. 2011, 22, 225–235. [Google Scholar] [CrossRef] [PubMed]
  35. Thomas, T.; Kulkarni, G.D.; Gallo, M.A.; Greenfield, N.; Lewis, J.S.; Shirahata, A.; Thomas, T.J. Effects of natural and synthetic polyamines on the conformation of an oligodeoxyribonucleotide with the estrogen response element. Nucleic Acids Res. 1997, 25, 2396–2402. [Google Scholar] [CrossRef] [PubMed] [Green Version]
  36. Sousa, Â.; Pereira, P.; Sousa, F.; Queiroz, J.A. Binding mechanisms for histamine and agmatine ligands in plasmid deoxyribonucleic acid purifications. J. Chromatogr. A 2014, 1366, 110–119. [Google Scholar] [CrossRef] [PubMed]
  37. Diogo, M.M.; Queiroz, J.A.; Monteiro, G.A.; Prazeres, D.M. Separation and analysis of plasmid denatured forms using hydrophobic interaction chromatography. Anal. Biochem. 1999, 275, 122–124. [Google Scholar] [CrossRef] [PubMed]
  38. Davis, J.M. Critique of single amine theories: Evidence of a cholinergic influence in the major mental illnesses. Res. Publ. Assoc. Res. Nerv. Ment. Dis. 1975, 54, 333–346. [Google Scholar] [PubMed]
  39. Kejnovská, I.; Kypr, J.; Vorlíčková, M. Circular dichroism spectroscopy of conformers of (guanine + adenine) repeat strands of DNA. Chirality 2003, 15, 584–592. [Google Scholar] [CrossRef]
  40. Fernandes, H.P.; Cesar, C.L.; Barjas-Castro, M.L. Electrical properties of the red blood cell membrane and immunohematological investigation. Rev. Bras. Hematol. Hemoter. 2011, 33, 297–301. [Google Scholar] [CrossRef] [Green Version]
  41. Gumustas, M.; Sengel-Turk, C.T.; Gumustas, A.; Ozkan, S.A.; Uslu, B. Effect of Polymer-Based Nanoparticles on the Assay of Antimicrobial Drug Delivery Systems. In Multifunctional Systems for Combined Delivery, Biosensing and Diagnostics; Elsevier: Amsterdam, The Netherlands, 2017; pp. 67–108. [Google Scholar]
  42. Lu, G.W.; Gao, P. Emulsions and Microemulsions for Topical and Transdermal Drug Delivery. In Handbook of Non-Invasive Drug Delivery Systems; William, A., Ed.; Applied Science Publishers: London, UK, 2010; pp. 59–94. [Google Scholar]
  43. Honary, S.; Zahir, F. Effect of Zeta Potential on the Properties of Nano-Drug Delivery Systems-A Review (Part 1). Trop. J. Pharm. Res. 2013, 12, 255–264. [Google Scholar]
  44. Valente, J.F.A.; Sousa, A.; Gaspar, V.M.; Queiroz, J.A.; Sousa, F. The biological performance of purified supercoiled p53 plasmid DNA in different cancer cell lines. Process Biochem. 2018, 75, 240–249. [Google Scholar] [CrossRef]
  45. Gaspar, V.M.; Correia, I.J.; Sousa, Â.; Silva, F.; Paquete, C.M.; Queiroz, J.A.; Sousa, F. Nanoparticle mediated delivery of pure P53 supercoiled plasmid DNA for gene therapy. J. Control. Release 2011, 156, 212–222. [Google Scholar] [CrossRef] [PubMed]
  46. Schleef, M.; Schmidt, T. Animal-free production of ccc-supercoiled plasmids for research and clinical applications. J. Gene Med. 2004, 6, S45–S53. [Google Scholar] [CrossRef] [PubMed]
  47. Vogelstein, B.; Papadopoulos, N.; Velculescu, V.E.; Zhou, S.; Diaz, L.; Kinzler, K.W. Cancer genome landscapes. Science 2013, 339, 1546–1558. [Google Scholar] [CrossRef] [PubMed]
  48. Bertram, J.S. The molecular biology of cancer. Mol. Aspects Med. 2000, 21, 167–223. [Google Scholar] [CrossRef]
  49. Lucey, B.P.; Nelson-Rees, W.A.; Hutchins, G.M. Henrietta Lacks, HeLa cells, and cell culture contamination. Arch. Pathol. Lab. Med. 2009, 133, 1463–1467. [Google Scholar]
  50. Landry, J.J.; Pyl, P.T.; Rausch, T.; Zichner, T.; Tekkedil, M.M.; Stütz, A.M.; Jauch, A.; Aiyar, R.S.; Pau, G.; Delhomme, N.; et al. The genomic and transcriptomic landscape of a HeLa cell line. G3 Genes Genomes Genet. 2013, 3, 1213–1224. [Google Scholar] [CrossRef] [Green Version]
Figure 1. Schematic representation of the physical and chemical structures of the different chromatographic supports studied. (A) Histidine–agarose; (B) arginine–macroporous; (C) histidine–monolith.
Applsci 09 05170 g001
Figure 2. Chromatographic profiles and respective agarose gel electrophoresis of the p53-pDNA purification from an E. coli lysate using different chromatographic supports. (A)—Histidine–agarose matrix: the elution was performed by a decreasing stepwise gradient of 2.3 M (NH4)2SO4 in 10 mM Tris–HCl, pH 8.0, then 1.7 M (NH4)2SO4 in the same buffer, and finally 10 mM Tris–HCl, pH 8.0; (B)—Arginine–macroporous support: using an increasing stepwise gradient of 124 mM NaCl in 10 mM Tris–HCl, pH 8.0, then 500 mM of NaCl in the same buffer, and finally 2 M NaCl in Tris–HCl, pH 8.0; (C)—Histidine–monolith: in this support it was used 3 M (NH4)2SO4 in 10 mM citrate–EDTA, pH 5.0, then 2.52 M (NH4)2SO4 in the same buffer, and finally 10 mM citrate–EDTA, pH 5.0. In the agarose gel electrophoresis, lane L represents the lysate, and lanes 1, 2, and 3 represent the first, second, and third peaks of the respective chromatogram. MP*: Mobile phase; SP**: Stationary phase; RT: Room temperature.
Applsci 09 05170 g002
Figure 3. Circular dichroism spectra of p53-pDNA samples. Native pDNA open circular (oc) + supercoiled (sc) recovered from a commercial kit used as control, to confirm the stability of sc pDNA purified by: (A) histidine–agarose and arginine–macroporous supports; (B) histidine–monolith support. The pDNA control samples were prepared in the same buffer used for the purification of sc pDNA in each strategy (10 mM Tris–HCl, pH 8.0 or 10 mM citrate–EDTA buffer, pH 5.0).
Applsci 09 05170 g003
Figure 4. Zeta potential for pDNA purified by the three chromatographic strategies (histidine–agarose, arginine–macroporous, and histidine–monolith), using different buffers. A native pDNA sample (oc + sc) purified by a commercial kit was used for comparison.
Applsci 09 05170 g004
Figure 5. Evaluation of cell viability following transfection of HeLa and human dermal fibroblasts with lipofectamine 2000 lipoplexes loaded with p53-pDNA recovered from (A) histidine–agarose, (B) arginine–macroporous, and (C) histidine–monolith after 48 h transfection. Negative (k-) and positive controls (K+) correspond, respectively, to non-transfected cells and treated with ethanol. Data is represented as mean ± SD, n = 3.
Applsci 09 05170 g005
Figure 6. Evaluation of the p53 protein expression through ELISA kit in HeLa cancer cells after transfection with different p53-pDNA lipoplexes. Non-transfected cells were used as controls. Data are represented as mean ± SD, n = 3.
Applsci 09 05170 g006
Figure 7. p53-mediated apoptosis in HeLa cells after transfection with a sc p53 plasmid recovered from different chromatographic supports.
Applsci 09 05170 g007
Table 1. Purity analysis of the purified sample of supercoiled (sc) p53 encoding pDNA.
ParametersChromatographic SupportReference Values [9]
Histidine–AgaroseArginine–MacroporousHistidine–Monolith
Proteins (μg/mL)UndetectableUndetectableUndetectableUndetectable
RNAUndetectableUndetectableUndetectableUndetectable
Endotoxins (EU/μg pDNA)0.0100.0140.652<0.1 EU/μg pDNA
Genomic DNA (μg/μg pDNA)0.00080.00630.0009<0.01 μg/μg pDNA
Purity97%92%100%>90% of sc pDNA
Recovery42%43%71.6%Not applicable

