1. Introduction
Power system demands are increasing due to the increase in economic activities and national developments. With the increase in demand, power systems operators have upgraded their transmission systems to higher voltage levels in order to achieve economical and reliable power transfer between the generation side and the demand side [
1]. Therefore, high voltage and extra-high-voltage substations are widely deployed in modern systems, and their number will be greatly increased in the near future [
2]. Thus, gas insulated substations (GISs) have been widely used over the last three decades in power systems and other fields such as intelligent transportation systems, high-speed trains, and underground, because of their high reliability, easy maintenance, and small ground space requirements. The higher personal and operational safety level and easy installation and commissioning make high-voltage GISs in significant demand, particularly in heavily industrial areas, in comparison with conventional air insulated substations (AIS) [
3,
4,
5,
6,
7]. Although GISs have been involved in power systems for a long time, with the development of GISs and the voltage level of transmission lines, many new problems are occurring, such as very fast transient overvoltage (VFTO) caused by SF
6 discharge during switching operations in GISs. VFTO could cause damage to power devices. A reduction of the insulating capability of the dielectric gas in GISs is caused mainly by the peak magnitude and high-frequency oscillations of VFTO. The internal VFTO causes stress on the main insulation in the GIS, while the external VFTO poses a threat mainly to the main transformer and the secondary equipment within the substation [
8]. These transients have extremely short rise time, in the nanoseconds range.
Several methods have been considered to mitigate such overvoltages [
9,
10]. VFT suppression has been proposed by many researchers using a disconnector equipped with a damping resistor [
11], a disconnector with reduced voltage during the opening operation (the so-called trapped charge voltage (TCV)) [
12], surge arresters [
13,
14], high-frequency resonators [
15,
16], magnetic rings of different types [
17,
18,
19,
20], and VFTO mitigation by controlling the voltage conditions preceding voltage breakdown in SF
6 gas [
21,
22]. It could be well observed from the literature that an accurate design using the specific parameters of the GIS DS (Disconnector) contact system is required for VFTO mitigation by controlling the voltage conditions preceding voltage breakdowns in the disconnector contact system. As a consequence, additional costs will increase for new combinations.
Most of the suppression methods may require a change in GIS design and construction, which makes them complicated and expensive with low reliability. Disconnecting switches fitted with damping resistors and grounding switches were developed by Yamagata, Y. et al. [
23]. The amplitude of the VFTO was reduced by up to 25% after applying the damping resistor. However, the damping resistor method showed limitations because any increment of the resistance leads the VFTO to be decreased and the dimension of the disconnector to be increased. In addition, the dissipated power requirements for the resistor are increasingly high. Furthermore, the slow operating speed of the GIS DS (2–3 m/s) leads to nonability for arc extinction. As a result, the lifetime of the contactor is reduced because of these nanosecond arcs.
TCV has been noticed on the load side of the disconnector after the occurrence of the last re-strike when the disconnector opening operation is completed. Charge leakage across the insulators leads to decay of the trapped charge, which is a prolonged operation, taking hours or days. During the next closing operation of the disconnector, due to the slow contact speed, the first pre-strike occurs when the source side and the load side have the same voltage with different polarity, where the load-side voltage is TCV resulting from the previous operation. The main challenge in the TCV approach is the optimum design of the disconnector which should be considered to achieve significant VFTO reduction with an acceptable sparking time, as explained clearly by Chen, W. et al. [
24].
Moreover, surge arresters can suppress the amplitude of the VFTO, but they have no effect on the steepness. The difficulty in using surge arresters is implementing the optimum number of arrester discs for a noticeable damping effect and at a convenient location. The appropriate location of surge arresters in order to eliminate VFTO was investigated by Yadav, D.N. [
25].
It could be well seen from the literature [
15,
16] that the main disadvantage of the cavity resonator method is the absorption of VFTO energy in only a narrow band of its broad frequency spectrum. Consequently, there is no observed damping effect when the resonant frequency of the resonator does not fit the dominant harmonic component of the VFTO. However, compared with the ferrite ring method, the magnetic rings become saturated in high current under high frequency and lose their suppressing effect, as confirmed by Rama Rao, J. V. G. et al. [
26]. Furthermore, ferrite magnetic rings are still in the experimental stage, and they may have no obvious suppressing effect on VFTO.
As a consequence, in order to ensure the reliability of substations, it is essential to carry out research on suppressing VFTO. This paper presents a design of a damping busbar to suppress VFTO. We hollow out the conventional busbar to a spiral tube, and then the busbar conductor is changed into a series circuit with a multiturn hollow inductance coil and multiturn gap; based on this, paralleling the damping resistance with the newly designed spiral tube inductance circuit, the spiral tube damping busbar is formed. The mechanism of VFTO suppression by the proposed damping busbar is analyzed, and the distributed equivalent circuit is established. Furthermore, an illustrative structure of the damping busbar is introduced. VFTO with the proposed damping busbar is simulated, and the suppression effects before and after installing the damping busbar are compared. An improved design of the damping busbar is proposed, and a higher damping effect is verified.
The remainder of this paper is structured as follows. In
Section 2, the suppressing mechanism of the new method is analyzed. The simulation results and the damping effect of the damping busbar are discussed in
Section 3. In
Section 4, the influence of the inductance value of the damping busbar on suppressing VFTO is investigated. An improved design of the damping busbar in order to increase the suppression effect is proposed in
Section 5. This section presents an investigation on a spiral coil made of litz wire, used to damp VFTO. Such winding meets the requirement of sufficient resistance to damp VFTO.
Section 6 summarizes the damping effects of the damping busbar and the improved design. Finally, conclusions are drawn in
Section 7.
4. Inductance Effect on Suppressing VFTO
When VFTO passes through the inductance, the wavefront is smoothed, its steepness is reduced, and the amplitude is decreased. The inductance Li increases the round-trip time of the travelling wave, which in turn leads to a reduction in the high-frequency components of the VFTO. The travelling wave leads to a higher voltage on the inductance of the small circuit, which causes the parallel resistance to absorb the travelling wave energy, increase the consumption of active power, and reduce the amplitude of the VFTO.
The inductance value of the damping busbar is an important factor for an obvious VFTO suppression effect. The limitation on the steepness of the transients is a result of the inductance effect of the damping busbar.
Figure 8 describes the influence of the inductance value on VFTO suppression at the load side during transient phenomena.
The more considerable value of the equivalent inductance of the damping busbar leads to an obvious suppression effect.
Table 4 illustrates the transient characteristics of the VFTO waveform under an opening operation for different values of equivalent inductance of the damping busbar.
It can be observed that a higher damping effect was achieved by increasing the equivalent inductance of the damping busbar. Furthermore, increasing the inductance value can damp the VFT waveform’s front. It is also helpful for absorbing the sharp spikes of the VFT since surge arresters do not act quickly enough to prevent steep-fronted switching transients. Therefore, installing an additional spiral coil with the damping busbar is highly valuable to attenuating the effects of VFTs. For this reason, a spiral coil of resistive litz wire was designed to be installed in the helical groove and connected in series with the damping busbar.
5. The Improved Design of the Damping Busbar
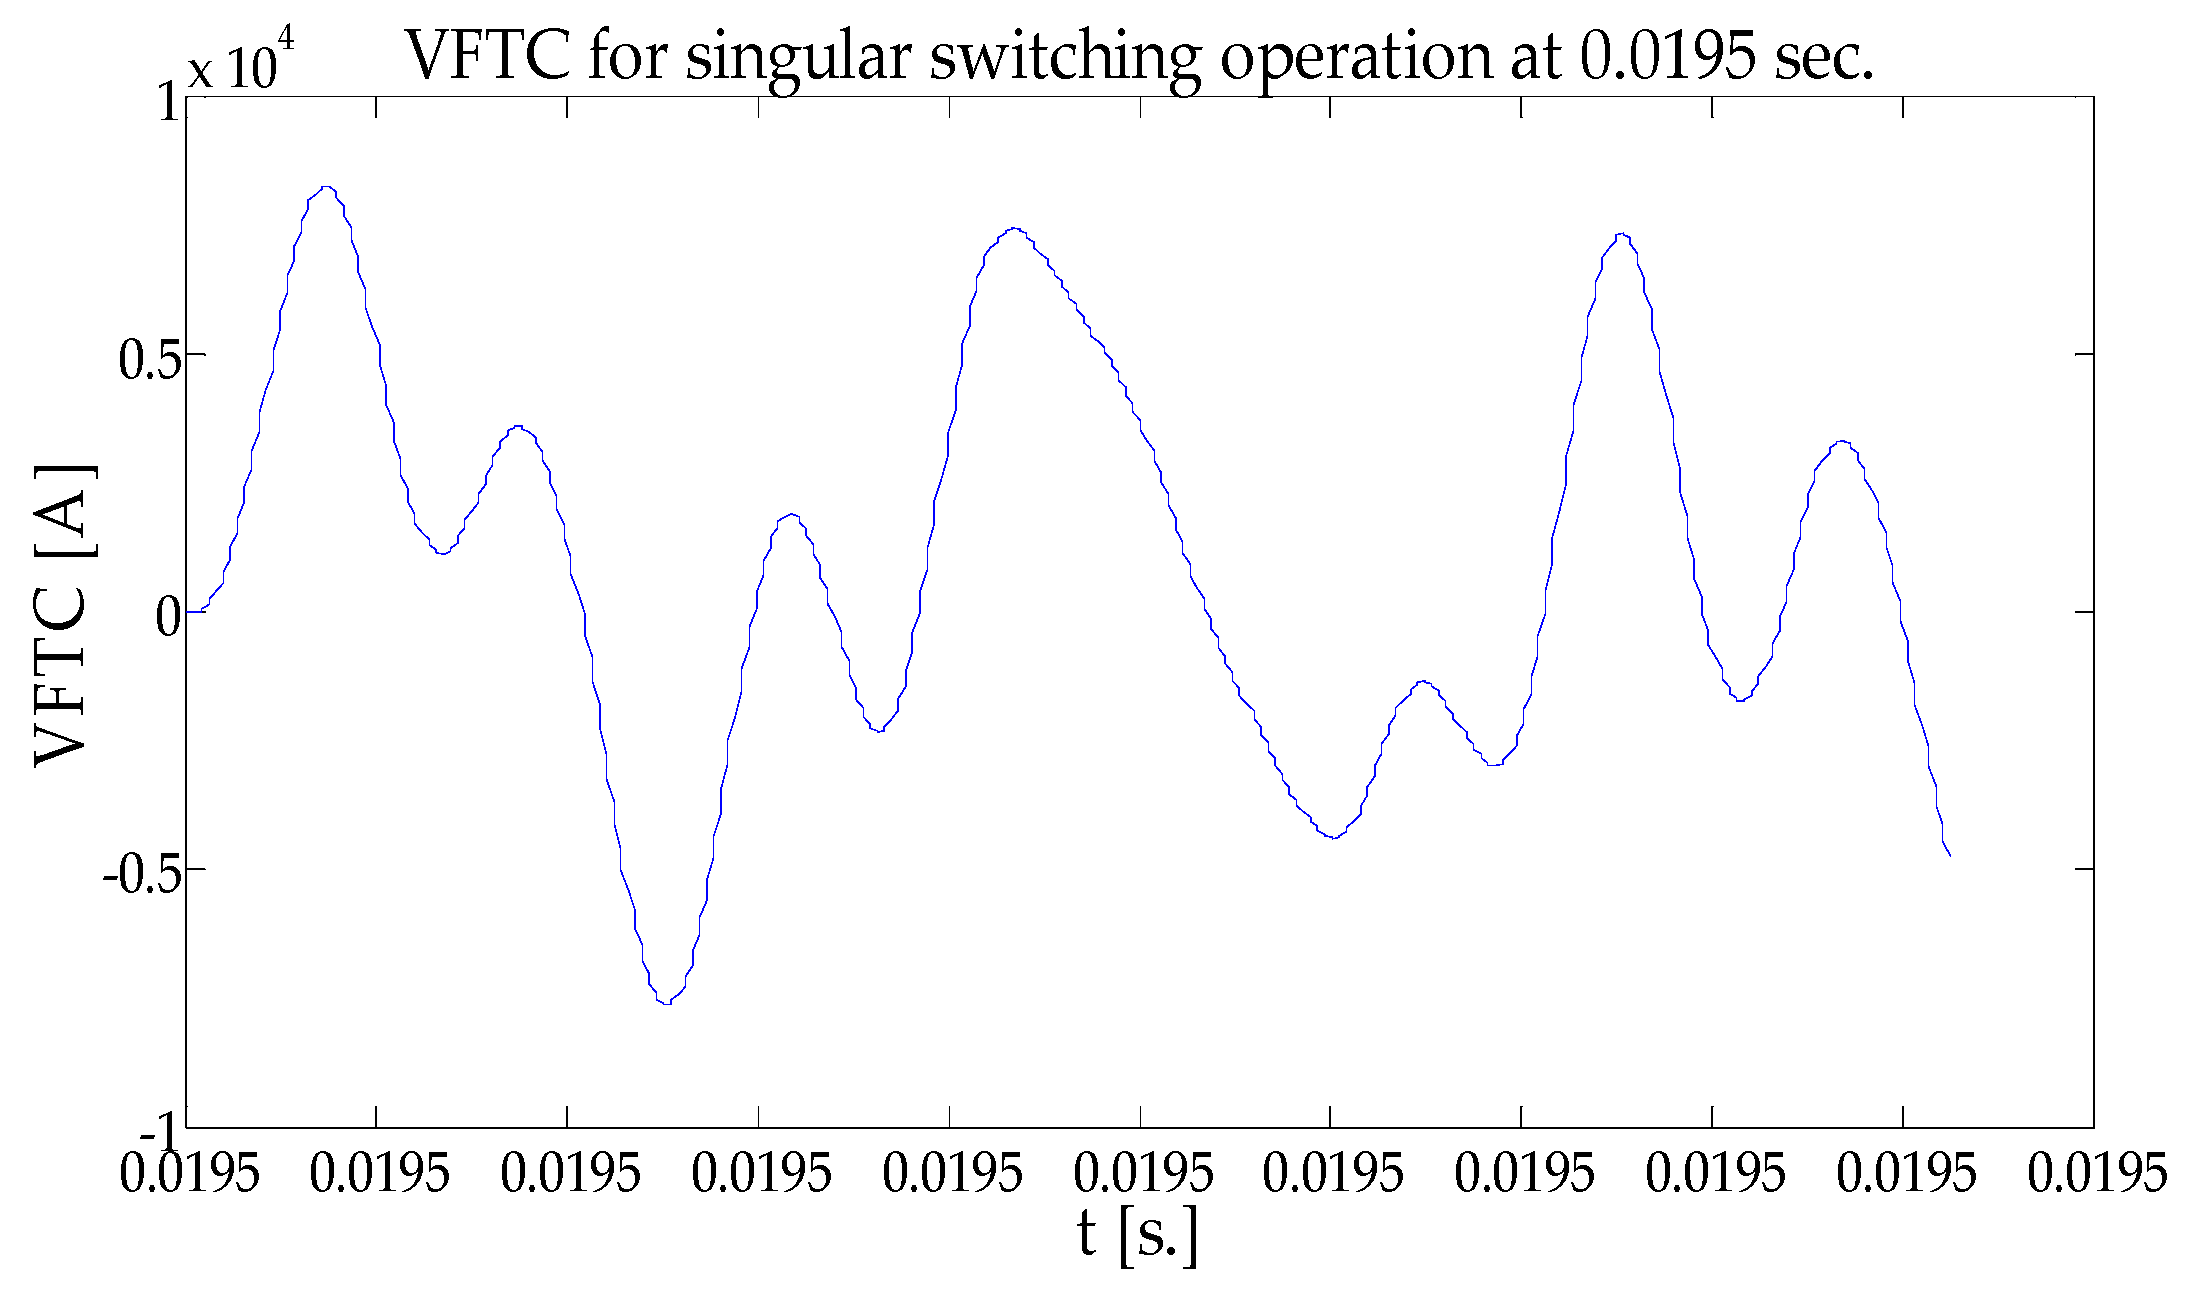
A further enhancement of the suppression effect was investigated by designing a spiral litz coil connected in series with the busbar, which increases the total inductance value. In order to design the spiral coil, an algorithm based on air-gap calculation was developed. This algorithm designs a spiral coil for a specific inductance value, which was determined as an input value. Other parameters, such as VFTC characteristics and the number of turns of the damping busbar, were also inserted in the input data.
Furthermore, litz wire was chosen for the improved design because it is mostly used for the frequency range 10 kHz to 2 MHz. The main advantage of this configuration is to minimize the power losses due to “skin and proximity effect”, and it is desirable in high-frequency applications as well. Sullivan, C.R. and Zhang, R.Y applied a simple method for a suitable litz wire design [
35]. The flowchart of the procedure used to calculate the spiral coil design parameters is shown in
Figure 9. By determining the inductance value and the number of turns, then magnetic flux density could be calculated. After that, the eddy power losses in the litz coil were calculated for the optimal design. However, we can divide the strand-level proximity effect into the internal proximity effect (the effect of other currents within the bundle) and the external proximity effect, but the total proximity effect may be considered a result of the total field at any given strand [
36,
37,
38]:
where
is the angular frequency,
is the length of the bundle,
is the resistivity of copper,
is the pitch of the twisting,
is the number of strands in a bundle,
is the diameter of each strand,
is the peak magnetic flux density, and
is the strand packing factor. Thus, the AC resistance factor,
, for a litz-wire winding for arbitrary waveforms and 2-D or 3-D field geometries can be expressed as follows:
The power loss in a stranded-wire winding is derived from , where As is the cross-sectional area of a strand. Consequently, by inserting the operating frequency, the AWG (American wire gauge) can be chosen (i.e., when frequency range is from 1.4 MHz to 2.8 MHz, then the best choice is AWG = 48), which means that about 70% loss reduction is achieved. Eddy power losses were calculated, and the final design was determined according to the critical factor (diameter of litz wire no more than the width of the spiral slot on the damping busbar surface).
The aim of calculating the air gap was to determine the magnetic flux density in order to calculate the power losses in the litz wire for the optimal design of the coil. Thus, for a typical design, we completed the following:
Determine Ac of the core, which was an aluminum cylinder (busbar body) in our study.
Determine the number of turns which was commensurate with the design.
Determine the inductance value which achieves an effective design to avoid saturation.
Calculate the air gap length as a first step to calculate the magnetic flux density in order to calculate the power loss in the litz wire for the optimal design of the coil. Thus, the length of the air gap was calculated by using Ampere’s law, as shown below:
Many different combinations of strand diameter and number of strands could be designed and manufactured for any given cost. Thus, the number of bundles and, finally, the litz coil diameter could be obtained using a critical condition (diameter of the litz wire no greater than the width of the spiral slot on the damping busbar surface). The previously described technique was used to calculate the litz coil design. Simulations were performed using MATLAB software by keeping the length of the coil, number of turns, and transient current parameters constant. The results are listed in
Table 5.
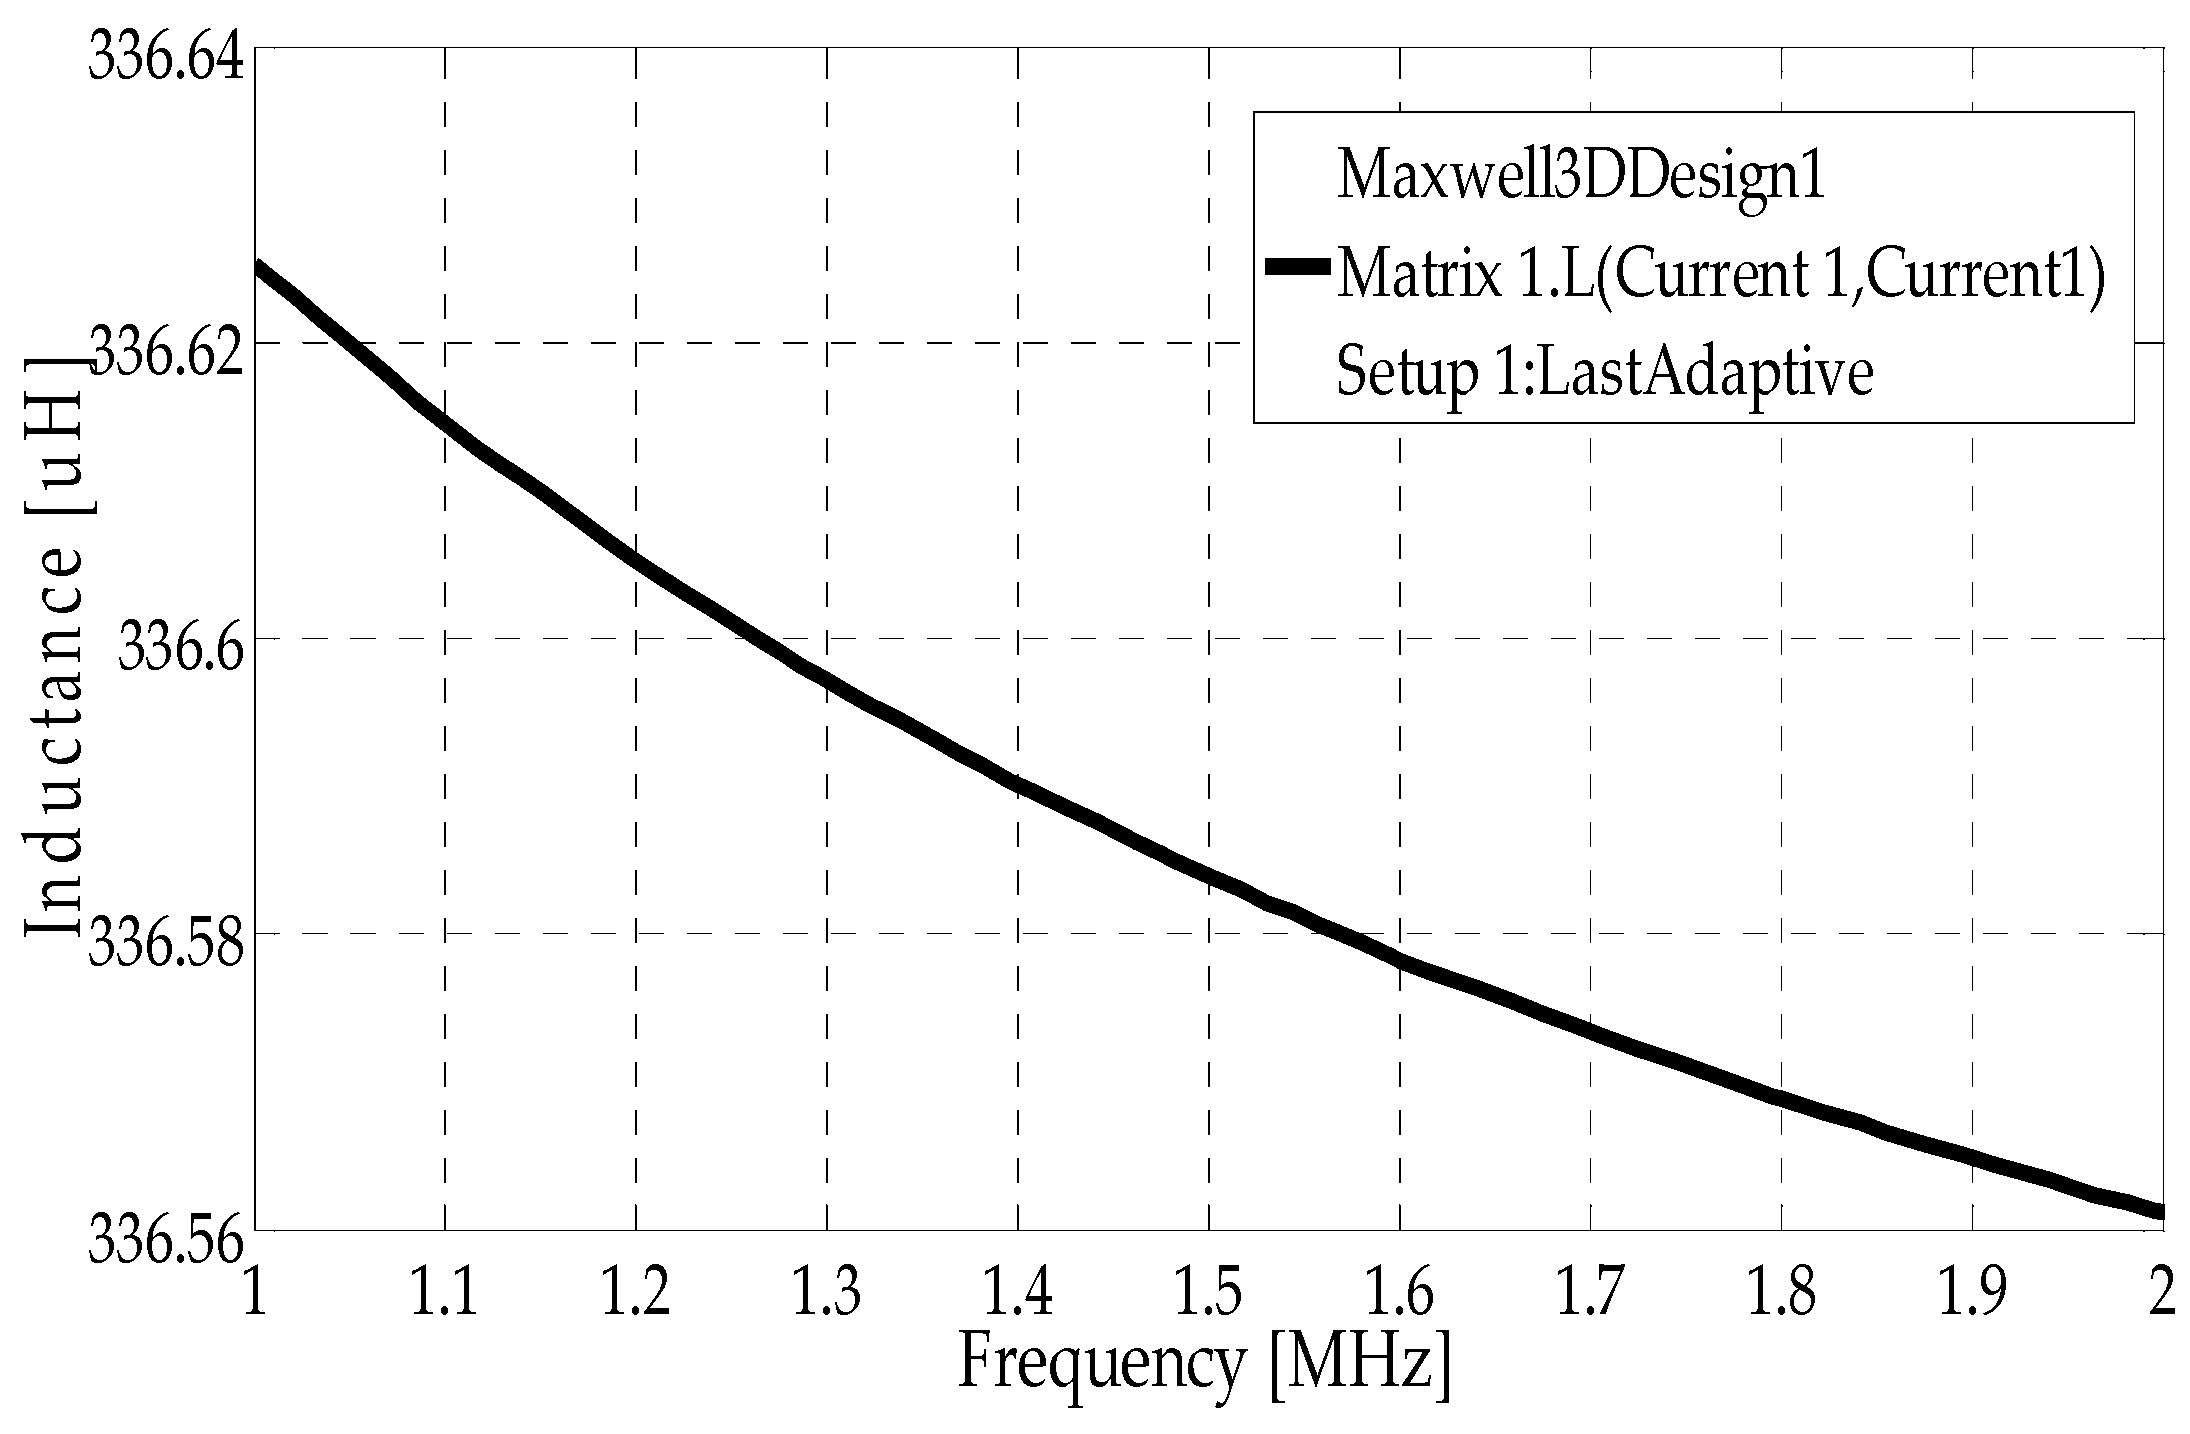
It is worth noting that the inductance value of both the damping busbar and the spiral litz coil was calculated at 2 MHz. An accurate choice of construction type of the litz design leads to a higher capability for greater current carrying capacities. The larger Type 2 and 3 litz designs have this essential feature for high-frequency power supply, inverter, and grounding applications. A Type 2 litz construction is distinguished by bundles of twisted wires together, while Type 3 features individually insulated bundles of Type 2 litz wire [
39]. As a consequence, in this study we aimed to add a spiral litz coil located in the sweeping spiral on the surface of the damping busbar in order to improve its performance in VFTO mitigation. EMTP simulation was carried out to study the VFTO with and without installing the improved damping busbar.
mH is the equivalent inductance of the spiral litz coil and
mH is the equivalent inductance of the damping busbar. Thus,
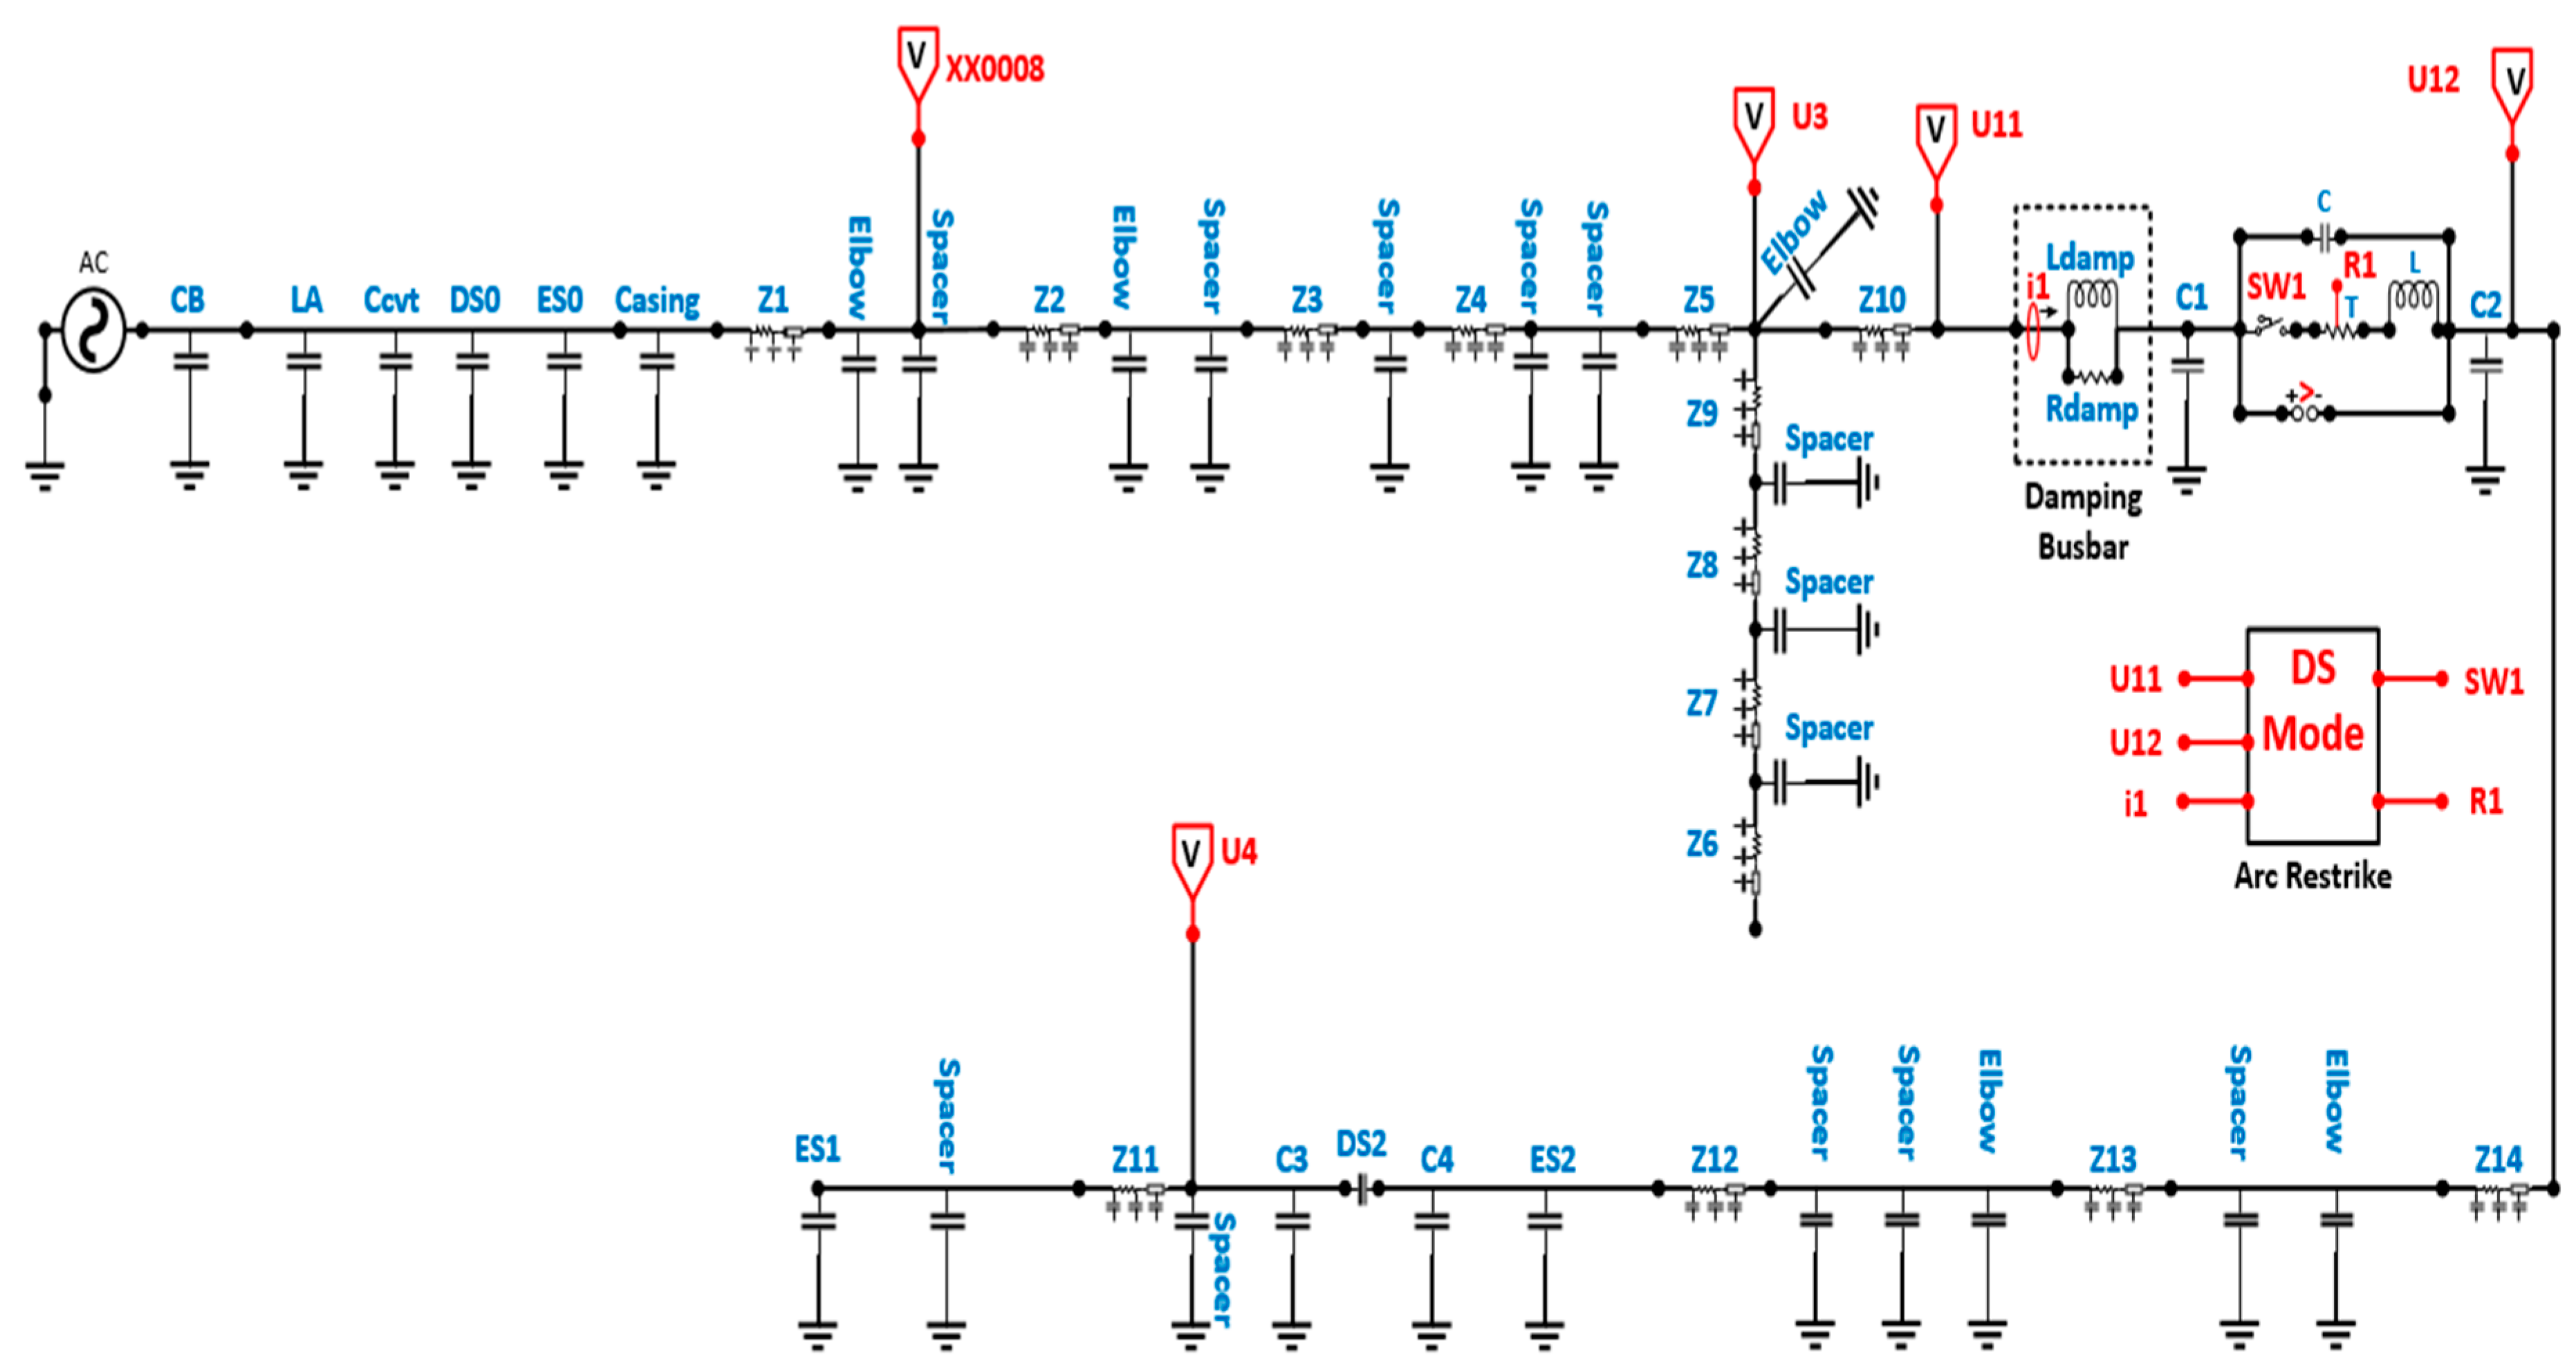
mH is the equivalent inductance of the improved damping busbar. The simulation was set up based on
mH, as presented in
Figure 6. Thus,
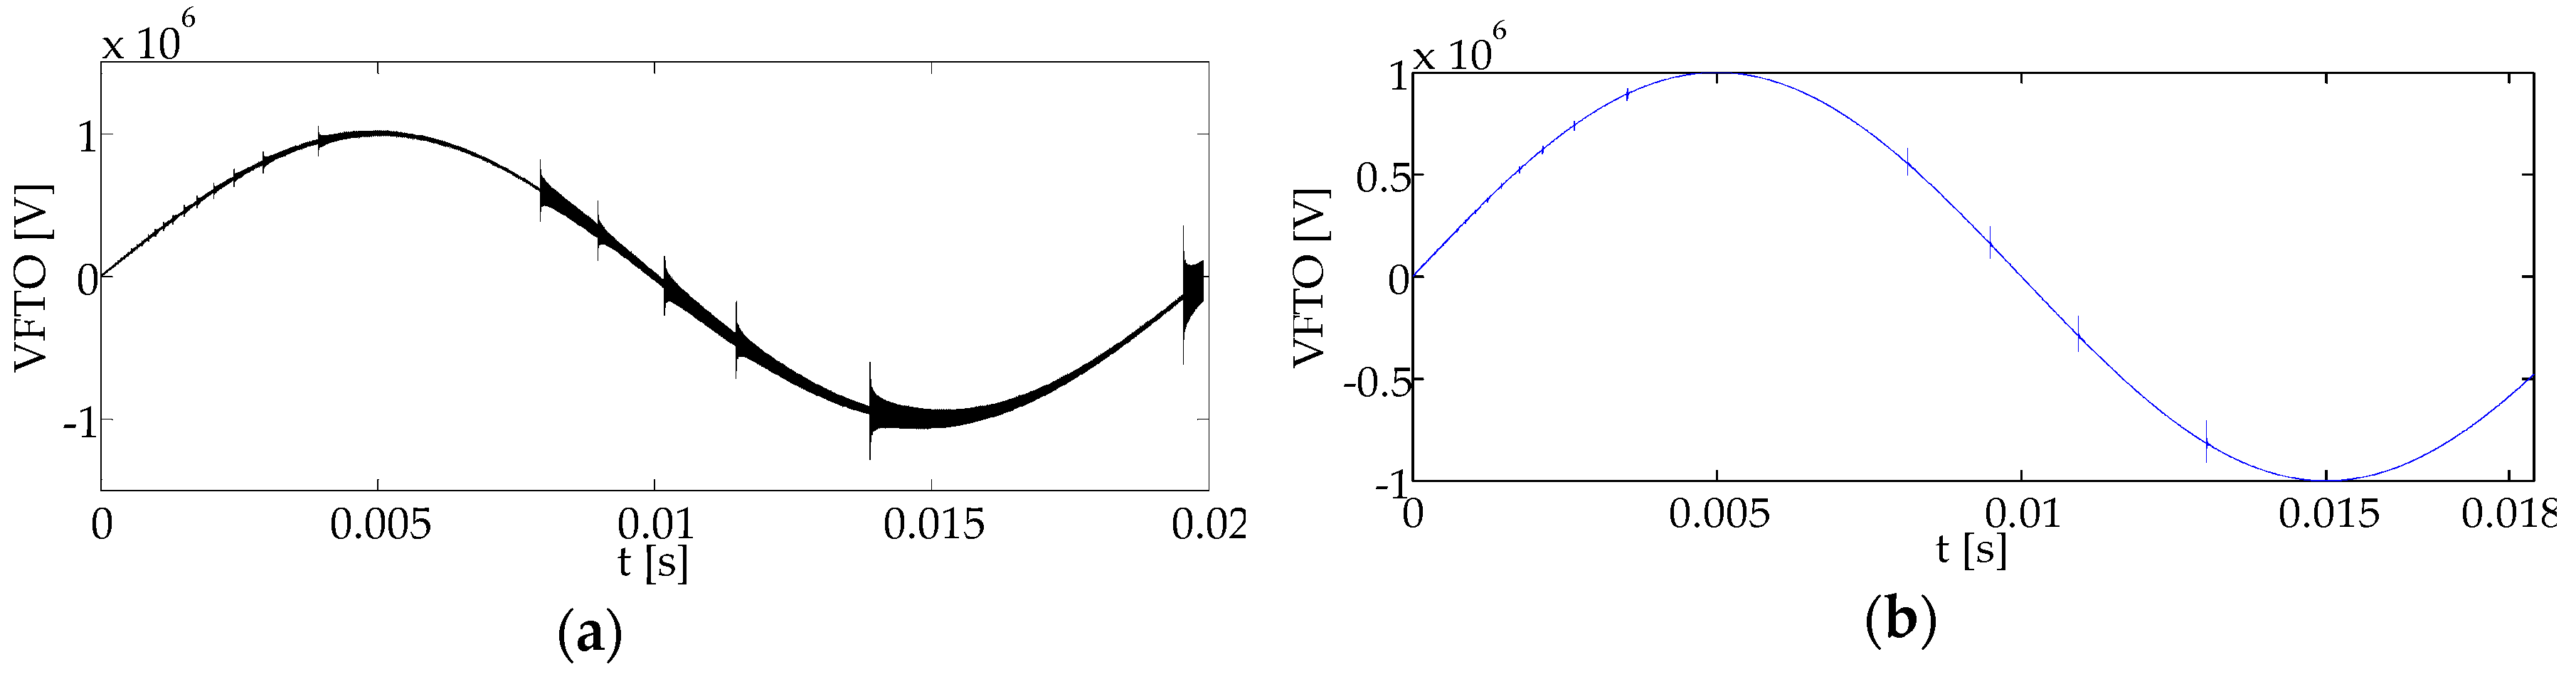
Figure 10b shows the higher damping effect of the improved damping busbar. In order to clarify the damping effect,
Figure 10d illustrates the damping effect of the improved damping busbar for a singular switching operation at approximately the same moment (0.013 s.). In order to clarify the higher damping effect shown in
Figure 10b, further details about the damping effect of the improved design are discussed in the next section.
6. Summary
In this work, a higher damping effect was investigated by designing a spiral litz coil connected in series to the damping busbar, which increased the total inductance value. The simulation results show that there was a considerable increase in the damping effect, as shown in
Figure 10. Furthermore, improving the design and material type could be useful to achieving an optimal suppressing effect. The main advantages of this improved design are the higher damping effect, accuracy, simplicity, and ability to be used in any existing GIS without any change in the GIS design or construction. The transient characteristics of the VFTO after adding a 0.1 mH litz coil are illustrated in
Table 6.
Another obvious advantage of this improved design is no magnetic saturation problem and mitigation of the overvoltage magnitude due to dissipation of the transient energy in the damping resistance. On the other hand, litz wire has been classified as a cost-effective choice to reduce eddy current loss in high-frequency transformer and inductor windings. Some solutions could be successful in increasing the dielectric strength for a high voltage level or for safety requirements, like adding thermoplastic insulation such as PTFE, which could be used for bundle insulation on litz wire in some applications [
36].
The proposed improved damping busbar has limitations when thermoplastic insulation is added due to the extra cost. So, in future work, it will be fundamental to develop the design to improve the estimation quality to meet the industry’s requirements for low costs. However, compared with other existing expensive VFTO suppression methods that require changes in GIS design and construction, the proposed method can be easily implemented in any existing GIS without any change in its structure, making it very cost-effective. Therefore, it is necessary to use simulation calculations to optimize the insulation reliability of the uniform electric field and increase the insulation of the busbar.
Table 7 shows the mitigation effect of different damping methods, including the new method.
7. Conclusions
A new method to suppress VFTO was proposed, called a damping busbar. The mechanism of this new method was analyzed. A calculation method for the self-inductance of the damping busbar at high frequency was presented. Moreover, the inductance effect of the damping busbar on VFTO suppression was studied as well. As a result, the amplitude of the VFTO was reduced by approximately 27% after applying the damping busbar. A further enhancement of the suppression effect was investigated by designing a spiral litz coil connected in series with the busbar, which increased the total inductance value. Consequently, a good damping effect was achieved by utilizing the inductive and resistance arrangement which was formed by the improved design of the spiral tube damping busbar. The conclusions are as follows.
We proposed a new design which has a significantly better damping effect when compared with other existing suppression methods. The proposed damping busbar can be easily implemented in any existing GIS without any change in its structure and is therefore very cost-effective.
We investigated a calculation method for the self-inductance at high frequency.
We improved the performance of the damping busbar by adding a spiral litz coil connected in series with the busbar in order to enhance the suppression effect, and we developed an algorithm based on air gap calculation to design the litz coil.
We compared the damping effect with and without the damping busbar and the improved design.
However, research on improving the proposed design to increase the equivalent inductance value by increasing the length of the busbar and the number of turns has to be considered. Many different adaptations, tests, and experiments should be investigated in future work (i.e., experimental study of a 1000 kV GIS station VFTO after installing the improved damping busbar).


