Article

Hypermethylation of Circulating Free DNA in Cutaneous Melanoma

by
Russell J. Diefenbach
1,2,*,
Jenny H. Lee
1,2,
David Chandler
3,
Yinan Wang
3,
Christian Pflueger
4,5,
Georgina V. Long
2,6,7,8,
Richard A. Scolyer
2,6,7,9,
Matteo S. Carlino
2,6,10,
Alexander M. Menzies
2,6,8,
Richard F. Kefford
2,6,11 and
Helen Rizos
1,2
1
Department of Biomedical Sciences, Faculty of Medicine and Health Sciences, Macquarie University, Sydney, NSW 2109, Australia
2
Melanoma Institute Australia, The University of Sydney, Sydney, NSW 2065, Australia
3
Australian Genome Research Facility, Victorian Comprehensive Cancer Centre, 305 Grattan St, Melbourne, VIC 3000, Australia
4
Australian Research Council Centre of Excellence in Plant Energy Biology, School of Molecular Sciences, The University of Western Australia, Crawley, WA 6009, Australia
5
Harry Perkins Institute of Medical Research, Nedlands, WA 6009, Australia
6
Sydney Medical School, University of Sydney, Sydney, NSW 2006, Australia
7
Sydney Medical School, The University of Sydney, Sydney, NSW 2006, Australia​
8
Department of Medical Oncology, Northern Sydney Cancer Centre, Royal North Shore Hospital, Sydney, NSW 2065, Australia
9
Department of Tissue Pathology and Diagnostic Oncology, Royal Prince Alfred Hospital and NSW Health Pathology, Sydney, NSW 2050, Australia
10
Crown Princess Mary Cancer Centre, Westmead and Blacktown hospitals, Sydney, NSW 2145, Australia
11
Department of Clinical Medicine, Faculty of Medicine and Health Sciences, Macquarie University, Sydney, NSW 2109, Australia
*
Author to whom correspondence should be addressed.
Appl. Sci. 2019, 9(23), 5074; https://doi.org/10.3390/app9235074
Submission received: 17 August 2019 / Revised: 9 November 2019 / Accepted: 21 November 2019 / Published: 25 November 2019
(This article belongs to the Special Issue Circulating Biomarkers)

Abstract

:
Changes in DNA methylation are well documented in cancer development and progression and are typically identified through analyses of genomic DNA. The capability of monitoring tumor-specific methylation changes in circulating tumor DNA (ctDNA) has the potential to improve the sensitivity of ctDNA for the diagnosis and prognosis of solid tumors. In this study we profiled the methylation of seven gene targets (all known to be hypermethylated in metastatic melanoma) within the plasma of patients with advanced melanoma using amplicon-based next generation sequencing of bisulfite-treated DNA. Hypermethylation of 6/7 gene targets, including paraoxonase 3 (PON3) was significantly elevated in patients with metastatic melanoma (n = 4) compared to healthy control samples (n = 5). In addition, the degree of hypermethylation of PON3 and MEOX2 were significantly correlated with ctDNA copy number in melanoma patients, confirming the utility of methylated ctDNA in the absence of tumor mutation data for genes such as BRAF, RAS or EGFR.

1. Introduction

Molecular analyses of circulating DNA, RNA, proteins, vesicles or cells as liquid biopsies is a rapidly developing modality for monitoring disease progression, treatment response and tumor heterogeneity [1,2]. Circulating tumor DNA (ctDNA) is highly fragmented DNA that is derived from tumor cells and tends to increase in abundance with increasing total patient tumor burden [3,4]. Baseline and on-treatment ctDNA is predictive of response to targeted and immunotherapies in many cancers [5,6,7,8], can monitor tumor heterogeneity and the expansion of therapy resistant tumor subclones [9,10,11], and predicts recurrence and survival following curative resection [12,13].
The detection and monitoring of ctDNA using mutation-detection techniques such as droplet digital PCR (ddPCR) and targeted next generation sequencing panels has been well documented [14,15]. One remaining challenge remains is the sensitivity of ctDNA detection, as it often accounts for less than 0.1% of the total circulating free DNA, has a short half-life of only a few hours and amounts can vary depending on cancer type and stage, tumor burden and location, vascularity and cellular turnover [3]. As a result, ctDNA does not reliably detect patients with early stage cancer [3] or with post-treatment minimal residual disease [16] and often requires a known target mutation for detection, e.g., BRAF V600E.
Analysis of epigenetic DNA modifications, such as methylation, is a promising approach for improving ctDNA sensitivity given the high degree of methylation concordance between circulating free DNA and tissue-derived genomic DNA [17,18,19,20,21]. Moreover, epigenetic changes are important in tumor development and progression as these epigenetic changes regulate gene expression, often via the methylation of cytosine residues within CpG islands of gene promoter regions [22]. Analysis of DNA methylation requires bisulfite conversion which enables subsequent discrimination of methylated and unmethylated cytosine residues. Although bisulfite conversion can result in significant loss of DNA due to fragmentation and degradation, a recent study confirmed that the EZ DNA Methylation-Direct kit was optimal for bisulfite conversion and recovery of low molecular weight DNA such as circulating free DNA [23].
In this study, we developed an efficient ctDNA methylation analysis workflow that utilizes the EZ DNA Methylation-Direct kit for conversion of small amounts of low molecular weight DNA (~20 ng) followed by MiSeq next generation sequencing to examine the methylation status of individual CpG sites within a panel of seven genes. Methylation of these genes (GJB2, HOXA9, MEOX2, OLIG3, PON3, RASSF1 and TFAP2B) has been associated with melanoma progression and/or poor survival [24,25]. In contrast to previous studies analyzing circulating free DNA methylation [20,26,27,28], we examined the methylation of symmetrical CpG sites in both DNA strands to accurately quantify the level of gene methylation. Given the clinical potential of ctDNA detection in melanoma [2,29] and the fact that promoter methylation contributes to the progression of melanoma [30], we focused on monitoring the methylation status of circulating free DNA in metastatic melanoma patients to identify melanoma-specific methylation patterns.

2. Materials and Methods

2.1. Plasma Preparation

Written consent was obtained from all healthy individuals under an approved Human Research ethics committee protocol from Macquarie University (5201300412). Written consent was obtained from all melanoma patients under approved Human Research ethics committee protocols from Royal Prince Alfred Hospital (Protocol X15-0454 and HREC/11/RPAH/444). Blood (10 mL) was collected in EDTA tubes (Becton Dickinson, USA, Franklin Lakes, NJ, USA) and processed within 4 h from blood draw. Tubes were spun at 800 g for 15 min at room temperature. Plasma was then removed into new 15 mL tubes without disturbing the buffy coat and respun at 1600 g for 10 min at room temperature to remove cellular debris. Plasma was stored in 1–2 mL aliquots at −80 °C.

2.2. Purification of Circulating Free DNA from Plasma

Plasma circulating free DNA was purified using the QIAamp circulating nucleic acid kit (Qiagen, Hilden, Germany) according to the manufacturer’s instructions. For healthy individuals, circulating free DNA was purified from 4 mL of plasma, and the final elution volume was 50 μL. For melanoma patients, circulating free DNA was purified from 1–2 mL of plasma, and the final elution volume was 30–40 μL. Total circulating free DNA was subsequently quantified using a Qubit dsDNA high sensitivity assay kit and a Qubit fluorometer 3 (Life Technologies, Carlsbad, CA, USA) according to the manufacturer’s instructions.

2.3. Analysis of ctDNA from Plasma

The copy number of ctDNA per ml of plasma was analyzed using the QX200 ddPCR (Bio-Rad, Hercules, CA, USA) system to detect tumor-associated BRAF V600E/K or NRAS Q61K/R mutations, as previously described [6]. The ctDNA copy number/mL of plasma was determined with Quantasoft software version 1.7.4 (Bio-Rad, Hercules, CA, USA) using a manual threshold setting.

2.4. PCR Primer Design

The primers (listed in Table S1) were designed based on Genome Reference Consortium Human Build 38 patch release 12 (GRCh38.p12). The primers were designed by conducting similarity searches of the target sequences against the human genome reference using BLAST (https://blast.ncbi.nlm.nih.gov/Blast.cgi) selecting ~200 bp either side of the reference and then importing that into Pyromark Assay Design software version 2.0.1.15 (Qiagen, Hilden, Germany, 2008). Primers were selected with the aid of the software’s algorithms to amplify amplicons of approximately 100 bp in length. This software aided in design of primers for both bisulfite converted Watson (upper) and Crick (lower) DNA strands. For the RASSF1 gene primers of sufficient quality (as assigned by the software) could only be designed for the Crick strand. A pair of primers to Lambda DNA were provided by the Lister laboratories (University of Western Australia). All primers were purchased as desalted, sequencing grade from Integrated DNA Technologies (Coralville, IA, USA).

2.5. Sample QC and Preparation

Quality and concentration of circulating free DNA samples was determined by GXII Labchip (Perkin Elmer, Waltham, MA, USA) on an Extended Range chip with Hisense DNA reagents.

2.6. Bisulfite Conversion of DNA

A total of 15–25 ng circulating free DNA was spiked with 0.1 ng of Lambda DNA, made up to 20 µL with MilliQ water and then bisulfite converted using the EZ DNA Methylation-Direct Kit (Zymo Research, Irvine, CA, USA) according to the manufacturer’s instructions. All samples were eluted from one spin-column in two 15 µL aliquots for a total volume of 30 µL.

2.7. PCR Amplification

DNA regions of seven genes (total of 13 amplicons listed in Figure S1) and a region of Lambda DNA were amplified from the bisulfite converted DNA. A mixed methylation amplification control sample was prepared by mixing 1:1 bisulfite treated methylated human DNA (cat# 59655, Qiagen, Hilden, Germany) and bisulphite treated unmethylated human DNA (cat# 59665, Qiagen, Hilden, Germany). The controls were supplied at 10 ng/μL and prepared by Qiagen proprietary methods. A no template water control (NTC) was included in all amplification reactions.
Amplifications were performed in 20 µL reactions with 2 µL of bisulfite converted DNA and 0.5 µM primers using Pyromark PCR mastermix (Qiagen, Hilden, Germany). Cycling conditions consisted of an initial denaturation step of 15 min at 95 °C followed by 45 cycles of denaturation at 94 °C for 30 s, annealing at 56 °C for 30 s and extension at 72 °C for 30 s. A final extension step at 72 °C was performed for 10 min. All gene amplicons were less than 200 bp in length (see Figure S1 for a full list of the amplicon sequences), the Lambda amplicon was 425 bp.

2.8. Library Construction

All amplification reactions (including NTC) were purified with 2X Agencourt AMPure XP magnetic beads (Beckman Coulter, Brea, CA, USA) and resuspended in 20 µL of water. Concentrations were assessed by a Qubit dsDNA high sensitivity assay kit as described above and amplicon size by agarose gel electrophoresis. Amplicons for each sample were then pooled in equimolar amounts into a total volume of 55 µL. The pool was again purified with 2X AMPure XP and resuspended in 30 µL of water and assessed using both agarose gel QC and Tapestation (Agilent, Santa Clara, CA, USA). 50 ng of each purified pool was used to generate libraries. The purified NTC amplifications were pooled and the maximum input volume was used for library preparation. The purified amplicons were processed with the TruSeq DNA Nano reagent kit (Illumina, San Diego, CA, USA), according to the manufacturer’s instructions with the following changes:
(1)
No shearing of the DNA
(2)
No removal of large and small DNA fragments (i.e., no size selection).

2.9. Library QC

Purified libraries were tested for quality on a GXII Labchip (Perkin Elmer, Waltham, MA, USA). The concentration of each library was assessed by qPCR using the KAPA KK4835 ABI Prism™ qPCR Master Mix with the KK4905 DNA standards 1 − 6 (20 pM − 0.0002 pM) (Thermo Scientific, Waltham, MA, USA).

2.10. Library Pooling and Sequencing

All libraries were normalized to 2 nM based on qPCR results and pooled using equal volumes. The 2 nM library pool was denatured and sequenced on a MiSeq Nano cell (Illumina, San Diego, CA, USA) with 150 bp PE runs (151 cycles each) with two indexing reads of 8 bp each. Briefly: 10 µL of the 2 nM library pool was mixed with 10 µL of freshly prepared 0.1 N NaOH. The mix was denatured at room temperature for 5 min before being chilled and diluted to 1 mL with 980 µL of HT1 buffer (Illumina, San Diego, CA, USA). The denatured libraries were loaded onto the MiSeq cartridge at 11 pM with 5% PhiX.

2.11. Bioinformatics for Bisulfite Amplicon Sequencing

Raw bisulfite sequencing data firstly underwent quality assessment with FastQC version 0.11.7 [31] and was trimmed with FastP version 0.19.6 [32] to remove adapter sequences, contamination and low-quality fragments. Mapping was carried out with Bismark version 0.7.0 [33] to a customized genome built with GRCh38 and spiked-in Lambda DNA sequences. Alignments were performed with Bowtie2 version 2.3.4 aligner [34] with default parameters allowing 0 mismatch in a 20 bp seed.
The bisulfite conversion efficiency (%) was calculated as 100 − non-conversion ratio (%). The non-conversion ratio was calculated by dividing the number of reads corresponding to non-converted methylated cytosine residues by the total reads (non-converted methylated + converted unmethylated cytosine) for each cytosine residue on Lambda DNA, as follows:
Rnc (%) = Nmc/(Nmc + Nc) × 100
Rnc; non-conversion ratio; Nmc; number of reads corresponding to methylated cytosine; Nc, number of reads corresponding to unmethylated cytosine.
We further investigated symmetric methylation (i.e., on both DNA strands) considering only methylated cytosines in the CpG context by calculating reads supporting methylation and the total read coverage on that cytosine. The fraction methylation for individual CpG sites was then determined from the ratio of total methylated cytosine (in a CpG context) reads to total reads covering that cytosine as follows:
Fraction methylated cytosines = Total methylated cytosine sequencing reads/Total sequencing reads (forward plus reverse) covering that cytosine
‘BedSort’ and ‘bedGraphToBioWig’ from UCSC genome browser ‘kent’ bioinformatics utility version 376 [35] were used to generate BigWig format data group files for visualization and analysis.

2.12. Statistical Analysis of Methylation Data

Comparison of the fraction methylation of individual CpG sites between heathy and melanoma patients was undertaken using Morpheus (https://software.broadinstitute.org/morpheus). Marker selection in Morpheus was based on a t-test and hierarchical clustering using Euclidean distance with complete linkage. Area under the receiver operating characteristic (ROC), Pearson correlation coefficients and sample distribution were determined using Prism version 8.1 (Graphpad, San Diego, CA, USA, 2019). For ROC curves, 95% confidence intervals (CIs) were calculated in Prism using the Wilson/Brown hybrid method.

3. Results

3.1. Cohort and Gene Targets

In this study, we focused on monitoring the methylation status of circulating free DNA in samples from 5 healthy individuals and 4 patients with advanced melanoma (Table 1). A panel of 7 genes was used in the methylation analyses: gap junction protein beta 2 (GJB2), homeobox A9 (HOXA9), mesenchyme homeobox 2 (MEOX2), oligodendrocyte transcription factor 3 (OLIG3), paraoxonase 3 (PON3), Ras association domain family member 1 (RASSF1), and transcription factor AP2 beta (TFAP2B). These genes were chosen based on genome-wide methylation studies on melanoma and shown to be potential progression-related and/or prognostic biomarkers [24,25,36,37,38,39,40]. Furthermore, the hypermethylation of these genes (or closely related genes) in melanoma has been reported to be highly prevalent [39,41,42].
Initially, the ctDNA copy number/mL of plasma for the melanoma patients was determined using ddPCR analysis of previously established driver mutations in BRAF or NRAS (Table 1). ctDNA was detected in patient samples and ranged from 200-30,350 copies/mL plasma (Table 1). Longitudinal analysis of ctDNA from melanoma patient 2, revealed a 67% decrease in ctDNA after 3 weeks of immunotherapy (Table 1, compare melanoma patient 2 pre-treatment (PRE) and early during treatment (EDT) samples).

3.2. Determination of the Fraction of Circulating Free DNA Methylation

For methylation analysis, input circulating free DNA ranged from 15–25 ng for the initial bisulfite conversion step (Table 1). Following bisulfite conversion, 7 gene target regions containing CpG islands plus spiked in lambda DNA (amplicons shown in Figure S1) were amplified and subsequently sequenced. Our workflow independently interrogated methylation of both the upper Watson and lower Crick DNA strands (Figure S1). RASSF1 was the only gene for which it was only feasible to design primers for the lower strand. The fraction of methylation of individual cytosines in CpG sites present in the upper and lower strand of each amplicon was determined based on sequencing reads (ratio of total methylated cytosine in a CpG motif/total reads for that cytosine; Table S2). In the case of healthy control 1, no sequencing reads were observed for the PON3 upper stand amplicon. Overall, the NTC sample had ~300 reads compared to ~50,000 reads for each DNA containing sample. At individual CpG sites, the NTC sample had 0 to 40 total reads compared to the circulating free DNA containing samples which typically had several hundred to thousands of total reads (Table S2a), and this low read depth was filtered out in our methylation analysis pipeline. The mixed methylation amplification control consisting of 1:1 mixture of unmethylated and methylated human genomic DNA showed a median CpG methylation level of 35% (Table S2b).
The determination of bisulfite conversion efficiency (i.e., conversion of unmethylated cytosine residues to uracil) was based on comparing the methylated vs. unmethylated signal for the spiked-in Lambda DNA for each circulating free DNA sample (Table S2). In our data, the non-conversion ratio (Rnc %) ranged from 0.108% to 0.411%, i.e., the bisulfite conversion efficiency was highly efficient at 99.589% to 99.892%.

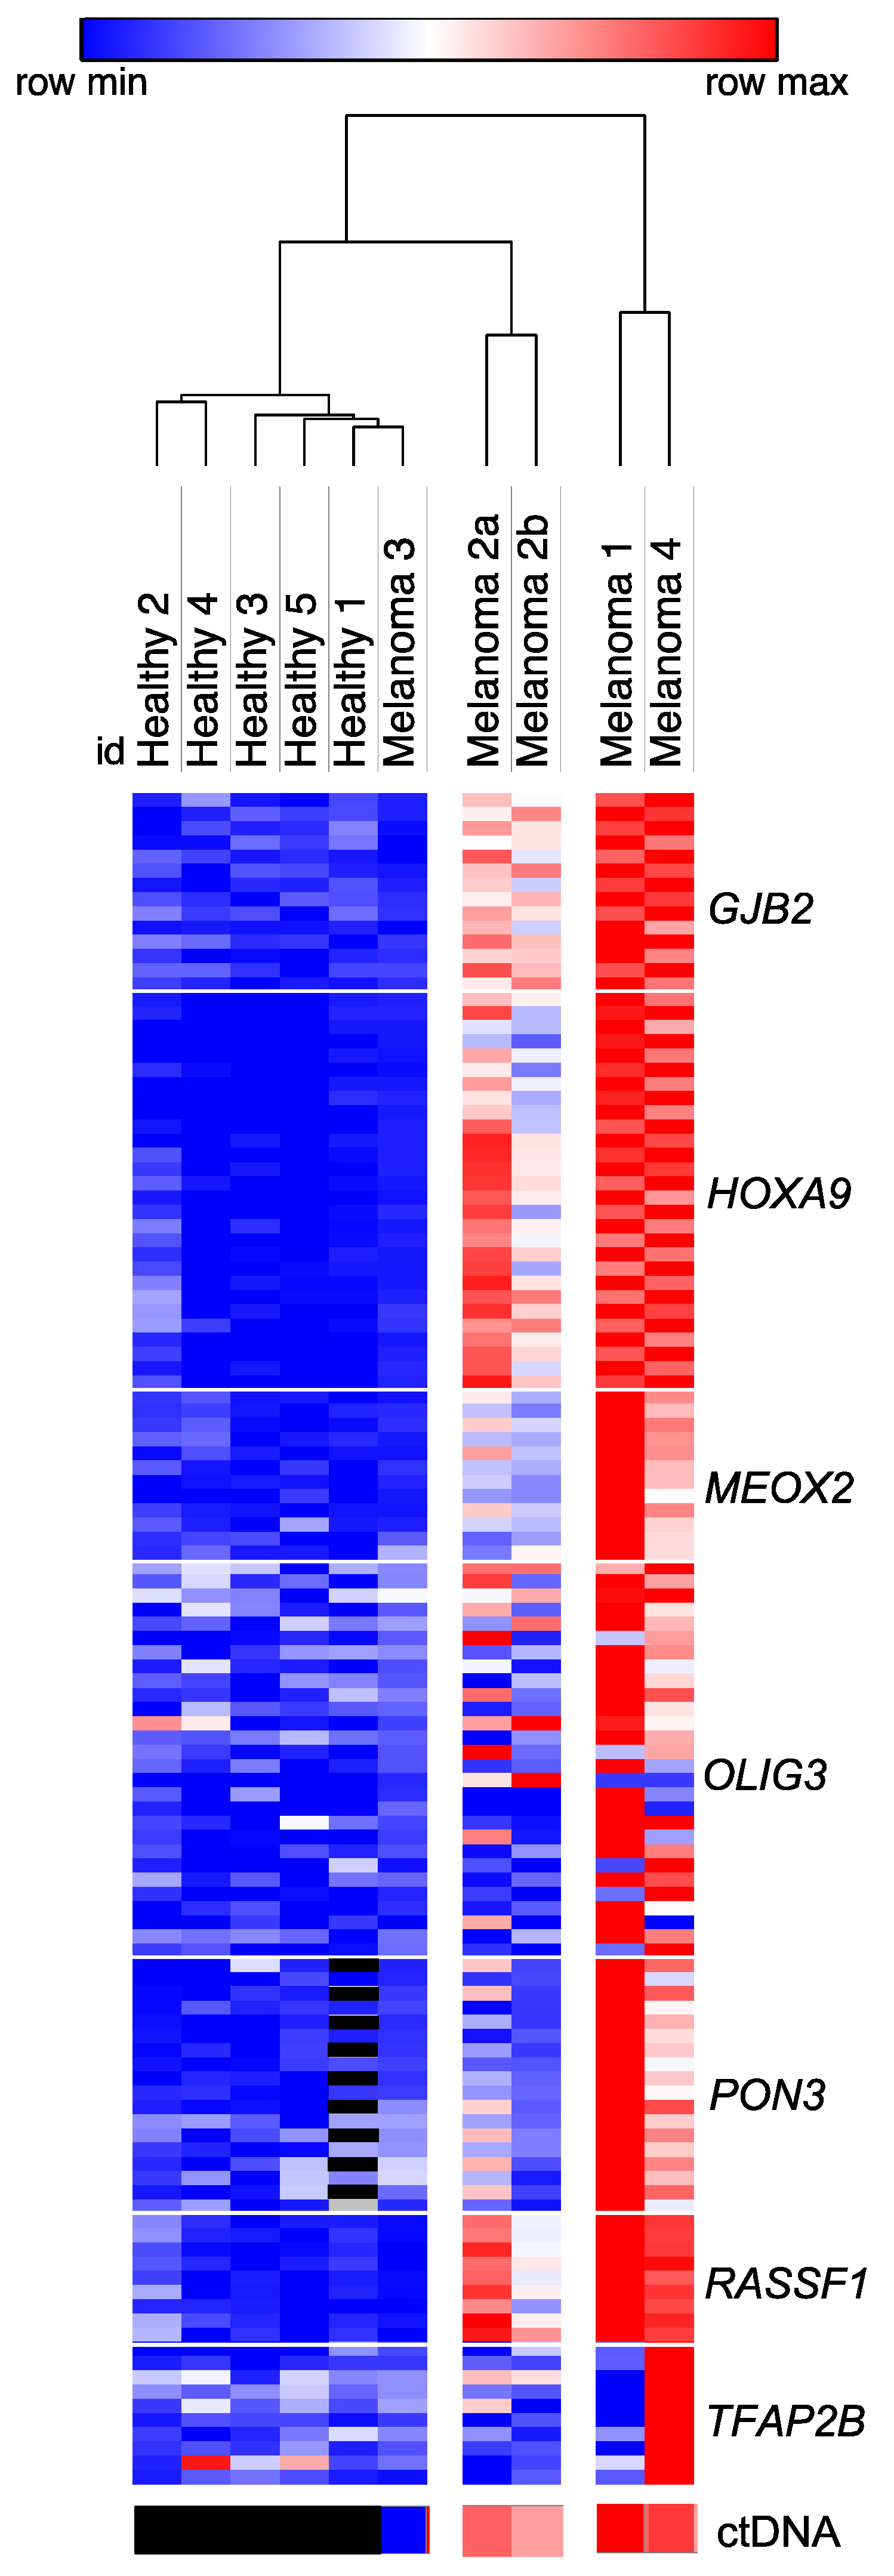
3.3. Identification of Genes Which Discriminate for Melanoma Based on Differential Methylation of Circulating Free DNA

A comparison of healthy controls vs melanoma patients was then undertaken based on the fraction methylation of individual CpG sites within the chosen gene targets (Figure 1). Overall, the methylation levels were variable across the 7 genes but found to be significantly elevated in melanoma patients compared to baseline levels found in healthy controls (Figure 1 and Table S3). Hierarchical clustering based on methylation levels showed that four melanoma patient samples (1, 2a, 2b and 4; with detectable ctDNA ranging from 1,615-30,350 copies/mL plasma), clustered separately from the healthy controls, whereas melanoma patient sample 3, with very low levels of ctDNA (200 copies/mL; Table 1), clustered with the healthy samples (Figure 1). Importantly, the level of methylation increased with increasing ctDNA levels, and although there were differences in the ctDNA methylation patterns in the longitudinal ctDNA samples derived from patient 2, these samples clustered closely together (Figure 1).
Analysis of the DNA strand differences in methylation fractions for each target gene, excluding RASSF1 which only had the Watson strand amplified, illustrated that the majority of symmetrical methylation sites showed equivalent methylation proportions across the genes (Figure S2A). The median differences in the fraction of methylation on symmetrical sites was found to be 0.0 for each gene (range −0.03 to 0.04) (Figure S2B). Considerable variation in the OLIG3 symmetrical methylation fractions were apparent though (Figure S2A,B). Moreover, variation within individual patients was observed (Figure S2C), for instance Melanoma 1 showed substantial differences in the symmetrical methylation fractions for GJB2 (Figure S2A).
To determine whether individual gene promoter methylation could discriminate between healthy and melanoma patients, we performed ROC analysis. The analysis was based on the median circulating free DNA methylation calculated from the fraction methylation of CpG sites in upper and lower DNA amplicon strands for each gene in each healthy and melanoma sample (Table S4). The two gene targets with the most significant hypermethylation in metastatic melanoma patient compared with normal control were OLIG3 and PON3, with AUC values of 1.00 using ROC analysis (Figure 2). Hypermethylation of GJB2, HOXA9, MEOX2 and RASSF1 also had significant AUC values of 0.80, 0.96, 0.92 and 0.84 respectively in discriminating between metastatic melanoma patients and healthy controls (Figure 2). Only 1 gene, TFAP2B, with an AUC value of 0.56 was not significantly hypermethylated in melanoma patients (Figure 2).

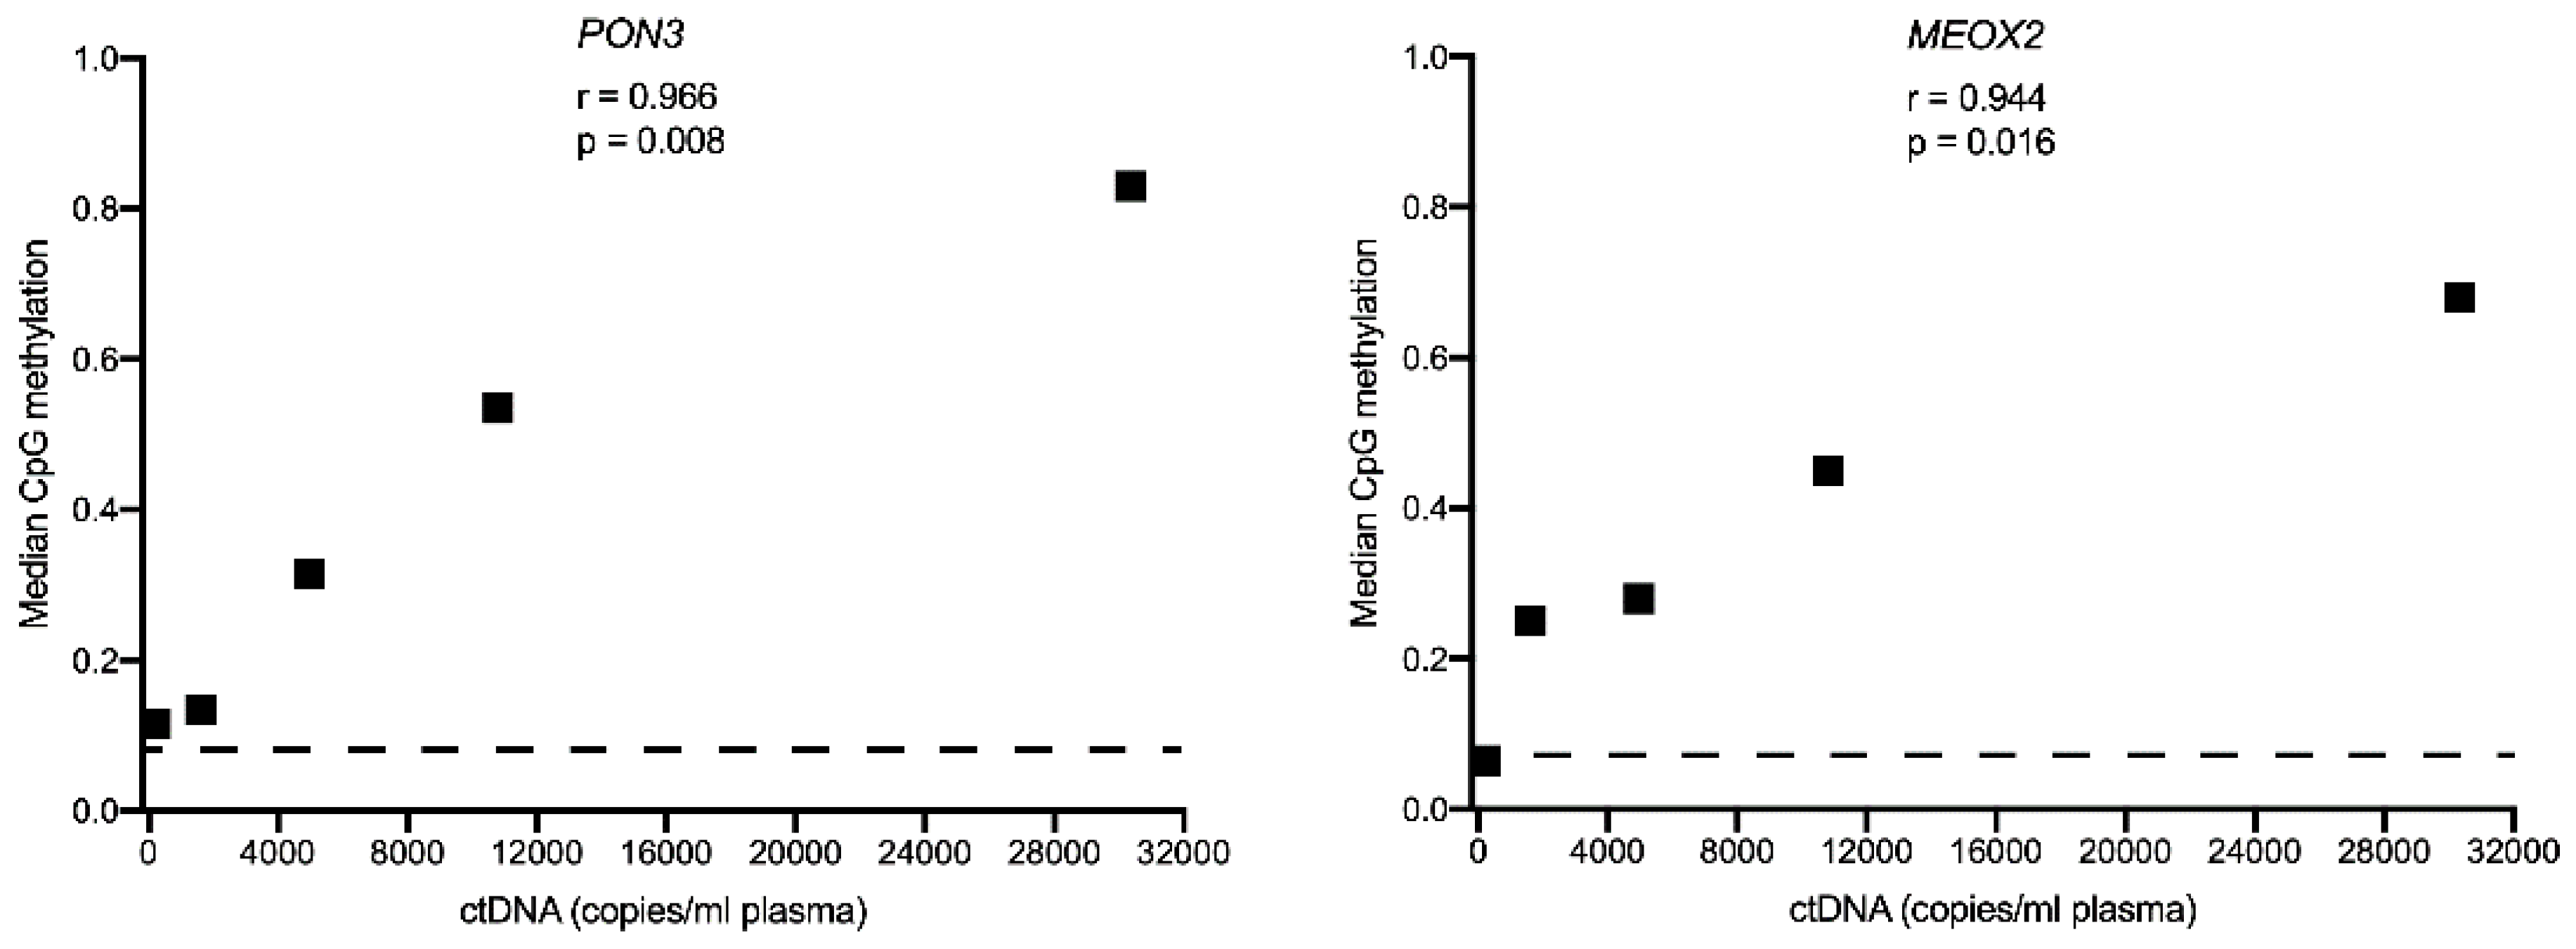
3.4. Comparison of Circulating Free DNA Methylation and Copy Number Levels in Melanoma Patients

We noted that the level of circulating free DNA methylation increased with increasing ctDNA (Figure 1), and we further examined the correlation between ctDNA levels (Table 1) and circulating free DNA methylation levels for each gene in the melanoma patient samples. Significant correlation was found for PON3 and MEOX2 suggesting that measuring the methylation of these gene targets using circulating free DNA can be an accurate surrogate of ctDNA copy number (Figure 3). The other five gene targets had lower correlation coefficients which were not significant (Figure S3).

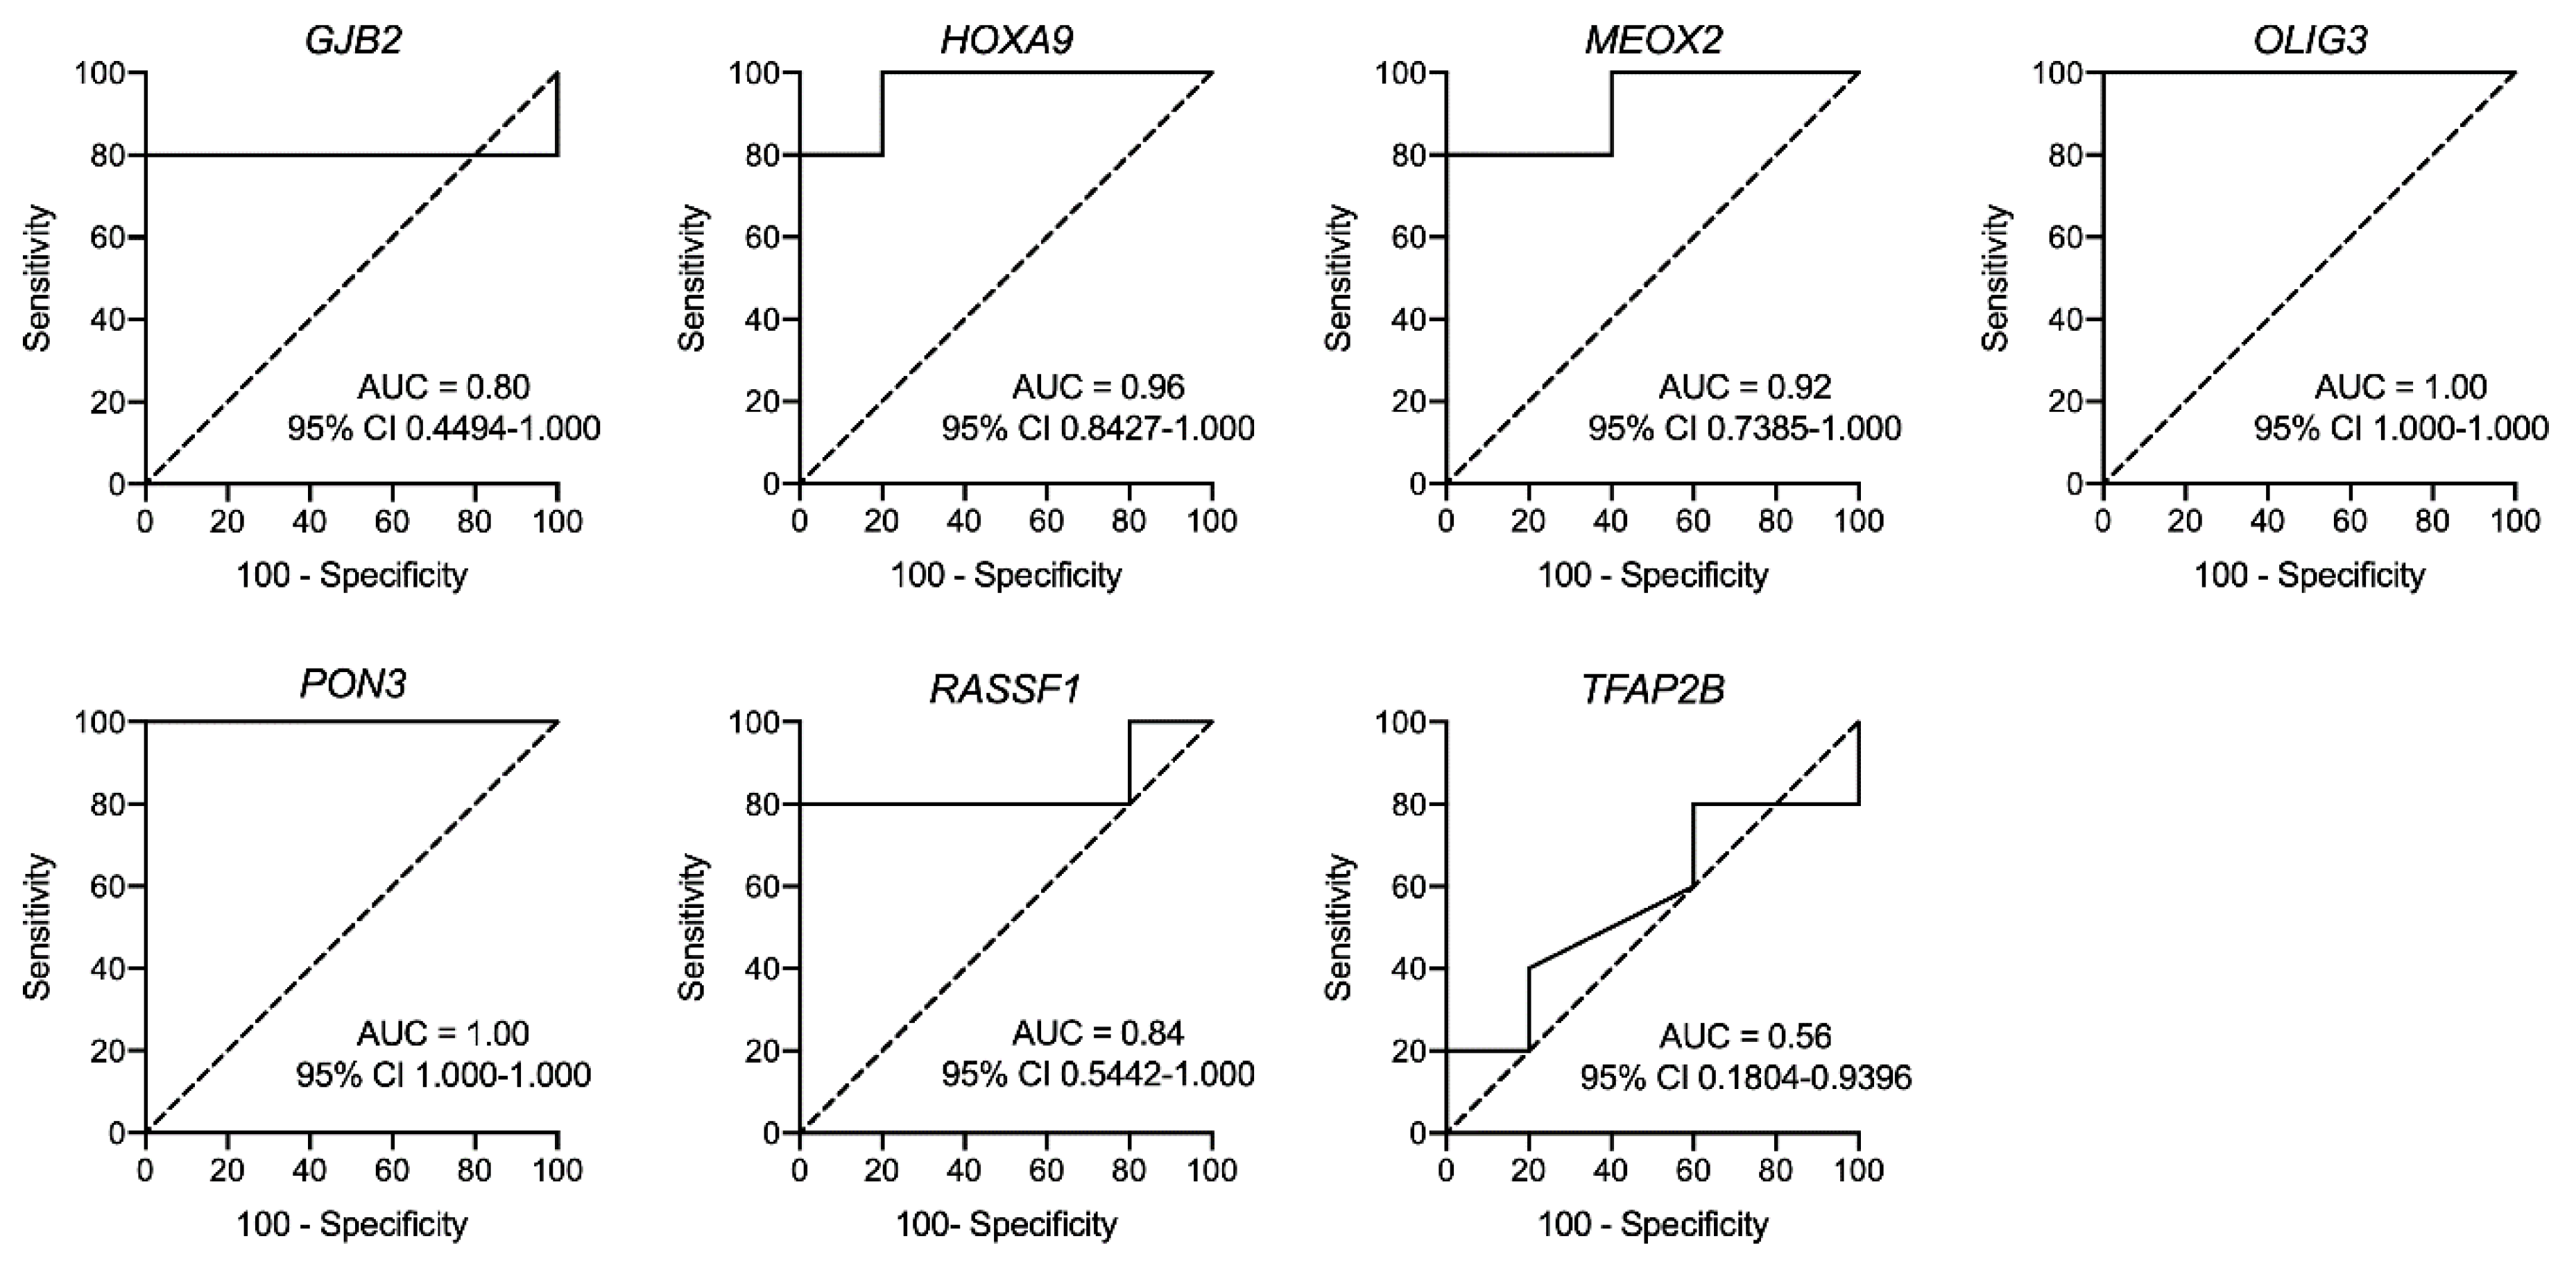
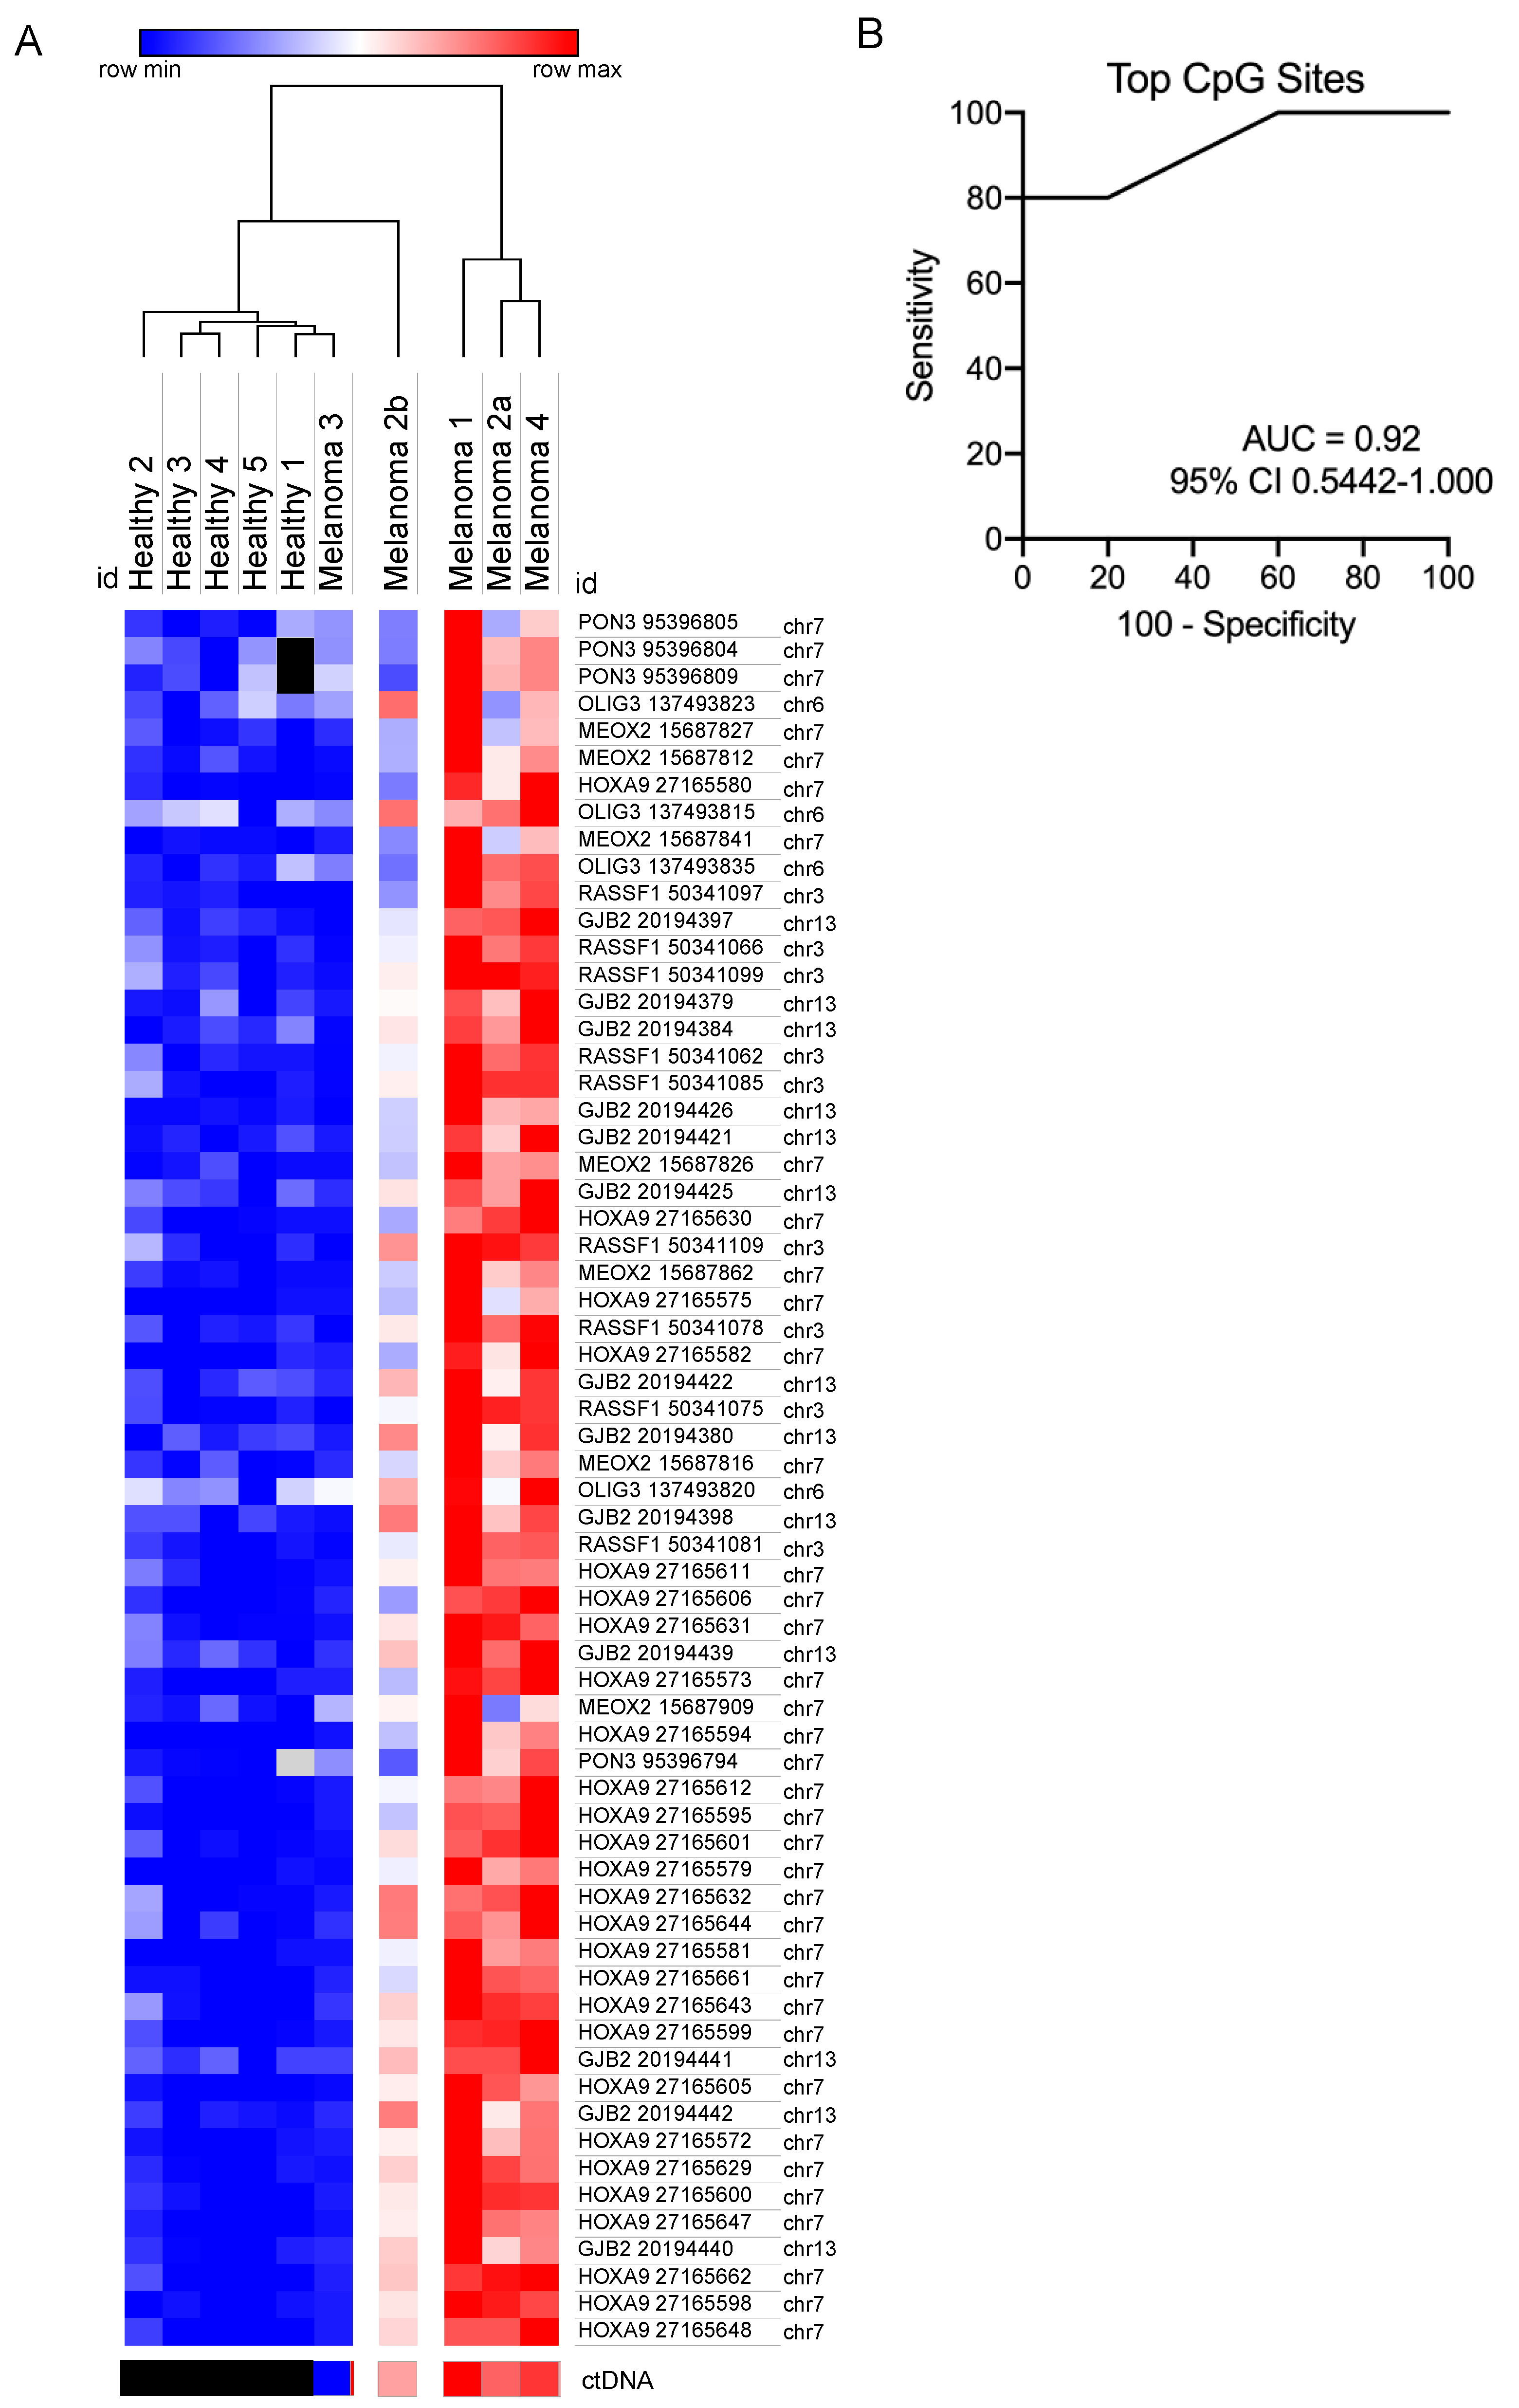
3.5. Evaluation of Methylated CpG Sites in Circulating Free DNA as a Biomarker for Detecting for Metastatic Melanoma

We next sought to compare 64 individual CpG sites in the GJB2, HOXA9, MEOX2, OLIG3, PON3 and RASSF1 genes. These 64 CpGs were most significantly differentially methylated when melanoma patient samples were compared to the healthy control samples (FDR adjusted p-value < 0.1; Tables S3 and S5). Hierarchical clustering using these 64 CpG sites confirmed that melanoma patient sample 3, with very low levels of ctDNA, remain clustered with the healthy controls (Figure 4A) as seen in our initial analyses (Figure 1). Of the remaining melanoma patient samples, all with detectable ctDNA, melanoma patient sample 2a-EDT (with the lowest level of detectable ctDNA) was more distantly related to the remaining patient cluster including melanoma patient samples 1, 2a-PRE and 4 (Figure 4A). Our initial analysis showed patient samples 2a-PRE and 2b-EDT clustering together and patient samples 1 and 4 clustering together (Figure 1).
We then performed ROC analysis based on the median circulating free DNA methylation values calculated from the fraction methylation of the 64 most differentially methylated individual CpG sites (shown in Figure 4A) for each healthy and melanoma sample (Table S6). This again demonstrated significant hypermethylation in patients with melanoma compared with healthy control (AUC = 0.92; Figure 4B).

4. Discussion

In this study, we have utilized bisulfite-based methylation-specific region sequencing [19] to monitor methylation of circulating free DNA in metastatic melanoma patients. The key to the success of this approach is designing appropriate primers, which amplify regions capable of distinguishing healthy controls from patients with cutaneous melanoma using bisulfite converted DNA. Other techniques for monitoring circulating free DNA in the context of melanoma, such as targeted next generation, typically work with an input circulating free DNA of around 20 ng [14]. Although ddPCR is capable of working efficiently with circulating free DNA as low as 1 ng, it does require prior knowledge of the mutation and typically only follows one gene target. Our current methylation approach utilized comparable amounts of input circulating free DNA to that used in targeted sequencing and in addition, resulted in a bisulfite conversion efficiency that approached 100%. We were able to achieve meaningful methylation data on our cohort samples, consisting of five healthy control samples and five melanoma patient samples, using an average circulating free DNA input of ~19 ng with a resulting bisulfite conversion efficiency of 99.6% to 99.9% followed by successful amplification of all our targeted DNA regions.
It should be noted that our methylation amplification control did not show the theoretical methylation levels of 50%. According to Qiagen (technical support communication) they cannot guarantee 100% methylation of the human genomic DNA used to generate this control, and their testing of this control does not use the same gene targets as used in this study. Furthermore, we cannot assume 50% methylation of our target genes in the mixed control sample considering there is evidence for bisulfite-induced selective degradation of DNA [43,44]. We should also emphasize that in this study we were comparing the relative amounts of DNA methylation rather than absolute methylation quantitation. Our comparison included healthy controls versus melanoma cases that were treated and measured under the same conditions.
We chose DNA target regions corresponding to the CpG rich regions of seven genes (GJB2, HOXA9, MEOX2, OLIG3, PON3, RASSF1, TFAP2B) shown to be hypermethylated in late-stage melanoma patients [24,25,36,37,38,39,40]. These previous melanoma studies were based on genome wide methylation arrays using genomic DNA followed by validation with more targeted assays that captured methylation of individual CpG sites in one DNA strand. Our current workflow quantifies the levels of methylation for individual, targeted CpG sites using circulating free DNA and also maximizes the methylation information gained by separately interrogating the Watson and Crick strands of DNA. This provides additional discriminatory power to assess methylation of individual CpG sites, and data can be analyzed based on the fraction of methylation at individual CpG sites or based on the median of the fraction methylation of several CpG sites present in each target gene. Both approaches were found to have significant predictive value in discriminating between metastatic melanoma patients and healthy controls. Overall though, the approach based on methylation of CpG sites within a particular gene showed the most significance.
We also observed symmetrical methylation in most of our target genes across our cohort, which supports previous reports that CpG sites are thought to be symmetrically methylated [45,46,47]. Designing primers for both DNA strands doubled the chances of obtaining an amplified product and also offers the significant advantage of looking at the methylation of both strands. We did observe variation in the symmetrical methylation across individual target genes, particularly OLIG3, as well as within individual melanoma patients. Although we can only speculate as to the cause of this variation, it may be indicative of PCR amplification bias or biological variation. We cannot rule out PCR amplification bias or duplications as we have not included unique molecular identifiers (UMIs). It was not feasible to use UMIs in our current system as the amount of starting DNA was too small. To help control for PCR bias, we did ensure that the primers for all of our amplicons were located in regions that do not contain CpG sites. To adequately address the issue of biological variations, larger cohort studies with longitudinal sampling will be required.
Based on the median of the fraction methylation for CpG sites within a particular target gene region, we were able to identify two genes, PON3 and OLIG3, for which increased methylation of circulating free DNA was shown to have the highest possible predictive value (AUC = 1.00 for ROC curves) for identifying patients with advanced melanoma. Our findings are supported by a previous study, which showed increased methylation of the promoter region of PON3 genomic DNA, independent of tumor thickness and ulceration, to be significantly associated with poor prognosis when comparing primary melanoma against benign nevi [24]. This study did not report on whether PON3 methylation patterns were independent of BRAF or NRAS mutational status [24]. Increased methylation of OLIG3 genomic DNA was also found to be associated with reduced overall survival in primary melanoma but was found not be significant in a subsequent multivariate analysis [24].
Based on increased methylation of circulating free DNA, we identified four other genes, HOXA9, MEOX2, RASSF1 and GJB2, that also have high predictive values for diagnosing metastatic melanoma patients (AUCs ranging from 0.8 to 0.96 for ROC curves). Increased methylation of MEOX2 genomic DNA was also found to be associated with reduced overall survival in primary melanoma but was found not be significant in a subsequent multivariate analysis [24]. This study also identified hypermethylation of GJB2 and HOXA9 along with MEOX2, to be associated with melanoma progression based on comparing primary versus metastatic melanoma [24]. A bioinformatics-based analysis has indicated that hypermethylation of the RASSF1 promoter region is associated with susceptibility to melanoma but is not in itself of prognostic value [36].
In our current study, we did not find any value associated with monitoring methylation of TFAP2B in melanoma patients (AUC of 0.56 for a ROC curve). Reduced TFAP2B protein expression, presumably due to increased methylation, was found to be associated with shorter progression-free survival in melanoma patients but was found not to be significant in a multivariate analysis [24].
We also compared the levels of methylated CpG within the target genes to ctDNA copy number based on ddPCR and found significant correlation only for the genes PON3 and MEOX2. Generally, the levels of ctDNA in melanoma patients provide a predictor of tumor burden and response to therapy [6,7,48]. In our study, the hypermethylation of PON3 provided the highest predictive value for identifying metastatic melanoma patients, and this supports a previous study analyzing PON3 methylation using melanoma tissue-derived genomic DNA [24]. Changes in methylation of PON3, also based on analysis of genomic DNA, have been reported to be associated with drug resistance in esophageal cancer, adverse outcomes in prostate cancer and to be predictive of chemotherapy response in colorectal cancer [49,50,51]. Having established a viable workflow for detection of methylation using small amounts of low molecular weight circulating free DNA from plasma, we can now focus on larger cohorts and additional targets to establish the value of such a liquid biopsy as a biomarker in the diagnosis and monitoring of melanoma patients. The addition of methylation ctDNA profiling in melanoma is particularly valuable, as ctDNA has been shown to be predictive of melanoma-specific survival in high-risk stage III melanoma [13] and also predicts response and survival in advanced melanoma patients treated with molecular or immune therapies [6,7,48]. In these reports, however, ctDNA analysis was limited to patients with an established driver gene mutation and although highly sensitive ddPCR was used for the detection of these gene mutations, only 34% of Stage III melanoma patients had detectable ctDNA at baseline [13]. The analysis of ctDNA methylation using a panel of genes eliminates the need to define mutations using tumor tissue and increases the likelihood of detecting tumor-associated circulating DNA.

Supplementary Materials

The following are available online at https://www.mdpi.com/2076-3417/9/23/5074/s1, Figure S1: Bisulphite converted amplicon sequences, Figure S2: Comparison of the differences in the fraction of methylation determined for symmetrical CpG sites, Figure S3: Correlation of circulating free DNA methylation and ctDNA copy number in metastatic melanoma patient samples, Table S1: PCR primers, Table S2: Fraction methylation of CpG sites, Table S3: Total differentially methylated CpG sites in melanoma vs. healthy-control samples, Table S4: Median methylation of total differentially methylated CpG sites, Table S5: Top differentially methylated CpG sites in melanoma vs. healthy-control samples, Table S6: Median methylation of top differentially methylated CpG sites.

Author Contributions

Conceptualization, R.J.D., J.H.L., and H.R.; methodology, R.J.D., J.H.L., D.C., Y.W., C.P., and H.R.; formal analysis, R.J.D., J.H.L., Y.W., C.P., and H.R.; investigation, R.J.D., J.H.L., and D.C.; resources, R.F.K., A.M.M., M.S.C., G.V.L., and R.A.S.; writing—original draft preparation, R.J.D., and H.R.; writing—review and editing, R.J.D., J.H.L., D.C., Y.W., C.P., R.F.K., A.M.M., M.S.C., G.V.L., R.A.S., and H.R.; visualization, R.J.D., J.H.L., and H.R.; supervision, R.J.D., and H.R.; project administration, H.R.; funding acquisition, H.R.

Funding

R.J.D. was supported in part by a donation to Melanoma Institute Australia from the Clearbridge Foundation. This work was also supported in part by the National Health and Medical Research Council (APP1093017 and APP1128951). H.R., R.A.S., and G.V.L. are supported by NHMRC Fellowships. G.V.L. is also supported by the Medical Foundation of The University of Sydney. A.M.M. is supported by a Cancer Institute NSW Fellowship. The Australian Genome Research Facility is supported by Bioplatforms Australia (BPA) via an Australian Government NCRIS investment (to EMBL-ABR).

Conflicts of Interest

G.V.L. receives consultant service fees from Amgen, BMS, Array, Pierre-Fabre, Novartis, Merck Sharp & Dohme (MSD), and Roche. A.M.M. is an advisory board member for BMS, MSD, Novartis, Roche, and Pierre Fabre. R.F.K. has been on advisory boards for Roche, Amgen, BMS, MSD, Novartis and TEVA and has received honoraria from MSD, BMS and Novartis. M.S.C. is an advisory board member for MSD, BMS, Novartis, Pierre-Fabre, Roche and Amgen. R.A.S has received honoraria from MSD, Novartis, GSK, BMS, Myriad and NeraCare. BPA had no role in study design, data collection and analysis, decision to publish, or preparation of the manuscript. All remaining authors have declared no conflicts of interest.

References

  1. Mathai, R.A.; Vidya, R.V.S.; Reddy, B.S.; Thomas, L.; Udupa, K.; Kolesar, J.; Rao, M. Potential utility of liquid biopsy as a diagnostic and prognostic tool for the assessment of solid tumors: Implications in the precision oncology. J. Clin. Med. 2019, 8, 373. [Google Scholar] [CrossRef] [PubMed]
  2. Lim, S.Y.; Lee, J.H.; Diefenbach, R.J.; Kefford, R.F.; Rizos, H. Liquid biomarkers in melanoma: Detection and discovery. Mol. Cancer 2018, 17, 8. [Google Scholar] [CrossRef] [PubMed]
  3. Barbany, G.; Arthur, C.; Lieden, A.; Nordenskjold, M.; Rosenquist, R.; Tesi, B.; Wallander, K.; Tham, E. Cell free tumour DNA testing for early detection of cancer-a potential future tool. J. Intern. Med. 2019. [Google Scholar] [CrossRef] [PubMed]
  4. Bettegowda, C.; Sausen, M.; Leary, R.J.; Kinde, I.; Wang, Y.; Agrawal, N.; Bartlett, B.R.; Wang, H.; Luber, B.; Alani, R.M.; et al. Detection of circulating tumor DNA in early- and late-stage human malignancies. Sci. Transl. Med. 2014, 6, 224ra224. [Google Scholar] [CrossRef]
  5. Cabel, L.; Riva, F.; Servois, V.; Livartowski, A.; Daniel, C.; Rampanou, A.; Lantz, O.; Romano, E.; Milder, M.; Buecher, B.; et al. Circulating tumor DNA changes for early monitoring of anti-PD1 immunotherapy: A proof-of-concept study. Ann. Oncol. 2017, 28, 1996–2001. [Google Scholar] [CrossRef]
  6. Lee, J.H.; Long, G.V.; Boyd, S.; Lo, S.; Menzies, A.M.; Tembe, V.; Guminski, A.; Jakrot, V.; Scolyer, R.A.; Mann, G.J.; et al. Circulating tumour DNA predicts response to anti-PD1 antibodies in metastatic melanoma. Ann. Oncol. 2017, 28, 1130–1136. [Google Scholar] [CrossRef]
  7. Gray, E.S.; Rizos, H.; Reid, A.L.; Boyd, S.C.; Pereira, M.R.; Lo, J.; Tembe, V.; Freeman, J.; Lee, J.H.; Scolyer, R.A.; et al. Circulating tumor DNA to monitor treatment response and detect acquired resistance in patients with metastatic melanoma. Oncotarget 2015, 6, 42008–42018. [Google Scholar] [CrossRef]
  8. Dawson, S.J.; Tsui, D.W.; Murtaza, M.; Biggs, H.; Rueda, O.M.; Chin, S.F.; Dunning, M.J.; Gale, D.; Forshew, T.; Mahler-Araujo, B.; et al. Analysis of circulating tumor DNA to monitor metastatic breast cancer. N. Engl. J. Med. 2013, 368, 1199–1209. [Google Scholar] [CrossRef]
  9. Hou, H.; Yang, X.; Zhang, J.; Zhang, Z.; Xu, X.; Zhang, X.; Zhang, C.; Liu, D.; Yan, W.; Zhou, N.; et al. Discovery of targetable genetic alterations in advanced non-small cell lung cancer using a next-generation sequencing-based circulating tumor DNA assay. Sci. Rep. 2017, 7, 14605. [Google Scholar] [CrossRef]
  10. Du, J.; Wu, X.; Tong, X.; Wang, X.; Wei, J.; Yang, Y.; Chang, Z.; Mao, Y.; Shao, Y.W.; Liu, B. Circulating tumor DNA profiling by next generation sequencing reveals heterogeneity of crizotinib resistance mechanisms in a gastric cancer patient with MET amplification. Oncotarget 2017, 8, 26281–26287. [Google Scholar] [CrossRef]
  11. Thompson, J.C.; Yee, S.S.; Troxel, A.B.; Savitch, S.L.; Fan, R.; Balli, D.; Lieberman, D.B.; Morrissette, J.D.; Evans, T.L.; Bauml, J.; et al. Detection of therapeutically targetable driver and resistance mutations in lung cancer patients by next-generation sequencing of cell-free circulating tumor DNA. Clin. Cancer Res. 2016, 22, 5772–5782. [Google Scholar] [CrossRef]
  12. Tan, L.; Sandhu, S.; Lee, R.J.; Li, J.; Callahan, J.; Ftouni, S.; Dhomen, N.; Middlehurst, P.; Wallace, A.; Raleigh, J.; et al. Prediction and monitoring of relapse in stage III melanoma using circulating tumor DNA. Ann. Oncol. 2019, 30, 804–814. [Google Scholar] [CrossRef] [PubMed]
  13. Lee, J.H.; Saw, R.P.; Thompson, J.F.; Lo, S.; Spillane, A.J.; Shannon, K.F.; Stretch, J.R.; Howle, J.; Menzies, A.M.; Carlino, M.S.; et al. Pre-operative ctDNA predicts survival in high-risk stage III cutaneous melanoma patients. Ann. Oncol. 2019, 30, 815–822. [Google Scholar] [CrossRef] [PubMed]
  14. Diefenbach, R.J.; Lee, J.H.; Rizos, H. Monitoring melanoma using circulating free DNA. Am. J. Clin. Dermatol. 2019, 20, 1–12. [Google Scholar] [CrossRef] [PubMed]
  15. Bronkhorst, A.J.; Ungerer, V.; Holdenrieder, S. The emerging role of cell-free DNA as a molecular marker for cancer management. Biomol. Detect. Quantif. 2019, 17, 100087. [Google Scholar] [CrossRef] [PubMed]
  16. Chin, R.I.; Chen, K.; Usmani, A.; Chua, C.; Harris, P.K.; Binkley, M.S.; Azad, T.D.; Dudley, J.C.; Chaudhuri, A.A. Detection of solid tumor molecular residual disease (MRD) using circulating tumor DNA (ctDNA). Mol. Diagn. Ther. 2019, 23, 311–331. [Google Scholar] [CrossRef]
  17. Andersen, R.F. Tumor-specific methylations in circulating cell-free DNA as clinically applicable markers with potential to substitute mutational analyses. Expert Rev. Mol. Diagn. 2018, 18, 1–9. [Google Scholar] [CrossRef]
  18. Gai, W.; Sun, K. Epigenetic Biomarkers in Cell-Free DNA and Applications in Liquid Biopsy. Genes 2019, 10, 32. [Google Scholar] [CrossRef]
  19. Zeng, H.; He, B.; Yi, C.; Peng, J. Liquid biopsies: DNA methylation analyses in circulating cell-free DNA. J. Genet. Genom. 2018, 45, 185–192. [Google Scholar] [CrossRef]
  20. Xu, R.H.; Wei, W.; Krawczyk, M.; Wang, W.; Luo, H.; Flagg, K.; Yi, S.; Shi, W.; Quan, Q.; Li, K.; et al. Circulating tumour DNA methylation markers for diagnosis and prognosis of hepatocellular carcinoma. Nat. Mater. 2017, 16, 1155–1161. [Google Scholar] [CrossRef]
  21. Wen, L.; Li, J.; Guo, H.; Liu, X.; Zheng, S.; Zhang, D.; Zhu, W.; Qu, J.; Guo, L.; Du, D.; et al. Genome-scale detection of hypermethylated CpG islands in circulating cell-free DNA of hepatocellular carcinoma patients. Cell Res. 2015, 25, 1250–1264. [Google Scholar] [CrossRef] [PubMed]
  22. Rodriguez-Paredes, M.; Esteller, M. Cancer epigenetics reaches mainstream oncology. Nat. Med. 2011, 17, 330–339. [Google Scholar] [CrossRef] [PubMed]
  23. Worm Orntoft, M.B.; Jensen, S.O.; Hansen, T.B.; Bramsen, J.B.; Andersen, C.L. Comparative analysis of 12 different kits for bisulfite conversion of circulating cell-free DNA. Epigenetics 2017, 12, 626–636. [Google Scholar] [CrossRef] [PubMed]
  24. Wouters, J.; Vizoso, M.; Martinez-Cardus, A.; Carmona, F.J.; Govaere, O.; Laguna, T.; Joseph, J.; Dynoodt, P.; Aura, C.; Foth, M.; et al. Comprehensive DNA methylation study identifies novel progression-related and prognostic markers for cutaneous melanoma. BMC Med. 2017, 15, 101. [Google Scholar] [CrossRef] [PubMed]
  25. Tanemura, A.; Terando, A.M.; Sim, M.S.; van Hoesel, A.Q.; de Maat, M.F.; Morton, D.L.; Hoon, D.S. CpG island methylator phenotype predicts progression of malignant melanoma. Clin. Cancer Res. 2009, 15, 1801–1807. [Google Scholar] [CrossRef] [PubMed]
  26. Liu, L.; Toung, J.M.; Jassowicz, A.F.; Vijayaraghavan, R.; Kang, H.; Zhang, R.; Kruglyak, K.M.; Huang, H.J.; Hinoue, T.; Shen, H.; et al. Targeted methylation sequencing of plasma cell-free DNA for cancer detection and classification. Ann. Oncol. 2018, 29, 1445–1453. [Google Scholar] [CrossRef]
  27. Widschwendter, M.; Evans, I.; Jones, A.; Ghazali, S.; Reisel, D.; Ryan, A.; Gentry-Maharaj, A.; Zikan, M.; Cibula, D.; Eichner, J.; et al. Methylation patterns in serum DNA for early identification of disseminated breast cancer. Genome Med. 2017, 9, 115. [Google Scholar] [CrossRef]
  28. Widschwendter, M.; Zikan, M.; Wahl, B.; Lempiainen, H.; Paprotka, T.; Evans, I.; Jones, A.; Ghazali, S.; Reisel, D.; Eichner, J.; et al. The potential of circulating tumor DNA methylation analysis for the early detection and management of ovarian cancer. Genome Med. 2017, 9, 116. [Google Scholar] [CrossRef]
  29. Calapre, L.; Warburton, L.; Millward, M.; Ziman, M.; Gray, E.S. Circulating tumour DNA (ctDNA) as a liquid biopsy for melanoma. Cancer Lett. 2017, 404, 62–69. [Google Scholar] [CrossRef]
  30. Moran, B.; Silva, R.; Perry, A.S.; Gallagher, W.M. Epigenetics of malignant melanoma. Semin. Cancer Biol. 2018, 51, 80–88. [Google Scholar] [CrossRef]
  31. Andrews, S. FastQC: A Quality Control Tool for High Throughput Sequence Data. 2010. Available online: http://www.bioinformatics.babraham.ac.uk/projects/fastqc/ (accessed on 28 May 2018).
  32. Chen, S.; Zhou, Y.; Chen, Y.; Gu, J. Fastp: An ultra-fast all-in-one FASTQ preprocessor. Bioinformatics 2018, 34, i884–i890. [Google Scholar] [CrossRef] [PubMed]
  33. Krueger, F.; Andrews, S.R. Bismark: A flexible aligner and methylation caller for Bisulfite-Seq applications. Bioinformatics 2011, 27, 1571–1572. [Google Scholar] [CrossRef] [PubMed]
  34. Langmead, B.; Salzberg, S.L. Fast gapped-read alignment with Bowtie 2. Nat. Methods 2012, 9, 357–359. [Google Scholar] [CrossRef] [PubMed] [Green Version]
  35. Karolchik, D.; Hinrichs, A.S.; Kent, W.J. The UCSC genome browser. Curr. Protoc. Hum. Genet. 2011. [Google Scholar] [CrossRef]
  36. Shao, C.; Dai, W.; Li, H.; Tang, W.; Jia, S.; Wu, X.; Luo, Y. The relationship between RASSF1A gene promoter methylation and the susceptibility and prognosis of melanoma: A meta-analysis and bioinformatics. PLoS ONE 2017, 12, e0171676. [Google Scholar] [CrossRef] [PubMed]
  37. Guo, Y.; Long, J.; Lei, S. Promoter methylation as biomarkers for diagnosis of melanoma: A systematic review and meta-analysis. J. Cell. Physiol. 2019, 234, 7356–7367. [Google Scholar] [CrossRef]
  38. de Unamuno Bustos, B.; Murria Estal, R.; Perez Simo, G.; Simarro Farinos, J.; Pujol Marco, C.; Navarro Mira, M.; Alegre de Miquel, V.; Ballester Sanchez, R.; Sabater Marco, V.; Llavador Ros, M.; et al. Aberrant DNA methylation is associated with aggressive clinicopathological features and poor survival in cutaneous melanoma. Br. J. Dermatol. 2018, 179, 394–404. [Google Scholar] [CrossRef]
  39. Gao, L.; Smit, M.A.; van den Oord, J.J.; Goeman, J.J.; Verdegaal, E.M.; van der Burg, S.H.; Stas, M.; Beck, S.; Gruis, N.A.; Tensen, C.P.; et al. Genome-wide promoter methylation analysis identifies epigenetic silencing of MAPK13 in primary cutaneous melanoma. Pigment. Cell Melanoma Res. 2013, 26, 542–554. [Google Scholar] [CrossRef]
  40. Salvianti, F.; Orlando, C.; Massi, D.; De Giorgi, V.; Grazzini, M.; Pazzagli, M.; Pinzani, P. Tumor-related methylated cell-free DNA and circulating tumor cells in melanoma. Front. Mol. Biosci. 2015, 2, 76. [Google Scholar] [CrossRef] [Green Version]
  41. Tellez, C.S.; Shen, L.; Estecio, M.R.; Jelinek, J.; Gershenwald, J.E.; Issa, J.P. CpG island methylation profiling in human melanoma cell lines. Melanoma Res. 2009, 19, 146–155. [Google Scholar] [CrossRef]
  42. Micevic, G.; Theodosakis, N.; Bosenberg, M. Aberrant DNA methylation in melanoma: Biomarker and therapeutic opportunities. Clin. Epigenet. 2017, 9, 34. [Google Scholar] [CrossRef] [PubMed] [Green Version]
  43. Olova, N.; Krueger, F.; Andrews, S.; Oxley, D.; Berrens, R.V.; Branco, M.R.; Reik, W. Comparison of whole-genome bisulfite sequencing library preparation strategies identifies sources of biases affecting DNA methylation data. Genome Biol. 2018, 19, 33. [Google Scholar] [CrossRef] [PubMed] [Green Version]
  44. Tanaka, K.; Okamoto, A. Degradation of DNA by bisulfite treatment. Bioorg. Med. Chem. Lett. 2007, 17, 1912–1915. [Google Scholar] [CrossRef] [PubMed]
  45. Guo, W.; Chung, W.Y.; Qian, M.; Pellegrini, M.; Zhang, M.Q. Characterizing the strand-specific distribution of non-CpG methylation in human pluripotent cells. Nucleic Acids Res. 2014, 42, 3009–3016. [Google Scholar] [CrossRef] [Green Version]
  46. Laird, C.D.; Pleasant, N.D.; Clark, A.D.; Sneeden, J.L.; Hassan, K.M.; Manley, N.C.; Vary, J.C., Jr.; Morgan, T.; Hansen, R.S.; Stoger, R. Hairpin-bisulfite PCR: Assessing epigenetic methylation patterns on complementary strands of individual DNA molecules. Proc. Natl. Acad. Sci. USA 2004, 101, 204–209. [Google Scholar] [CrossRef] [Green Version]
  47. Laurent, L.; Wong, E.; Li, G.; Huynh, T.; Tsirigos, A.; Ong, C.T.; Low, H.M.; Kin Sung, K.W.; Rigoutsos, I.; Loring, J.; et al. Dynamic changes in the human methylome during differentiation. Genome Res. 2010, 20, 320–331. [Google Scholar] [CrossRef] [Green Version]
  48. Ascierto, P.A.; Minor, D.; Ribas, A.; Lebbe, C.; O’Hagan, A.; Arya, N.; Guckert, M.; Schadendorf, D.; Kefford, R.F.; Grob, J.J.; et al. Phase II trial (BREAK-2) of the BRAF inhibitor dabrafenib (GSK2118436) in patients with metastatic melanoma. J. Clin. Oncol. 2013, 31, 3205–3211. [Google Scholar] [CrossRef]
  49. Huang, D.; Wang, Y.; He, Y.; Wang, G.; Wang, W.; Han, X.; Sun, Y.; Lin, L.; Shan, B.; Shen, G.; et al. Paraoxonase 3 is involved in the multi-drug resistance of esophageal cancer. Cancer Cell Int. 2018, 18, 168. [Google Scholar] [CrossRef]
  50. Shui, I.M.; Wong, C.J.; Zhao, S.; Kolb, S.; Ebot, E.M.; Geybels, M.S.; Rubicz, R.; Wright, J.L.; Lin, D.W.; Klotzle, B.; et al. Prostate tumor DNA methylation is associated with cigarette smoking and adverse prostate cancer outcomes. Cancer 2016, 122, 2168–2177. [Google Scholar] [CrossRef]
  51. Baharudin, R.; Ab Mutalib, N.S.; Othman, S.N.; Sagap, I.; Rose, I.M.; Mohd Mokhtar, N.; Jamal, R. Identification of predictive DNA methylation biomarkers for chemotherapy response in colorectal cancer. Front. Pharmacol. 2017, 8, 47. [Google Scholar] [CrossRef] [Green Version]
Figure 1. Differentially methylated CpG sites in healthy control samples and metastatic melanoma patient samples. Heat map of the fraction of methylation determined for individual CpG sites across the indicated genes. Comparisons were based on healthy control samples versus melanoma patient samples. ctDNA levels (copy number/mL of plasma) determined for each melanoma patient samples are also shown for comparison. Details of individual CpG location sites are listed in Table S3. The scale for colors include: blue for row minimum levels of methylation of CpG sites in indicated genes or ctDNA levels (copy number/mL plasma) and red for row maximum levels of methylation of CpG sites in indicated genes or ctDNA levels (copy number/mL plasma). A black box indicates data was not determined.
Applsci 09 05074 g001
Figure 2. Circulating free DNA methylation can discriminate between healthy and melanoma patients. ROC curves for each gene target were based on median methylation using the fraction of methylation for each CpG site in both the upper and lower stand amplicons.
Applsci 09 05074 g002
Figure 3. Correlation of circulating free DNA methylation and ctDNA copy number in metastatic melanoma patient samples. Methylation was based on median methylation using the fraction of methylation for each CpG site in both the upper and lower stand amplicons for each gene target. ctDNA copy number/mL of plasma was determined using ddPCR. The dashed lines represent the average of the median methylation levels for healthy control samples.
Applsci 09 05074 g003
Figure 4. Most significant differentially methylated CpG sites in healthy control samples and metastatic melanoma patient samples. (A) Heat map of the fraction of methylation determined for individual CpG sites across the indicated genes in the order highest to lowest t-test value. Comparisons were based on healthy control samples versus melanoma patient samples. ctDNA levels (copy number/mL of plasma) determined for melanoma patient samples are also shown for comparison. The scale for colors includes: blue for row minimum levels of methylation of CpG sites in indicated genes or ctDNA levels (copy number/mL plasma) and red for row maximum levels of methylation of CpG sites in indicated genes or ctDNA levels (copy number/mL plasma). A black box indicates data was not determined. The chromosome position and number is indicated for each CpG site. (B) ROC curve was based on median methylation using the fraction of methylation for each of the most significant individual differentially methylated CpG sites for healthy control samples and melanoma patient samples.
Applsci 09 05074 g004
Table 1. Cohort used for methylation analysis.
SubjectAge (years)Current Treatment at SamplingTumor MutationctDNA (copies/mL plasma) #wtDNA (copies/mL plasma)#ctDNA Fraction (MAF%)Input Circulating Free DNA for Bisulfite Conversion (ng)
Healthy 132No treatment NDND3238ND23.56
Healthy 253No treatment NDND2188ND18.22
Healthy 337No treatment NDND2045ND17.33
Healthy 430No treatment NDND1477ND14.67
Healthy 554No treatment NDND1420ND15.11
Melanoma 176PembroBRAF V600E30,35056,2503521.78
Melanoma 2a (PRE *)61Combi-DTBRAF V600K4960580046.115.00
Melanoma 2b (EDT **)61Ipi + nivoBRAF V600K1615580021.820.80
Melanoma 375No treatment.
Pre-ipi
NRAS Q61R200252,2000.0820.00
Melanoma 438Ipi + pembroNRAS Q61K10,80010,25051.324.89
* Liquid biopsy obtained from patient 2 prior to immunotherapy treatment. ** Liquid biopsy obtained from patient 2 while on immunotherapy treatment (nivolumab + ipilimumab). # Determined using ddPCR. ND, not determined; PRE, pre-treatment; EDT, early during treatment; MAF, mutant allele frequency; nivo, nivolumab (anti-PD1); pembro, pembrolizumab (anti-PD1); ipi, ipilimumab (anti-CTLA4); combi-DT, combination dabrafenib (BRAF inhibitor) and trametinib (MEK inhibitor); ct, circulating tumor; wt, wild-type.

