Article

Absorption and Remission Characterization of Pure, Dielectric (Nano-)Powders Using Diffuse Reflectance Spectroscopy: An End-To-End Instruction

1
School of Physics, Osnabrueck University, Barbarastr. 7, 49076 Osnabrueck, Germany
2
Department of Electrical Engineering and Information Technology, South Westphalia University of Applied Sciences, Haldener Str. 182, 58095 Hagen, Germany
3
Center for Cellular Nanoanalytics, CellNanOs, Osnabrueck University, Barbarastr. 11, 49076 Osnabrueck, Germany
*
Author to whom correspondence should be addressed.
Appl. Sci. 2019, 9(22), 4933; https://doi.org/10.3390/app9224933
Submission received: 30 September 2019 / Revised: 12 November 2019 / Accepted: 13 November 2019 / Published: 16 November 2019

Abstract

:
This paper addresses the challenging task of optical characterization of pure, dielectric (nano-)powders with the aim to provide an end-to-end instruction from appropriate sample preparation up to the determination of material remission and absorption spectra. We succeeded in establishing an innovative preparation procedure to reproducibly obtain powder pellet samples with an ideal Lambertian scattering behavior. As a result, a procedure based on diffuse reflectance spectroscopy was developed that allows for (i) performing reproducible and artifact-free, high-quality measurements as well as (ii) a thorough optical analysis using Monte Carlo and Mie scattering simulations yielding the absorption spectrum in the visible spectral range. The procedure is valid for the particular case of powders that can be compressed into thick, non-translucent pellets and neither requires embedding of the dielectric (nano-)powders within an appropriate host matrix for measurements nor the use of integrating spheres. The reduced spectroscopic procedure minimizes the large number of sources for errors, enables an in-depth understanding of non-avoidable artifacts and is of particular advantage in the field of material sciences, i.e., for getting first insights to the optical features of a newly synthesized, pure dielectric powder, but also as an inline inspection tool for massively parallelised material characterization.

1. Introduction

Diffuse reflectance spectroscopy (DRS) of (nanoscaled) powders is a widely applied, powerful tool in material sciences and industry [1,2,3]. The scattered intensity of an incident light beam is scanned as a function of the wavelength over the sample and the data set is analyzed with respect to its macroscopic optical characteristics, such as the overall reflectivity. Moreover, DRS potentially enables the determination of the absorption characteristics of the particles themselves, even for particles on the sub-micron length scale. The absolute values as well as the dispersive features of the absorption coefficient are significant for a variety of materials with large commercial potential, such as pigments or phosphors. Absorption properties determine the macroscopic optical features of dielectric powders to a great extent, but are also responsible for the losses of internally emitted light.
The success in the determination of the absorption features goes along with a thorough knowledge on the relation between the diffusely reflected (remitted) signal intensity and the optical properties of the dielectric materials as well as the powder characteristics including particle size distribution and filling factor. The particular type of light-interaction with powders has been addressed worldwide in a series of theoretical studies over the last decades (cf., e.g., [1,2,3,4,5,6,7,8,9,10,11,12,13,14]). Alike, an innumerable amount of experimental methods and procedures for powder sample preparation have been developed and can be found as an established state-of-the-art tool in nearly any physico-chemical laboratory today.
However, the complexity of the underlying problem of light–matter interaction within a sample characterized by a pronounced disorder on the nanoscale is connected with a number of challenges along the entire procedure covering sample preparation, measurement, analysis and identification of artifacts up to the final determination of the absorption coefficient over a large spectral range. As an example, the experimental detection of diffusely scattered light in a large solid angle using integrating spheres already is far from trivial and sometimes not even feasible, e.g., if the internal coating is not virtually perfectly wavelength-independent, a substitution correction is missing, fluorescence or phosphorescence occurs, or a gliding-off of a (brittle powder) sample contaminates the sphere [15,16,17,18,19]. Accordingly, the application of DRS often lags behind its capabilities and is primarily used for the determination of macroscopic optical parameters. Moreover, there exists no in-depth end-to-end instruction in literature so far.
This paper addresses the challenging task of the optical characterization of pure, dielectric (nano-)powders with the aim to provide an end-to-end instruction from appropriate sample preparation up to the determination of absorption spectra. Particular emphasis is placed on the presentation of an innovative preparation procedure for producing powder pellets that allows the ability to obtain samples showing an ideal Lambertian scattering behavior while also being highly reproducible. As a result, a reliable experimental access to diffuse reflectance spectroscopy and ensuing determination of the absorption coefficient α using thick, non-translucent samples is provided. The original approach makes use of a minimized experimental procedure in order to curtail the number of free parameters and thus also to circumvent potential error sources. Powder pellets lacking extraneous host materials are used while integration spheres are skipped entirely in order to provide an alternative route for material characterization. These experimental simplifications enable the possibility for Monte Carlo simulations of light propagation along multiple scattering, diffraction and absorption events within the powder pellet. Advantages of this approach include a high quality of the obtained reflectance spectra, a high reproducibility with respect to the determination of the absorption features and a straightforward identification of signal artifacts, that also allows for their subsequent reduction.
In what follows, we present our findings along with the optimized end-to-end instruction with a nanoscaled, pure dielectric powder of rutile-phase TiO 2 as an example. Section 2.1 is devoted to the preparation of pure, non-translucent powder pellets. The experimental requirements and procedures are presented in Section 2.2. Section 3 covers diffuse reflectance spectra obtained with rutile, potential artifacts and includes methods to avoid such. The obtained data enter theoretical considerations using the commonly applied Kubelka–Munk theory to derive a material’s band gap energy by means of Tauc plots. Further considerations involving Mie theory are elaborated in Section 4 for the use of appropriate simulation methods via either iterative ab initio calculations or Monte Carlo simulations in order to extract α as a function of wavelength from the DRS data. Subsequently, Section 5 summarizes the aforementioned and includes possibilities, e.g., for the integration of this approach within an industrial inline process. Concluding remarks are provided in Section 6.

2. Materials and Methods

2.1. Sample Preparation

In order to successfully conduct optical characterization of powders, especially via DRS, a suitable preparation technique is required. In the following, a method is presented to produce highly diffusely reflecting and opaque samples, i.e., their surface acts as a Lambertian scatterer while light transmission through the sample is negligible. Both conditions can be met by compressing the powder into a solid pellet as elaborated in references [1,15].
Naturally, this preparation becomes difficult or outright impossible when materials do not tend to form aggregates. This may be caused by too large grains on the order of ten micrometers and above if no smaller particles are present to coagulate the powder. Nevertheless, particles sizing down to 1 μ m may still cause problems if their surfaces are very smooth or silanized. In the latter case, they possess a hydrophobic coating, such that they do not jam and thereby also do not stick together. Apart from these conditions, nearly any material sizing below 1 μ m can be pressed into a pellet.
For compression, all components coming in contact with the powder needs to be inert to the substances involved, i.e., their hardness and corrosion resistance are of particular importance. Owing to their low durability upon mechanical stress, glasses and monocrystalline materials are generally unfavorable. Instead, hardened, stainless steels such as DIN X90CrMoV18 (EN 1.4112-AISI 440B) with a Rockwell hardness above HRC 55 [20] are preferred.
In order to ensure a matte finish of the pellet, a sheet of paper placed on the front-side of the pellet or a clean ceramic can be used to avoid glossy surfaces as a result of a direct contact to the steel components [1]. Ideally, the powder is directly pressed into a sample holder which may then be immediately placed into the measuring device for further investigations without ever removing the material from the holder during this time. This way, the exact shape of the sample will be preserved while the risk of breaking or scratching of the pellet is minimized as opposed to if it was taken out of the sample holder.
In the following, two custom methods to prepare powder pellets that primarily differ in their performance and reliability will be presented. While fully automated pellet preparation devices [21,22,23,24] are commercially available at a typically much higher cost that may only amortize upon large-scale production, they may not necessarily be suited for the materials of interest, e.g., very hard and highly abrasive powders such as aluminum oxides or strongly translucent samples that require nonstandard thicknesses. Therefore, this kind of preparation technique will be omitted henceforth.

2.1.1. The Manufacturer’s Choice

Based on well-established pharmaceutical processes in producing pills [25,26,27,28,29,30,31,32] or as commonly known from FTIR spectroscopy [33,34,35,36,37,38,39,40], the following method is adapted for preparing samples for diffuse reflectance studies. Figure 1 illustrates the overall design for the powder press.
In contrast to pharmaceutical applications, the investigated materials (particles) are often just loosely adhering to each other and hence require additional stabilization for support. This is provided by a sample ring (4) which remains around the pellet throughout all optical investigations. A clean ceramic plate onto which the powder sample is pressed by means of a tappet ensures a matte finish to the sample surface. The safest method to remove these highly fragile pellets from the powder press is to disassemble the press itself to ensure minimal stress and shock to the sample. This modular approach can be realized by assembling the components listed below and shown in Figure 1:
  • Stainless steel bottom plate.
  • Ceramic slice (glued on the bottom plate by a two-component adhesive).
  • Stainless steel bouncing plate (for fixating other components).
  • Stainless steel sample ring (depending on the available amount of powder we suggest a diameter of 10 m m –20 m m and 4.5 m m depth).
  • Stainless steel cover plate (suitable for fitting the sample ring).
  • Stainless steel tappet (matching the funnel).
  • Stainless steel funnel (for inserting powder and directing the tappet).
  • Stainless steel cylinder.
  • Aluminum screws (to affix the other components. Aluminum is used in order to reduce wear of the adjacent components).
  • Recoil-free hammer.
  • Stainless steel spatula (for filling in the powder).
  • (Nano/micro) powder sample.
The preparation of samples, including the assembly of the powder press, follows the recipe given below to construct the setup presented in Figure 1.
  • Let the tappet slide in the funnel on a clean planar surface (e.g., table, but not on the ceramic slice) and mark the position on the tappet at the upper end of the funnel. The ceramic slice itself must never come in contact with the tappet or other components as this would cause contamination of its surface which are relayed onto the sample.
  • Affix the clean and dry bottom plate (including the ceramic slice) to the bottom of the cylinder, either by a screw thread or a plug connection.
  • Place the sample ring on the ceramic slice and cover it with the bouncing plate.
  • Fix the bouncing plate with the screws through the cylinder’s threads.
  • Screw the funnel into the sample ring.
  • Pour sample powder through the funnel.
  • Gently tap the powder with the tappet by hand.
  • Fill sufficient powder into the funnel to allow compression by hammer-tapping. Throughout compression, the tappet may not come into contact with the sample ring as further strokes will be directed into the ceramic plate, potentially causing it to shatter while abraded metal could contaminate the sample.
  • Stop tapping when the powder cannot be compressed further, so that the marked position on the tappet can be seen at the upper end of the funnel now.
  • Unscrew the funnel and adjust the cover plate into the sample ring.
  • Carefully unscrew the fixing screws from the cylinder.
  • Hold your fingers on the bouncing plate and carefully turn the whole powder press upside down.
  • Pull off the cylinder and examine the surface of the sample pellet.

2.1.2. The Poor Man’s/DIY Choice

An alternative method captivates by a comparably simple setup and easy preparation routine [41]. Especially for a low amount of samples to be reproducibly prepared, this may be a valid choice to the before-presented powder press. Similar to the powder press, the prepared pellet will remain in a dedicated sample holder for increased stability during further investigations. Provided the preparation of the sample was performed under low pressure, the material may even be recycled again. The required components are listed below and shown in Figure 2.
  • Recoil-free hammer.
  • Dried paper.
  • (Nano/micro) powder.
  • Stainless steel spatula (for filling in the powder).
  • Tappet (with a planar surface).
  • Hollowed stainless steel sample holder (depending on the available amount of sample material, we suggest a bore hole diameter of approx. 10 m m and at least 3 m m in depth).
  • Razor/doctor blade, or
  • Thin glass slide.
Samples can be produced in a manner outlined below:
  • Place the paper (and sample) in an oven at around 60 C (if sample allows) for a few hours to remove excess humidity. This way, the amount of powder sticking to the paper during later preparation will be minimized. Furthermore, traces of water in the diffuse reflectance spectrum are strongly reduced.
  • Pour or scoop the dry powder sample into a clean sample holder using the spatula.
  • When the sample holder is filled with a heap of material, the dried sheet of paper is placed on top. Then the powder is compressed by placing the tappet onto the paper and hitting former with a hammer.
  • Repeat adding additional powder into the sample holder until the pellet is no longer compressible.
  • If a heap of material remains, carefully stroke it away with a clean razor blade (preferably doctor blade) or a thin glass slide, respectively. Add additional powder if necessary and repeat the above procedure.

2.2. Measurement Setup: Requirements and Procedures

Diffuse reflectance spectra require a specific optical setup for accurate and reproducible measurements. While it is possible to assemble it from scratch, yielding appreciable results, several dedicated spectrometers are commercially available at the time of writing this paper for higher precision measurements (cf. Table 1). Naturally, successor or predecessor models are, depending on their specifications and measurement options, also suitable.
Since double-beam spectrometers measure sample and white standard simultaneously, the determination of the diffuse reflectance of non-luminescent samples becomes facile, fast and reliable. Due to the parallel acquisition method, lamp intensity fluctuations pose no problem. However, in case of fluorescence, extraneous light emission at wavelengths distinct from the excitation creates spurious additional signals that render an unfiltered diffuse reflectance spectrum inaccurate. Using a fluorescence spectrometer instead yields the specific advantage to perform diffuse reflectance measurements on any material at relative ease. For studies on biological samples, however, light is frequently focused either into a cuvette or onto a surface, making such a setup highly susceptible to measurement artifacts as will be explained in Section 2.2.1. Such a scenario is henceforth omitted in favor of a collimated (or, optionally, defocused) beam. In the following, we will explain the principal scheme of a dedicated fluorescence spectrometer with the FLS980 (Edinburgh Instruments) as an example whose layout is sketched in Figure 3.
For fluorescent samples, a setup utilizing two individual monochromators is essential: The excitation monochromator selects an wavelength region for sample illumination while the emission monochromator transmits the linear diffuse reflectance of the sample, thereby canceling additional fluorescence emission. Hence, this method of operation is frequently termed as a synchronous scan, i.e., both monochromators are set to the same wavelength.
Apart from monochromators, additional spectral filters remove potential higher diffraction orders transmitted through grating-based monochromators and possible fluorescence of the sample. In case only monochromatic illumination is required, the light source/monochromator combination can be replaced by an appropriate laser or via bandpass filtering behind a broadband emission source.
If intensity fluctuations are a considerable factor, for instance due to power drifts of the lamp or ambient temperature changes, it is recommended to split a small portion of the excitation light into a low-drift reference detector. The bulk remainder will be used for sample illumination. This way, measured diffuse reflectance intensities can be scaled by the signal of the reference detector. However, it should be taken into account that any additional detector will inevitably increase the overall electronic noise and should hence be used with care.
A horizontal alignment of the powder sample has the distinct advantage of eliminating potential contamination of the spectrometer through material gliding off of the (brittle) surface compared to vertically placed samples as it is common in integrating spheres where an additional cover window is often used to keep the powder in place [15,16]. With the horizontal alignment, the sample remains preserved throughout the measurement and contamination of its surroundings is avoided even without a superfluous cover window. Furthermore, a parallel excitation/emission beam geometry avoids specular reflection losses originating from a slight tilt of the incident light direction with respect to the sample surface normal. This significantly reduces the impact of non-perfectly-Lambertian sample surfaces. To account for this geometry, the beam path requires at least one additional mirror to reflect the excitation beam downwards onto the sample. In an optimized setup this mirror also relays the emission beam towards the detection arm. A realization of this design is presented in Figure 4.
Diffusely reflected light from the sample is directed into the path of optical detection and is subsequently recorded by a detector within the spectrometer, e.g., a photomultiplier tube (PMT). For simplicity, we will focus on single-channel detection.

2.2.1. Experimental Difficulties

A number of conditions may impair a successful optical characterization using DRS. The following list summarizes detrimental scenarios that should be avoided:
  • Different distances between light source and sample surfaces: excitation and/or detected diffuse reflectance intensity changes ( I 1 / r 2 with optical pathlength r for a point light source). Furthermore, focusing optics are frequently used to increase the illumination intensity. When the axial position of the sample is altered, the excitation spot size may also vary, thereby modifying the incident intensity. This effect may be enhanced by possible focusing optics and/or apertures within the beam path. Likewise, since the detection arm collects diffusely reflected light from a defined solid angle, a change in the diffuse reflectance position results in an altered amount of light that is being relayed to the detector (cf. Figure 5. Note that even in the absence of an aperture, the detector will collect a different intensity depending on the sample position).
    As a result, even minimal deviations in the axial position can cause significant variation in the measured signal intensity yielding large errors in the observed diffuse reflectance, if the positions among the white standard and powder samples differs as will be shown at a later point (cf. Figure 11).
  • Thin layers: the sample is partly translucent. Light reaches the sample carrier and (depending on its optical properties) can be reflected or transmitted further, thereby significantly altering the backscattering properties. Depending on the material, we recommend well-pressed pellets with thicknesses of at least 3 m m to minimize such effects.
  • Irregularities of the sample-surface: bumps, gaps or slants. Remitted intensities change considerably under grazed incidence angles as quantified by Lambert’s Cosine law [1,3]. With a severely disturbed matte surface, Lambertian behavior cannot be assumed anymore and diffuse reflectance is affected by geometrical instead of material specific effects. In this case, a re-preparation of the sample becomes necessary.
  • Unequal irradiation positions on sample surface: the smaller the irradiation area, the higher the influence of local sample inhomogeneities on the diffuse reflectance. This way, reproducibility is severely hampered and significant signal fluctuations between individual positions can be expected. Improvement is achieved by maximizing the irradiation area to the sample size, thereby averaging out local irregularities. Nevertheless, there must be a significant separation of illumination area and sample border in order to avoid light propagation through the sample onto the sample-holder wall, as only the sample must be illuminated. Exposure of any other component must be avoided.
  • Inappropriate monochromator bandwidths: for a synchronous scan, the excitation Δ λ Ex and emission band Δ λ Em need to share a spectrally high overlap. In particular, the transmission bandwidth of one monochromator must be a subset of the other such that a slight discrepancy in central wavelengths of the monochromators do not cause a sudden drop-off of the signal. If, for example, both monochromators transmit a bandwidth Δ λ Ex = Δ λ Em = 0.2   n m of a white light continuum (i.e., the spectral intensity is constant throughout the investigated range) but the central wavelength of the emission monochromator is detuned by 0.1 n m in comparison to the excitation monochromator, half of the signal is lost in this specific case. For a different wavelength, the detuning may be either smaller or larger, thereby severely affecting the measured diffuse reflectance. During a wavelength sweep, one monochromator should therefore be set to a broader spectral bandwidth than the other while exceeding the spectral resolutions of each (e.g., Δ λ Ex = 8   n m vs. Δ λ Em = 2   n m ). Naturally, the spectral bandwidth depends on the exact type and resolution of the utilized monochromators and the desired wavelength quantization in the experiment. It has to be optimized for each spectrometer separately. As with position-deviations, this effect is highlighted in more detail in Figure 11.
  • Low detection signals: Noise becomes a sizable factor in measured signals. Because the diffuse reflectance is defined through a division between sample and white standard intensity, low count levels, especially with the white standard, will lead to potentially diverging diffuse reflectance values. This situation is mostly reinforced by considerable intensity differences of the excitation light source for varying wavelengths as well as by the utilized blazed gratings within the monochromators which are only designed for specific spectral ranges. With the present setup, this becomes apparent for wavelengths above 800 n m as will be shown in Figure 6 and Figure 7. A remedy consists of splitting the investigated spectral range into subsections, optimizing each for satisfactory signal quality and finally merging all scans into a single diffuse reflectance spectrum.
  • Very high detection signals exceeding the detector’s linearity range. For very large irradiances, the detector undergoes saturation, i.e., higher intensities lead to a sublinear increase of the signal, and thereby distort diffuse reflectance spectra (in the worst case, also damage the detector irreversibly). Subdivision of the spectral range and merging these individual scans may prove beneficial here as well.
  • Higher order diffraction from monochromators: Additional wavelengths unintentionally irradiate the sample and contribute to an artificially increased signal. Hence, additional wavelength discrimination by bandpass or longpass filters becomes mandatory. The resulting diffuse reflectance in the absence of such filtering will be shown in Figure 9b.
  • Material luminescence (fluorescence and phosphorescence): Additional light is emitted by the sample at a different wavelength. While spectral filtering of the emission signal provides some control about the wavelengths reaching the detector, a wavelength sweep from UV to VIS means that long-lived states may still luminesce when the emission wavelength is reached [57,58]. Unless the substance to be characterized is known to be an upconversion material [59,60], scanning from longer towards shorter wavelengths or at least limiting the investigated spectral range can help suppressing luminescence.

2.2.2. White Standards

In general, experimental determination of precise, absolute values for diffuse reflectance of a sample is challenging. It inevitably requires the thorough knowledge of the applied spectrometer, in particular of its optical transfer function. The use of reference materials with well documented diffuse reflectance is a common approach to study the spectrometers’ pecularitites and for calibration purposes. Such white standards typically possess a characteristic diffuse reflectance over a wide spectral range. The diffuse reflectance R = I s / I ws then is determined from both, the diffuse intensity signal of sample I s and of the white standard I ws .
Historically, micro- and nano-scaled powders of magnesium oxide (MgO) and barium sulfate (BaSO 4 ) are chosen as white standard materials since they feature a pronounced and spectrally homogeneous diffuse reflectance in the visible [1,3,15,18,61,62,63]. Within the past decades, powders of aluminium oxides (Al 2 O 3 ), titanium dioxide (TiO 2 ) or sintered powder polytetrafluoroethylene (PTFE) [3,64,65,66,67,68,69,70,71,72] became available with high optical quality as well. Table 2 summarizes the most prominent white standards and their individual optical characteristics.
The choice of white standards therefore is dependent on the material under investigation and must accord with the particular features of the spectrometer. It should be noted that the given features refer to materials of highest chemical purity, i.e., the sample features may vary dependent on the materials’ manufacturer. For the investigations described below, we have chosen alpha-aluminum oxide, α -Al 2 O 3 and prepared a powder pellet according to the procedure described in Section 2.1.

2.2.3. Signal-To-Noise Ratio

The quality of the finally determined diffuse reflectance spectrum is very much dependent on the signal-to-noise ratio (SNR) of the experimentally determined intensity signals. Straightforwardly, the SNR can be improved by increased integration times related with signal detection. This presumes a stable setup for the entirety of the measurement procedure as well as a reference detector to sample the stability of the incident intensity of the probing light. Furthermore, the noise of the reference detector has to be taken into account. Alternatively, multiple fast scans with subsequent mathematical averaging over the individual data sets may be preferred. In terms of reproducibility, a fixed routine is imperative, explicitly including a startup procedure allowing for thermal stabilization of excitation lamp and detectors.
A common, subsequently applied three-fold scan would then consist of:
  • Measure white standard.
  • Measure sample.
  • Measure white standard.
This procedure has the distinct advantage to account for slower temporal fluctuations of the incident sampling light as the wavelength-dependent diffuse reflectance of the sample (s) is scaled to the average of the two diffuse reflectance measurements of the white standard (ws):
R ( λ ) = I s ( λ ) 1 2 I ws ( 1 ) ( λ ) + I ws ( 2 ) ( λ )
with the spectrally measured intensities I ( λ ) .
Alternatively, if intensity drifts occur on shorter timescales, the measurement time per sample can be reduced by drastically decreasing integration times per wavelength and successively switching back and forth between sample and white standard:
  • Measure white standard.
  • Measure sample.
  • Measure white standard.
  • Measure sample.
  • Measure white standard.
  • ...
In this case, the diffuse reflectance is determined by the averages of all white standard and sample measurements, respectively, yielding the generalized expression of Equation (1):
R ( λ ) = ( N + 1 ) n = 1 N I s ( n ) ( λ ) N n = 1 N + 1 I ws ( n ) ( λ )
with N being the total number of sample measurements and therefore N + 1 being the number of white standard measurements.
A similar procedure may be applied when different samples are to be characterized in a sequence. In this case, the procedure is:
ws s 1 ws s 2 ws ,
meaning that two adjacently measured white standard spectra for averaging belong to each individual sample measurement.
It must be added that it is necessary to account for (blazed) grating switches within the monochromators during the measurement. Grating switches cause an interruption in the scanning process and, therefore, must be excluded within the above sketched measurement procedures. It can be realized by subdivision of the spectral range into regions that accord with the spectral windows of the individual optical gratings. Merging the results of all scans then yields the complete diffuse reflectance spectrum.

3. Diffuse Reflectance Spectroscopy: Analyzing Results

Taking the previous considerations into account, this section features examples of experimentally determined diffuse reflectance spectra and their accurate interpretation. We will focus on spectra in the visible range (VIS) unless otherwise specified. Further attention lies on the identification of artifacts and their consequences on the diffuse reflectance spectra. Lastly, experimental data are plotted in a Tauc plot for quick determination of the material’s band gap energy E g .

3.1. (White) Standard Comparison

Since the diffuse reflectance is measured against a reference material, it is advisable to take a white standard that is particularly absorption-free in the VIS. From potential materials as outlined in Table 2, we will exemplarily focus on the class of aluminum oxides for their excellent chemical inertness such as water insolubility, i.e., they are non-hygroscopic, and particle size well below 10 μ m [78,79]. Investigated white standard materials include CR30F (Baikowski), AA-03 (Sumitomo), ZWSK F2000 (Imerys Fused Minerals), and, for comparison, the sintered PTFE material RESTAN (Image Engineering) [80,81,82,83]. All powder samples have been prepared according to the procedure described in Section 2.1.1, yielding a pellet thickness of 4.5 m m . The RESTAN sample has been cut out from a bulk-material, rasped into the same dimensions as the powder samples and inserted into a sample holder which was shown in Figure 1.
Figure 6 shows the detected signal from each white standard as a function of wavelength, normalized to the maximum signal recorded from all samples. The excitation monochromator was operated at a bandwidth of 9 n m whereas the emission monochromator was set to a bandwidth of 1.7 n m . During this sweep, a spectral step size of 1 n m was chosen with an integration time of 1 s . Each sample’s diffuse reflectance has been averaged over three scans.
The curves highlight the central features of the 450 W xenon arc lamp with its broadband emission spectrum throughout the VIS as well as its sharp emission lines between 400 n m –500 n m (an isolated emission spectrum is shown in Figure 10). The suppression of signals towards the near infrared range can be attributed to the declining spectral sensitivity of the PMT detector for longer wavelengths (also shown in Figure 10). Due to the low signals in this range, the diffuse reflectance beyond 800 n m should be treated critically.
All investigated white standards exhibit a similar spectral diffuse reflectance behavior with a normalized signal intensity difference of up to 0.1 (absolute value).
Considering the remarkable (absolute) reflectance of RESTAN on the order of 0.98 throughout the visible region [76], this result highlights the excellent suitability of the investigated aluminum oxide powders. However, as RESTAN’s maximum diffuse reflectance may only be obtained for sample thicknesses exceeding 8 m m [76], direct comparison between these 4.5 m m -pellets is not advisable as considerable influence by the sample holder can be assumed in the PTFE material. In this regard, the investigated powders clearly demonstrate to be advantageous for samples at lower thickness whereas PTFE may become a reasonable alternative as a white standard when thickness (and thus, volume) of the sample is not a concern.

3.2. Example Materials

Diffuse reflectance spectra were measured with different batches of rutile-TiO 2 and YAG:Ce using the white standard CR30F (cf. Figure 7). In addition to a nominally pure TiO 2 powder sample, we also inspected the spectra of a considerably contaminated TiO 2 powder sample. The latter has been prepared following a different synthesis route and, most probably, a contamination appeared due to steel abrasion from one of the powder crucibles and/or the presence of residual oil. This sample will be used to highlight the impact of deviations of the optical quality via direct comparison with the spectra obtained for the nominally pure TiO 2 reference sample.
Evidently, measurements are highly reproducible as demonstrated by the three diffuse reflectance spectra of the impure TiO 2 sample which deviate no more than 0.01 in the VIS in relation to a common mean (cf. Figure 7b). In contrast to nominally pure TiO 2 , the overall diffuse reflectance is attenuated by approximately 0.25 for VIS wavelengths, concluding the influence of the spectrally flat contaminant. Because the diffuse reflectance is highly sensitive to even small contaminations [1], DRS thus offers a precise tool for detecting such impurities. Furthermore, even small fluctuations in the diffuse reflectance spectrum can point towards notable features. These features can be amplified by taking the first or second derivative of the spectrum [15].
Towards the electronic band gap, the diffuse reflectance drops for wavelengths below 410 n m and approaches a common value of 0.08 for both TiO 2 -samples. This finding is in line with related studies [84,85,86,87] and shows that, even for interband transitions, a fraction of the incoming light is backscattered.
In contrast to TiO 2 , YAG:Ce possesses a vastly different diffuse reflectance spectrum. The Ce 3 + absorption band at approximately 460 n m induced by its 2 F 5 / 2 5 d 1 electronic transition [88,89] dominates the otherwise high diffuse reflectance which rivals that of the used white standard above 550 n m . Even in the center of this absorption band, the diffuse reflectance does not fall below ≈ 0.1 , once again underlying the material-specific interplay between absorption and scattering. A second absorption dip of the diffuse reflectance in the UV below 370 n m indicates the onset of the 2 F 5 / 2 5 d 2 transition of Ce 3 + [88,89].
A common feature for all investigated samples is an increase of noise beyond 800 n m due to an overall weak signal as indicated by the white standard evaluations (cf. Section 3.1, Figure 6). Furthermore, an elevation of the diffuse reflectance at 700 n m is observed in all measurements. Based on additional scans with other substances and white standards, this peak can be attributed to a small absorption of the CR30F α -Al 2 O 3 white standard. Comparative studies using TiO 2 against different white standards clearly reveal a dependence of the local increase of diffuse reflectance at 700 n m on the choice of reference material as evident in Figure 8.
As larger grain sizes entail an increased optical path length through the pellet, small residual material absorbances appear more pronounced and thus give rise to a reduced diffuse reflectance. In other words, the requirements in terms of microscopical material absorption are higher for coarse white standards than for small grain materials.
In Figure 8, the coarse grained α -Al 2 O 3 white standard F1200 (Imerys Fused Minerals, mean particle size d 50 = 3.0   μ m [90,91]) causes an exaggerated increase of the TiO 2 overall diffuse reflectance compared to the smaller grains of F2000 ( d 50 = 1.2   μ m [90,91]) or the smallest ones in CR30F ( d 50 = 0.38   μ m [80]).
Surprisingly, a reverse case occurs for the local maximum of diffuse reflectance at 700 n m . Here, a measurement against the finest white standard CR30F entails the most striking diffuse reflectance peak indicating a local absorption peak, whereas the coarsest F1200 shows almost no elevation of the diffuse reflectance around 700 n m . As uncontrolled impurities of foreign atoms may strongly affect the spectral properties of nanoscaled Al 2 O 3 powders [92,93], possibly due to an increased treatment process, the inexplicable bump around 700 n m may occur from an unintentional, additional absorption of such an impurity.
An increase of the white standard’s absorption at 700 n m therefore results in a local elevation of the diffuse reflectance. However, even if the spurious absorption peak diminishes, choosing a coarse grained white standard does not necessarily benefit quantitative diffuse reflectance studies as it artificially increases the overall measured diffuse reflectance of the material under investigation, thereby easily attaining values exceeding unity.
Depending on the situation, a feasible alternative includes utilizing a white standard that, at the cost of absolute diffuse reflectance, possesses a rather flat spectral response throughout the investigated wavelength region. Afterwards, a rescaling of the diffuse reflectance spectrum may be performed by comparing the “gray” standard itself with a known reference material [32,72]. Otherwise, bumps or dips may be falsely attributed to material properties that originally stem from the used white standard. Nevertheless, including the white standard in evaluations is crucial to compare diffuse reflectance between one another. The fact that the observed diffuse reflectance of TiO 2 changes significantly based on the used white standard highlights the need for a common and reliably reproducible white standard to ensure comparability and potential optimization of any material.

3.3. Pitfalls and Artifacts

Under certain conditions, diffuse reflectance data may deviate from truthful values. In the following, these artifacts will be discussed in more detail.

3.3.1. Higher Order Diffraction

Owing to potential higher order diffraction in gratings, e.g., the second order at half the center wavelength, the diffuse reflectance may be severely affected. Consequentially, appropriate spectral filtering is essential to minimize the influence of spurious wavelengths by such higher orders. Figure 9a exemplary shows the broadband spectrum after transmission through a monochromator before and after spectral filtering. Besides the desired signal at 700 n m , an additional peak at 350 n m can be clearly resolved. This disruptive peak can be eliminated via long-pass (LP) filters, yielding an unperturbed monochromatic spectrum.
Even though the spurious signals are comparably low in relation to the desired wavelength, their effect on the diffuse reflectance can be dramatic. Figure 9b displays the diffuse reflectance of the same rutile-TiO 2 sample (against the same CR30F white standard) with and without proper filtering after the excitation monochromator (cf. Figure 3).
Apart from the band gap absorption below 410 n m , rutile shows a relatively homogeneous diffuse reflectance through the VIS up into the near infrared wavelength range. However, for excitation wavelengths above 680 n m , additional higher order diffraction signals impinge sample and standard alike when the LP filter is not inserted which yield a notable decrease of the measured diffuse reflectance. This loss can be attributed to the significant UV-absorption of TiO 2 : For wavelengths λ > 680 n m the impinging spectrum contains a considerable UV component at half its nominal wavelength. This portion is strongly absorbed by TiO 2 , and as such only weakly remitted, compared to the CR30F white standard resulting in considerable attenuation of R . For wavelengths exceeding 820 n m , the second-order diffracted light is beyond the band edge of TiO 2 at λ / 2 > 410 n m , such that additional absorption is significantly reduced and the diffuse reflectance becomes comparable to spectrally filtered measurements.
Apart from the evident diffuse reflectance characteristics of the individual sample, this effect can be further enhanced or reduced depending on the spectrometer. The most important influences stem from the excitation spectrum of the light source and the spectral detector response. For example, if the spectral intensity of the excitation lamp at wavelength λ 1 is considerably lower than at its half wavelength λ 2 = λ 1 / 2 , the second-order diffracted line at λ 2 will appear strongly reinforced, thereby increasing the portion of stray radiation onto the sample. Depending on the spectral sensitivity of the detector η ( λ ) , this effect may become even further pronounced when η ( λ 2 ) > η ( λ 1 ) .
For reference, both excitation lamp spectrum and spectral detector quantum efficiency curve for the components used within the present studies have been plotted in Figure 10.
In the end, the measured intensity is a product of several additional spectral response functions that include, besides excitation light source and detection unit, any intermediary optics such as filters, lenses or monochromators.

3.3.2. Sample Positioning and Monochromator Settings

Diffuse reflectance measurements are highly sensitive to slight modifications of the experimental conditions, especially in terms of geometry. Tilting or changing the axial position of the sample with respect to the white standard can have significant influence on the overall diffuse reflectance and is quantified in Figure 11 for TiO 2 against CR30F. For reference, the effect of too small monochromator bandwidths in the synchronous scan is shown as well.
When the TiO 2 sample and the white standard are both identically tilted by 6°, the diffuse reflectance spectrum essentially remains identical compared to the reference position. Varying the position or angle of only the sample (or only standard, respectively) does not alter the shape of the diffuse reflectance spectrum; however, it yields substantial deviations in the overall amplitude: For minor tilts (e.g., by an angle of 0.6°), a shift of the diffuse reflectance in the VIS range by 0.1 is observed whereas this offset grows to 0.2 upon axial repositioning (e.g., 0.3 m m ). In this regard, a change of the diffuse reflectance upon tilting can likely be attributed to a local raise by a few 10 μ m . The drastic increase in diffuse reflectance for both misaligned positions is mainly caused by the different detected intensities due to a dissimilar optical path-length as was shown in Figure 5. Despite these serious differences in the VIS range, the diffuse reflectance becomes largely identical at the band gap for wavelengths λ < 410 n m . Hence, such errors may not appear evident at a first glance.
With just marginally differing measurement conditions, distinctions between samples are challenging to interpret. Even general conclusions such as a comparison between the whiteness of two materials requires a careful evaluation of the setup to ensure an identical situation for all samples. Thus, careful alignment is of utmost importance to utilize the setup’s sensitivity at its best.
When both sample and white standard are affected in the same manner, e.g., by an equal tilt, diffuse reflectance becomes reproducible (cf. Figure 11). This is confirmed by a further measurement at the reference position with equal excitation and emission monochromator bandwidths of Δ λ = 0.2   n m . Qualitatively, these two diffuse reflectance spectra exhibit similar amplitudes and shapes. However, owing to slight and irregular detuning between the two (narrow) monochromator slits, the diffuse reflectance is heavily affected and shows significant signal fluctuations throughout the visible spectral range.

3.3.3. Luminescence

As excitation spectra require additional filtering to remove secondary signals, similar considerations can be applied on the detection side. During a wavelength-sweep, luminescent materials may emit signals separated by an octave or more to the momentarily investigated wavelength. If the same setup is used on both excitation and detection side, such potentially transmitted higher order diffracted wavelengths entail a similar spectral filtering, especially if luminescence lifetimes become comparable to scan speeds, in particular when samples are cooled [97,98,99,100,101,102].
For short luminescence lifetimes (e.g., τ 65   ns for YAG:Ce [88]), samples may be treated like a non-fluorescent material because the luminescence decay time is significantly shorter than the measurement time of the spectrometer. For long decay times, a reverse wavelength-sweep is preferable, owing to the Stokes shift of the luminescence, i.e., emission can only be triggered by shorter wavelengths (neglecting anti-Stokes emission by upconversion luminescence [59], for instance), thereby circumventing the issue of higher-order diffractions. Alternatively, the forward scan direction (shorter to longer wavelengths) can be used if the investigated spectral range is divided into distinct sections: First, the region is investigated where no luminescence is present; the diffuse reflectance at regions of high absorption that are the prerequisite for luminescence are to be assessed lastly. However, wavelength regions with overlapping emission and absorption bands [89,102] may pose a hindrance and need to be evaluated on a case by case basis. Nevertheless, the use of color filters is recommended in either circumstance.

3.4. Tauc Plot

For evaluation of diffuse reflectance spectra, the Kubelka–Munk (K-M) function F ( R ) is frequently used [103]:
F ( R ) = K S = ( 1 R ) 2 2 R ,
which connects the diffuse reflectance R to an (abstract) absorption quantity K and scattering quantity S. Even though the K-M function is foremostly designed for calculating the ratio K / S , additional insight on the absorption characteristics can be obtained. Assuming that S changes negligibly within the wavelength region of electronic absorption, the K-M function becomes solely dependent on K. This way, information regarding the absorption α can be extracted which is connected to K through a functional relation involving the incident photon energy E = h ν and an electronic transition-dependent exponent n (cf. Table 3) [103]:
( F ( R ) · h ν ) n ( α · h ν ) n .
Similarly, the onset of the electronic band gap described through the absorption coefficient α may be linearized as follows [103,110]:
α · h ν = A 1 ( h ν E g ) n
with an arbitrary proportionality constant A 1 . Combining Equations (4) and (5) connects the band gap energy E g to the K-M function [110]:
( F ( R ) · h ν ) ( 1 / n ) = A 2 ( h ν E g ) .
By plotting the thus modified diffuse reflectance (mod. DR) against the photon energy h ν , the band gap energy E g can be extracted by a linear fit at its rise as shown in Figure 12. The crossing point between fit and abscissa will then immediately yield E g [41,111,112,113]. This procedure is also known as Tauc plot and is a powerful tool in the field of quantitative determination of band gaps and absorption centers.
With rutile-phase TiO 2 possessing a direct forbidden transition [114,115,116] the determined band gap amounts to E g = 3.03 ± 0.01   e V 409 ± 1   n m which is in excellent agreement with published results and underlines the validity of this method [117].

4. Theoretical Background and Simulations

Diffuse reflectance stems from light scattering of single particles and the light–matter interaction between individual scatterers. Originally, scattering at single particles of arbitrary size was described by Mie for spheres [118] yielding computationally expensive expressions that only nowadays can be calculated at relative ease [119]. A plane wave is scattered in a distinct fashion which differs significantly for varying material properties such as refractive index, absorption, or particle diameters. For example, the dependence of light scattering for different particle sizes is shown in Figure 13.
Mie theory, describing the general case of light scattering at spherical particles, can be approximated by less complex expressions for particles sizing towards either zero or infinity. For very small particle sizes in relation to the wavelength, i.e., d λ , the emission pattern is accurately described by Rayleigh scattering [120,121]: Light in the perpendicular polarization, with respect to an incoming linearly polarized plane wave, is scattered isotropically whereas the parallel polarization is characterized by a dipole radiation pattern. Especially in the context of coherent processes in the visible (VIS) and near-infrared (NIR) range, the particle size should not exceed 5 n m to 10 n m , although a large number of studies has used this treatment for larger particles as well [122] (sec. 2.5).
In the opposite case, that is for particles sizing well above 1 μ m , nearly all visible light is scattered into the forward direction with negligible scattering into other directions. This condition is the prerequisite for geometrical optics.
In general, nanoscaled particles typically exhibit a rather homogeneous scattering pattern when illuminated with visible to infrared light. Nevertheless, for accurate calculations, Mie theory or derived approaches should be preferred, especially when more complex particles such as anisotropic materials [123,124], multilayer systems [125,126,127,128], or nonspherical objects or clusters [129,130,131,132,133,134,135] are considered.
These theories work well in case of independent scattering, i.e., when radiative interparticle interactions can be neglected. Typical systems where this assumption holds true are diluted mixtures of colloidal suspensions, paints or pigments among several others [136]. With decreasing interparticle distances, that is when the interparticle clearance length c scaled by the wavelength λ approaches c / λ 0.3 [137], a considerable amount of scattered waves will interact with surrounding particles which is termed dependent or multiple scattering. In regards to practical applications such as paint layers, films, powders, pellets, etc., significant effort has been made to incorporate dependent scattering into the theoretical description of light–matter interaction [136,138,139,140]. Usually, light emitted from strongly packed particles is diffuse [1,141] which was initially treated by Kubelka and Munk using a purely statistical approach [142]. The framework developed by latter accurately describes observed diffuse reflectance and hence plays a vital part in the evaluation of material characteristics today [1,15].
Ideally, a matte, rough surface obeys Lambertian behavior, i.e., the radiance remitted is independent of the viewing angle [1]. The primary assumption relies on particles being small enough that they exhibit negligible gloss, such that their facets do not produce notable specular reflections. Secondly, the (macroscopic) sample itself must not possess glossy surfaces caused by either pressing or polishing. In terms of investigating powder samples experimentally, absorption and scattering coefficients α and σ , respectively, are inaccessible. Yet, these may be calculated from the diffuse reflectance R. Since the Kubelka–Munk function is only correct for infinitely thick samples, i.e., they must not transmit any light, the diffuse reflectance is denoted as R for clarity. Depending on the material and the interparticle distance, this condition is typically met after a few (sub-)millimeters [15,21,33,62,143,144,145,146].
In the context of the K-M function (Equation (3)), it is important to note that K and S themselves do not relate to any physical quantity due to mutual dependence [1,15,147]. Nevertheless, by including additional assumptions or parameters based on evaluation methods described below, further material-dependent properties can be deduced. The general interplay between experimental and theoretical viewpoints using Mie and K-M theory is highlighted in Figure 14.
Assuming that particle- and material-parameters, especially the size distribution q 0 ( d ) and complex-valued refractive index m are known, these values can be inserted into the Mie framework in order to obtain the microscopic Mie coefficients a n and b n . Based on these quantities, the macroscopic Kubelka–Munk absorption and scattering coefficients K and S can be extracted, taking the volume filling fraction of the powder pellet into account, which in turn may be used to calculate a theoretical diffuse reflectance R theo . A comparison with the experimentally determined diffuse reflectance R exp helps refining the starting parameters until a satisfactory overlap between both diffuse reflectances is attained. This feedback loop will be expatiated upon in Section 4.1 and Section 4.2.

4.1. From Microscopic to Macroscopic Quantities: Ab Initio Calculations

Performing ab initio calculations on particle ensembles to estimate their diffuse reflectance is a challenging endeavor due to the large number of steps and parameters involved that require considerable effort to determine or are straight out unknown. For example, while analytical expressions for individual particles exist, the response in the framework of dependent scattering may differ significantly. In practice, however, Mie calculations with a few corrective terms are typically sufficient [140]. Starting from arbitrarily chosen particle- and material-parameters such as their size distribution q j (with the most prominent quantities being the size distribution by number q 0 and by volume q 3 [148]) and complex-valued relative refractive index m = n particle / n medium = m i m [1,118], Mie theory is employed to calculate the Mie coefficients a n , b n in order to determine microscopic scattering, absorption and extinction efficiencies Q sca , Q abs , Q ext [119].
The link between these microscopic and their respective macroscopic quantities can be established by calculating the average path-length parameter and the forward-scattering ratio for diffuse radiation [141,149,150,151,152]. From these calculations, absorption and scattering quantities K , S are extracted that in turn may be invested into the Kubelka–Munk function (Equation (3)) to yield a theoretical value of the diffuse reflectance (cf. Figure 14). Based on these calculations, the starting parameters may have to be refined to yield a more accurate result in combination with experimental data. In a nutshell, a rough recipe to approach this kind of calculations would be as follows:
  • Use a Mie model to calculate the (microscopic) scattering and absorption efficiencies Q sca , Q abs as well as the scattering amplitudes S 1 , S 2 from the Mie coefficients a n , b n [1,119,153,154]. This can be based on classic Mie theory of spheres or advanced models such as stratified spheres, anisotropic particles or arbitrary objects. For simplicity, we exclusively consider isotropic spheres henceforth.
  • The K-M absorption coefficient K can then be defined as [152]
    K = 3 f V d Q abs
    with the volume filling fraction f V and the particle diameter d. The K-M scattering coefficient S is defined in a similar fashion [152]:
    S = 3 f V d ( 1 σ c ) Q sca
    where σ c is the forward scattering ratio that is derived and given in references [136,152].
  • For sufficiently thick samples, Equation (3) can be solved for R , yielding:
    R = 2 K S S 2 K S .
    In this case, neither particle size d nor volume filling fraction f V play any further role as they cancel out in Equation (9). However, for a translucent coating layer, Equation (9) becomes inaccurate and needs to be expanded to expressions including the diffuse reflectance of layers beneath the sample [1,152]. However, since this case is not covered by classic K-M theory, it will be omitted within this context.
This way, the diffuse reflectance of an opaque sample can be approximated by theoretical calculations for a single wavelength and particle size. The aforementioned procedure can be repeated for arbitrary wavelengths, thus generating a reflectance spectrum. Because this model only accounts for single scattering processes, it tends to overestimate the diffuse reflectance, especially where absorption becomes prominent: light is only attenuated once as opposed to potential subsequent scattering (and consequentially absorption) events at neighboring particles.
When the investigated sample is polydisperse, knowledge about the particle size distribution in either its differential form q 0 , 3 or integral form Q 0 , 3 (also termed as cumulative undersize) [148] is crucial. The distribution can be determined via dynamic light scattering, atomic force microscopy, electron microscopy or differential sedimentation [155,156,157,158]. A typical particle size distribution is shown in Figure 15.
Owing to a significant contribution to diffuse scattering originating from small particles (cf. Figure 13), it is of utmost importance to resolve the size distribution down to low nanometer-levels. In this regard, disc centrifuges (e.g., by CPS Instruments, Inc. or Brookhaven Instruments Corp. [159,160]) have proven to be a valuable asset in accurate size determination. The particle size distributions q 0 and q 3 are mutually dependent on each other and can be transformed as follows:
q 3 ( d ) = q 0 ( d ) · d 3 0 q 0 ( d ) · d 3 d d .
The denominator of Equation (10) is required for normalization, i.e., the cumulative undersize should approach 100% for d . Unless otherwise defined, we henceforth use the particle size distribution by number denoted by q 0 for simulations.
For each particle size d i , Q sca , Q abs , S 1 and S 2 are calculated. Afterwards, their weighted average is determined and used in subsequent calculations. This weighing is performed by using q 0 ( d i ) . For increased accuracy, especially when broad size distributions occur, a considerable amount of particle sizes should be sampled. In general, any polydispersity will wash out sharp Mie resonances at a single particle size.
Provided with an initial size distribution and a complex-valued refractive index m = m + i m , one may estimate the diffuse reflectance and vice versa, calculate m from R , as shown in Figure 16.
If the diffuse reflectance spectrum is known, further optimization may be carried out by modifying both m and q 0 ( d ) until a sufficient overlap between experiment and simulation is achieved. Because m and q 0 both have significant influence on macroscopic quantities, it is viable to affix one in order to calculate the other. For example, by setting q 0 immutable due to a preliminary size characterization, m alone is varied. Based on this approach, the absorption coefficient [162]
α = 4 π λ m
can be determined. This finding is of crucial importance, considering that it grants access to a quantity that traditionally could only be concluded from transmissive measurements which are impossible to conduct for many industrially important materials as they only exist as powders. While it is possible to directly calculate α from Mie as indicated in reference [163], the additional step via K-M theory helps relating predicted diffuse reflectances to measured ones for further parameter refinement and extraction of intermediary quantities such as K or S.
Nevertheless, because this approach only accounts for single light–particle interactions, i.e., a scattered photon will not interact with another particle, m is typically overestimated this way. Conversely, if the absorption dispersion is known beforehand, predictions of R will be skewed towards unity. Especially at spectral regions of high absorption, calculated R will be significantly larger than measured. While the introduction of empirically determined correction factors or exponents may provide reasonable remedy [164], a physically correct picture will only be painted by considering multiple scattering.

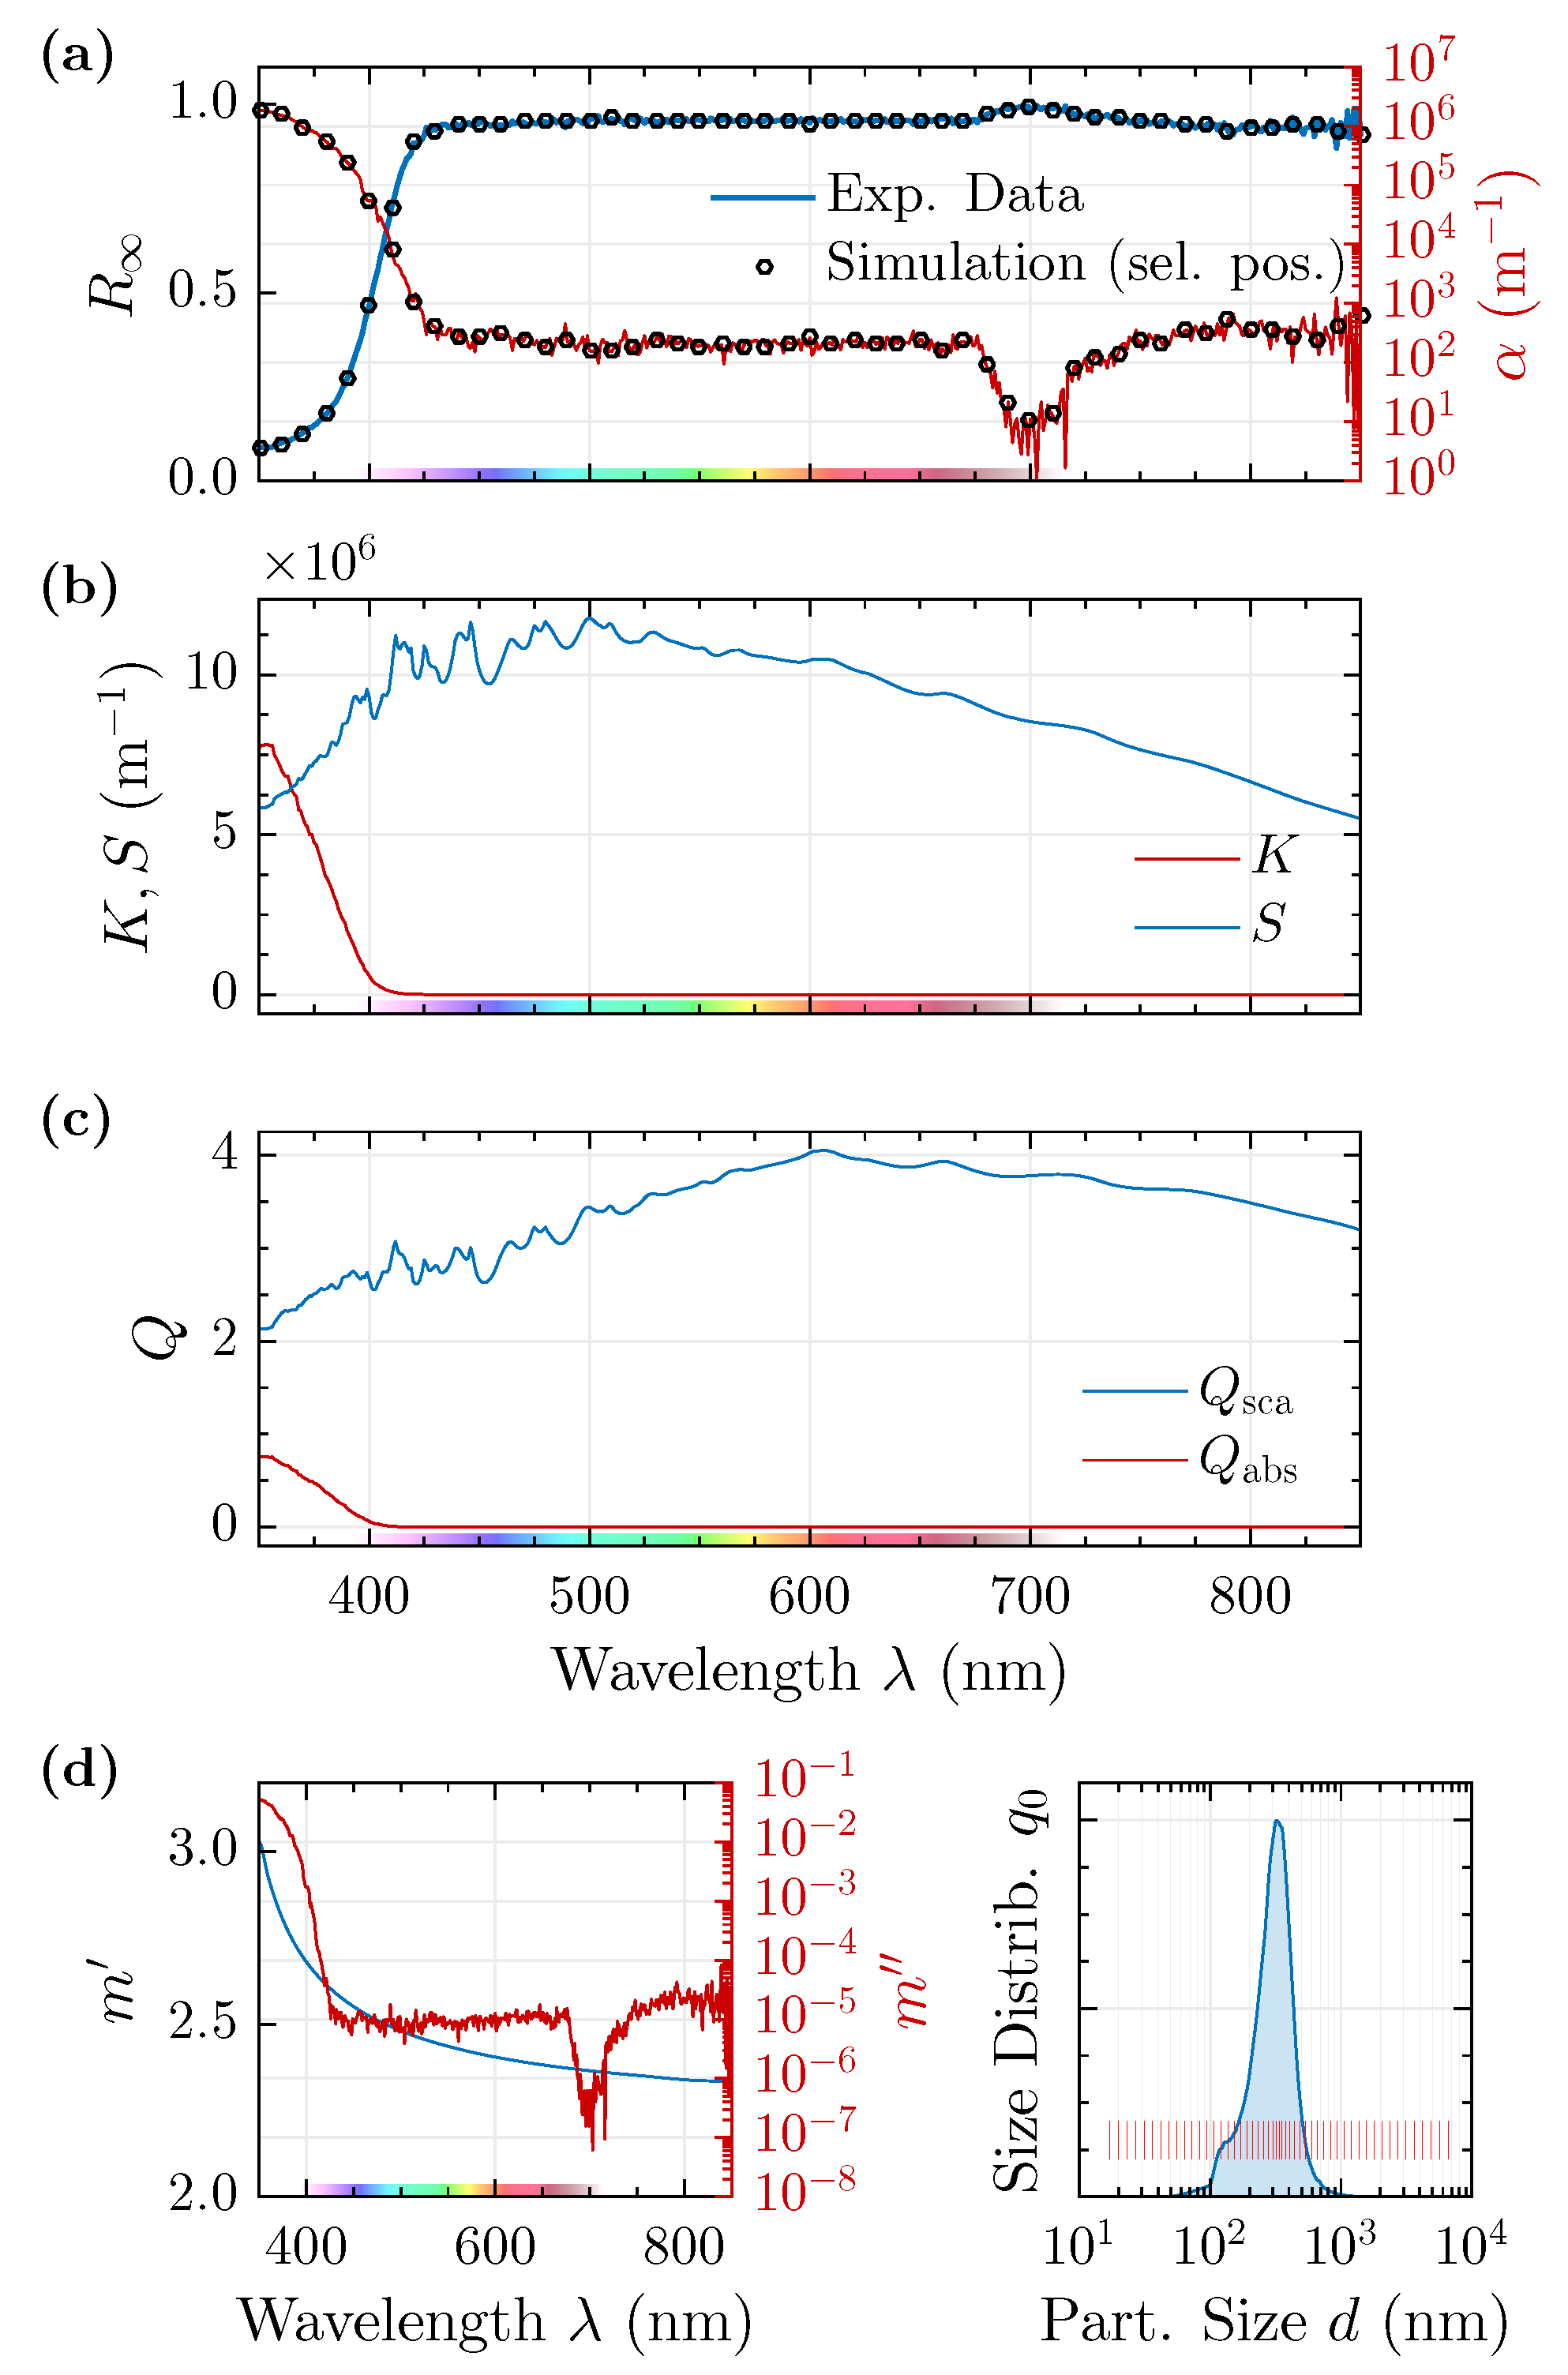
4.2. Monte Carlo Simulation

An alternative to the previously discussed ab initio approach is to use statistical methods [165]. Ray tracers (e.g., LightTools [166,167]) allow accurate simulation of light–matter interaction at surfaces. Provided the number of rays is sufficiently large, statistical processes such as the diffuse reflectance can also be approximated satisfactorily [146,168,169,170,171,172,173,174,175,176,177,178,179,180,181]. For this, a model of the material under investigation is designed; relevant physical parameters that will be used within the simulation are determined beforehand such as the refractive index, e.g., via the Becke line or Schroeder van der Kolk method [182,183,184,185,186], or the particle size distribution q 0 , e.g., via disc centrifugation [159]. Further parameters that enter the simulation result from experimental conditions such as the actual sample thickness or volume filling fraction f V . Lastly, the diffuse reflectance R is measured as it will be used as a reference to calculate the imaginary part of the refractive index m within the simulation. In other words, m (and thereby, the absorption coefficient α as well, according to Equation (11)) is altered until the simulated diffuse reflectance value coincides with the experimentally determined one. Repeating this procedure for different wavelengths λ thus yields the dispersion of the absorption coefficient α ( λ ) . In order to calculate the diffuse reflectance via Monte Carlo simulation, a ray tracer setup as schematically illustrated in Figure 17 is used.
Upon irradiation, individual light beams may interact with particles such that they are either attenuated (or, ultimately, absorbed), scattered according to Mie theory, or remitted. For single light beams, this can be understood as follows: When a light ray impinges upon the sample, it is scattered by a single particle according to Mie theory, i.e., the probability for a light ray to be scattered into a certain direction is defined by the microscopic scattering coefficients. Owing to the statistical nature of this process, there exists a nonzero probability that the ray is scattered backwards, thereby leaving the sample as a remitted beam which is counted by the back half of a hypothetical detector sphere encompassing the entire setup. Alternatively, the ray may be scattered forward where it can interact with another particle. For a non-absorbing sample, the number of scattering events within the pellet is theoretically unlimited. In this case, propagation is only terminated when the light ray leaves the sample. As a result, the calculated diffuse reflectance as the number of backscattered rays scaled by the incoming ones approaches unity for thick samples. In case of thin layers, a significant number of beams traverses the sample and are subsequently collected by the front half sphere which counts towards transmission signals. Taking absorption into account provides a specific termination condition: At each scattering event, the incident light ray is slightly attenuated owing to the lossy medium, thereby gradually decreasing the ray’s intensity until a lower threshold is attained that halts further propagation due to negligible intensities [187]. In close relation to the Beer-Lambert law, the attenuation rate scales with the product of absorption coefficient and path traversed through individual particles. Hence, both parameters α and q 0 can affect the calculated diffuse reflectance equally; on a per-particle basis, an increase of α can be compensated by a decreased particle size and vice versa. In order to avoid this ambiguity, q 0 is affixed which is reasonable after its experimental determination. Once again, due to the statistical nature of the interaction mechanism, a significant number of light rays is required for accurate predictions. With parameters resembling those of the experiment, that is a 4.5 m m thick TiO 2 -rutile sample with a volume filling fraction f V 55 % , a particle density of 4.23 m g mm 3 and a particle size distribution as shown in Figure 15, no transmittance through the sample is observed for 25 million nearly collinear rays (beam divergence 1 ° ). The surrounding material has been assumed as air with a density of 0.119 m g mm 3 and a refractive index n air = 1.0003 0 i . This underlines the validity of the K-M relation for pressed powders: a thickness of a few millimeters is sufficient for canceling transmission. Consequently, this geometry is therefore sufficient for the determination of R . In fact, light rays may be scattered several hundred to thousands times inside the sample relatively close to the surface before either exiting through the entrance plane or being absorbed at a particle (cf. the inset of Figure 17).
The interplay between scattering and absorption is decisive in the development of the overall diffuse reflectance: A higher scattering coefficient increases the number of scattering events and, thus, the total absorption probability (that is a product between absorption probability at a single particle times the number of events), as does a growing absorption coefficient. As a result, these two quantities appear coupled when performing diffuse reflectance measurements.
Taking scattering and absorption coefficients into account allows to calculate the diffuse reflectance as a function of wavelength. For rutile-phase TiO 2 , the simulated diffuse reflectance spectrum shows significant resemblance to data coming from both literature [188,189] and present measurements as it is shown in Figure 18.
Throughout the visible range above 450 n m , the absorption remains nearly fully wavelength- independent and only appears to grow in the infrared spectral region. However, this is likely subject to measurement artifacts as no significant absorption between 730 n m and 4000 n m has been reported [161]. For wavelengths below 430 n m , the diffuse reflectance declines significantly which can be attributed to a growing contribution from absorption induced by the material’s band edge. Compared to literature data measured on thin films [161], the calculated absorption coefficient α is in remarkable agreement, especially for wavelengths below 390 n m .
The striking similarity of α reveals agreement between thin film and diffuse reflectance measurements in this specific case. Therefore, DRS paired with Monte Carlo simulations opens up the possibility to quantitatively determine the absorption coefficient. This result has a tremendous impact on material science: A number of materials do not exist as bulk media or with adequate quality for alternative optical characterization methods such that DRS hereby provides ready and exclusive access.
Both simulations, ab initio and Monte Carlo, yield similar absorption spectra based on identical diffuse reflectance data, particle size distributions and real refractive index. However, ab initio calculations tend to overestimate α by an order of magnitude due to the exclusion of multiple scattering events. As a quick remedy, the theoretically calculated diffuse reflectance has been exponentiated by a value s such that the absorption coefficient yields comparable results to the Monte Carlo simulation, i.e., instead of comparing R sim with R exp , the final step matches ( R sim ) s to experimental data. This can be understood by the total diffuse reflectance being composed of directly backscattered radiation and the forward scattered fraction that is then backscattered by additional particles (naturally, their scattering wave can be re-scattered by further particles, etc., yielding a plethora of higher-order terms) [164]. It should be highlighted that s has no physical relevance except for empirically correcting ab initio values to those from literature and Monte Carlo simulation to account for multiple scattering. The best agreement between both simulations has been achieved for a wavelength-independent correction exponent s = 2.5 , thus establishing a coarse prediction of R while including dependent scattering.
The latter is naturally accounted for in the Monte Carlo simulation which paints a more accurate picture of α at the cost of severely increased processing times and demands. In this regard, each method offers distinct advantages: Whereas ab initio methods can be used for attaining a quick overview of the optical properties of the investigated material, a more thorough and quantitative analysis can be performed via Monte Carlo simulation.
While additional rays increase the accuracy of the Monte Carlo simulation, the overall result is not significantly affected. Diffuse reflectances generated from 25 million and 1 billion rays are largely identical and differ by less than 0.1%. Hence, a large number of data points may be generated with a relatively low number of rays while maintaining an accurate estimate, thereby greatly speeding up the process of predicting absorptions from a given diffuse reflectance spectrum or, vice versa, calculate the diffuse reflectance properties from a material with known bulk parameters.

5. Summary

Our review-like article addresses the optical characterization of pure, dielectric (nano-)powders with the aim to provide an end-to-end instruction from preparing reproducible samples with Lambertian scattering behavior using the presented, innovative approach up to the determination of absorption spectra. As a result, a procedure based on diffuse reflectance spectroscopy is developed that allows for (i) performing reproducible and artifact-free, high-quality measurements as well as (ii) a thorough optical analysis using Monte Carlo and Mie scattering simulations yielding the absorption coefficient in the visible spectral range.
We like to note that diffuse reflectance spectra typically do not allow immediate access to further physical quantities as it is, for instance, known from transmission studies; however, through adequate mathematical transformations, locations of the band gap or even absolute values for absorption coefficients may be gathered from suitable simulations. Furthermore, the diffuse reflectance is a remarkably sensitive quantity for (semi-)opaque samples that can rarely be classified by other means and thus provides a complementary technique for material characterization.
Based on a bottom-up approach, analytical and statistical methods have been applied to predict and reproduce experimentally determined diffuse reflectance spectra that open up a deep insight into individual material properties. As a synergistic ensemble, simulations and experiment offer an in-detail analysis of investigated substances. However, even a less sophisticated approach based on the conversion from Mie theory to Kubelka–Munk equations provides rapid insight in the diffuse reflectance and thereby absorption features of an unknown substance. Indeed, we have shown the determination of the difficult-to-obtain absorption coefficient in the case of micro- or nano-scaled particles by adapting the simulation to the experiment.
As a result, the methodology described herein has tremendous potential in the optical characterization of materials that cannot be suitably investigated otherwise. Furthermore, due to the pronounced differences in light scattering compared to macroscopic objects, diffuse reflectance spectroscopy provides a deeper insight into the optical properties of small-scaled powders. Especially in the context of potential applications, a direct means to assess the properties during production of such materials poses a substantial benefit in terms of speed, cost and effort.

6. Conclusions

To sum up, the precise and detailed inspection of diffuse reflectance spectroscopy allows for obtaining an end-to-end procedure from sample preparation up to the determination of the absorption features. As a prerequisite, it is necessary to consider all facets, including the selection of materials for powder presses, the choice of a white standard, the precise adjustment of optical paths, the type of data acquisition procedure, the choice of theory for analysis and the application of modern modeling tools. Furthermore, the complexity of the experimental setup itself is kept to a minimum using a fluorescence spectrometer without integrating spheres and the simple case of non-translucent, thick powder samples is assumed. Thereby, it is possible to omit host materials and the investigation of the material of interest itself is streamlined drastically, yielding a feasible alternative to established experimental techniques. At the same time, our findings demonstrate that diffuse reflectance is particularly sensitive to even small changes of the material composition, thus being capable of identifying even marginal impurity traces. In addition, the experimental geometry can affect the diffuse reflectance significantly, thereby producing a large number of sources for artifacts. However, based on the presented methodology, such artifacts can be greatly minimized, resulting in both a considerable sensitivity and yielding reproducible, reliable data.

Author Contributions

Based on D.B.’s initial idea, all authors contributed to the conceptualization and methodology as well as the preparation of the original draft and review and editing of the paper. M.I. and D.B. revised the final draft, acquired funding and were responsible for project administration and supervision. S.B. and D.B. provided resources. S.B. and C.K. performed investigations, formal analysis and validation of results, implemented and/or developed software, curated and visualized data.

Funding

The authors are indebted to the financial support of Deutsche Forschungsgemeinschaft (DFG INST 443/12-1 LAGG, INST 190/165 FUGG, and IM37/11) and the Open Access Publishing Fund of Osnabrueck University. Furthermore, funding by the Federal Ministry of Education and Research (BMBF) and the German Academic Exchange Service (DAAD, project number 57390412) is gratefully acknowledged as well.

Acknowledgments

The authors sincerely thank Baikowski S.A.S., Sumitomo Chemical Co. and Imerys Fused Minerals Laufenburg GmbH for provision of the samples as well as Edinburgh Instruments Ltd. for their permission to use the spectral output and sensitivity data in Figure 10. We would further like to thank Jordan Klitzke for the introduction to the simulation software LightTools.

Conflicts of Interest

The authors declare no conflict of interest. The funders had no role in the design of the study; in the collection, analyses, or interpretation of data; in the writing of the manuscript, or in the decision to publish the results.

References

  1. Kortüm, G. Reflectance Spectroscopy: Principles, Methods, Applications; Kortüm, G., Ed.; Springer: Heidelberg/Berlin, Germany, 1969. [Google Scholar]
  2. Frei, R.W.; Frodyma, M.M.; Lieu, V.T. Diffuse reflectance spectroscopy. In Instrumentation for Spectroscopy. Analytical Atomic Absorption and Fluorescence Spectroscopy. Diffuse Reflectance Spectroscopy; Svehla, G., Ed.; Wilson & Wilson’s Comprehensive Analytical Chemistry; Elsevier Scientific Publishing Company: Amsterdam, The Netherlands, 1975; Volume 4, Chapter 3; pp. 263–345. [Google Scholar]
  3. Höpe, A. Diffuse Reflectance and Transmittance. In Spectrophotometry: Accurate Measurement of Optical Properties of Materials; Germer, T.A., Zwinkels, J.C., Tsai, B.K., Eds.; Experimental Methods in the Physical Sciences; Academic Press Elsevier Inc.: Amsterdam, The Netherlands, 2014; Volume 46, Chapter 6; pp. 179–219. [Google Scholar]
  4. Lambert, J.H. Lambert’s Photometrie. Photometria Sive De Mensura Et Gradibus Luminis, Colorum et Umbrae (1760); Anding, E., Ed.; Ostwald’s Klassiker der exakten Wissenschaften; Verlag von Wilhelm Engelmann: Leipzig, Germany, 1892; Volume 31. [Google Scholar]
  5. Bouguer, P. Traité D’optique sur la Gradation de la Lumiere; I’Abbé de la Caille, M., Ed.; De l’Imprimerie de H.L. Guerin & L.F. Delatour: Paris, France, 1760. [Google Scholar]
  6. Ångström, K. Ueber die Diffusion der strahlenden Wärme von ebenen Flächen. Ann. Phys. 1885, 262, 253–287. [Google Scholar] [CrossRef]
  7. Messerschmitt, J.B. Ueber diffuse Reflexion. Ann. Phys. 1888, 270, 867–896. [Google Scholar] [CrossRef]
  8. Seeliger, H. Zur Photometrie zerstreut reflectirender Substanzen. In Sitzungsberichte der Mathematisch-Physikalischen Classe der k. b. Akademie der Wissenschaften zu München; Franz, G., Ed.; Verlag der K. Akademie: Munich, Germany, 1888; Volume 18, pp. 201–248. [Google Scholar]
  9. Lommel, E. Die Photometrie der diffusen Zurückwerfung. Ann. Phys. 1889, 272, 473–502. [Google Scholar] [CrossRef]
  10. Uljanin, W. Ueber das Lambert’sche Gesetz und die Polarisation der schief emittirten Strahlen. Ann. Phys. 1897, 298, 528–542. [Google Scholar] [CrossRef]
  11. Wright, H. Die diffuse Reflexion des Lichtes an matten Oberflächen. Ann. Phys. 1900, 306, 17–41. [Google Scholar] [CrossRef]
  12. Pokrowski, G.I. Zur Theorie der diffusen Lichtreflexion. Z. Phys. 1924, 30, 66–72. [Google Scholar] [CrossRef]
  13. Schulz, H. Untersuchungen über die Reflexion an teilweise lichtzerstreuenden Flächen. Z. Phys. 1925, 31, 496–506. [Google Scholar] [CrossRef]
  14. Harrison, V.G.W. The light-diffusing properties of magnesium oxide. Proc. Phys. Soc. 1946, 58, 408–419. [Google Scholar] [CrossRef]
  15. Torrent, J.; Barrón, V. Diffuse Reflectance Spectroscopy. In Methods of Soil Analysis Part 5–Mineralogical Methods; Number 5 in the Soil Science Society of America Book Series; Ulery, A.L., Drees, L.R., Eds.; Soil Science Society of America Inc.: Madison, WI, USA, 2008; Volume 5, Chapter 13; pp. 367–385. [Google Scholar]
  16. Blake, T.A.; Johnson, T.J.; Tonkyn, R.G.; Forland, B.M.; Myers, T.L.; Brauer, C.S.; Su, Y.F.; Bernacki, B.E.; Hanssen, L.; Gonzalez, G. Methods for quantitative infrared directional-hemispherical and diffuse reflectance measurements using an FTIR and a commercial integrating sphere. Appl. Opt. 2018, 57, 432–446. [Google Scholar] [CrossRef]
  17. Clarke, F.J.J.; Compton, J.A. Correction Methods for Integrating-Sphere Measurement of Hemispherical Reflectance. Color Res. Appl. 1986, 11, 253–262. [Google Scholar] [CrossRef]
  18. Kortüm, G.; Braun, W.; Herzog, G. Prinzip und Meßmethodik der diffusen Reflexionsspektroskopie. Angew. Chem. 1963, 75, 653–661. [Google Scholar] [CrossRef]
  19. Hanssen, L. Integrating-sphere system and method for absolute measurement of transmittance, reflectance, and absorptance of specular samples. Appl. Opt. 2001, 40, 3196–3204. [Google Scholar] [CrossRef] [PubMed]
  20. Abrams Engineering Services GmbH & Co. KG. Abrams Premium Steel. Available online: http://www.steel-guide.eu/alternatives/440B (accessed on 18 June 2019).
  21. Boroumand, F.; Moser, J.E.; van den Bergh, H. Quantitative Diffuse Reflectance and Transmittance Infrared Spectroscopy of Nondiluted Powders. Appl. Spectrosc. 1992, 46, 1874–1886. [Google Scholar] [CrossRef]
  22. Romaco Group. Romaco Kilian—Leading International Supplier of Tablet Press Machines. Available online: https://www.romaco.com/en/exploiting-technologies/kilian (accessed on 18 June 2019).
  23. Coperion GmbH. Tablet Coating and Press Lubrication. 2019. Available online: https://www.coperion.com/en/industries/pharmaceutical/tablet-coating-and-press-lubrication (accessed on 18 June 2019).
  24. Verdict Media Limited. Medelpharm Tablet Press Manufacture for Compaction Simulation and Powder Analysis. 2019. Available online: https://www.pharmaceutical-technology.com/contractors/contract/medelpharm-pharma (accessed on 18 June 2019).
  25. Nyström, C.; Karehill, P.G. The Importance of Intermolecular Bonding Forces and the Concept of Bonding Surface Area. In Pharmaceutical Powder Compaction Technology; Alderborn, G., Nyström, C., Eds.; Drugs and the Pharmaceutical Sciences; Marcel Dekker Inc.: New York, NY, USA, 1996; Volume 71, pp. 17–53. [Google Scholar]
  26. LFA Machines Oxford LTD. VICE Hand Held Press. 2018. Available online: https://www.lfatabletpresses.com/vice-hand-held-tablet-press (accessed on 18 June 2019).
  27. LFA Machines Oxford LTD. TDP 0 Desktop Tablet Press. 2018. Available online: https://www.lfatabletpresses.com/desktop-tablet-press-tdp-0 (accessed on 18 June 2019).
  28. Fritsch GmbH. Operating Manuals for Older Models of the Pellet Press; Operating Manual Pellet Press: Idar-Oberstein, Germany, 2019; Available online: https://www.fritsch-international.com/services/downloads-videos/pellet-press/ (accessed on 18 June 2019).
  29. Retsch GmbH. Pellet Press PP 25. 2019. Available online: https://www.retsch.com/products/assisting/pellet-presses/pp-25/function-features (accessed on 18 June 2019).
  30. Specac Limited. Pellet Press Dies | FTIR + XRF Dies. 2019. Available online: https://www.specac.com/en/products/ftir-xrf-sample-preparation-equipment/pellet-dies/evacuable-standard/pellet-press-dies-ftir-xrf-dies (accessed on 18 June 2019).
  31. Kaplan Scientific. Mini-Pellet Press. Available online: https://kaplanscientific.nl/product/mini-pellet-press/ (accessed on 18 June 2019).
  32. Weidner, V.R. Gray scale of diffuse reflectance for the 250–2500-nm wavelength range. Appl. Opt. 1986, 25, 1265–1266. [Google Scholar] [CrossRef]
  33. Fuller, M.P.; Griffiths, P.R. Diffuse Reflectance Measurements by Infrared Fourier Transform Spectrometry. Anal. Chem. 1978, 50, 1906–1910. [Google Scholar] [CrossRef]
  34. Fuller, M.P.; Hamadeh, I.M.; Griffiths, P.R.; Lowenhaupt, D.E. Diffuse reflectance infrared spectroscopy of powdered coals. Fuel 1982, 61, 529–536. [Google Scholar] [CrossRef]
  35. Christy, A.A.; Tvedt, J.E.; Karstang, T.V.; Velapoldi, R.A. Low-pressure, automated, sample packing unit for diffuse reflectance infrared spectrometry. Rev. Sci. Instrum. 1988, 59, 423–426. [Google Scholar] [CrossRef]
  36. Chan, H.K.; Ongpipattanakul, B.; Au-Yeung, J. Aggregation of rhDNase Occurred During the Compression of KBr Pellets Used for FTIR Spectroscopy. Pharm. Res. 1996, 13, 238–242. [Google Scholar] [CrossRef]
  37. Banas, A.; Banas, K.; Bahou, M.; Moser, H.O.; Wen, L.; Yang, P.; Li, Z.J.; Cholewa, M.; Lim, S.K.; Lim, C.H. Post-blast detection of traces of explosives by means of Fourier transform infrared spectroscopy. Vib. Spectrosc. 2009, 51, 168–176. [Google Scholar] [CrossRef]
  38. Rani, S.; Sanghi, S.; Agarwal, A.; Seth, V.P. Study of optical band gap and FTIR spectroscopy of Li2O·Bi2O3·P2O5 glasses. Spectrochim. Acta A 2009, 74, 673–677. [Google Scholar] [CrossRef]
  39. Stelte, W.; Clemons, C.; Holm, J.K.; Ahrenfeldt, J.; Henriksen, U.B.; Sanadi, A.R. Fuel Pellets from Wheat Straw: The Effect of Lignin Glass Transition and Surface Waxes on Pelletizing Properties. Bioenergy Res. 2012, 5, 450–458. [Google Scholar] [CrossRef]
  40. Xu, L.; Cai, C.B.; Cui, H.F.; Ye, Z.H.; Yu, X.P. Rapid discrimination of pork in Halal and non-Halal Chinese ham sausages by Fourier transform infrared (FTIR) spectroscopy and chemometrics. Meat Sci. 2012, 92, 506–510. [Google Scholar] [CrossRef] [PubMed]
  41. Kijatkin, C.; Eggert, J.; Bock, S.; Berben, D.; Oláh, L.; Szaller, Z.; Kis, Z.; Imlau, M. Nonlinear Diffuse fs-Pulse Reflectometry of Harmonic Upconversion Nanoparticles. Photonics 2017, 4, 11. [Google Scholar] [CrossRef]
  42. Edinburgh Instruments Ltd. FLS1000 Photoluminescence Spectrometer. Available online: https://www.edinst.com/products/fls1000-photoluminescence-spectrometer (accessed on 18 June 2019).
  43. Shimadzu Corporation. RF-6000 Spectrofluorophotometer. 2019. Available online: https://www.shimadzu.com/an/molecular_spectro/fluoresence/rf6000/index.html (accessed on 18 June 2019).
  44. ISS Inc. K2 Multifrequency Cross-Correlation Phase and Modulation Fluorometer. 2019. Available online: http://www.iss.com/fluorescence/instruments/k2.html (accessed on 18 June 2019).
  45. Horiba Scientific Ltd. Fluorolog Steady State and Lifetime Modular Spectrofluorometer. Available online: https://www.horiba.com/en_en/products/detail/action/show/Product/fluorolog-1586/ (accessed on 18 June 2019).
  46. Horiba Scientific Ltd. FluoroMax Steady State and Lifetime Bench-top Spectrofluorometer. Available online: https://www.horiba.com/en_en/products/detail/action/show/Product/fluorescence-steady-state-and-lifetime-benchtop-spectrofluorometer-fluoromax-1576/ (accessed on 19 June 2019).
  47. Hitachi High-Technologies Corporation. Fluorescence Spectrophotometer F-7000. 2001, 2019. Available online: https://www.hitachi-hightech.com/global/product_detail/?pn=ana-f7000 (accessed on 19 June 2019).
  48. Lastek Pty. Ltd. Zolix OmniFluo Fluorescence Spectrometer. Available online: https://www.lastek.com.au/2182-zolix-omnifluo-fluorescence-spectrometer (accessed on 19 June 2019).
  49. PicoQuant GmbH. FluoTime 300 High Performance Fluorescence Lifetime and Steady State Spectrometer. Available online: https://www.picoquant.com/products/category/fluorescence-spectrometers/fluotime-300-high-performance-fluorescence-lifetime-spectrometer (accessed on 19 June 2019).
  50. JASCO Deutschland GmbH. FP-8000 Series. Available online: https://www.jasco.de/Spectroscopy/Fluoreszenz/FP-8000Serie (accessed on 19 June 2019).
  51. PerkinElmer Inc. FL 8500 Fluorescence Spectrophotometer with Spectrum FL Software. 1998–2019. Available online: https://www.perkinelmer.de/product/fl-8500-with-spectrum-fl-software-n4200030 (accessed on 19 June 2019).
  52. Agilent Technologies Inc. Fluorescence Systems Cary Eclipse Fluorescence Spectrophotometer. 2019. Available online: https://www.agilent.com/en/products/fluorescence/fluorescence-systems/cary-eclipse-fluorescence-spectrophotometer (accessed on 19 June 2019).
  53. PerkinElmer Inc. LAMBDA 950 UV/Vis Spectrophotometer. 1998–2019. Available online: https://www.perkinelmer.de/product/lambda-950-uv-vis-nir-spectrophotometer-l950 (accessed on 19 June 2019).
  54. Shimadzu Corporation. UV-3600 Plus UV-VIS-NIR Spectrophotometer. 2019. Available online: https://www.shimadzu.com/an/molecular_spectro/uv/uv-3600plus.html (accessed on 19 June 2019).
  55. Hitachi High-Technologies Corporation. Double Beam Spectrophotometer UH5300. 2001, 2019. Available online: https://www.hitachi-hightech.com/global/product_detail/?pn=ana-uh5300 (accessed on 19 June 2019).
  56. Agilent Technologies Inc. UV-Vis & UV-Vis-NIR Systems Cary 5000 UV-Vis-NIR. 2019. Available online: https://www.agilent.com/en/products/uv-vis-uv-vis-nir/uv-vis-uv-vis-nir-systems/cary-5000-uv-vis-nir (accessed on 19 June 2019).
  57. Seo, J.A.; Jeon, S.K.; Lee, J.Y. Acridine derived stable host material for long lifetime blue phosphorescent organic light-emitting diodes. Org. Electron. 2016, 34, 33–37. [Google Scholar] [CrossRef]
  58. Song, T.; Zhang, M.; Liu, Y.; Yang, J.; Gong, Z.; Yan, H.; Zhu, H.; Yan, D.; Liu, C.; Xu, C. Enhanced near infrared persistent luminescence of Zn2Ga2.98Ge0.75O8:Cr0.023+ nanoparticles by partial substitution of Ge4+ by Sn4+. RSC Adv. 2018, 8, 10954–10963. [Google Scholar] [CrossRef]
  59. Haase, M.; Schäfer, H. Upconverting Nanoparticles. Angew. Chem. Int. Ed. 2011, 50, 5808–5829. [Google Scholar] [CrossRef]
  60. Chen, G.; Qiu, H.; Prasad, P.N.; Chen, X. Upconversion Nanoparticles: Design, Nanochemistry, and Applications in Theranostics. Chem. Rev. 2014, 114, 5161–5214. [Google Scholar] [CrossRef]
  61. Jacquez, J.A.; McKeehan, W.; Huss, J.; Dimitroff, J.M.; Kuppenheim, H.F. An Integrating Sphere for Measuring Diffuse Reflectance in the Near Infrared. J. Opt. Soc. Am. 1955, 45, 781–785. [Google Scholar] [CrossRef]
  62. Goebel, D.G.; Caldwell, B.P.; Hammond, H.K. Use of an Auxiliary Sphere with a Spectroreflectometer to Obtain Absolute Reflectance. J. Opt. Soc. Am. 1966, 56, 783–788. [Google Scholar] [CrossRef]
  63. Adams, J.B. Interpretation of Visible and Near-Infrared Diffuse Reflectance Spectra of Pyroxenes and other Rock-Forming Minerals. In Infrared and Raman Spectroscopy of Lunar and Terrestrial Minerals; Karr, C., Ed.; Academic Press Inc.: London, UK, 1975; Chapter 4; pp. 91–115. [Google Scholar]
  64. Hobbs, P.C.D. (Ed.) Coatings, Filters, and Surface Finishes. In Building Electro-Optical Systems: Making It All Work; John Wiley & Sons, Inc.: Hoboken, NJ, USA, 2009; Chapter 5; pp. 180–207. [Google Scholar]
  65. Sklensky, A.F.; Anderson, J.H.; Wickersheim, K.A. Method for Obtaining Improved Diffuse Reflectance Spectra in the Near Infrared. Appl. Spectrosc. 1967, 21, 339–342. [Google Scholar] [CrossRef]
  66. Lindberg, J.D.; Snyder, D.G. Diffuse Reflectance Spectra of Several Clay Minerals. Am. Mineral. 1972, 57, 485–493. [Google Scholar]
  67. Weidner, V.R.; Hsia, J.J. Reflection properties of pressed polytetrafluoroethylene powder. J. Opt. Soc. Am. 1981, 71, 856–861. [Google Scholar] [CrossRef]
  68. Konrad, A.; Fries, T.; Gahn, A.; Kummer, F.; Herr, U.; Tidecks, R.; Samwer, K. Nanocrystalline Cubic Yttria: Synthesis and Optical Properties. Chem. Vap. Depos. 1999, 5, 207–210. [Google Scholar] [CrossRef]
  69. Herr, U.; Kaps, H.; Konrad, A. Physics of Nanocrystalline Luminescent Ceramics. In Interfacial Effects and Novel Properties of Nanomaterials; Lojkowski, W., Blizzard, J.R., Eds.; Solid State Phenomena; Trans Tech Publications: Stafa-Zurich, Switzerland, 2003; Volume 94, pp. 85–94. [Google Scholar]
  70. Kuo, T.W.; Liu, W.R.; Chen, T.M. High color rendering white light-emitting-diode illuminator using the red-emitting Eu2+-activated CaZnOS phosphors excited by blue LED. Opt. Express 2010, 18, 8187–8192. [Google Scholar] [CrossRef]
  71. Schimpke, T.; Mandl, M.; Stoll, I.; Pohl-Klein, B.; Bichler, D.; Zwaschka, F.; Strube-Knyrim, J.; Huckenbeck, B.; Max, B.; Müller, M.; et al. Phosphor-converted white light from blue-emitting InGaN microrod LEDs. Phys. Status Solidi A 2016, 213, 1577–1584. [Google Scholar] [CrossRef]
  72. Springsteen, A. Standards for the measurement of diffuse reflectance—An overview of available materials and measurement laboratories. Anal. Chim. Acta 1999, 380, 379–390. [Google Scholar] [CrossRef]
  73. Cáceres, D.; Colera, I.; Vergara, I.; González, R.; Román, E. Characterization of MgO thin films grown by rf-sputtering. Vacuum 2002, 67, 577–581. [Google Scholar] [CrossRef]
  74. Abazović, N.D.; Čomor, M.I.; Dramićanin, M.D.; Jovanović, D.J.; Ahrenkiel, S.P.; Nedeljković, J.M. Photoluminescence of Anatase and Rutile TiO2 Particles. J. Phys. Chem. B 2006, 110, 25366–25370. [Google Scholar] [CrossRef]
  75. Bergin, S. Pathlength Calibration of Integrating Sphere Based Gas Cells. Ph.D. Thesis, Cranfield University, Cranfield, UK, 2016. [Google Scholar]
  76. Image Engineering. RESTAN (Reflection Standard). Data Sheet. Available online: https://www.image-engineering.de/content/products/equipment/accessories/restan/Downloads/RESTAN_datasheet.pdf (accessed on 19 June 2019).
  77. Reade International Corp. Mohs’ Hardness (Typical) of Abrasives. 2018. Available online: https://www.reade.com/reade-resources/reference-educational/reade-reference-chart-particle-property- briefings/32-mohs-hardness-of-abrasives (accessed on 22 June 2019).
  78. Krishnan, R.; Dash, S.; Babu Rao, C.; Subba Rao, R.; Tyagi, A.K.; Raj, B. Laser induced structural and microstructural transformations of plasma sprayed Al2O3 coatings. Scr. Mater. 2001, 45, 693–700. [Google Scholar] [CrossRef]
  79. Miguel, A. Effect of air humidity on the evolution of permeability and performance of a fibrous filter during loading with hygroscopic and non-hygroscopic particles. J. Aerosol Sci. 2003, 34, 783–799. [Google Scholar] [CrossRef]
  80. Baikowski, S.A.S. Baikalox Regular Product Code CR30F. Data Sheet. Available online: www.baikowski.com/files/pdf/baikowski_cr30f.pdf (accessed on 22 June 2019).
  81. Sumitomo Chemical. Product Data: Aluminium Hydroxide, Aluminium Oxide (Alumina), High Purity Alumina (HPA), Activated Alumina / Hydralic Alumina. Data sheet. 2014. Available online: http://www.jinsan-corp.co.kr/upload/bbs/Sumitomo%20Chemical%20Alumina%20(ENG).pdf (accessed on 22 June 2019).
  82. Imerys Fused Minerals. SAND CASTING. 2014. Available online: http://www.imerys-fusedminerals.com/appl-fa-san.html (accessed on 22 June 2019).
  83. Image Engineering. Restan Plate White Reference Standard for Calibrating and Measuring. 2019. Available online: https://www.image-engineering.de/products/accessories/all/139-3rd-party-accessory/612-restan-plate?highlight=WyJyZXN0YW4iXQ== (accessed on 19 June 2019).
  84. Eggert, J. Berührungslose optische Sensorik an technischen Oberflächen: Neue Konzepte und die Rolle ultrakurzer Laserpulse. Ph.D. Thesis, Universität Osnabrück, Osnabrück, Germany, 2018. [Google Scholar]
  85. Valeeva, A.A.; Kozlova, E.A.; Vokhmintsev, A.S.; Kamalov, R.V.; Dorosheva, I.B.; Saraev, A.A.; Weinstein, I.A.; Rempel, A.A. Nonstoichiometric titanium dioxide nanotubes with enhanced catalytical activity under visible light. Sci. Rep. 2018, 8, 9607. [Google Scholar] [CrossRef] [PubMed]
  86. Kuznetsov, V.N.; Glazkova, N.I.; Mikhaylov, R.V.; Serpone, N. In situ study of photo- and thermo-induced color centers in photochromic rutile TiO2 in the temperature range 90–270 K. Photochem. Photobiol. Sci. 2016, 15, 1289–1298. [Google Scholar] [CrossRef] [PubMed]
  87. Pal, M.; Pal, U.; Jiménez, J.M.G.Y.; Pérez-Rodríguez, F. Effects of crystallization and dopant concentration on the emission behavior of TiO2:Eu nanophosphors. Nanoscale Res. Lett. 2012, 7, 1. [Google Scholar] [CrossRef] [PubMed] [Green Version]
  88. Suzuki, Y.; Sakuma, T.; Hirai, M. UV Emission from the Second Lowest 5d State in Ce3+: YAG. In Defects in Insulating Materials; Materials Science Forum; Matthews, G.E., Williams, R.T., Eds.; Trans Tech Publications: Stafa-Zurich, Switzerland, 1997; Volume 239–241, pp. 219–222. [Google Scholar]
  89. Gong, M.; Xiang, W.; Huang, J.; Yin, C.; Liang, X. Facile synthesis and optical properties of Ce:YAG polycrystalline ceramics with different SiO2 content. RSC Adv. 2015, 5, 75781–75786. [Google Scholar] [CrossRef]
  90. Imerys Fused Minerals Laufenburg GmbH, Treibacher Alodur. Technisches Datenblatt WFA/WSK/ZWSK/ZWSK AT Mikrokorn, Data sheet: TDB- LA 063 Rev. 2.
  91. Dieter Schmid Werkzeuge GmbH. Conversion Chart Abrasives—Grit Sizes. Available online: https://www.fine-tools.com/G10019.html (accessed on 22 June 2019).
  92. Trinkler, L.; Berzina, B.; Jakimovica, D.; Grabis, J.; Steins, I. UV-light induced luminescence processes in Al2O3 bulk and nanosize powders. Opt. Mater. 2010, 32, 789–795. [Google Scholar] [CrossRef]
  93. Trinkler, L.; Berzina, B.; Jakimovica, D.; Grabis, J.; Steins, I. Pecularities of photoluminescence of Al2O3 bulk and nanoszize powders at low temperatures. Opt. Mater. 2011, 33, 817–822. [Google Scholar] [CrossRef]
  94. Edinburgh Instruments Ltd. Spectrometer Components. In FLS980 User Guide; Issue No. 2 for Systems Delivered after October 2013; Edinburgh Instruments Ltd.: Livingston, UK, 2013; Chapter 2; pp. 13–30. [Google Scholar]
  95. OSRAM GmbH. XBO for Cinema Projection. 2019. Available online: https://www.osram.com/pia/ecat/XBO-XBO-Specialty%20lamps/com/en/GPS01_1028548/PP_EUROPE_Europe_eCat/ZMP_1006152/ (accessed on 23 June 2019).
  96. Hamamatsu Photonics K.K. Photomultiplier tube R928. Available online: http://www.hamamatsu.com/eu/en/product/category/3100/3001/R928/index.html (accessed on 23 June 2019).
  97. Randall, J.T.; Wilkins, M.H.F. Phosphorescence and electron traps I. The study of trap distributions. Proc. R. Soc. Lond. A 1945, 184, 365–389. [Google Scholar]
  98. Randolph, T.T. Phosphorescent Luminous Door Knobs Cover. U.S. Patent 5,008,551, 16 April 1991. [Google Scholar]
  99. Kato, K.; Tsutai, I.; Kamimura, T.; Kaneko, F.; Shinbo, K.; Ohta, M.; Kawakami, T. Thermoluminescence properties of SrAl2O4:Eu sputtered films with long phosphorescence. J. Lumin. 1999, 82, 213–220. [Google Scholar] [CrossRef]
  100. Katsumata, T.; Mochida, S.; Kubo, H.; Usui, Y.; Aizawa, H.; Komuro, S.; Morikawa, T. Fluorescence thermometer based on phase angle measurement. Proc. SPIE 2005, 5855, 727–730. [Google Scholar]
  101. Akmehmet, G.I.; Šturm, S.; Bocher, L.; Kociak, M.; Ambrožič, B.; Ow-Yang, C.W. Structure and Luminescence in Long Persistence Eu, Dy, and B Codoped Strontium Aluminate Phosphors: The Boron Effect. J. Am. Ceram. Soc. 2016, 99, 2175–2180. [Google Scholar] [CrossRef]
  102. Yen, W.M.; Shionoya, S.; Yamamoto, H. Phosphor Handbook, 2nd ed.; Yen, W.M., Shionoya, S., Yamamoto, H., Eds.; CRC Press Taylor & Francis Group: Boca Raton, FL, USA, 2006. [Google Scholar]
  103. López, R.; Gómez, R. Band-gap energy estimation from diffuse reflectance measurements on sol-gel and commercial TiO2: A comparative study. J. Sol-Gel Sci. Technol. 2012, 61, 1–7. [Google Scholar] [CrossRef]
  104. Butler, M.A. Photoelectrolysis and physical properties of the semiconducting electrode WO3. J. Appl. Phys. 1977, 48, 1914–1920. [Google Scholar] [CrossRef]
  105. Wooten, F. Interband Transitions. In Optical Properties of Solids; Wooten, F., Ed.; Academic Press Inc.: London, UK, 1972; Chapter 5; pp. 108–172. [Google Scholar]
  106. Shahane, G.; More, B.; Rotti, C.; Deshmukh, L. Studies on chemically deposited CdS1-xSex mixed thin films. Mater. Chem. Phys. 1997, 47, 263–267. [Google Scholar] [CrossRef]
  107. Li, P.; Ouyang, S.; Xi, G.; Kako, T.; Ye, J. The Effects of Crystal Structure and Electronic Structure on Photocatalytic H2 Evolution and CO2 Reduction over Two Phases of Perovskite-Structured NaNbO3. J. Phys. Chem. C 2012, 116, 7621–7628. [Google Scholar] [CrossRef] [Green Version]
  108. Li, P.; Ouyang, S.; Zhang, Y.; Kako, T.; Ye, J. Surface-coordination-induced selective synthesis of cubic and orthorhombic NaNbO3 and their photocatalytic properties. J. Mater. Chem. A 2013, 1, 1185–1191. [Google Scholar] [CrossRef]
  109. Hassanien, A.S.; Akl, A.A. Influence of composition on optical and dispersion parameters of thermally evaporated non-crystalline Cd50S50-xSex thin films. J. Alloys Compd. 2015, 648, 280–290. [Google Scholar] [CrossRef]
  110. Morales, A.E.; Mora, E.S.; Pal, U. Use of diffuse reflectance spectroscopy for optical characterization of un-supported nanostructures. Rev. Mex. Fis. Suppl. 2007, 53, 18–22. [Google Scholar]
  111. Tauc, J.; Grigorovici, R.; Vancu, A. Optical Properties and Electronic Structure of Amorphous Germanium. Phys. Status Solidi B 1966, 15, 627–637. [Google Scholar] [CrossRef]
  112. Tauc, J. Optical properties and electronic structure of amorphous Ge and Si. Mater. Res. Bull. 1968, 3, 37–46. [Google Scholar] [CrossRef]
  113. Wang, Z.; Kijatkin, C.; Urban, A.; Haase, M.; Imlau, M.; Kömpe, K. Nonlinear Optical Potassium Niobate Nanocrystals as Harmonic Markers: The Role of Precursors and Stoichiometry in Hydrothermal Synthesis. Nanoscale 2018, 10, 10713–10720. [Google Scholar] [CrossRef]
  114. Klingshirn, C.F. (Ed.) Forbidden Excitation Transitions. In Semiconductor Optics; Graduate Texts in Physics; Springer: Berlin/Heidelberg, Germany, 2012; Chapter 13.2; pp. 346–354. [Google Scholar]
  115. Glassford, K.M.; Chelikowsky, J.R. Structural and electronic properties of titanium dioxide. Phys. Rev. B 1992, 46, 1284–1298. [Google Scholar] [CrossRef] [PubMed]
  116. Amtout, A.; Leonelli, R. Optical properties of rutile near its fundamental band gap. Phys. Rev. B 1995, 51, 6842–6851. [Google Scholar] [CrossRef] [PubMed]
  117. Scanlon, D.O.; Dunnill, C.W.; Buckeridge, J.; Shevlin, S.A.; Logsdail, A.J.; Woodley, S.M.; Catlow, C.R.A.; Powell, M.J.; Palgrave, R.G.; Parkin, I.P.; et al. Band alignment of rutile and anatase TiO2. Nat. Mater. 2013, 12, 798–801. [Google Scholar] [CrossRef]
  118. Mie, G. Beiträge zur Optik trüber Medien, speziell kollodialer Metallösungen. Ann. Phys. 1908, 330, 377–445. [Google Scholar] [CrossRef]
  119. Bohren, C.F.; Huffman, D.R. (Eds.) Absorption and Scattering of Light by Small Particles; John Wiley & Sons Inc.; Wiley-VCH Verlag GmbH & Co. KGaA: Weinheim, Germany, 1983/2004.
  120. Rayleigh, F.R.S. On the Electromagnetic Theory of Light. Philos. Mag. 1881, 12, 81–101. [Google Scholar] [CrossRef] [Green Version]
  121. Rayleigh, F.R.S. On the Transmission of Light through an Atmosphere containing Small Particles in Suspension, and on the Origin of the Blue of the Sky. Philos. Mag. 1899, 47, 375–384. [Google Scholar] [CrossRef] [Green Version]
  122. Roke, S.; Gonella, G. Nonlinear Light Scattering and Spectroscopy of Particles and Droplets in Liquids. Annu. Rev. Phys. Chem. 2012, 63, 353–378. [Google Scholar] [CrossRef] [Green Version]
  123. Geng, Y.L.; Wu, X.B.; Li, L.W.; Guan, B.R. Mie scattering by a uniaxial anisotropic sphere. Phys. Rev. E 2004, 70, 056609-1–056609-8. [Google Scholar] [CrossRef] [Green Version]
  124. Qiu, C.; Gao, L.; Joannopoulos, J.D.; Soljačić, M. Light scattering from anisotropic particles: Propagation, localization, and nonlinearity. Laser Photon. Rev. 2009, 4, 268–282. [Google Scholar] [CrossRef]
  125. Toon, O.B.; Ackerman, T.P. Algorithms for the calculation of scattering by stratified spheres. Appl. Opt. 1981, 20, 3657–3660. [Google Scholar] [CrossRef]
  126. Mackowski, D.W.; Altenkirch, R.A.; Menguc, M.P. Internal absorption cross sections in a stratified sphere. Appl. Opt. 1990, 29, 1551–1559. [Google Scholar] [CrossRef] [PubMed]
  127. Yang, W. Improved recursive algorithm for light scattering by a multilayered sphere. Appl. Opt. 2003, 42, 1710–1720. [Google Scholar] [CrossRef] [PubMed]
  128. Liu, L.; Wang, H.; Yu, B.; Xu, Y.; Shen, J. Improved algorithm of light scattering by a coated sphere. China Part. 2007, 5, 230–236. [Google Scholar] [CrossRef]
  129. Waterman, P. Matrix Formulation of Electromagnetic Scattering. Proc. IEEE 1965, 53, 805–812. [Google Scholar] [CrossRef]
  130. Mishchenko, M.I.; Travis, L.D.; Mackowski, D.W. T-matrix computations of light scattering by nonspherical particles: A review. J. Quant. Spectrosc. Radiat. Transf. 1996, 55, 535–575. [Google Scholar] [CrossRef]
  131. Mishchenko, M.I.; Hovenier, J.W.; Travis, L.D. (Eds.) Light Scattering by Nonspherical Particles: Theory, Measurements, and Applications; Academic Press: San Diego, CA, USA, 2000. [Google Scholar]
  132. Xu, Y.L.; Gustafson, B.Å.S. A generalized multiparticle Mie-solution: Further experimental verification. J. Quant. Spectrosc. Radiat. Transf. 2001, 70, 395–419. [Google Scholar] [CrossRef]
  133. Pellegrini, G.; Mattei, G.; Bello, V.; Mazzoldi, P. Interacting metal nanoparticles: Optical properties from nanoparticle dimers to core-satellite systems. Mater. Sci. Eng. C 2007, 27, 1347–1350. [Google Scholar] [CrossRef]
  134. Mackowski, D.W.; Mishchenko, M.I. Direct simulation of multiple scattering by discrete random media illuminated by Gaussian beams. Phys. Rev. A 2011, 83, 013804-1–013804-9. [Google Scholar] [CrossRef] [Green Version]
  135. Egel, A.; Pattelli, L.; Mazzamuto, G.; Wiersma, D.S.; Lemmer, U. CELES: CUDA-accelerated simulation of electromagnetic scattering by large ensembles of spheres. J. Quant. Spectrosc. Radiat. Transf. 2017, 199, 103–110. [Google Scholar] [CrossRef] [Green Version]
  136. Drolen, B.L.; Tien, C.L. Independent and dependent scattering in packed-sphere systems. J. Thermophys. Heat Transf. 1987, 1, 63–68. [Google Scholar] [CrossRef]
  137. Hottel, H.C.; Sarofim, A.F.; Dalzell, W.H.; Vasalos, I.A. Optical Properties of Coatings. Effect of Pigment Concentration. AIAA J. 1971, 9, 1895–1898. [Google Scholar] [CrossRef]
  138. Wang, B.X.; Zhao, C.Y. Effect of dependent scattering on light absorption in highly scattering random media. Int. J. Heat Mass Transf. 2018, 125, 1069–1078. [Google Scholar] [CrossRef] [Green Version]
  139. Simon, J.C. Dependent scattering and radiative transfer in dense inhomogeneous media. Phys. A 1997, 241, 77–81. [Google Scholar] [CrossRef]
  140. Yamada, Y.; Cartigny, J.D.; Tien, C.L. Radiative Transfer With Dependent Scattering by Particles: Part 2—Experimental Investigation. J. Heat Transf. 1986, 108, 614–618. [Google Scholar] [CrossRef]
  141. Vargas, W.E. Diffuse radiation intensity propagating through a particulate slab. J. Opt. Soc. Am. A 1999, 16, 1362–1372. [Google Scholar] [CrossRef]
  142. Kubelka, P.; Munk, F. Ein Beitrag zur Optik der Farbanstriche. Z. Tech. Phys. 1931, 12, 593–601. [Google Scholar]
  143. Gunde, M.K.; Logar, J.K.; Orel, Z.C.; Orel, B. Application of the Kubelka–Munk Theory to Thickness-Dependent Diffuse Reflectance of Black Paints in the Mid-IR. Appl. Spectrosc. 1995, 49, 623–629. [Google Scholar] [CrossRef]
  144. Vargas, W.E.; Niklasson, G.A. Applicability conditions of the Kubelka–Munk theory. Appl. Opt. 1997, 36, 5580–5586. [Google Scholar] [CrossRef]
  145. Murphy, A.B. Band-gap determination from diffuse reflectance measurements of semiconductor films, and application to photoelectrochemical water-splitting. Sol. Energy Mater. Sol. Cells 2007, 91, 1326–1337. [Google Scholar] [CrossRef]
  146. Shi, Z.; Anderson, C.A. Application of Monte Carlo Simulation-Based Photon Migration for Enhanced Understanding of Near-Infrared (NIR) Diffuse Reflectance. Part I: Depth of Penetration in Pharmaceutical Materials. J. Pharm. Sci. 2010, 99, 2399–2412. [Google Scholar] [CrossRef]
  147. Yang, L.; Kruse, B. Revised Kubelka-Munk theory. I. Theory and application. J. Opt. Soc. Am. A 2004, 21, 1933–1941. [Google Scholar] [CrossRef] [PubMed]
  148. International Organization for Standardization. Representation of Results of Particle Size Analysis—Part 2: Calculation of Average Particle Size/Diameters and Moments from Particle Size Distributions; ISO 9276-2; International Standard: Geneva, Switzerland, 2014. [Google Scholar]
  149. Maheu, B.; Letoulouzan, J.N.; Gouesbet, G. Four-flux models to solve the scattering transfer equation in terms of Lorenz-Mie parameters. Appl. Opt. 1984, 23, 3353–3362. [Google Scholar] [CrossRef] [PubMed]
  150. Vargas, W.E.; Niklasson, G.A. Forward average path-length parameter in four-flux radiative transfer models. Appl. Opt. 1997, 36, 3735–3738. [Google Scholar] [CrossRef] [PubMed]
  151. Vargas, W.E.; Niklasson, G.A. Intensity of diffuse radiation in particulate media. J. Opt. Soc. Am. A 1997, 14, 2253–2262. [Google Scholar] [CrossRef]
  152. Liu, L.; Gong, R.; Huang, D.; Nie, Y.; Liu, C. Calculation of emittance of a coating layer with the Kubelka-Munk theory and the Mie-scattering model. J. Opt. Soc. Am. A 2005, 22, 2424–2429. [Google Scholar] [CrossRef]
  153. Kerker, M. The Scattering of Light and Other Electromagnetic Radiation; Physical Chemistry; Loebl, E.M., Ed.; Academic Press Inc.: New York, NY, USA, 1969; Volume 16. [Google Scholar]
  154. Schäfer, J.P. Implementierung und Anwendung analytischer und numerischer Verfahren zur Lösung der Maxwellgleichungen für die Untersuchung der Lichtausbreitung in biologischem Gewebe. Ph.D. Thesis, Universität Ulm, Ulm, Germany, 2011. [Google Scholar]
  155. Hoo, C.M.; Starostin, N.; West, P.; Mecartney, M.L. A comparison of atomic force microscopy (AFM) and dynamic light scattering (DLS) methods to characterize nanoparticle size distributions. J. Nanopart. Res. 2008, 10, 89–96. [Google Scholar] [CrossRef]
  156. Stöber, W.; Fink, A. Controlled Growth of Monodisperse Silica Spheres in the Micron Size Range. J. Colloid Interface Sci. 1968, 26, 62–69. [Google Scholar] [CrossRef]
  157. Hunt, J.R. Prediction of Oceanic Particle Size Distributions from Coagulation and Sedimentation Mechanisms. In Particulates in Water; Kavanaugh, M.C., Leckie, J.O., Eds.; Advances in Chemistry; American Chemical Society: Washington, DC, USA, 1980; Volume 189, Chapter 11; pp. 243–257. [Google Scholar]
  158. Lawler, D.F. Particle size distributions in treatment processes: Theory and practice. Water. Sci. Technol. 1997, 36, 15–23. [Google Scholar] [CrossRef]
  159. CPS Instruments Europe. Disc Centrifuge. 2001–2013. Available online: http://www.cpsinstruments.eu/centrifuge.html (accessed on 25 June 2019).
  160. Brookhaven Instruments Corporation. BI-XDC Particle Size Analyzer X-ray Disc Centrifuge. 2019. Available online: https://brookhaveninstruments.com/bi-xdc (accessed on 25 June 2019).
  161. Siefke, T.; Kroker, S.; Pfeiffer, K.; Puffky, O.; Dietrich, K.; Franta, D.; Ohlídal, I.; Szeghalmi, A.; Kley, E.B.; Tünnermann, A. Materials Pushing the Application Limits of Wire Grid Polarizers further into the Deep Ultraviolet Spectral Range. Adv. Opt. Mater. 2016, 4, 1780–1786. [Google Scholar] [CrossRef]
  162. Srikant, V.; Clarke, D.R. On the optical band gap of zinc oxide. J. Appl. Phys. 1998, 83, 5447–5451. [Google Scholar] [CrossRef]
  163. Liu, Z.; Liu, S.; Wang, K.; Luo, X. Measurement and numerical studies of optical properties of YAG:Ce phosphor for white light-emitting diode packaging. Appl. Opt. 2010, 49, 247–257. [Google Scholar] [CrossRef] [PubMed]
  164. Kijatkin, C. Ultrafast Photon Management: The Power of Harmonic Nanocrystalys in Nonlinear Spectroscopy and Beyond. Ph.D. Thesis, Universität Osnabrück, Osnabrück, Germany, 2019. [Google Scholar]
  165. Marbach, R.; Heise, H.M. Optical diffuse reflectance accessory for measurements of skin tissue by near-Infrared spectroscopy. Appl. Opt. 1995, 34, 610–621. [Google Scholar] [CrossRef] [PubMed]
  166. Synopsys Inc. LightTools Illumination Design Software. 2019. Available online: https://www.synopsys.com/optical-solutions/lighttools.html (accessed on 25 June 2019).
  167. Wu, H.; Jenkins, D.R. Phosphor modeling and characterization. Opt. Eng. 2014, 53, 114107-1–114107-5. [Google Scholar] [CrossRef] [Green Version]
  168. Flock, S.T.; Wilson, B.C.; Patterson, M.S. Monte Carlo Modeling of Light Propagation in Highly Scattering Tissues–II: Comparison with Measurements in Phantoms. IEEE Trans. Biomed. Eng. 1989, 36, 1169–1173. [Google Scholar] [CrossRef]
  169. Peters, V.G.; Wyman, D.R.; Patterson, M.S.; Frank, G.L. Optical properties of normal and diseased human breast tissues in the visible and near infrared. Phys. Med. Biol. 1990, 35, 1317–1334. [Google Scholar] [CrossRef] [PubMed]
  170. Hanrahan, P.; Krueger, W. Reflection from Layered Surfaces due to Subsurface Scattering. In Proceedings of the 20th Annual Conference on Computer Graphics and Interactive Techniques, SIGGRAPH ’93, Anaheim, CA, USA, 2–6 August 1993; ACM: New York, NY, USA, 1993; pp. 165–174. [Google Scholar]
  171. Hammer, M.; Roggan, A.; Schweitzer, D.; Müller, G. Optical properties of ocular fundus tissues—An in vitro study using the double-integrating-sphere technique and inverse Monte Carlo simulation. Phys. Med. Biol. 1995, 40, 963–978. [Google Scholar] [CrossRef] [Green Version]
  172. Wang, L.; Jacques, S.L.; Zheng, L. MCML – Monte Carlo modeling of light transport in multi-layered tissues. Comput. Methods Prog. Biomed. 1995, 47, 131–146. [Google Scholar] [CrossRef]
  173. Yaroslavsky, A.N.; Yaroslavsky, I.V.; Goldbach, T.; Schwarzmaier, H.J. Influence of the scattering phase function approximation on the optical properties of blood determined from the integrating sphere measurements. J. Biomed. Opt. 1999, 4, 47–53. [Google Scholar] [CrossRef]
  174. Karppinen, M.; Kataja, K.; Mäkinen, J.T.; Juuso, S.; Rajaniemi, H.J.; Pääkkönen, P.; Turunen, J.; Rantala, J.T.; Karioja, P. Wireless infrared data links: Ray-trace simulations of diffuse channels and demonstration of diffractive element for multibeam transmitters. Opt. Eng. 2002, 41, 899–910. [Google Scholar] [CrossRef]
  175. Ma, X.; Lu, J.Q.; Brock, R.S.; Jacobs, K.M.; Yang, P.; Hu, X.H. Determination of complex refractive index of polystyrene microspheres from 370 to 1610 nm. Phys. Med. Biol. 2003, 48, 4165–4172. [Google Scholar] [CrossRef]
  176. Péry, E.; Blondel, W.C.P.M.; Thomas, C.; Guillemin, F. Monte Carlo modeling of multilayer phantoms with multiple fluorophores: Simulation algorithm and experimental validation. J. Biomed. Opt. 2009, 14, 024048-1–024048-11. [Google Scholar]
  177. Rievers, B.; Lämmerzahl, C.; Dittus, H. Modeling of Thermal Perturbations Using Raytracing Method with Preliminary Results for a Test Case Model of the Pioneer 10/11 Radioisotopic Thermal Generators. Space Sci. Rev. 2010, 151, 123–133. [Google Scholar] [CrossRef]
  178. Bish, S.F.; Sharma, M.; Wang, Y.; Triesault, N.J.; Reichenberg, J.S.; Zhang, J.X.; Tunnell, J.W. Handheld Diffuse Reflectance Spectral Imaging (DRSi) for in-vivo characterization of skin. Biomed. Opt. Express 2014, 5, 573–586. [Google Scholar] [CrossRef] [PubMed] [Green Version]
  179. Solodovnyk, A.; Riedel, D.; Lipovšek, B.; Osvet, A.; Gast, J.; Stern, E.; Forberich, K.; Batentschuk, M.; Krč, J.; Topič, M.; et al. Determination of the complex refractive index of powder phosphors. Opt. Mater. Express 2017, 7, 2943–2954. [Google Scholar] [CrossRef] [Green Version]
  180. Xie, B.; Cheng, Y.; Hao, J.; Shu, W.; Wang, K.; Luo, X. Precise optical modeling of quantum dots for white light-emitting diodes. Sci. Rep. 2017, 7, 1–10. [Google Scholar] [CrossRef] [Green Version]
  181. Meretska, M.L.; Uppu, R.; Vissenberg, G.; Lagendijk, A.; Ijzerman, W.L.; Vos, W.L. Analytical modeling of light transport in scattering materials with strong absorption. Opt. Express 2017, 25, A906–A921. [Google Scholar] [CrossRef] [Green Version]
  182. Nesse, W.D. (Ed.) Refractometry. In Introduction to Optical Mineralogy, 2nd ed.; Oxford University Press, Inc.: New York, NY, USA, 1991; Chapter 3; pp. 25–33. [Google Scholar]
  183. Cargille-Sacher Laboratories Inc. About Reference Standards. 2003–2018. Available online: https://cargille.com/about-reference-standards/ (accessed on 25 June 2019).
  184. Van Hilten, D. Refractive indices of minerals through the microscope: A simpler method by oblique observation. Am. Mineral. 1981, 66, 1089–1091. [Google Scholar]
  185. Schmidt, W.; Baier, E. (Eds.) C: Bestimmung der Brechzahl. In Lehrbuch der Mineralogie; Lehrbücher und Monographien aus dem Gebiet der exakten Wissenschaften—Minealogisch-geotechnische Reihe; Springer: Basel, Switzerland, 1955; Volume 6, Chapter 3; pp. 90–93. [Google Scholar]
  186. Klockmann, F. (Ed.) Capitel III: § 4. Methoden zur Bestimmung der Brechungsindices. In Lehrbuch der Mineralogie; Reprint of the Original from 1903; TP Verone Publishing House Ltd.: Nikosia, Cyprus, 2017; pp. 152–161. [Google Scholar]
  187. Synopsys Inc. Illumination in LightTools; Introduction to LightTools Training. 2012. Available online: https://nanoptics.files.wordpress.com/2012/08/illumination-in-lighttools.pdf (accessed on 23 July 2019).
  188. Luo, J.L.; Wang, S.F.; Liu, W.; Tian, C.X.; Wu, J.W.; Zu, X.T.; Zhou, W.L.; Yuan, X.D.; Xiang, X. Influence of different aluminum salts on the photocatalytic properties of Al doped TiO2 nanoparticles towards the degradation of AO7 dye. Sci. Rep. 2017, 7, 1–16. [Google Scholar] [CrossRef] [Green Version]
  189. Zhao, Z.; Kou, T.; Zhang, L.; Zhai, S.; Wang, W.; Wang, Y. Dealloying induced N-doping in spindle-like porous rutile TiO2 for enhanced visible light photocatalytic activity. Corros. Sci. 2018, 137, 204–211. [Google Scholar] [CrossRef]
Figure 1. (a) Cross section through the assembled powder press. 1: bottom plate, 2: ceramic slice, 3: bouncing plate, 4: sample ring, 5: cover plate, 6: tappet, 7: funnel, 8: cylinder, 9: screw. (b) Photograph of the powder press components. 1: bottom plate, 2: ceramic slice, 3: bouncing plate, 4: sample ring (left: 10 m m hole diameter, right: 20 m m hole diameter), 5: cover plate (left: 10 m m diameter, right: 20 m m diameter), 6: tappet (left: 10 m m diameter, right: 20 m m diameter), 7: funnel (left: 10 m m hole diameter, right: 20 m m hole diameter), 8: cylinder, 9: screws, 10: recoil-free hammer, 11: spatula, 12: powder sample.
Applsci 09 04933 g001
Figure 2. Photograph of the sample preparation components to compress powders into a pellet. 1: recoil-free hammer, 2: piece of paper, 3: powder sample, 4: spatula, 5: tappet, 6: sample holder, 7: razor blade, 8: glass/microscope slide.
Applsci 09 04933 g002
Figure 3. Sketch of a fluorescence spectrometer for diffuse reflectance measurements. BP: band-pass filter, LP: long-pass filter, ND: neutral density filter.
Applsci 09 04933 g003
Figure 4. Metallic sample holder ring (A) containing the powder that is placed onto a base plate (B). A mirror (C) reflecting the excitation beam downwards and the emission beam sideways is located above the sample.
Applsci 09 04933 g004
Figure 5. Detected luminance for two different sample positions. Black: ideal position, red: shifted.
Applsci 09 04933 g005
Figure 6. Comparison of the diffuse reflectance of different aluminum oxide powder pellets with equal thickness and constant excitation intensity. All diffuse reflectance have been scaled by the maximum signal of CR30F.
Applsci 09 04933 g006
Figure 7. (a) Diffuse reflectance spectra of contaminated and nominally pure TiO 2 as well as YAG:Ce against the white standard CR30F. The contaminated sample was scanned three times to highlight the reproducibility of the measurement. Note: The spectral bumps around 700 n m arise from an artifact and will be explained in the accompanying text. (b) Absolute deviation of the three contaminated TiO 2 scans from their mean value.
Applsci 09 04933 g007
Figure 8. Diffuse reflectance of a nominally pure TiO 2 against different aluminum oxides: CR30F, F2000 and F1200.
Applsci 09 04933 g008
Figure 9. (a) Evidence of higher order diffraction for a center wavelength of 700 n m , when no additional spectral filters are engaged (red) and removal of undesired wavelengths using a long-pass (LP) filter transmitting wavelengths greater than 680 n m (blue). (b) Diffuse reflectance of a rutile-TiO 2 sample against CR30F without (red) and with (blue) spectral filtering after the excitation monochromator.
Applsci 09 04933 g009
Figure 10. Spectral output of the xenon arc lamp based on [94,95] (left scale, blue dots) and quantum efficiencies of the photomultiplier tube (PMT) from [94,96] (right scale, brown solid line) used in present studies.
Applsci 09 04933 g010
Figure 11. Comparison of the observed TiO 2 diffuse reflectance when the sample is displaced by 0.3 m m upwards (brown) or tilted by 0.6° (orange) compared to the white standard’s position. For comparison, an equal tilt of both sample and white standard by 6° (green) and at reference positions (black) are shown. The effect of both monochromators operating at identical (narrow) bandwidths is displayed in blue.
Applsci 09 04933 g011
Figure 12. Tauc plot of the non-contaminated rutile-TiO 2 (circles, cf. Figure 7a) and corresponding linear fit (solid line) for determination of the band gap E g .
Applsci 09 04933 g012
Figure 13. Normalized perpendicular (left) and parallel (right) polarized components of the scattering intensity of light from a TiO 2 (rutile) single particle with a diameter from 10 n m (blue) to 10 μ m (orange) with respect to a linearly polarized plane wave with a wavelength λ = 500   n m coming from the left (marked by an arrow). Top: linear scale, bottom: logarithmic scale.
Applsci 09 04933 g013
Figure 14. Flow chart illustrating the connections between experiment and theory. Macroscopic views are shaded in blue whereas microscopic ones are red. The process from Mie theory towards calculation of R theo can be summarized by the simulation of light–matter interaction. Further explanations are found in the accompanying text.
Applsci 09 04933 g014
Figure 15. Particle size distribution (blue) and cumulative undersize (red) according to number (solid lines) and volume density (dash-dotted) for a TiO 2 nanopowder.
Applsci 09 04933 g015
Figure 16. Calculation steps as outlined in Figure 14. (a) Measured diffuse reflectance spectrum R ( λ ) (blue) and calculated values (circles) and the derived absorption coefficient α (red line); for better visibility, simulated values are shown only for selected positions; full calculations take the entire experimental dataset into account. The absorption-dip at 700 n m results from experimental artifacts that is discussed in Section 3.2. (b) Kubelka–Munk absorption and scattering coefficient K and S from which R is calculated according to Equation (9). (c) Microscopic scattering and absorption efficiencies Q sca and Q abs calculated from Mie theory [154] used for deriving K and S. (d) Complex-valued refractive index (left); the real part is adapted from ref. [161] whereas the imaginary part is calculated from the experimental diffuse reflectance. The used size distribution q 0 ( d ) with sampled sizes d i is shown to the right.
Applsci 09 04933 g016
Figure 17. Schematic setup for ray tracer simulations. The inset shows a magnified version of the interaction mechanisms inside the sample as calculated within the simulation.
Applsci 09 04933 g017
Figure 18. Monte Carlo ray tracing simulation results (circles) for a rutile powder sample (experimental data: solid blue line) and calculated imaginary refractive indexes m (filled squares, red, solid line) and absorption coefficient α (open squares, red, dashed line).
Applsci 09 04933 g018
Table 1. A non-exhaustive selection of spectrometers capable of performing diffuse reflectance measurements.
Fluorescence SpectrometerRef.
FLS1000, Edinburgh Instruments, Ltd.[42]
RF-6000, Shimadzu Corp.[43]
K2 Fluorometer, ISS, Inc.[44]
Fluorolog, HORIBA Scientific, Ltd.[45]
FluoroMax, HORIBA Scientific, Ltd.[46]
F-7000, Hitachi High-Technologies Corp.[47]
OmniFluo, Zolix Instruments Co., Ltd.[48]
FluoTime 300, PicoQuant GmbH[49]
FP-8000 Series, JASCO Deutschland GmbH[50]
FL 8500, PerkinElmer, Inc.[51]
Cary Eclipse, Agilent Technologies, Inc.[52]
Double-Beam SpectrometerRef.
LAMBDA 950 UV/VIS, PerkinElmer, Inc.[53]
UV-3600 Plus UV-VIS-NIR, Shimadzu Corp.[54]
UH5300, Hitachi High-Technologies Corp.[55]
Cary 5000 UV-Vis-NIR, Agilent Technologies, Inc.[56]
Table 2. Materials commonly applied for white standards (ws) in diffuse reflectance measurements with their respective optical and material properties important for diffuse reflectance spectroscopy (DRS).
ws    Limits
MgO
  • Not particularly stable [72]
  • Hygroscopic [73]
  • Weak UV diffuse reflectance [18,72]
TiO 2
  • Weak UV diffuse reflectance [64]
  • May fluoresce under UV excitation [74]
BaSO 4
  • Reflectance deteriorates over time [15]
  • Fragile material that can be degraded by water and humidity [75] (p. 52)
  • Weak UV diffuse reflectance for λ < 400   n m [18,72]
  • May fluoresce when irradiated around 360 nm [72]
  • Prone to water adsorption and strongly absorbs around 1.4, 1.9 and 2.7 μm [65,72]
Sintered PTFE
  • Not as Lambertian as fine powders [64]
  • Comparably low refractive index requires thicker samples (≥6–8 mm to reach its peak reflectance) [67,76] and may exhibit the translucent blurring effect [72]
  • Can develop static charge, that way attracting dust and dirt [72]
  • Soft material [72]
  • Demanding preparation of sintered PTFE-plate (cutting from bulk material and rasping into particular shape/size)
  • Very expensive [64,75]
α -Al 2 O 3
  • Can have a slight absorption peak at approx. 700   n m depending on powder and/or its production
  • Very high Mohs hardness (≈9 [77]) can cause abrasion of containers during grinding, thus contaminating the white standard
Table 3. Types of electronic dipole transitions and their corresponding exponent n to be used in Equations (4)–(6) [104,105,106,107,108,109].
Transition Typen
direct, allowed 1 / 2
direct, forbidden 3 / 2
indirect, allowed2
indirect, forbidden3

