Article

Temperature Distributions inside Concrete Sections of Renewable Energy Storage Pile Foundations

Department of Civil and Environmental Engineering, Nazarbayev University, Nur-Sultan 010000, Kazakhstan
*
Author to whom correspondence should be addressed.
Appl. Sci. 2019, 9(22), 4776; https://doi.org/10.3390/app9224776
Submission received: 9 September 2019 / Revised: 10 October 2019 / Accepted: 23 October 2019 / Published: 8 November 2019

Abstract

:

Featured Application

This paper presents a study on temperature distributions of a newly proposed energy storage pile foundation system. The temperature distribution obtained in this paper can further be used for thermal mechanical analysis to investigate the structural and geotechnical safety and stability for the foundation system and surrounding soil.

Abstract

A new pile foundation system is being developed for renewable energy storage through a multi-disciplinary research project. This system utilizes the compressed air technology to store renewable energy inside the reinforced concrete pile foundation configured with hollowed sections. The compressed air can result in high air pressure to which the structural response of the pile foundation subjected has been studied. However, the temperature in the pile foundation can be affected by the compressed air if sufficient cooling is not provided. The temperature change can generate thermal stresses and affect the structural safety of the pile foundation. As a first step to investigate this thermal effect, this paper studies temperature distributions inside the concrete section for the pile foundation through non-steady state heat transfer analyses. Several parameters were considered in the study, including thermal conductivities of the concrete, specific heat capacities of the concrete, and dimensions of the pile foundation. It has been found that the temperature distribution along the concrete section varies significantly during a daily energy storage cycle as well as subsequent cycles due to the cumulative effect of residual temperatures at the end of each cycle. The temperature distribution is largely affected by the thermal conductivity of the concrete and the geometry of the pile foundation. The obtained temperature distribution can be used for investigation of the thermal stress inside the foundation and surrounding soil.

1. Introduction

Solar panels or wind-mills attached to buildings have been widely used to generate renewable energy for electric power supplies [1]. However, renewable energy has a nature of intermittency due to climate and day-and-night diurnal cycles and cannot provide uninterrupted energy supplies [2]. One of the solutions is to store extra renewable energy when it is available for later usage by the compressed air energy storage (CAES) technology [3,4]. Utilizing the CAES technology, a new pile foundation system is being developed for renewable energy storage through a multi-disciplinary research project [5,6]. This system uses the CAES technology to store renewable energy inside the reinforced concrete pile foundation configured with hollowed sections, as illustrated in Figure 1.
The compressed air can result in high air pressure at the inner surface of the pile foundation. Extensive analytical and experimental studies have been conducted for the pile foundation subjected to the high air pressure for different pile construction materials, including regular reinforced concrete [7], fiber reinforced concrete [8], high-performance concrete [9,10], steel [11], and steel-concrete composites [12]. In these studies, the compressed air is assumed to go through a complete cooling process, where the temperature of the compressed air will drop back to normal room temperature [7]. However, the complete cooling process is somewhat challenging and requires extra cost. Therefore, the temperature of the compressed air might not drop back to room temperature if sufficient cooling is not provided. In such a case, the temperature in the energy storage pile foundation varies during daily air compressing and releasing cycles, which can generate thermal stresses and affect the structural safety of the pile foundation.
As a first step to investigate the thermal effect, this paper studies temperature distributions inside the concrete section for the pile foundation through non-steady state heat transfer analyses. The temperature change that originated from compressing and releasing air was first calculated following the thermal dynamic processes of the CAES. The heat transfer analysis was then conducted using two-dimensional (2D) plane strain models by applying the temperature change at the inner surface of the pile foundation. Several parameters were considered in the study, including thermal conductivities of the concrete, specific heat capacities of the concrete, and dimensions of the pile foundation. The obtained temperature distribution can be used for investigation of the thermal stress inside the foundation and surrounding soil.
Extensive research work, including experiments and numerical analyses, have been conducted on the temperature distribution and thermal mechanical behavior for thermo-active pile foundations [13,14,15,16,17,18,19]. However, the thermo-active pile foundation, which uses the pile as a heat absorber, is different from the proposed energy storage pile foundation system, where the pile is used as an energy storage medium through compressed air. Although both foundation systems involve the heat transfer phenomena inside the pile, there are significant differences in protocols, magnitudes, and applied locations of the temperature loading. Therefore, the analytical and experimental results from the thermo-active pile foundations cannot be applied for the proposed energy storage pile foundation. It is necessary to conduct the heat transfer analysis specifically for the temperature loading conditions in the energy storage pile foundation.

2. Background

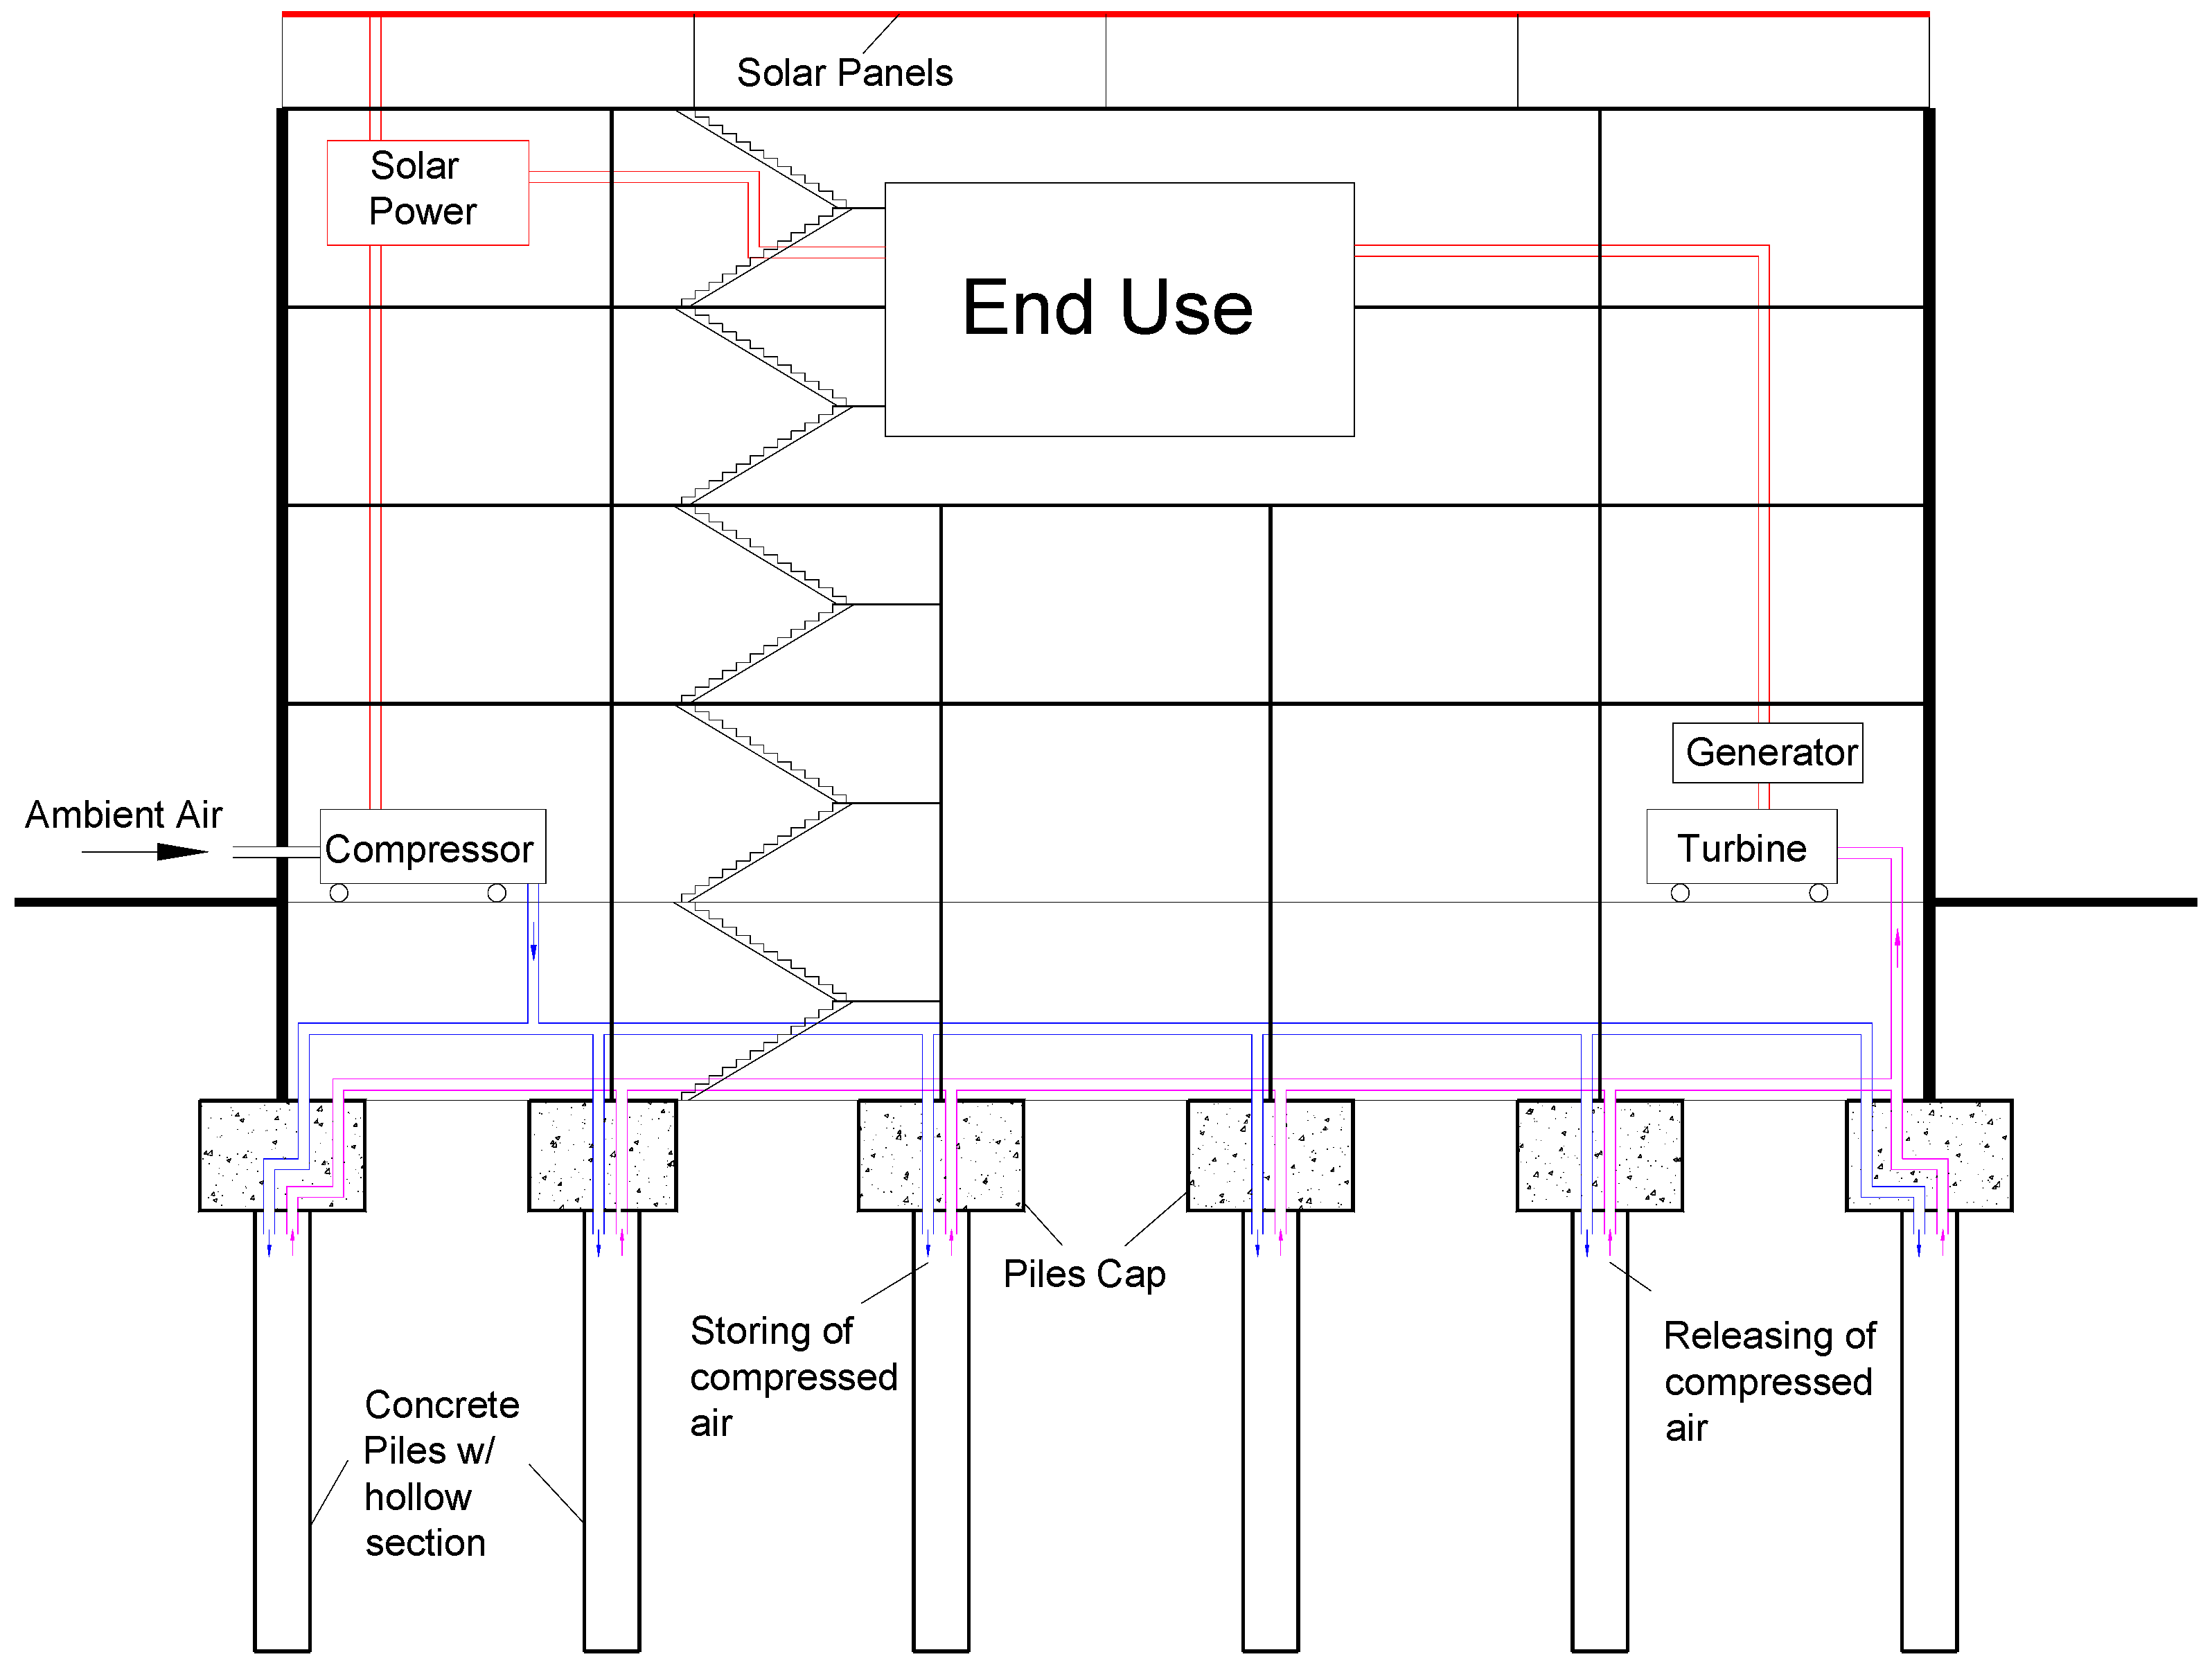
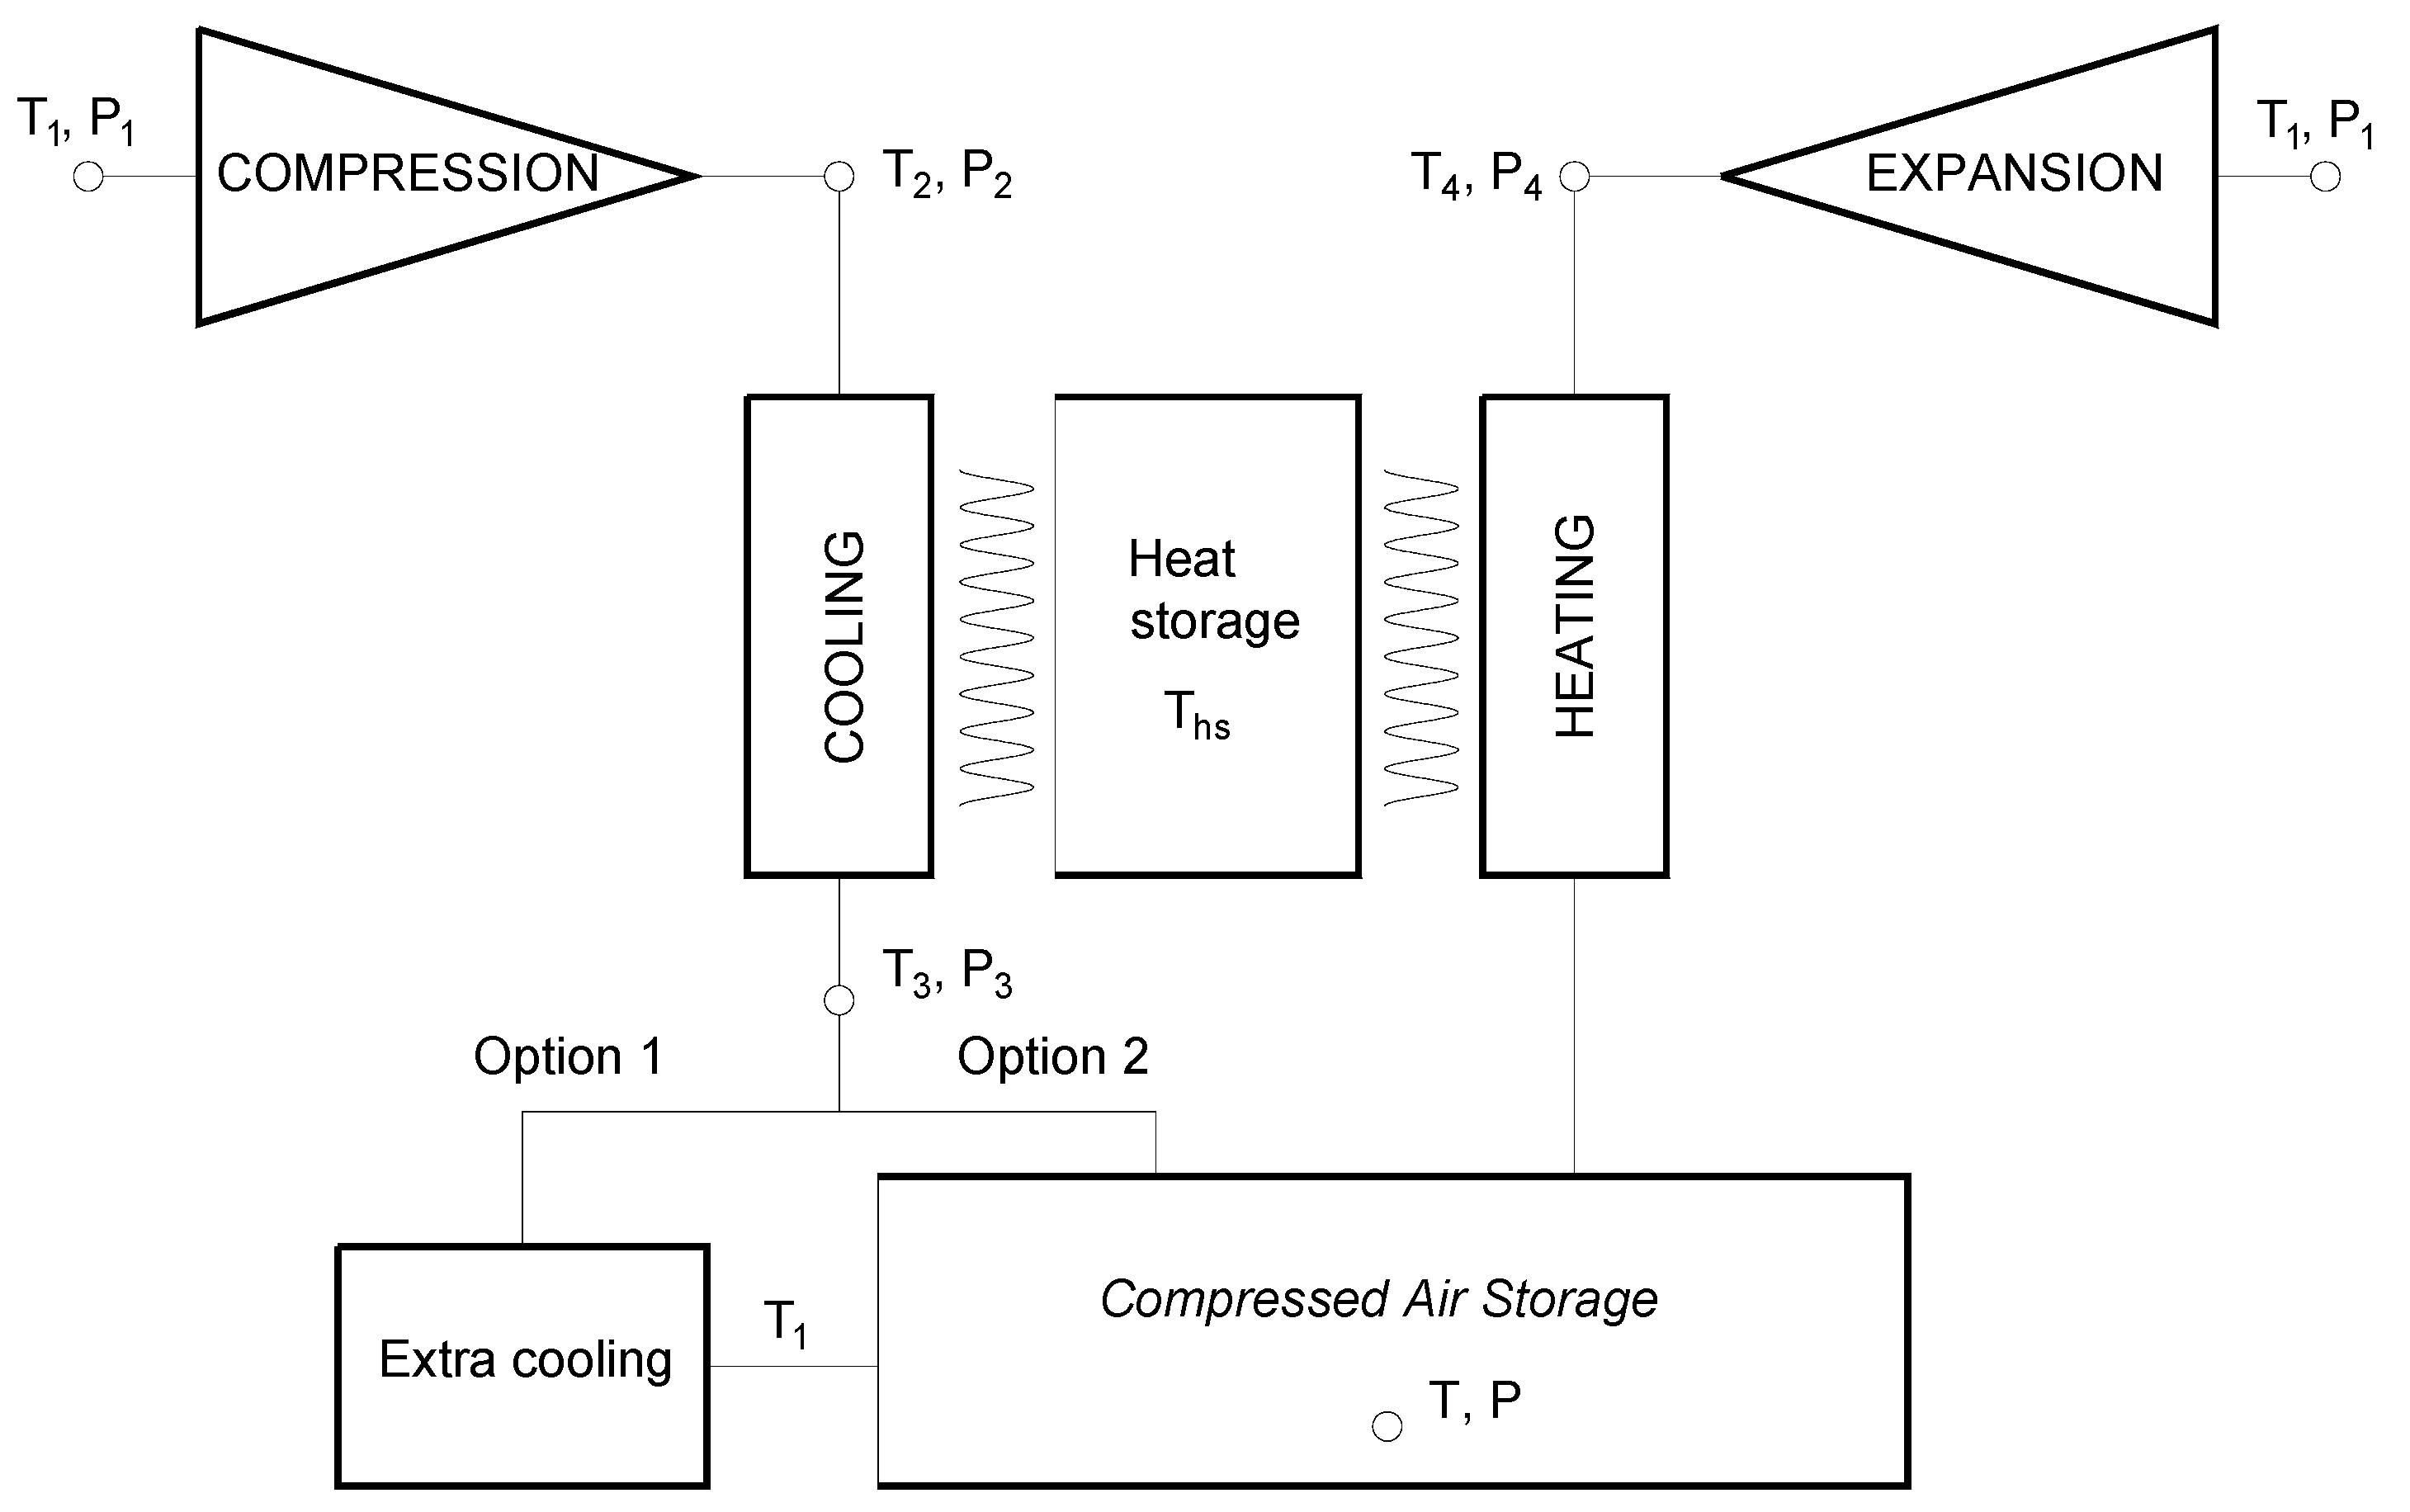
2.1. Thermodynamic Processes of CAES

The compressed air energy storage technology adopts the advanced-adiabatic process [20]. As illustrated in Figure 2, this process has four parts: (1) compression, (2) cooling, (3) heating, (4) expansion. The ambient air first goes through a compression process powered by the renewable energy available for storage. After compression, the pressure and temperature of the air increase significantly. The temperature (T2), especially, can rise to more than 1000 °C, which is not possible for storing inside the concrete pile foundation. The cooling process is performed to extract the heat from the compressed air and store it in a separated heat storage medium, such as oils. However, the temperature (T3) after the cooling cannot wholly drop back to the ambient temperature (T1) due to the efficiency of the cooling process. Therefore, two options are available. The first option (Option 1) is to provide extra cooling to reduce the temperature closer to T1 before entering the pile foundation for storage. The other option (Option 2) is to directly store the air in the pile foundation without further cooling. The latter option is possible because T3 is typically around 150 °C, which has insignificant effects on the mechanical properties of the concrete [21]. When the energy is needed, the stored compressed air is released and goes through heating and expansion processes to produce electric power. The detailed explanation and equations derivation for the advanced-adiabatic process are discussed in Zhang et al. [7]. This paper investigates the temperature changes inside the pile foundation for Option 2.

2.2. Thermal Properties

Thermal properties are important factors for analyzing the heat transfer phenomenon. Two thermal properties, thermal conductivity (k) and specific heat capacity (c), are needed for the non-steady state heat transfer analysis. This section discusses these two thermal properties for concrete and soil based on the existing experimental results from the literature.
Concrete is a composite material with different components, such as cement, aggregates, water, and other additives, which have different chemical and physical properties. The thermal properties of concrete are affected by the thermal and physical properties of its components, as well as density, moisture, and temperature [19,22,23,24]. For ambient moisture conditions and temperatures less than 150 °C, the thermal conductivity ranges from 1.0 to 2.3 W/m·°C for normal strength concrete according to Eurocode-2 [25], Shin et al. [26], and Lie and Kodur [27]; and from 2.0 to 3.2 W/m·°C for high strength concrete according to Zheng [28], Ju et al. [29], and Kodur and Khaliq [30]. On the other hand, the variation for the specific heat capacity is smaller compared to the thermal conductivity. For the normal strength concrete, the specific heat capacity ranges from 830 to 900 J/kg·°C according to Eurocode-2 [25], Shin et al. [26], and Lie and Kodur [27]. For the high strength concrete, the specific heat capacity ranges from 900 to 1000 J/kg·°C according to Zheng [28] and Wan et al. [31]. Since both fiber reinforced concrete with normal strength and high strength concrete are considered as candidate materials for the energy storage pile foundation, this paper investigates a full range of thermal properties for the concrete.
The thermal properties for soil are highly influenced by moisture content, density, porosity, and mineral components [19]. Typical thermal conductivity values of soils lie in a range from 0.5 and 3.2 W/m·°C according to Kersten [32] and ASHRAE [33]. Typical specific heat capacity of soils ranges from 800 to 1600 J/kg·°C for sand and 1200 to 2200 J/kg·°C for clay [34]. Since the primary focus of this paper is not on the soil, typical fine sand with a moisture content of 5% (k = 1.0 W/m·°C and c = 1220 J/kg·°C) is considered. The contact between the concrete and soil is not perfect since the soil is a granular material and the concrete has a rough surface, where thermal resistance can be developed between the gaps. Thomas and Rees [35] recommend a thermal conductance value of 25 W/m2·°C for modeling the interface behavior.

3. Parametric Study

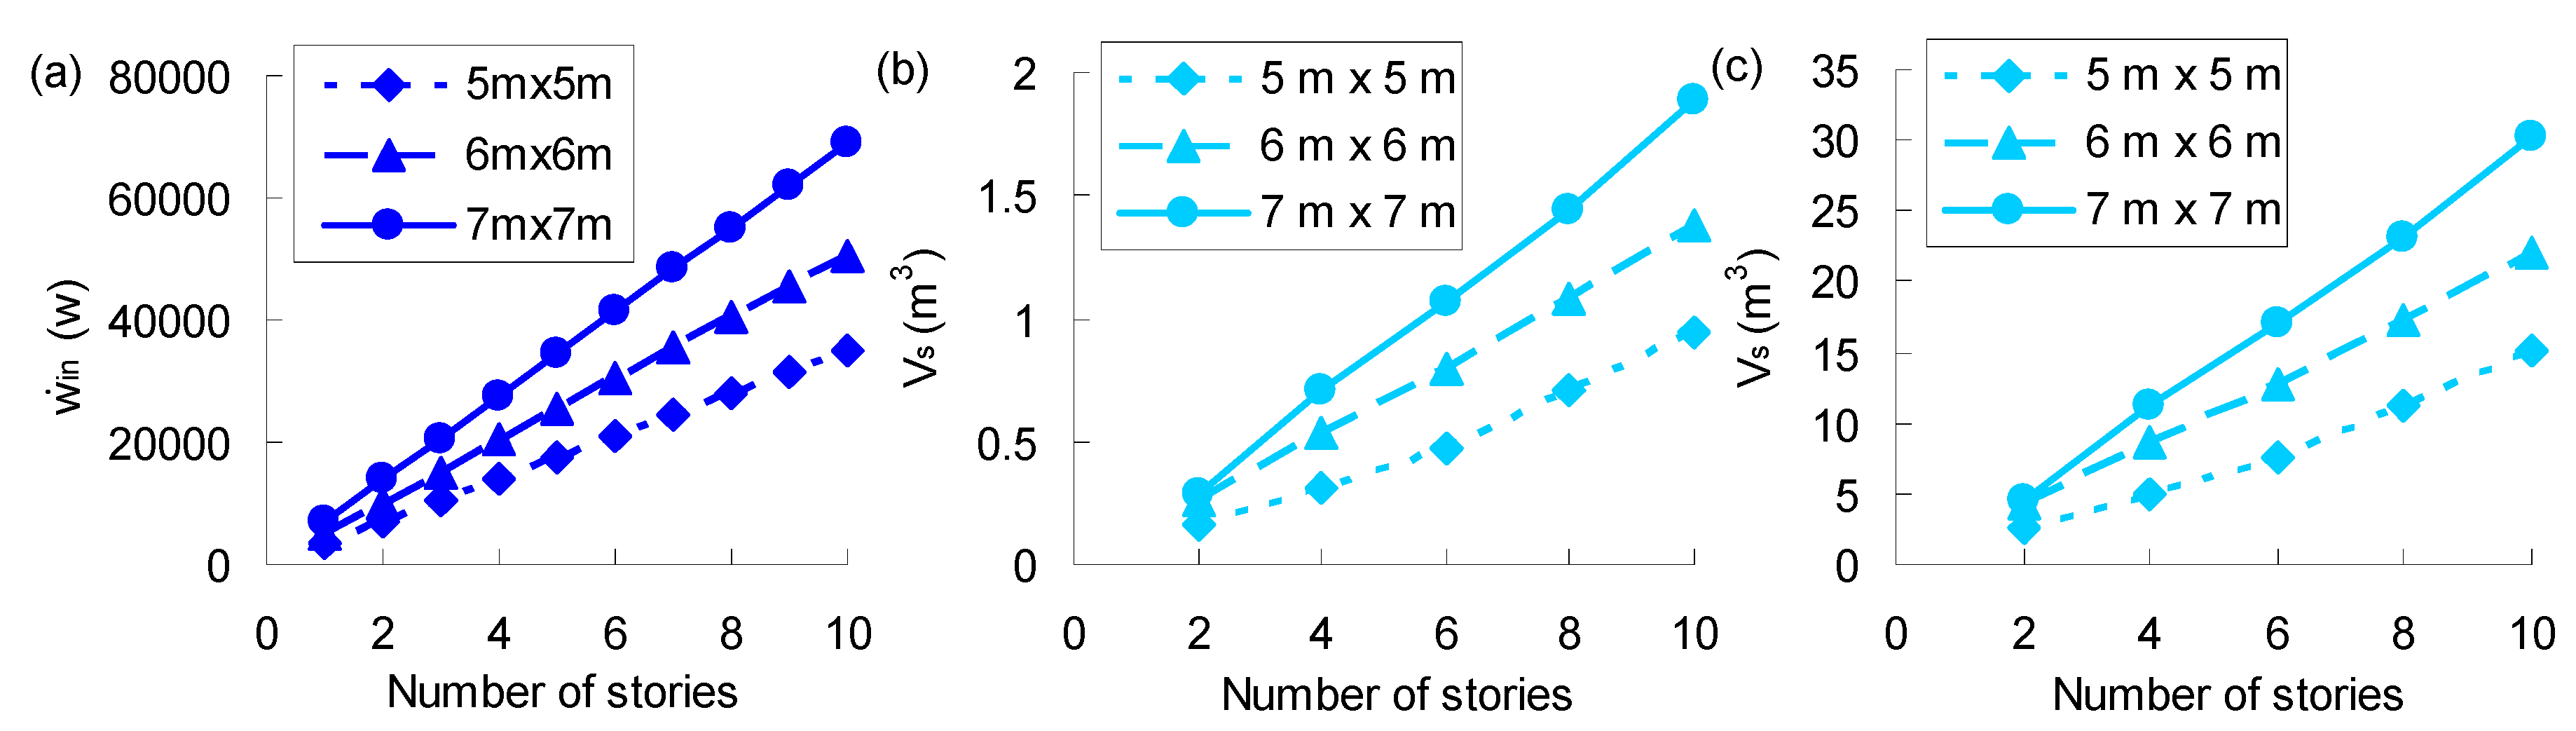
3.1. Pressure and Temperature in the Stored Compressed Air

The temperature (T) and pressure (P) in the stored compressed air can be determined using the thermodynamic process of CAES by inputting available energy for storage ( w ˙ i n ) and available volumes (Vs) for storage following Option 2 discussed in Section 2.1. According to Zhang et al. [7], the temperature (T) in the stored compressed air can be calculated by solving an implicit equation [Equation (1)]. The pressure (P) in the stored compressed air can then be calculated using Equation (2).
V s ( T η 2 T 1 1 η 2 ) 5 / 2 / C 7 / 2 = w ˙ i n η 1 t i n / 3.5 R ( T η 2 T 1 1 η 2 T 1 ) + ρ i V s / μ
P = R T ( T η 2 T 1 1 η 2 ) 5 / 2 / C 7 / 2
where, R is the universal gas constant; T1 is the ambient air temperature; C is a constant taken as 10.89; tin is the time for compressing air; ρi and μ are the initial density and molar mass of the air taken, 1.2 kg/m3 and 0.029 kg/mol, respectively; η1 and η2 is the efficiency for the compression and the heat exchange, respectively.
The available energy for storage can be determined as differences between energy supplies from solar panels and energy demand from the end-users. The available volume for storage for each column is dependent on the length of the pile, the number of the piles, and the inner diameter (di) of the pile, which can be originated from the geotechnical design. Typical residential buildings have been selected to determine the available energy and volume for storage for different numbers of stories (N) ranged from 2 to 10, different column spacing (5 × 5 m, 6 × 6 m, and 7 × 7 m), and different inner diameter (di) of the pile ranged from 200 mm to 800 mm. Figure 3 shows the final calculated available energy and volume for storage per each column inside the building. The detailed calculations are discussed in Zhang et al. [7].
Figure 4 shows the temperature (T) and pressure (P) in the stored compressed air for a one-day (24 h) cycle for the case: 2-story with 7 × 7 m column spacing by solving Equations (1) and (2) with inputs presented in Figure 3. The temperature and pressure start to increase when renewable energy becomes available for storage at 7:00 and reach a peak at 19:00 when renewable energy becomes unavailable. Afterward, the temperature and pressure will decrease as the compressed air is released to generate electricity. As the inner diameter of the pile foundation increases, the temperature and pressure in the stored compressed air reduce because the available volume for storage increases.
The maximum temperature (Tmax) in the stored compressed air is shown in Figure 5 for all other cases by solving Equations (1) and (2) with inputs presented in Figure 3. The maximum temperature is insensitive with different column spacing and numbers of stories because both available energy and volume for storage increase as the column spacing and the number of stories increase (refer to Figure 2). On the other hand, it varies significantly with the changing of the inner diameter (di) of the pile foundation. Therefore, this paper focuses on the most critical case (2-story with 7 × 7 m column spacing) but considers different di.

3.2. Study Parameters

Three parameters are considered in this paper for investigating the temperature distribution along the concrete section: the thermal conductivity of the concrete (k), the specific heat capacity of the concrete (c), and the inner diameter of the pile foundation (di). Six thermal conductivity values ranged from 1.0 to 3.2 W/m·°C, and four specific heat capacity values ranged from 830 to 1000 J/kg·°C were selected based on the material tests discussed in Section 2.2. These values were set to represent both fiber reinforced concrete and high strength concrete. Five inner diameters (ranged from 200 mm to 800 mm) of the pile foundation were selected since the temperature in the stored compressed air varies significantly for different di. Therefore, 120 cases (6 × 4 × 5 = 120) were studied in this paper. The parameters and their selected values are shown in Table 1.

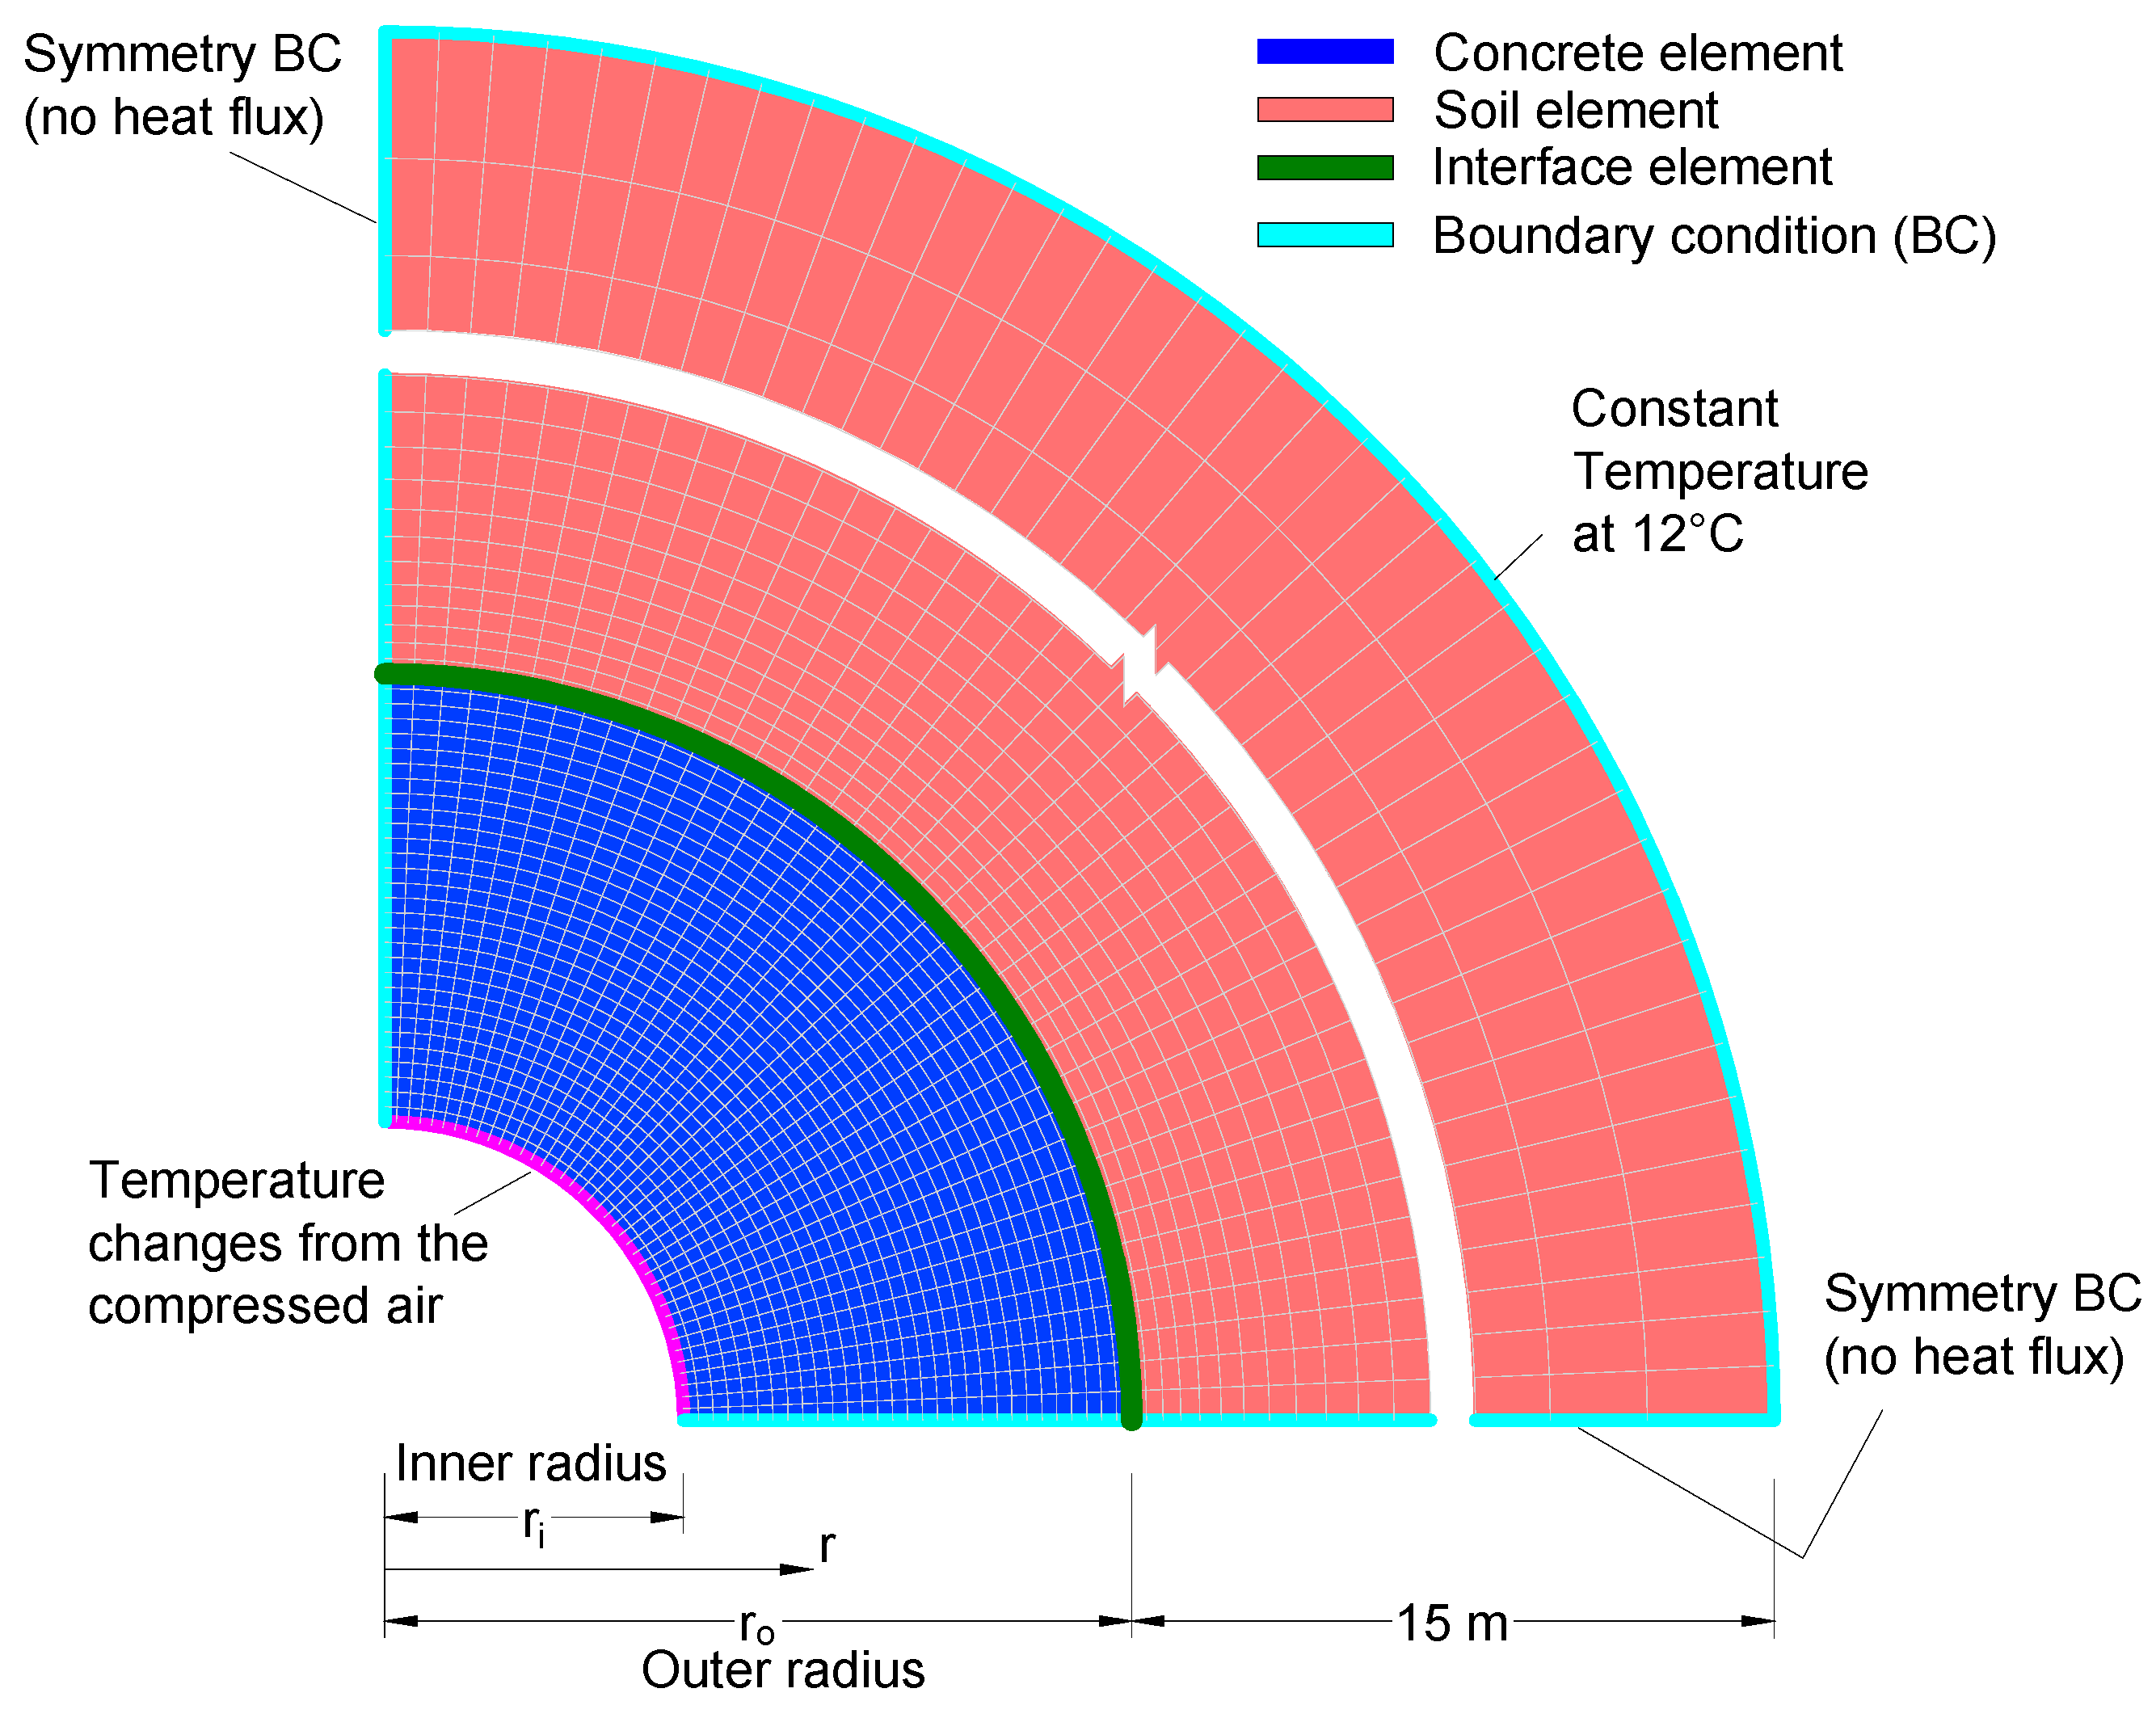
3.3. Numerical Models

The analytical model for the pile foundation and surrounding soils was developed using the general-purpose finite element software ABAQUS, as shown in Figure 6. The 2D plane strain model was constructed to represent a quarter of a whole pile section because of symmetry. The 2D model conservatively ignores the small heat transfer through the bottom of the pile foundation. Symmetry boundary conditions without heat flux passing through were applied. The surrounding soil was modeled for a thickness of 15 m, which is far enough to be not affected by the temperature change inside the pile foundation based on preliminary analysis results. The outer face of the soil was assigned a constant temperature at 12 °C, which falls in the range of nature temperature for the depth of the pile foundation (10 to 15 °C according to [36]). A relatively fine mesh (~10 to 20 mm) was applied for the concrete section. On the other hand, the mesh size in the surrounding soil gradually increases along the radius (r) direction when moving far from the pile foundation in order to save computer memory and storage. The mesh size was selected by balancing the time integration increment and computer running time to achieve the required numerical stability.
The thermal properties (k and c) presented in Table 1 were assigned to the concrete. For the soil, thermal conductivity and specific heat capacity for typical sand with a moisture content of 5% were used as k = 1.0 W/m·°C and c = 1220 J/kg·°C. An interface element was defined with a thermal conductance of 25 W/m2·°C, considering that complete contact between the concrete and soil is impossible. The density of the concrete and soil was adopted as 2450 kg/m3 and 1600 kg/m3, respectively.
The non-steady state heat transfer analysis was conducted by applying the temperature change with time at the inner surface of the pile foundation. Time integration adopted the backward Euler method with unconditional stability. The Courant–Friedrichs–Lewy is controlled to be less than 1.0 by automatically adjusting time integration incrementation during the simulation. Nonlinear thermal properties and the concrete cracking effect were not considered in the simulation due to the fact that the proposed new energy storage foundation requires limited cracks or even crack-free by using fiber reinforced concrete and high strength [8,9]. The temperature change follows the 24 h cycle, as defined in Figure 3a. The energy storage pile foundation is supposed to be subjected to many temperature loading cycles for its entire life. Therefore, for each simulation, 150 cycles were applied to ensure the variation of the temperature inside the concrete section at the same hour between adjacent cycles to be less than 0.05 °C. The initial temperature of the pile foundation and surrounding soils was assumed at 12 °C, which falls in the range of nature underground temperature for the depth of the pile foundation (10 to 15 °C according to [36]).

4. Numerical Results and Discussion

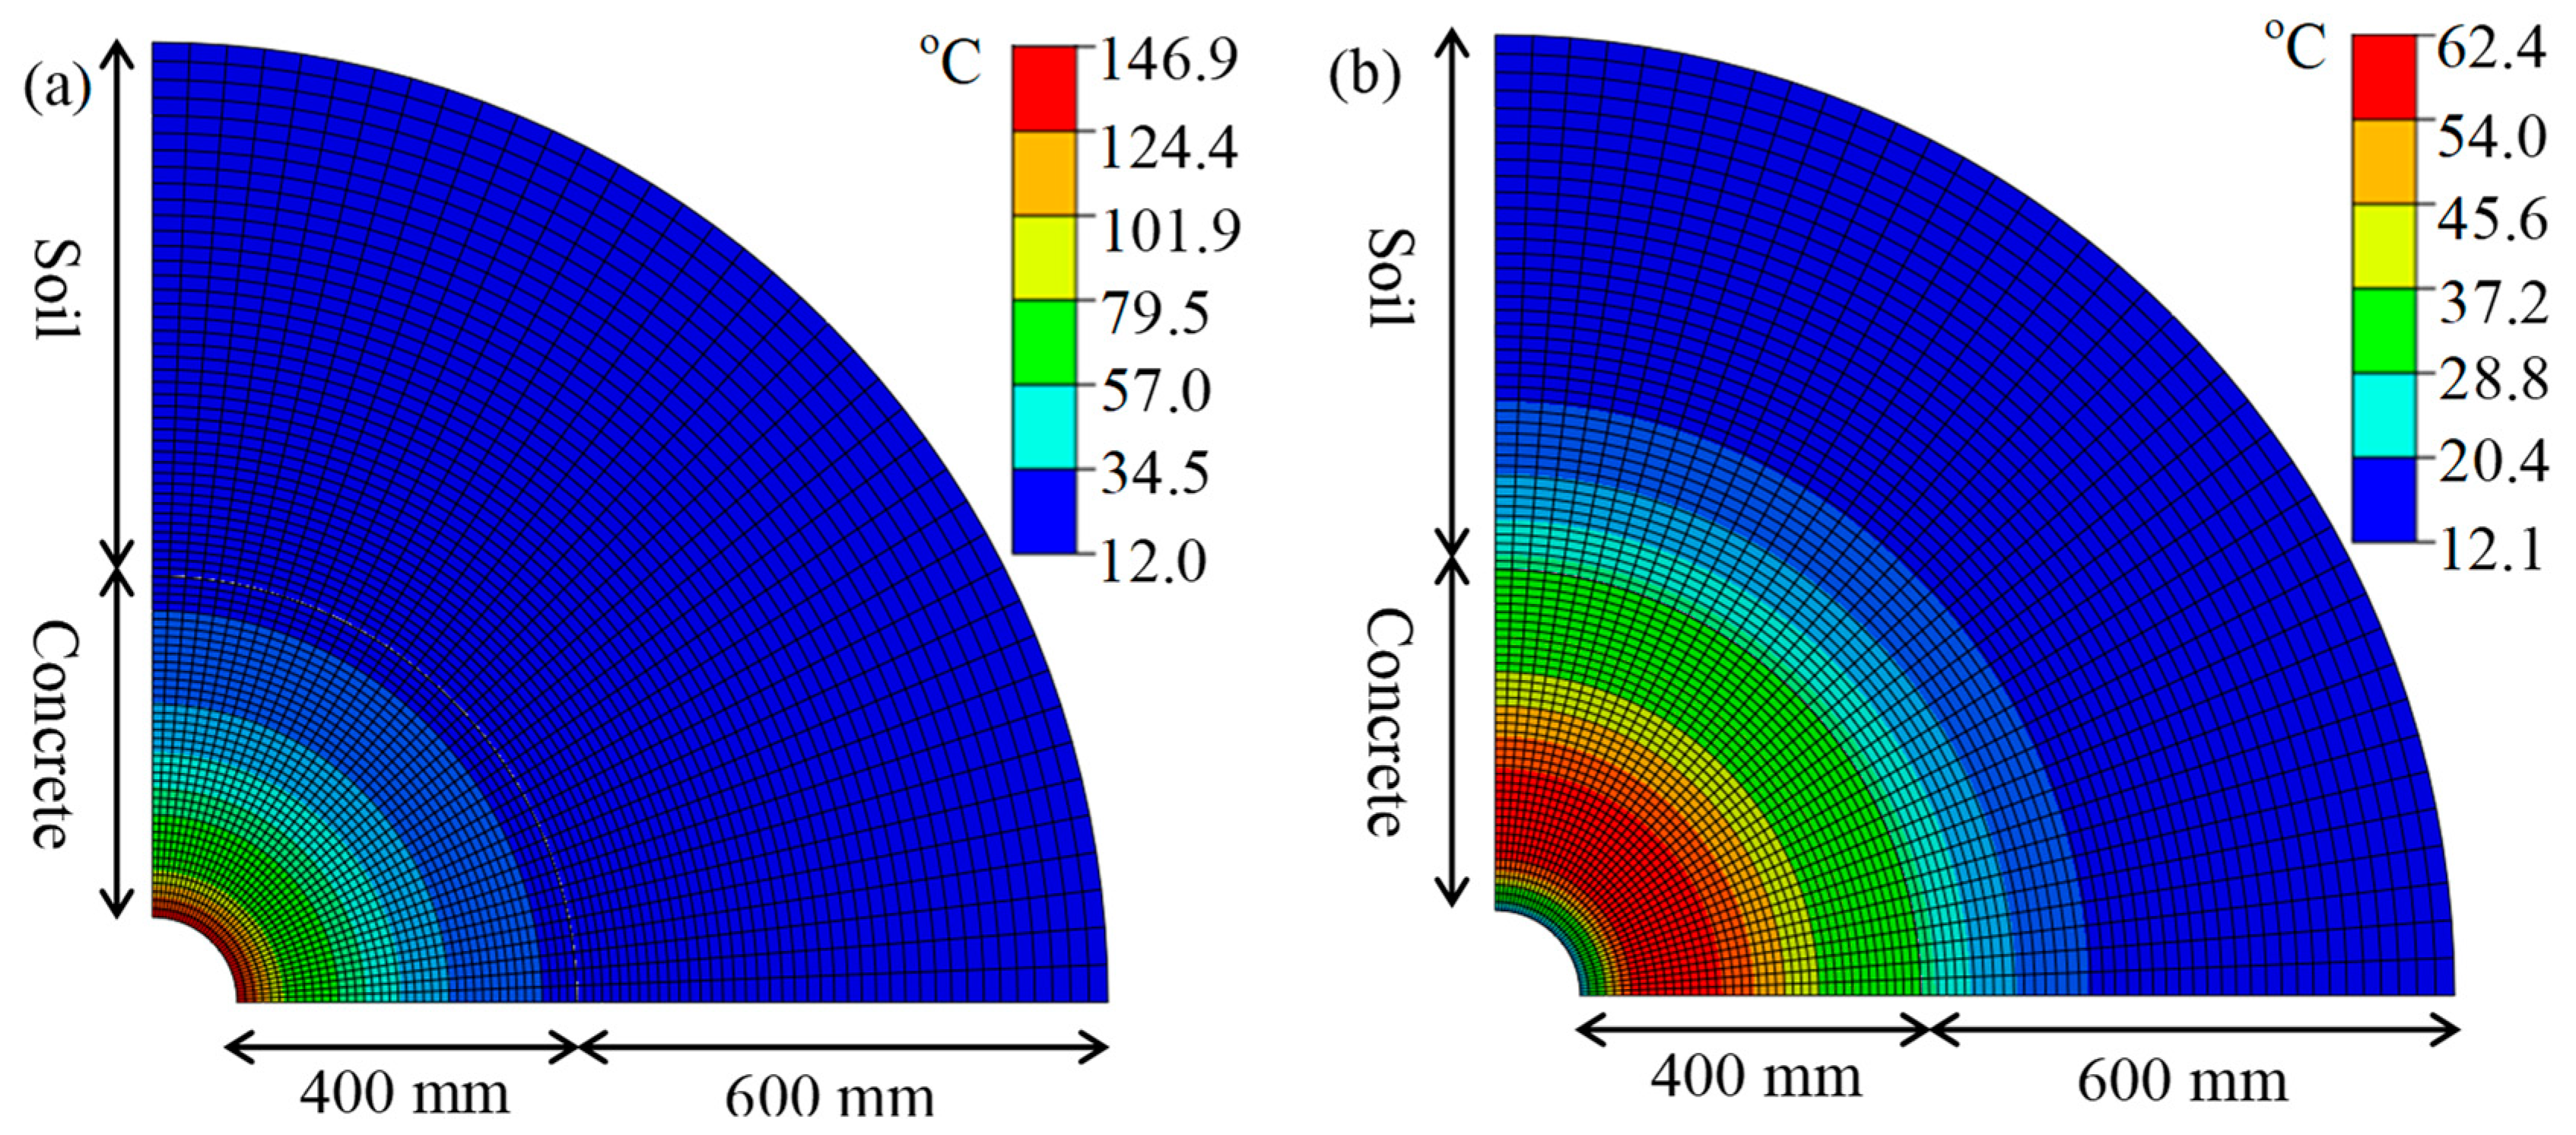
4.1. General Response

The general heat transfer response of the pile foundation is discussed in this section using the case with k = 2 W/m·°C, c = 940 J/kg·°C, and di = 200 mm as an example. Figure 7 shows the temperature distribution contours in the first loading cycle at two different times for the concrete and the surrounding soil. The temperature profile in the pile foundation and the surrounding soil is uniform along the circumferential direction because of the symmetry of geometry and loading conditions. Therefore, the rest of the paper only presents temperature distributions along the radius direction (r), along which the temperature changes.
Figure 8 shows the temperature change in the first 24 h loading cycle for a couple of locations in the concrete and nearby soil. As seen in Figure 8a, as an input loading, the temperature at the inner surface (r = 100 mm) of the pile foundation follows the one in the compressed air (refer to Figure 4a): increasing from 7:00 to 19:00 but decreasing from 19:00 to 7:00. As time goes by, the heat is gradually transferred from the inner to the outer surface and causes a temperature change at other places. The temperature change becomes smaller and slower from the inner to the outer surface. The temperature near the outer surface (di = 500 mm) does not even decrease during the entire loading cycle. As observed in Figure 8b, the heat also penetrates the soil and increases the temperature in the nearby soil. This penetration becomes smaller as moving further from the pile foundation and stops at r = 1100 mm, where the initial temperature (12 °C) remains.
Figure 9 shows the temperature distribution in the first 24 h loading cycle for various times. From the 7:00 to 19:00 (see Figure 9a), similar temperature distributions are observed in the concrete section though the magnitude increases with the time. On the other hand, from the 19:00 to 7:00 (see Figure 9b), different temperature distributions are observed in the concrete section because the temperature near the inner surface drops, while that near the outer surface still increases. At the end of the first loading cycle, the significant residual temperature is observed in the concrete section. The temperature distribution in the soil is similar for the entire loading cycle, with the magnitude increasing gradually (see Figure 9b). Sudden temperature drops between the concrete surface and the soil surface are observed because of the interface heat transfer effect.
The temperature in subsequent cycles is expected to be affected by the residual temperature at the end of the first loading cycle. Figure 10 shows the temperature history for a couple of locations in the concrete and the soil during the first 36 loading cycles. In general, except for the inner surface, which follows the input temperature change, the temperature in both concrete and soil gradually increases with cycles because of the cumulative effect of the residual temperature. The increase rate is initially high but starts to slow down as the increase of the loading cycle. Moving from the inner surface to the outer, the temperature variation within each cycle becomes smaller. This observation indicates that the effect of the temperature change in the compressed air becomes lower when moving further from the center of the pile foundation. For a distance of 10.1 m from the center of the pile foundation, the soil temperature is not affected (see Figure 10b).
Figure 11 shows the maximum temperature of each loading cycle at a couple of locations in the concrete and the soil. The maximum temperature increases with the loading cycles but starts to be converged at a stable value after a sufficient amount of cycles. This convergence is because the maximum temperature loading at the inner surface (r = 0.1 m) is the same for all the cycles (See Figure 11a). Moving from the center of the pile foundation, more cycles are needed for the maximum temperature to be converged, which again implies the effect of the temperature loading becomes smaller.
Figure 12 shows the temperature distribution in different loading cycles at three different times: (a) 7:20 at the beginning of each loading cycle, (b) 19:00 at the middle of each loading cycle, and (c) 7:00 at the end of each loading cycle. As seen in Figure 12a, the first loading cycle shows a different temperature distribution shape than those of other cycles at the beginning of each loading cycle because it is the only cycle not being affected by the residual temperature. For other time hours, the temperature distributions follow similar shapes because of the influence of the input temperature loading within the cycle (See Figure 12b,c). Therefore, the cumulative residual temperature has larger effects on the magnitude of temperature than the shape of distribution along the radius direction.

4.2. Parametric Results

This section discusses the effects of three parameters, including the inner diameter of the pile foundation (di), the thermal conductivity (k) of the concrete, and the specific heat capacity (c) of the concrete on the temperature changes and distributions inside the pile foundation. The results for different di are shown in this section with k = 2 W/m·°C and c = 940 J/kg·°C. The results for different k are presented for di = 200 mm and c = 940 J/kg·°C. The results for different c are presented for di = 200 mm and k = 2 W/m·°C.
Figure 13 shows the temperature change in the first loading cycle for different di at: (a) the inner surface of the pile section; (b) the midpoint of the pile section; (c) the outer surface of the pile section. As seen in Figure 13a, the temperature change at the inner surface follows the input temperature loading (refer to Figure 4a) and decreases as the di increases. However, moving from the inner surface, the temperature change becomes more significant as the di increases (See Figure 13b,c). This observation indicates that the heat can be transferred to the outer surface much faster for the larger di cases with thinner section thickness, which in turn results in a more uniform temperature distribution in the concrete pile foundation, as shown in Figure 14.
Figure 15 shows the maximum temperature in each loading cycle for different di at: (a) the midpoint of the pile section; (b) the outer surface of the pile section. For all cases, the maximum temperature increases with the loading cycle and is converged after a sufficient amount of cycles. The smaller di cases are converged at a higher temperature than the larger di cases because their input temperature loading is higher. On the other hand, the convergence speed increases with an increase of di since the heat can go through the concrete section faster for the larger di cases.
Figure 16 shows temperature change in the first loading cycle for different k at: (a) the midpoint of the pile section; (b) the outer surface of the pile section. As seen in Figure 16, the temperature change becomes more significant as the k increases since the heat transfer becomes faster. As a result of the faster heat transfer, the temperature inside the pile foundation is consistently higher for the cases with larger k during the entire 24 h cycle. Also, it has been noticed that the temperature distribution in the concrete pile foundation along the radius direction tends to be slightly more uniform for the higher k cases, as shown in Figure 17.
Figure 18 shows the maximum temperature in each loading cycle for different k at: (a) the midpoint of the pile section; (b) the outer surface of the pile section. As expected, the maximum temperature increases with the loading cycle and is converged after a sufficient amount of cycles. The cases with higher k are converged at higher temperatures and show faster convergences compared to the lower k cases.
Figure 19 shows temperature change in the first loading cycle for different c at: (a) the midpoint of the pile section; (b) the outer surface of the pile section. As seen in Figure 19, the temperature change becomes more significant as c decreases since the lower c can hold less heat resulting in a faster heat transfer. This trend is similar to the effect of thermal conductivity. However, the influence of the specific heat capacity is much smaller than that of the thermal conductivity.
To quantify the effect of di, k, and c on the heat transfer response in the concrete pile foundation, a variable, Cconv, is defined as the number of cycles, which is required to have the temperature in the concrete section converged at a stable value. This stable value is quantified as the variation of the maximum temperature at the outer surface of the pile foundation between adjacent cycles to be less than 0.05 °C.
Figure 20 shows the calculated Cconv for all cases studied in this paper. As seen in Figure 20, the required convergence cycle reduces as the di increases and the section thickness reduces, which requires less time for the heat transfer. As for the effect of concrete thermal properties, when k increases and c decreases, the heat transfer speed increases, which requires fewer cycles for the convergence. The influence of c is much smaller than di and k, which can be omitted.

5. Conclusions

This paper investigates the heat transfer response of the concrete pile foundation subjected to temperature changes from the compressed air for the renewable energy storage purpose. The non-steady state heat transfer analysis was conducted using the 2D plane strain model with different thermal properties for concrete and pile section geometries. The temperature changes and distributions in the concrete pile foundation have been identified from the numerical results. The temperature changes and distributions obtained in this paper can further be used for thermal mechanical analyses to investigate the structural and geotechnical safety and stability for the foundation system and surrounding soil. The following conclusions can be drawn for the general heat transfer response in the concrete pile foundation:
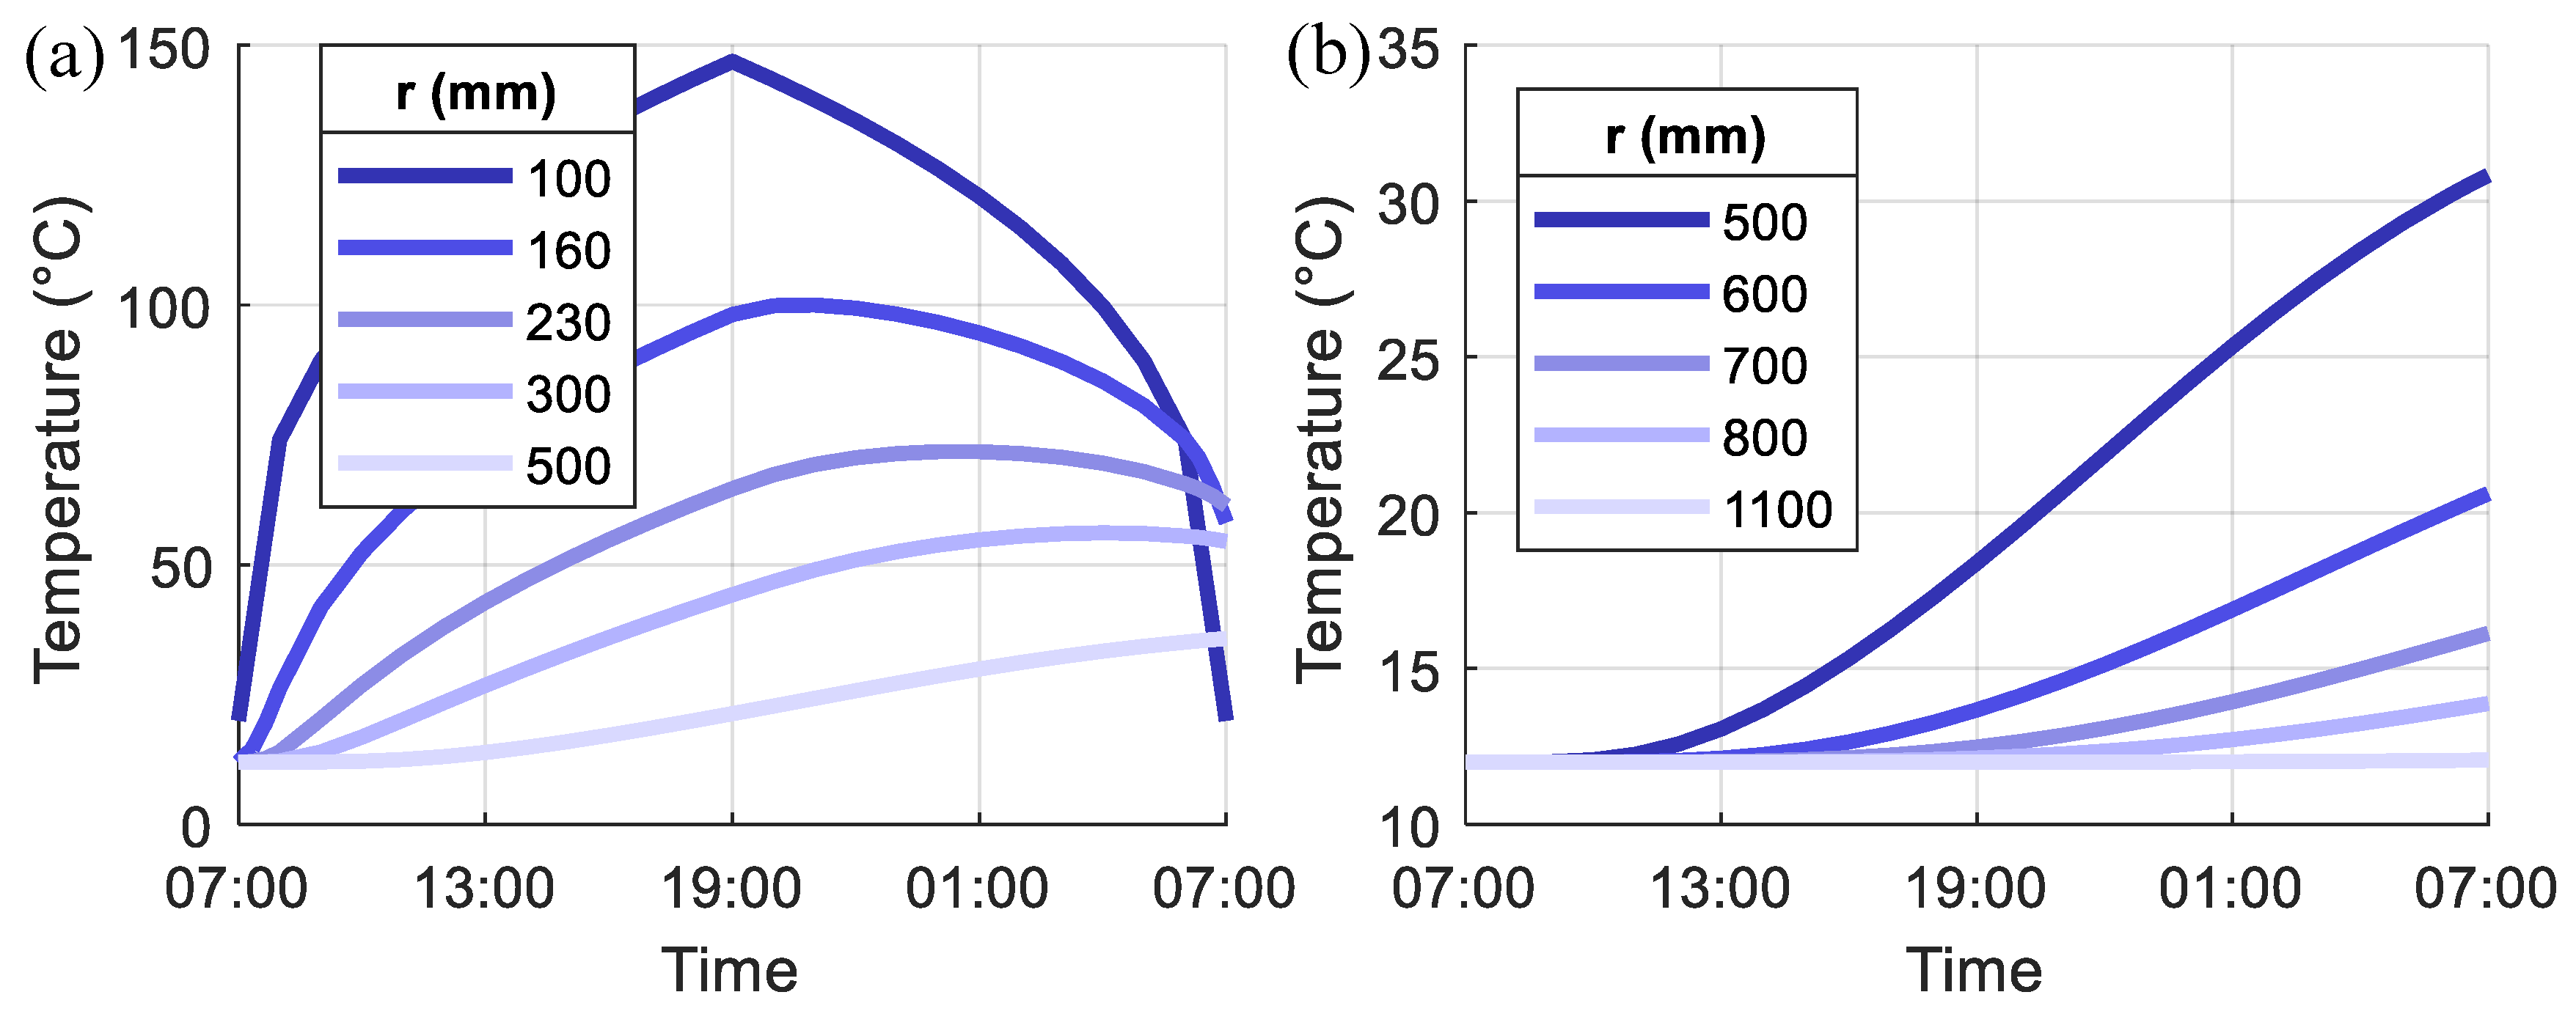
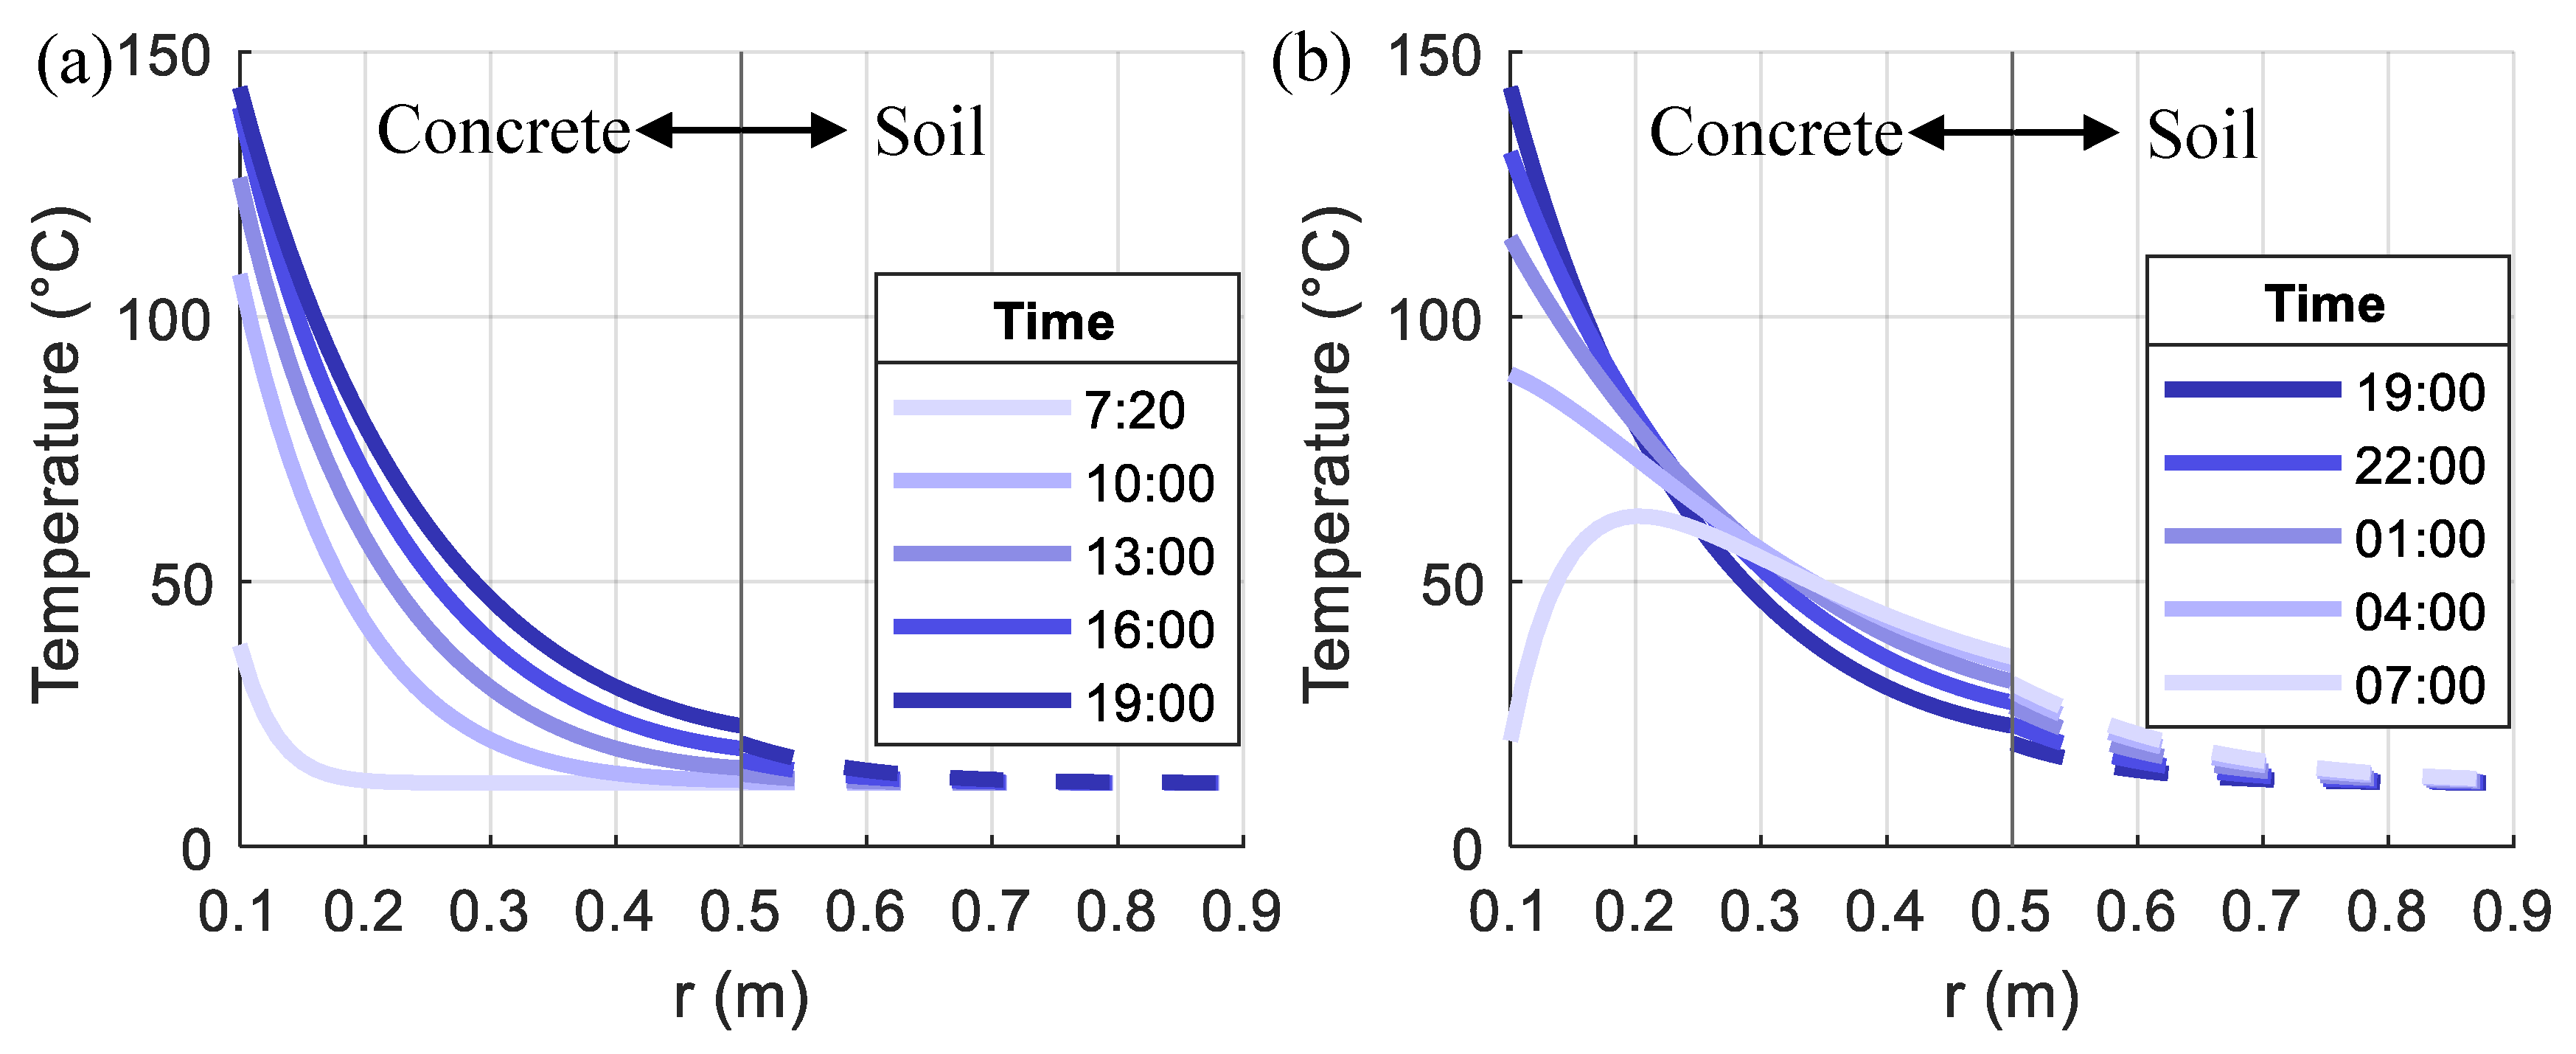
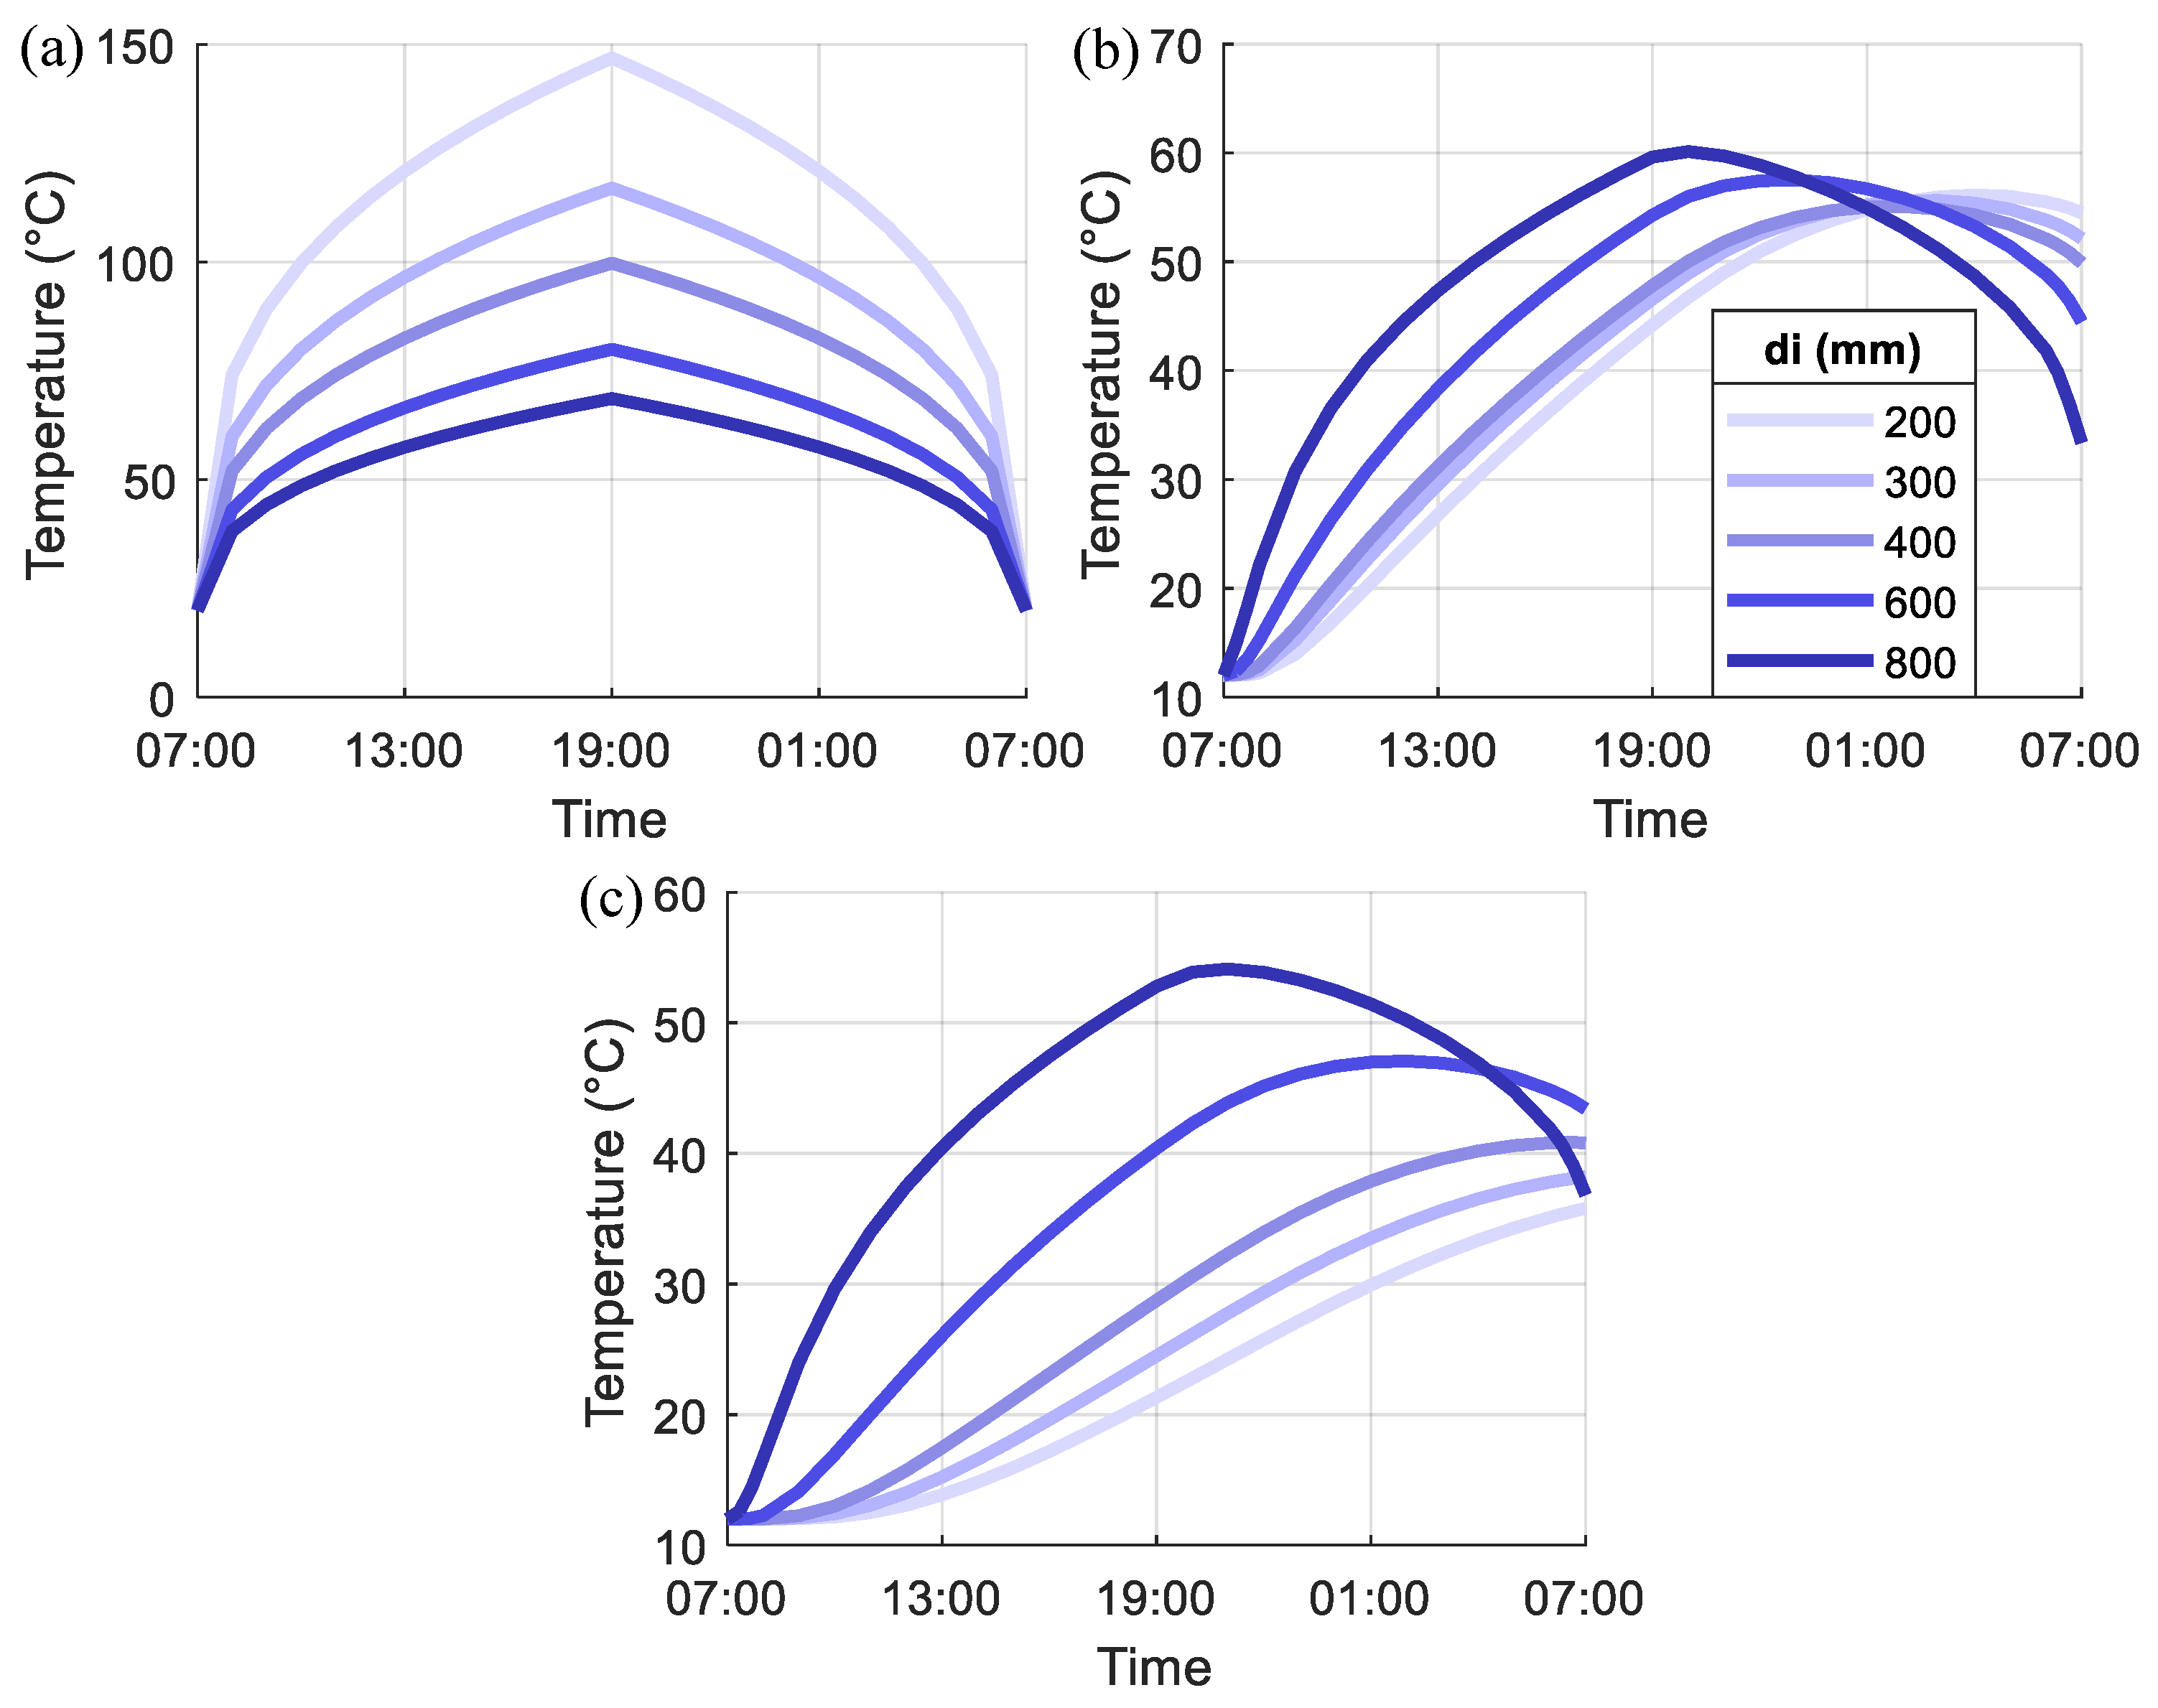
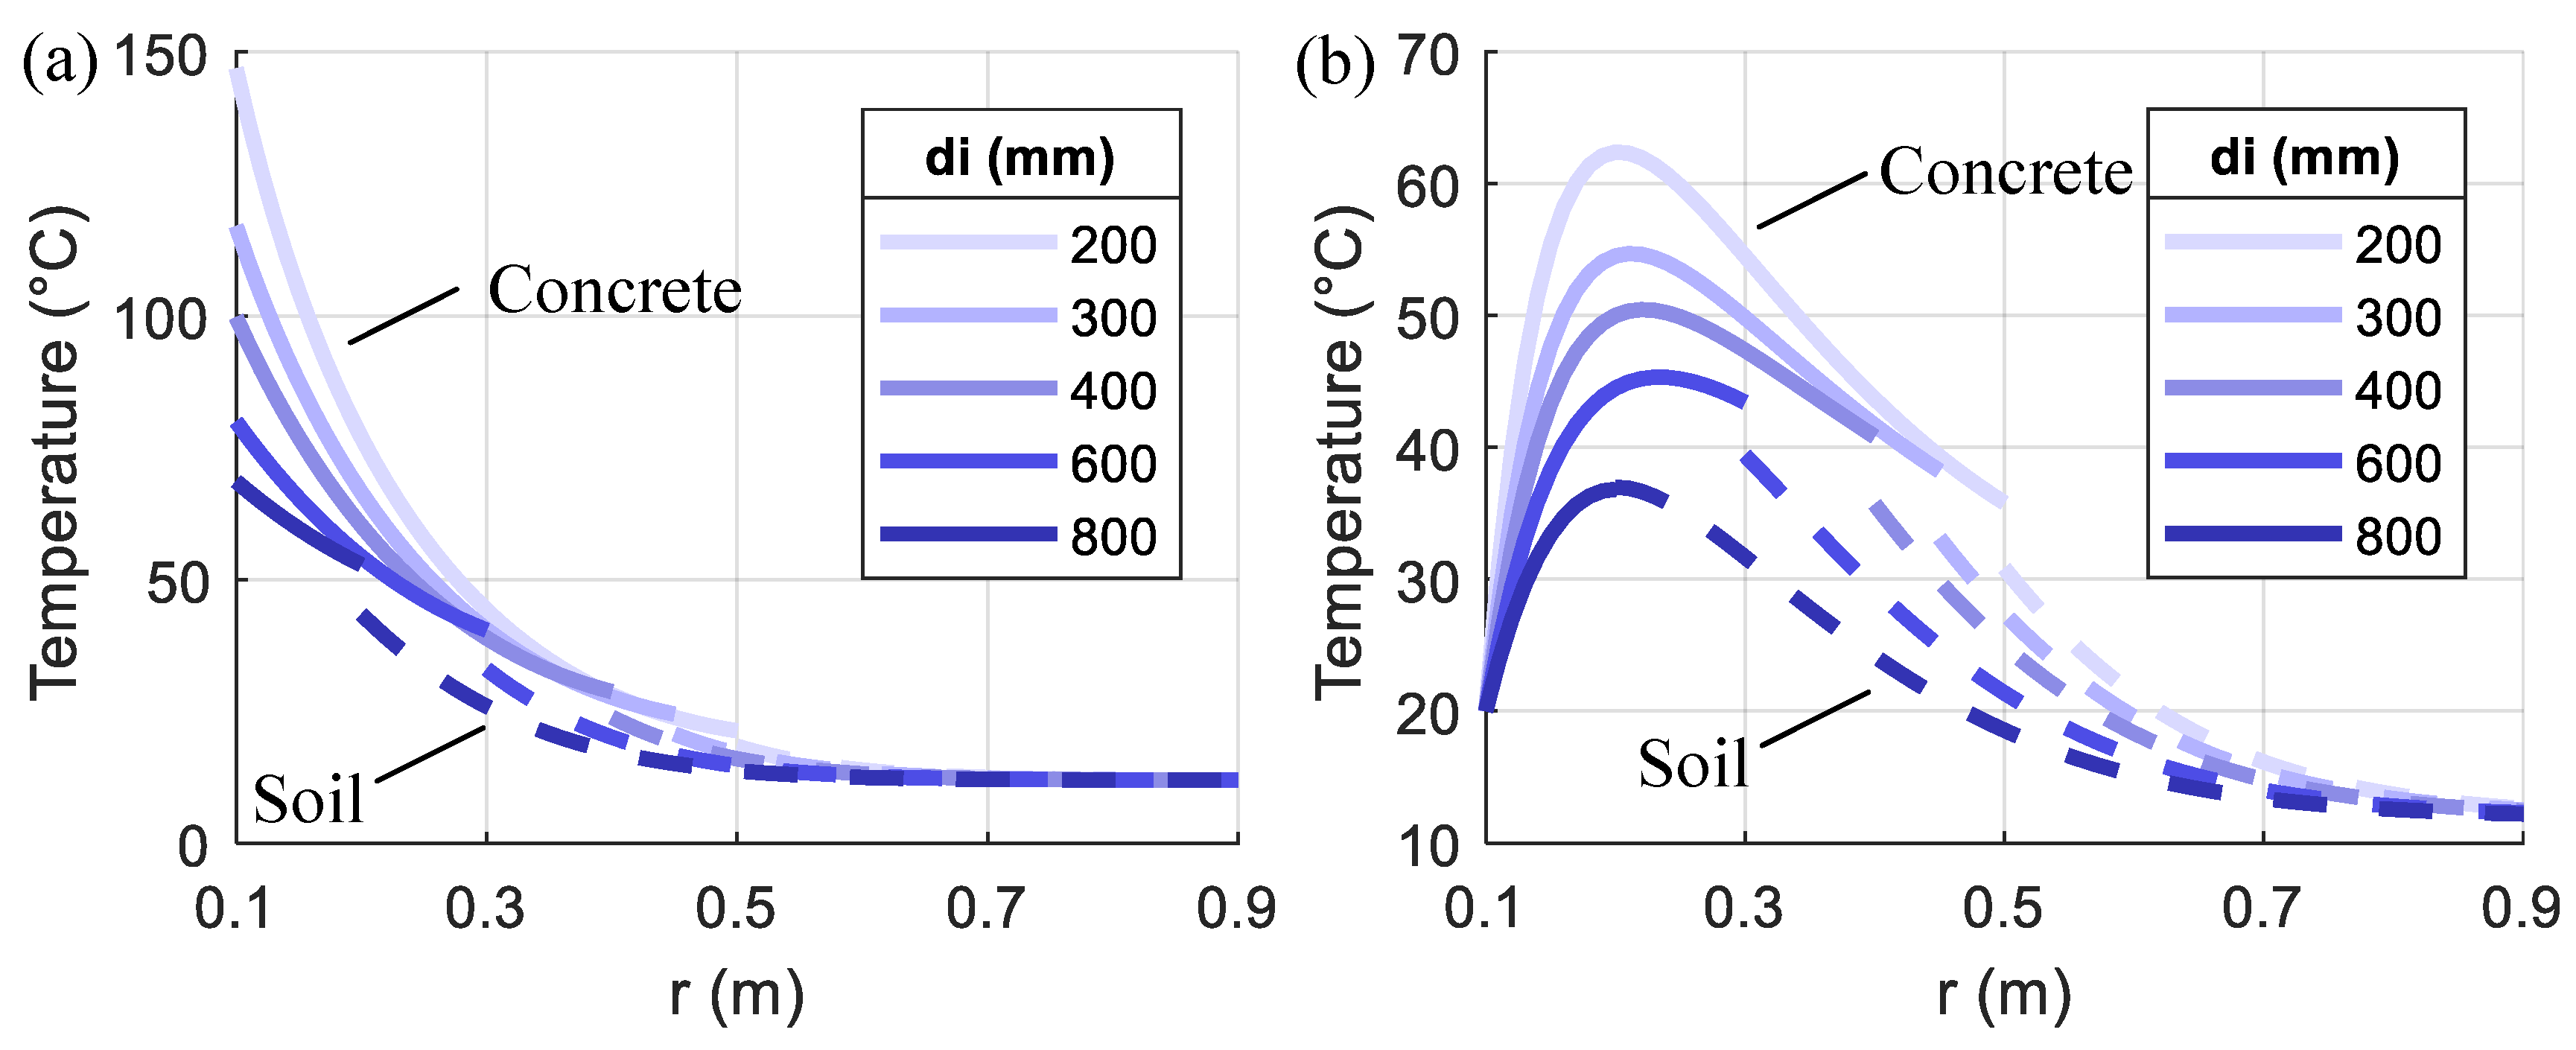
  • The heat generated from the compressed air is gradually transferred from the inner to the outer surface of the pile section and causes temperature changes, which become smaller and slower when moving from the inner to the outer surface.
  • The temperature distribution along the radius direction in a loading cycle varies with time, especially when the temperature loading starts to drop. Residual temperatures in the pile section are observed at the end of the loading cycle.
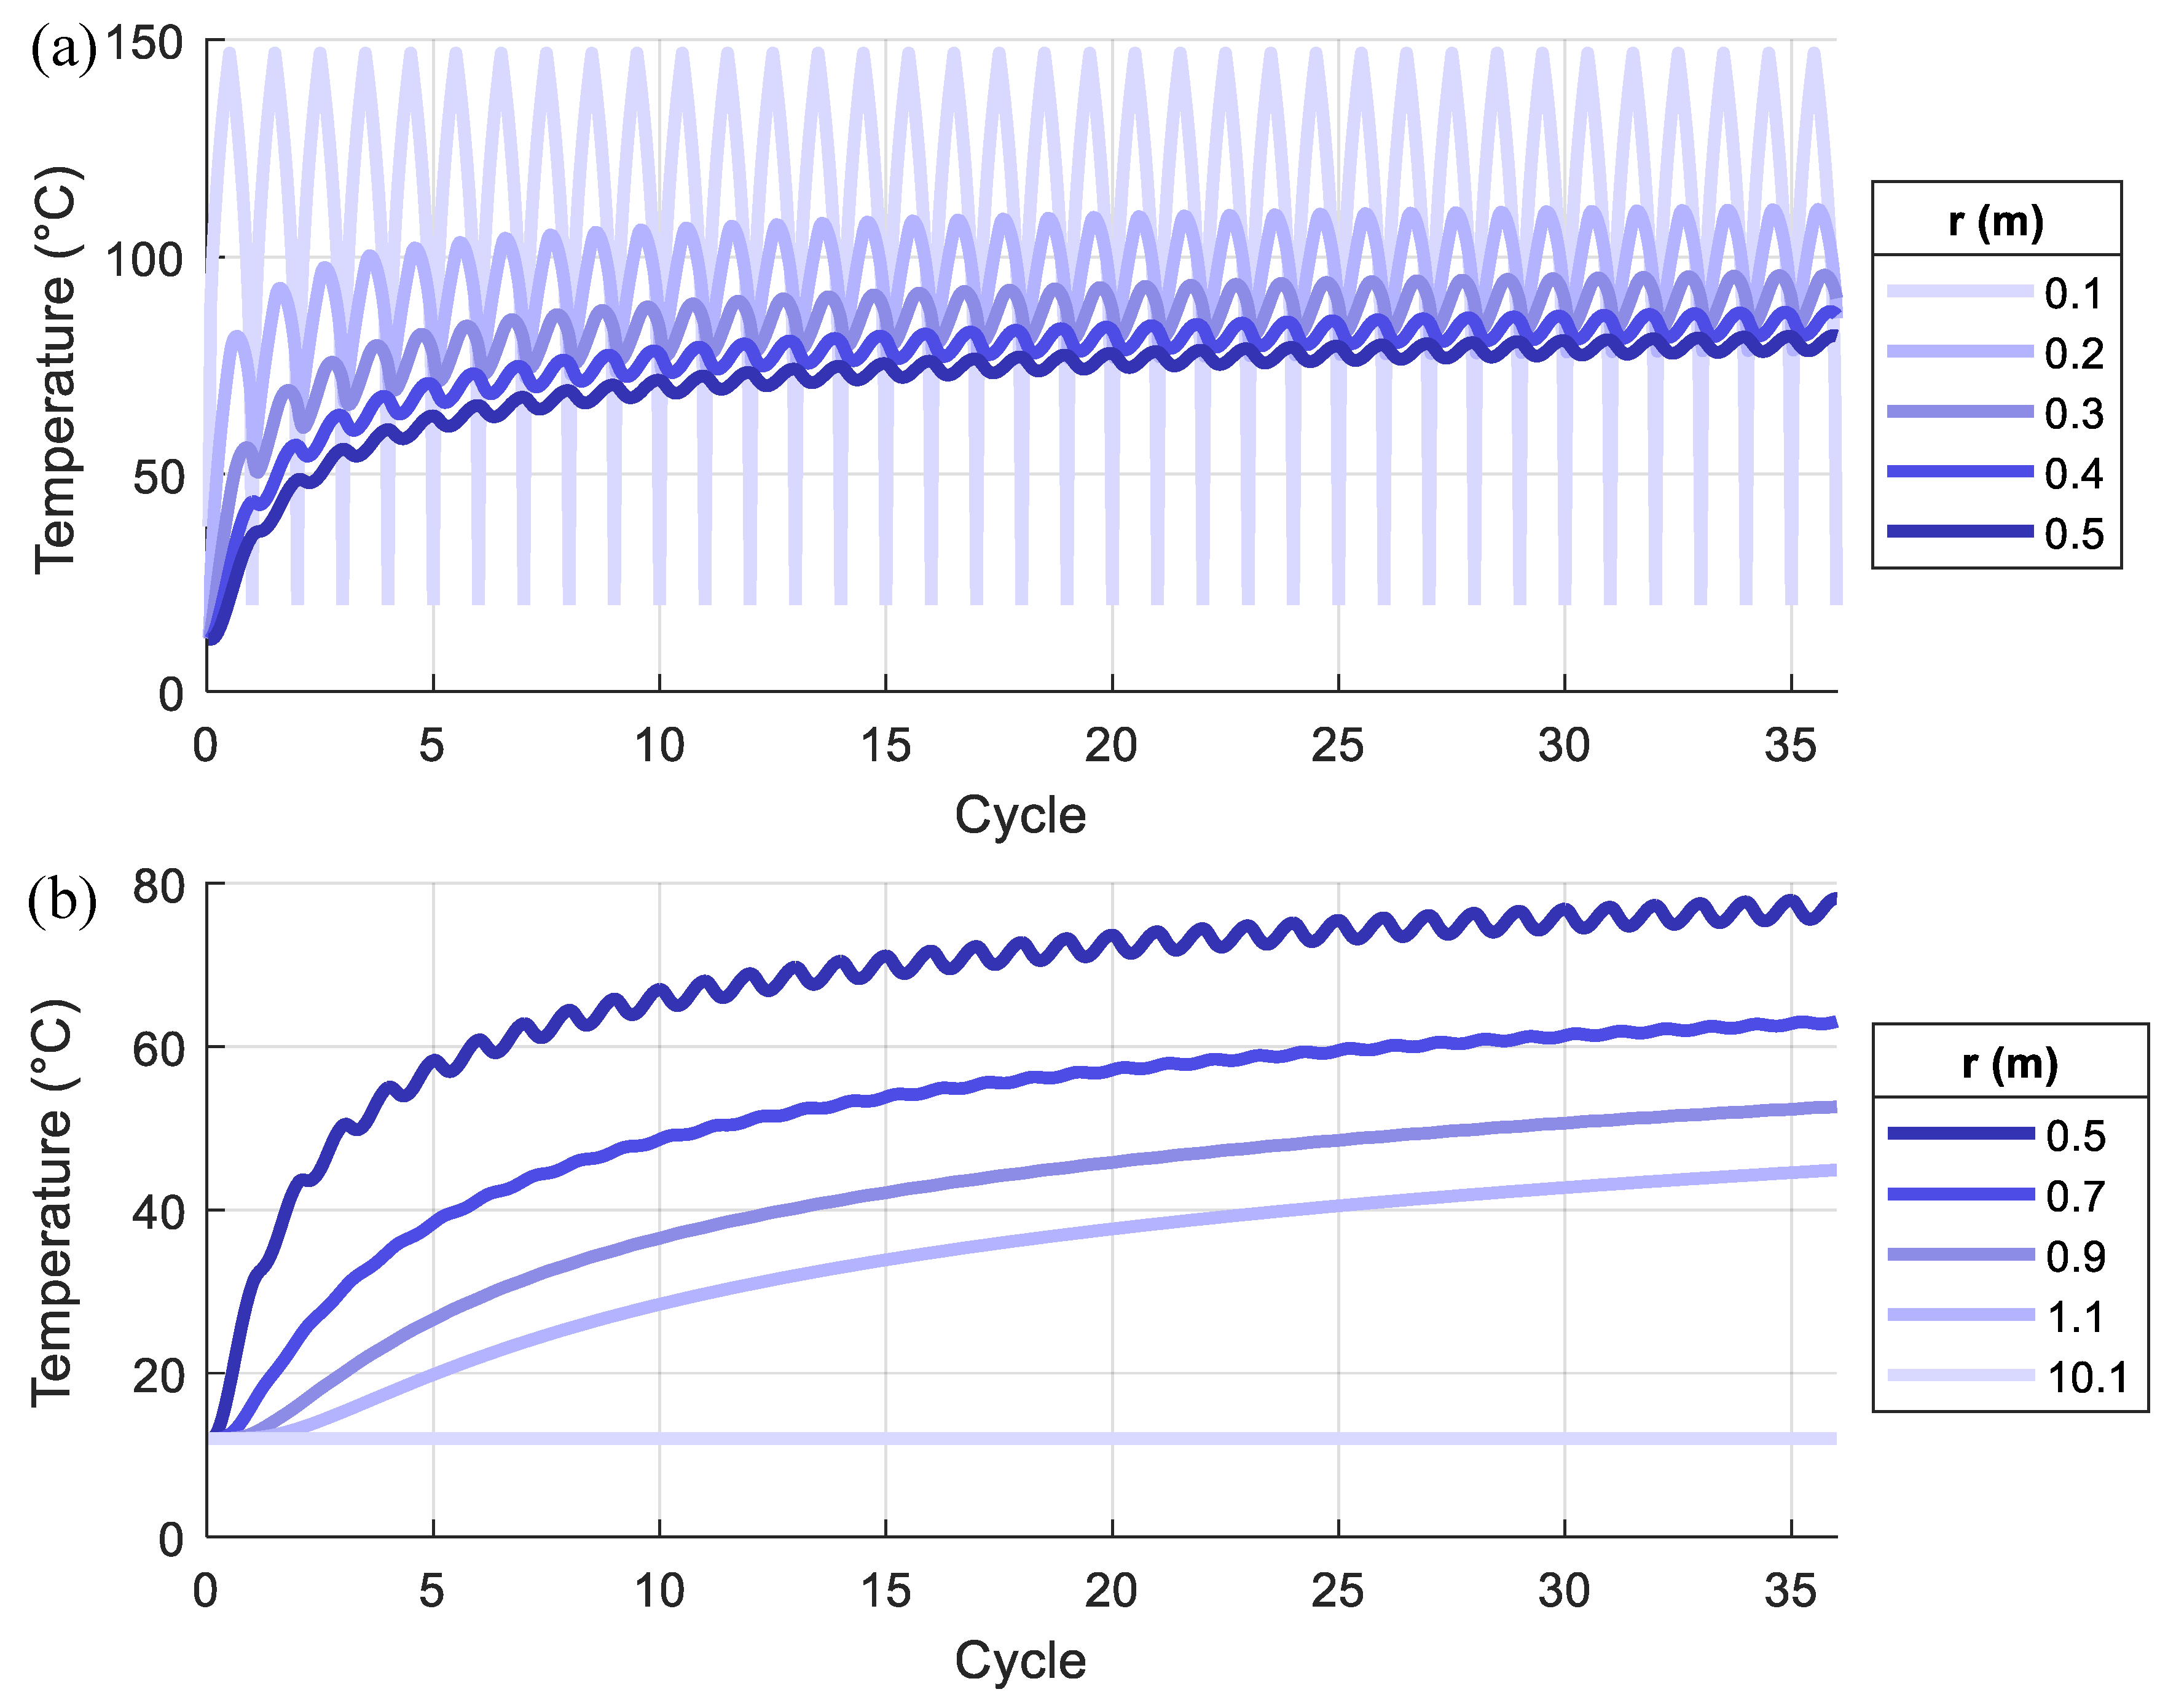
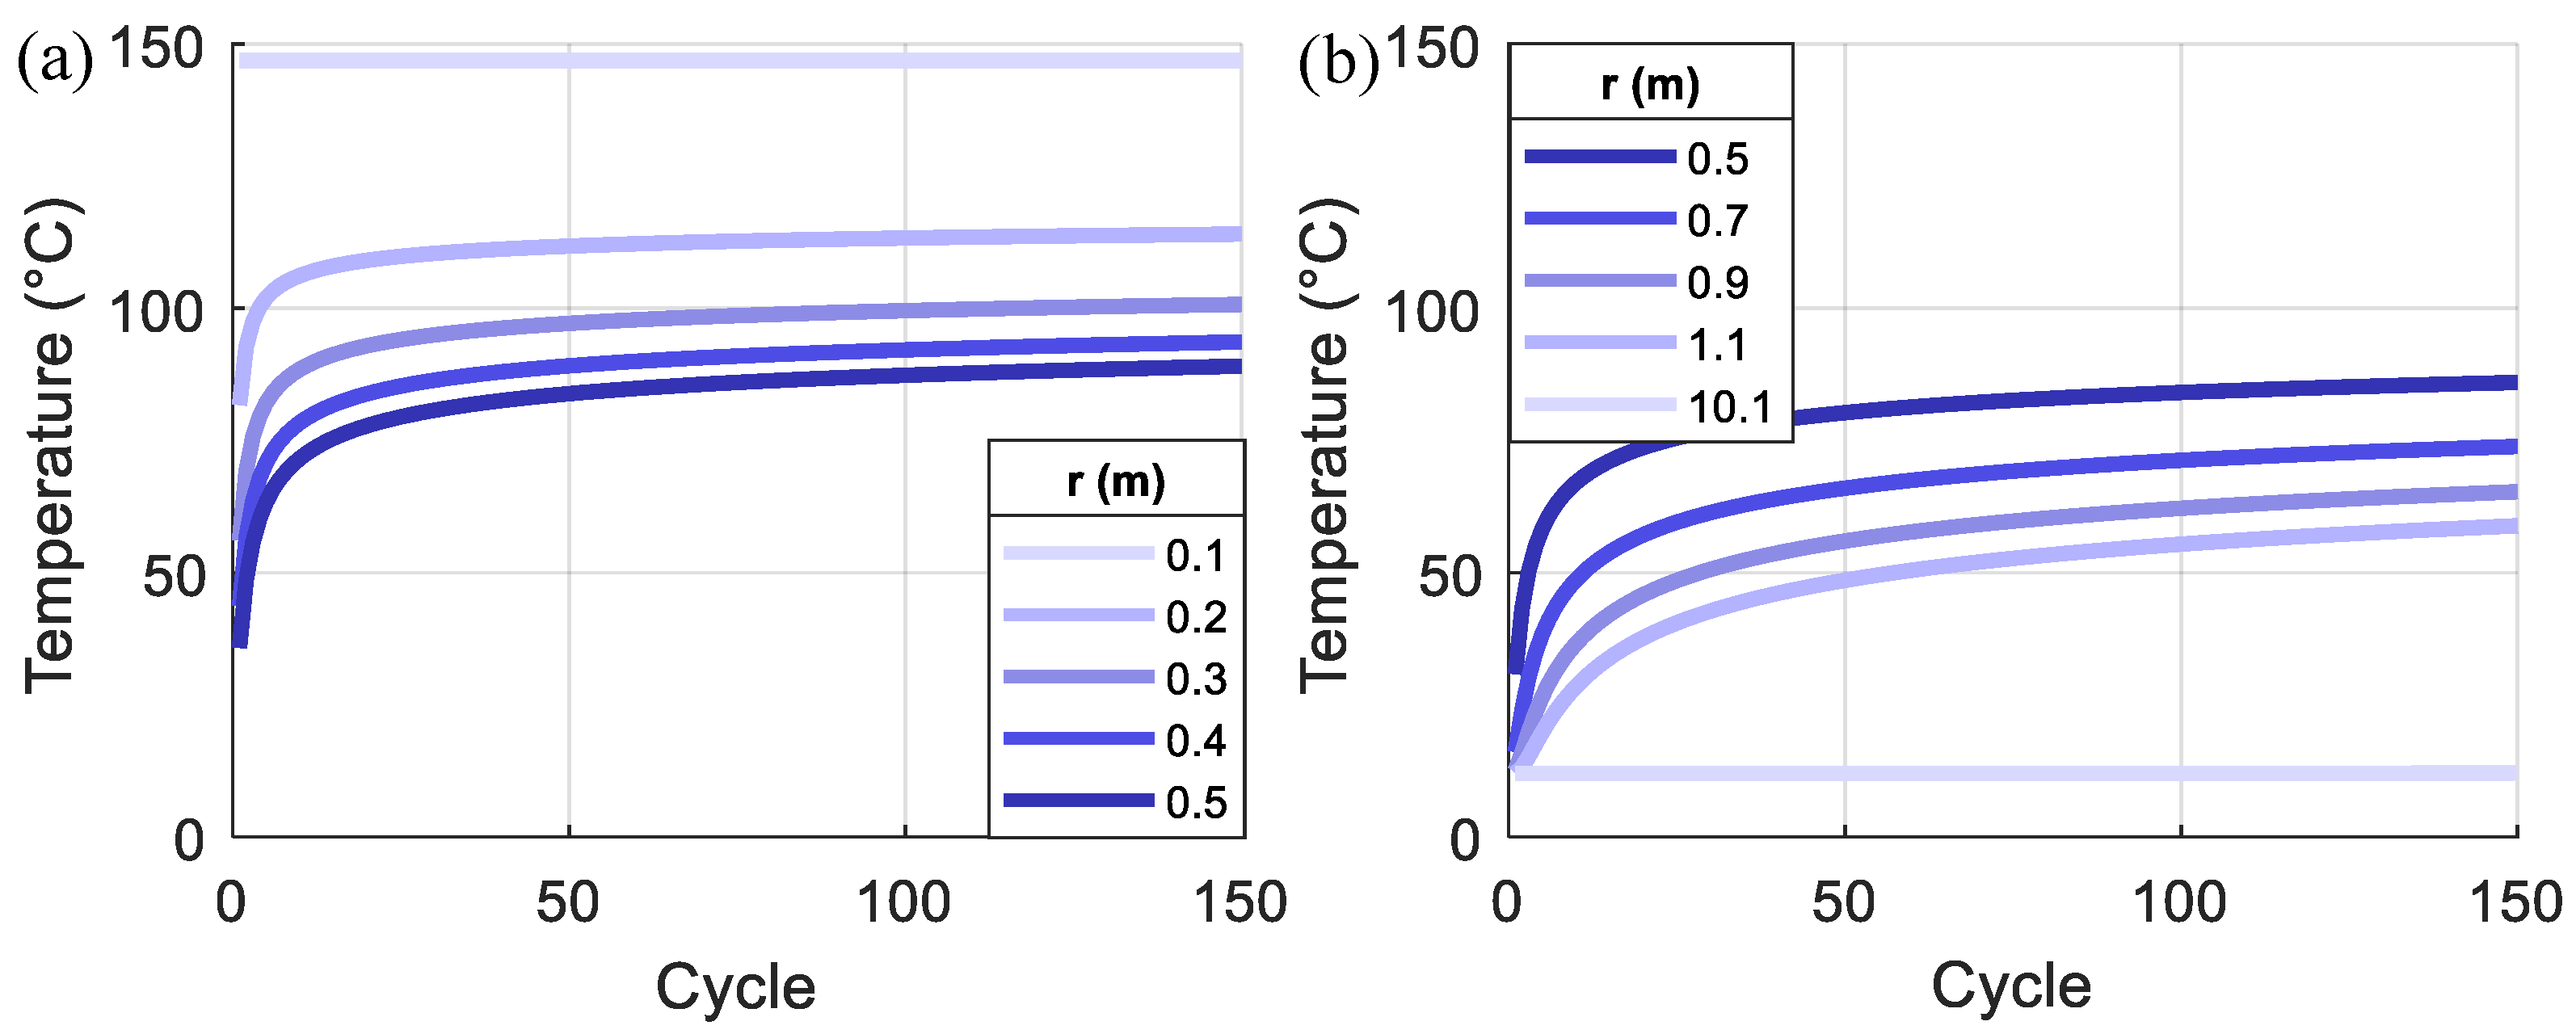
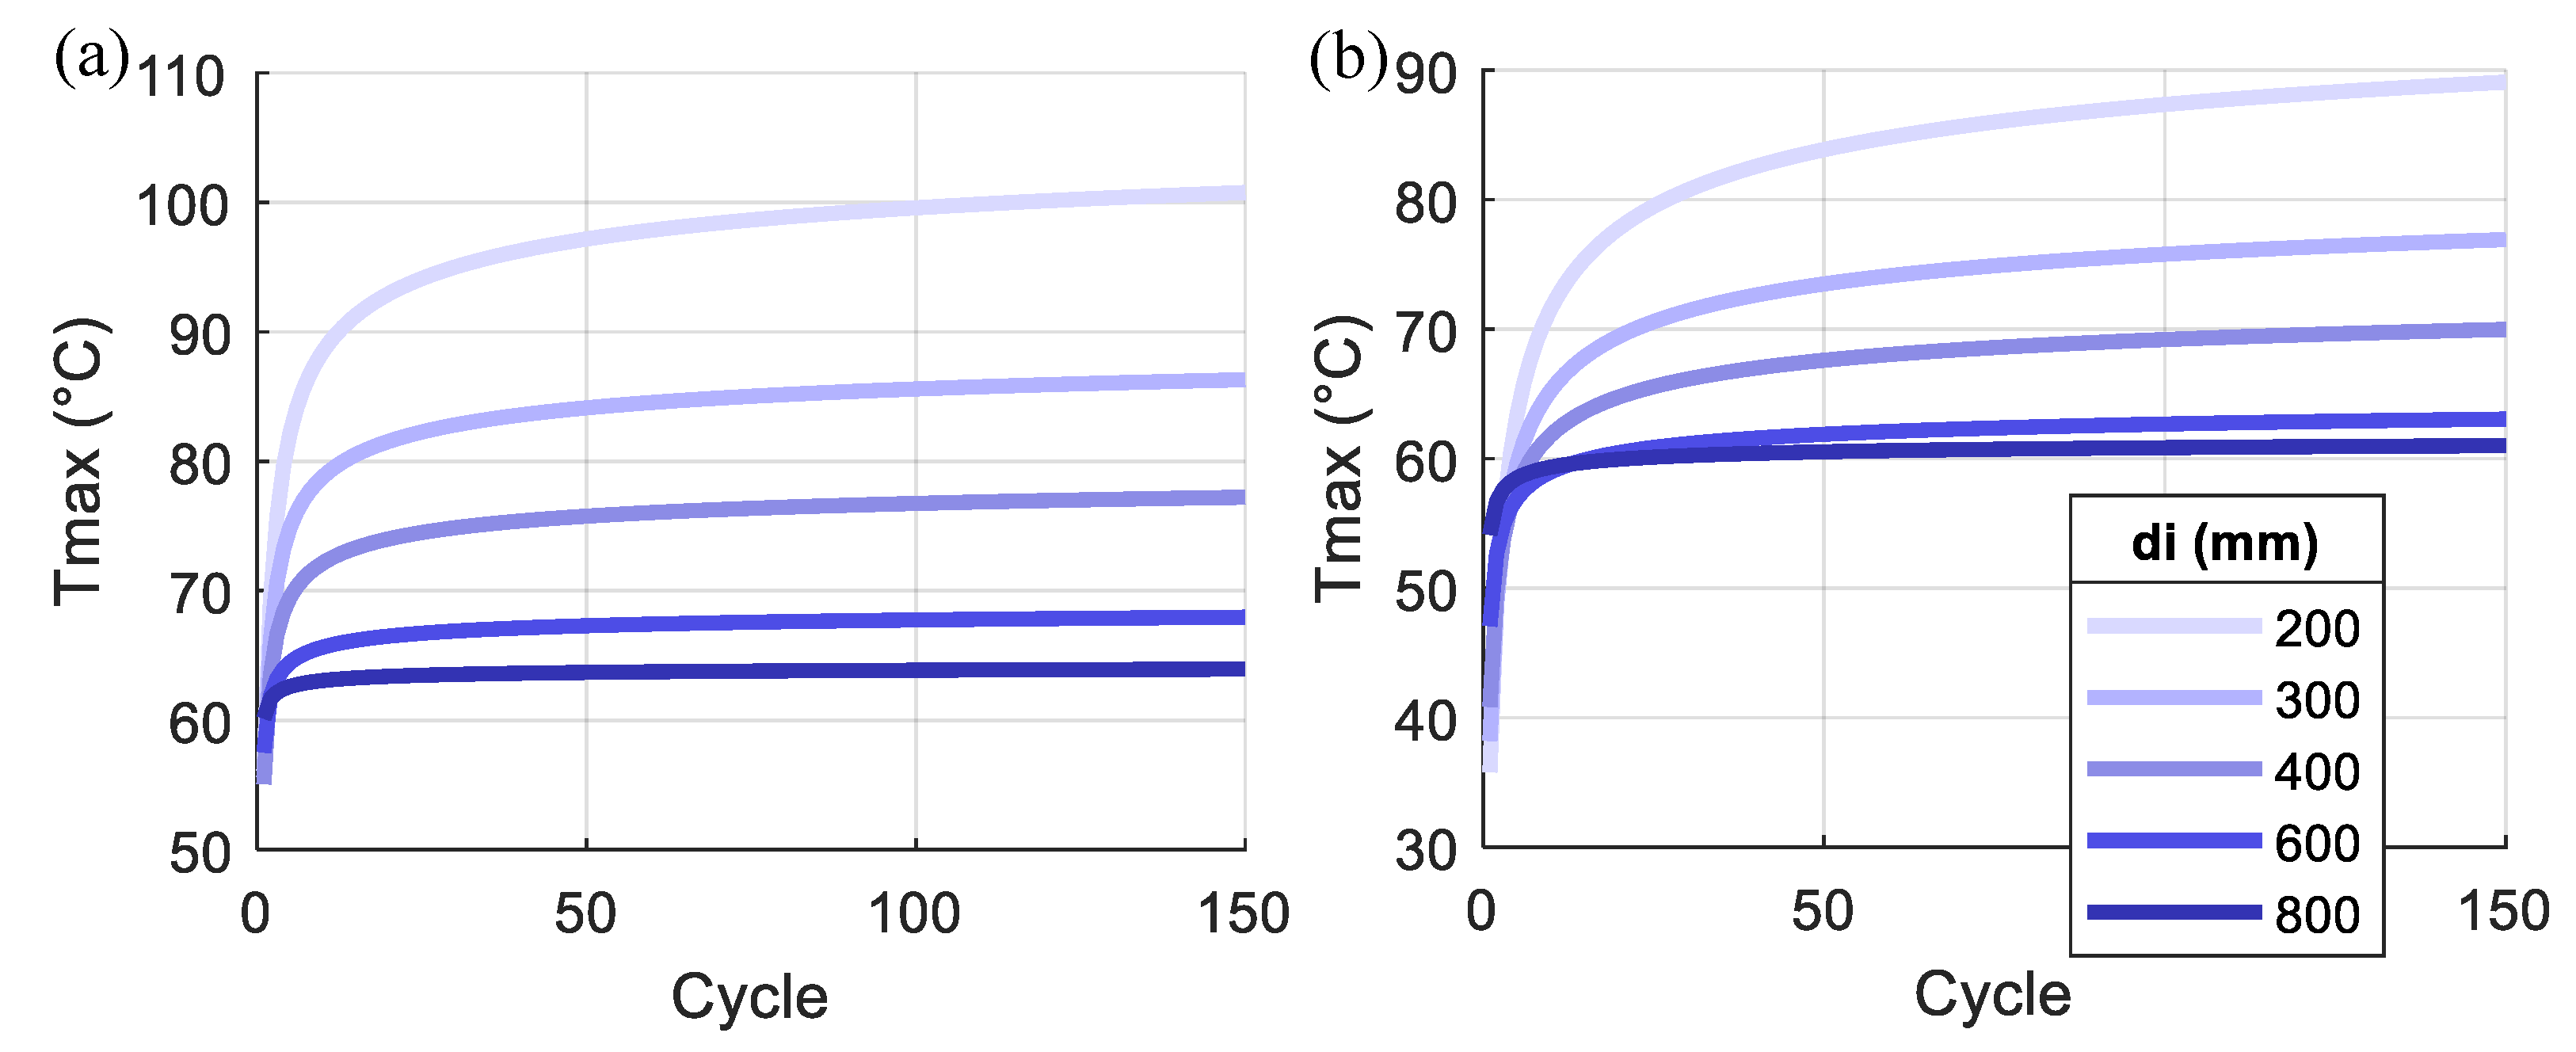
  • The temperature in the pile foundation and nearby soil gradually increases with cycles because of the cumulative effect of the residual temperature. As moving from the inner surface to the outer, the increase of temperature with cycles and the temperature variation within each cycle become smaller.
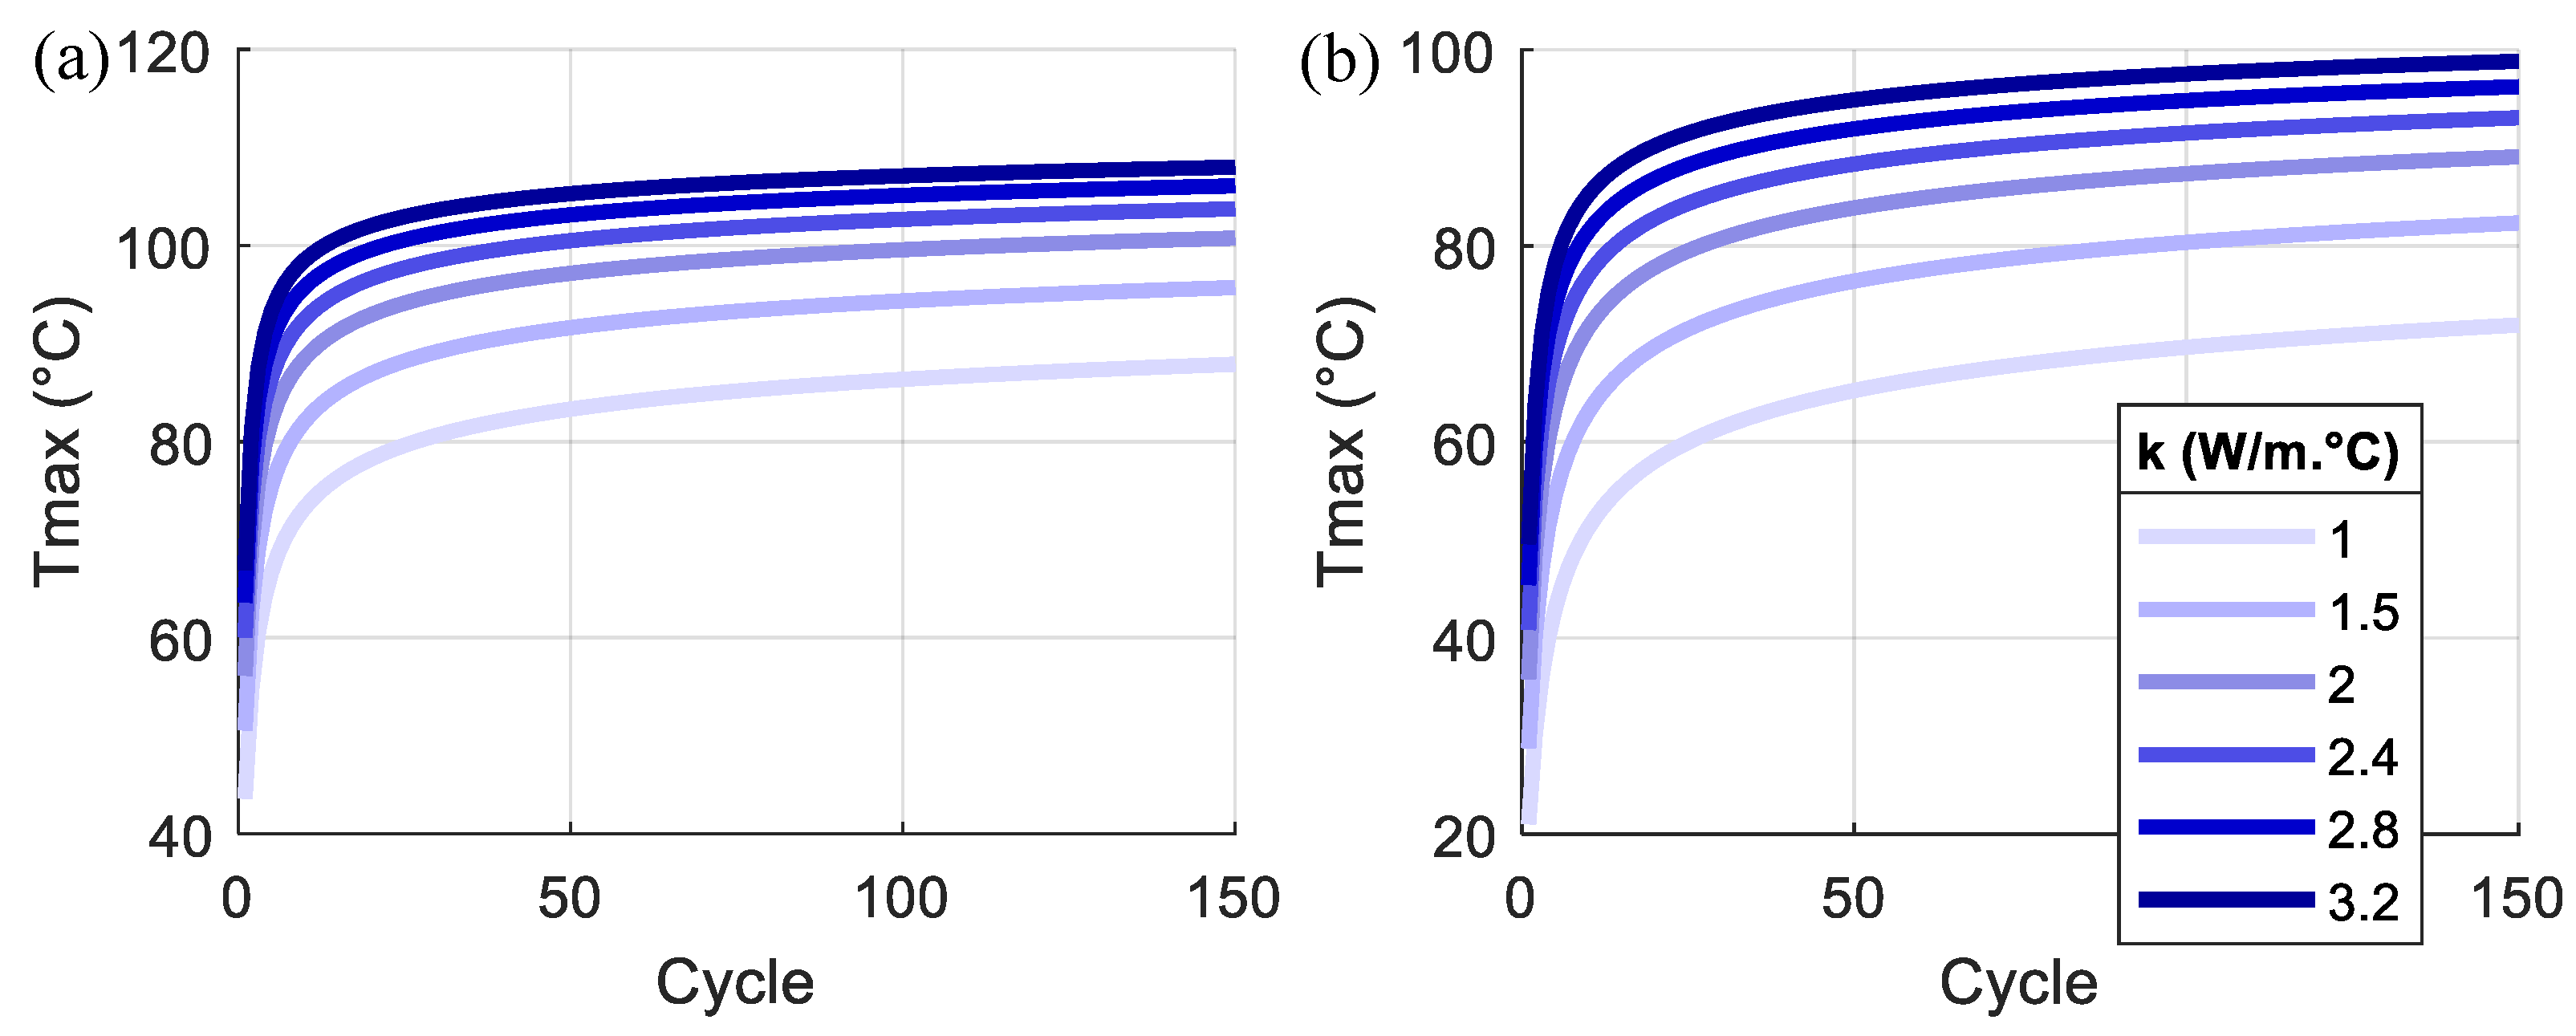
  • The maximum temperature in each loading cycle increases with the loading cycles but starts to be converged at a stable value after a sufficient amount of cycles. As moving from the center of the pile foundation, more cycles are needed for the maximum temperature to be converged.
Moreover, for the effects of the studied parameters (di, k, and c), the following conclusions can be drawn:
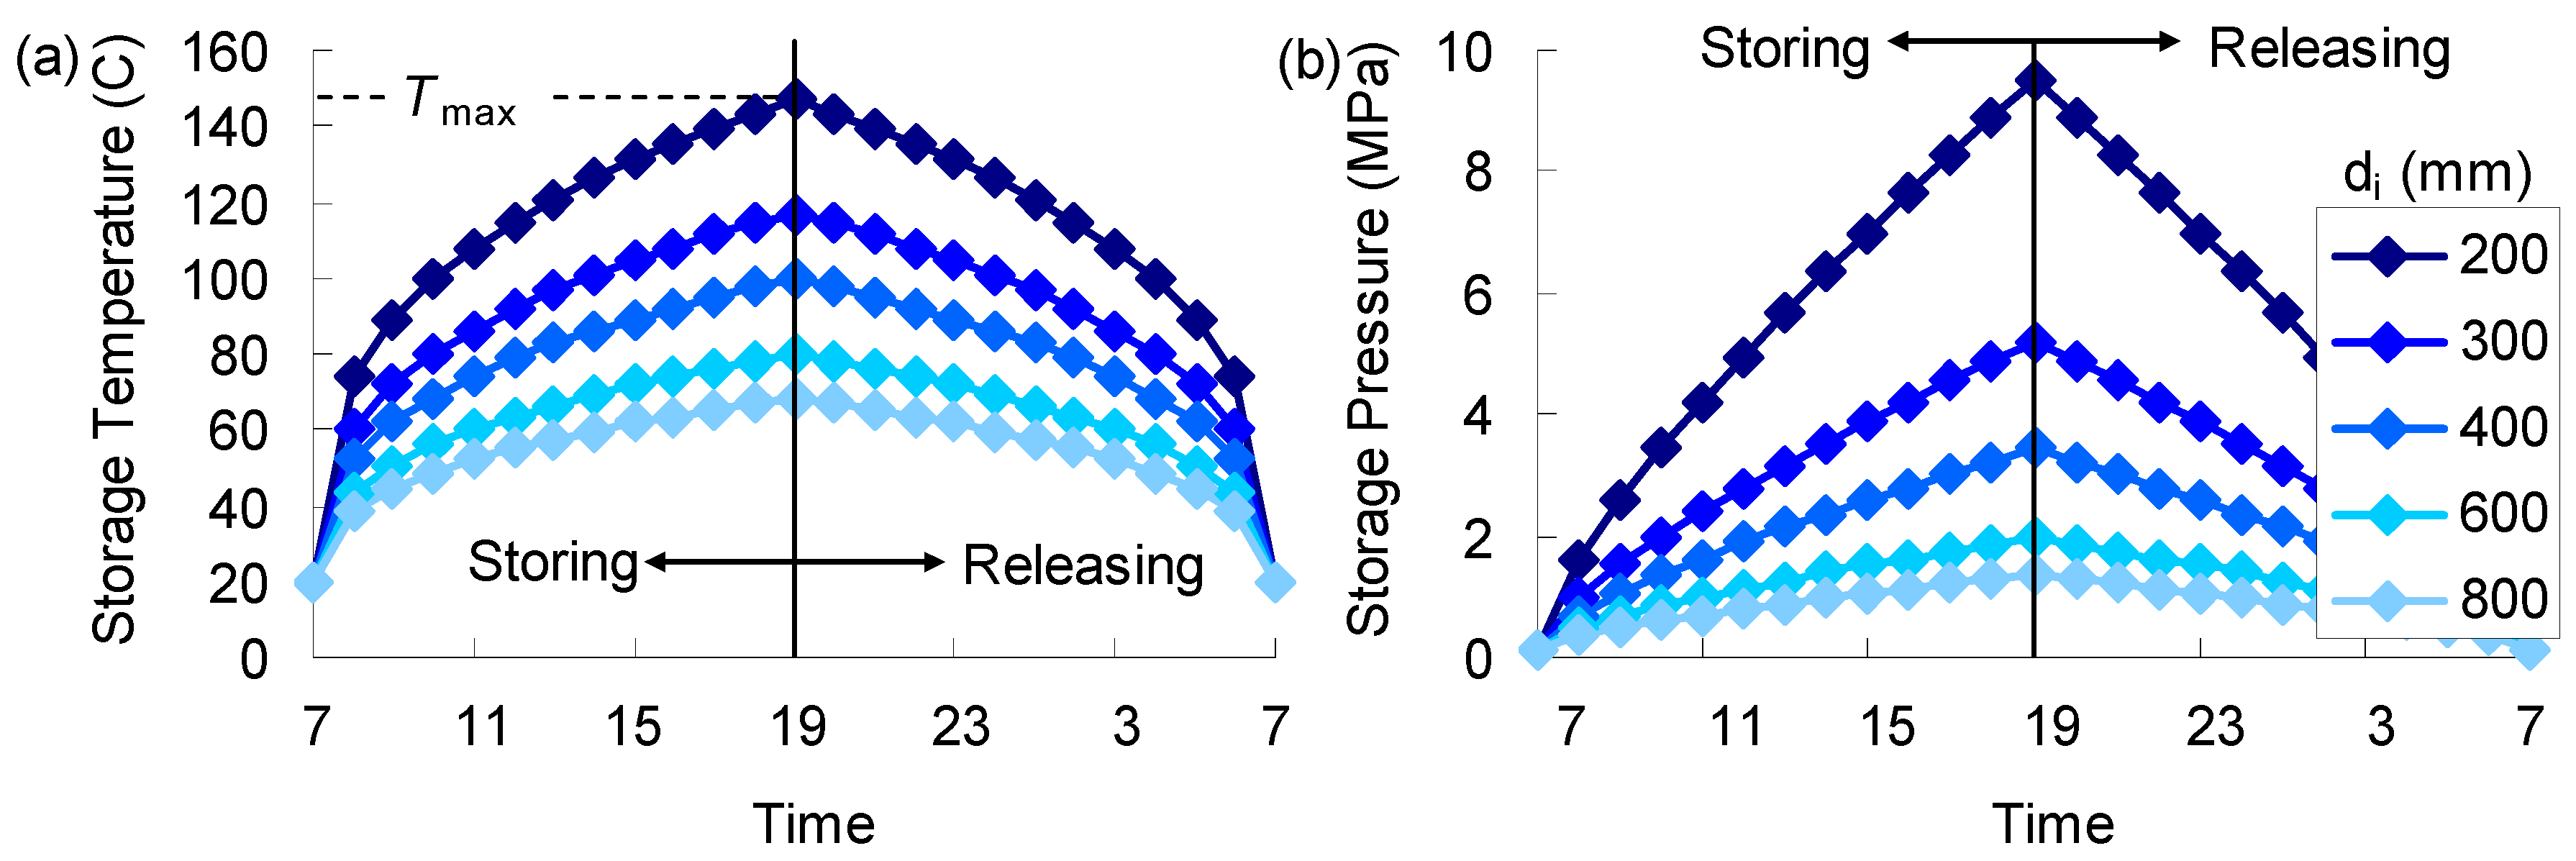
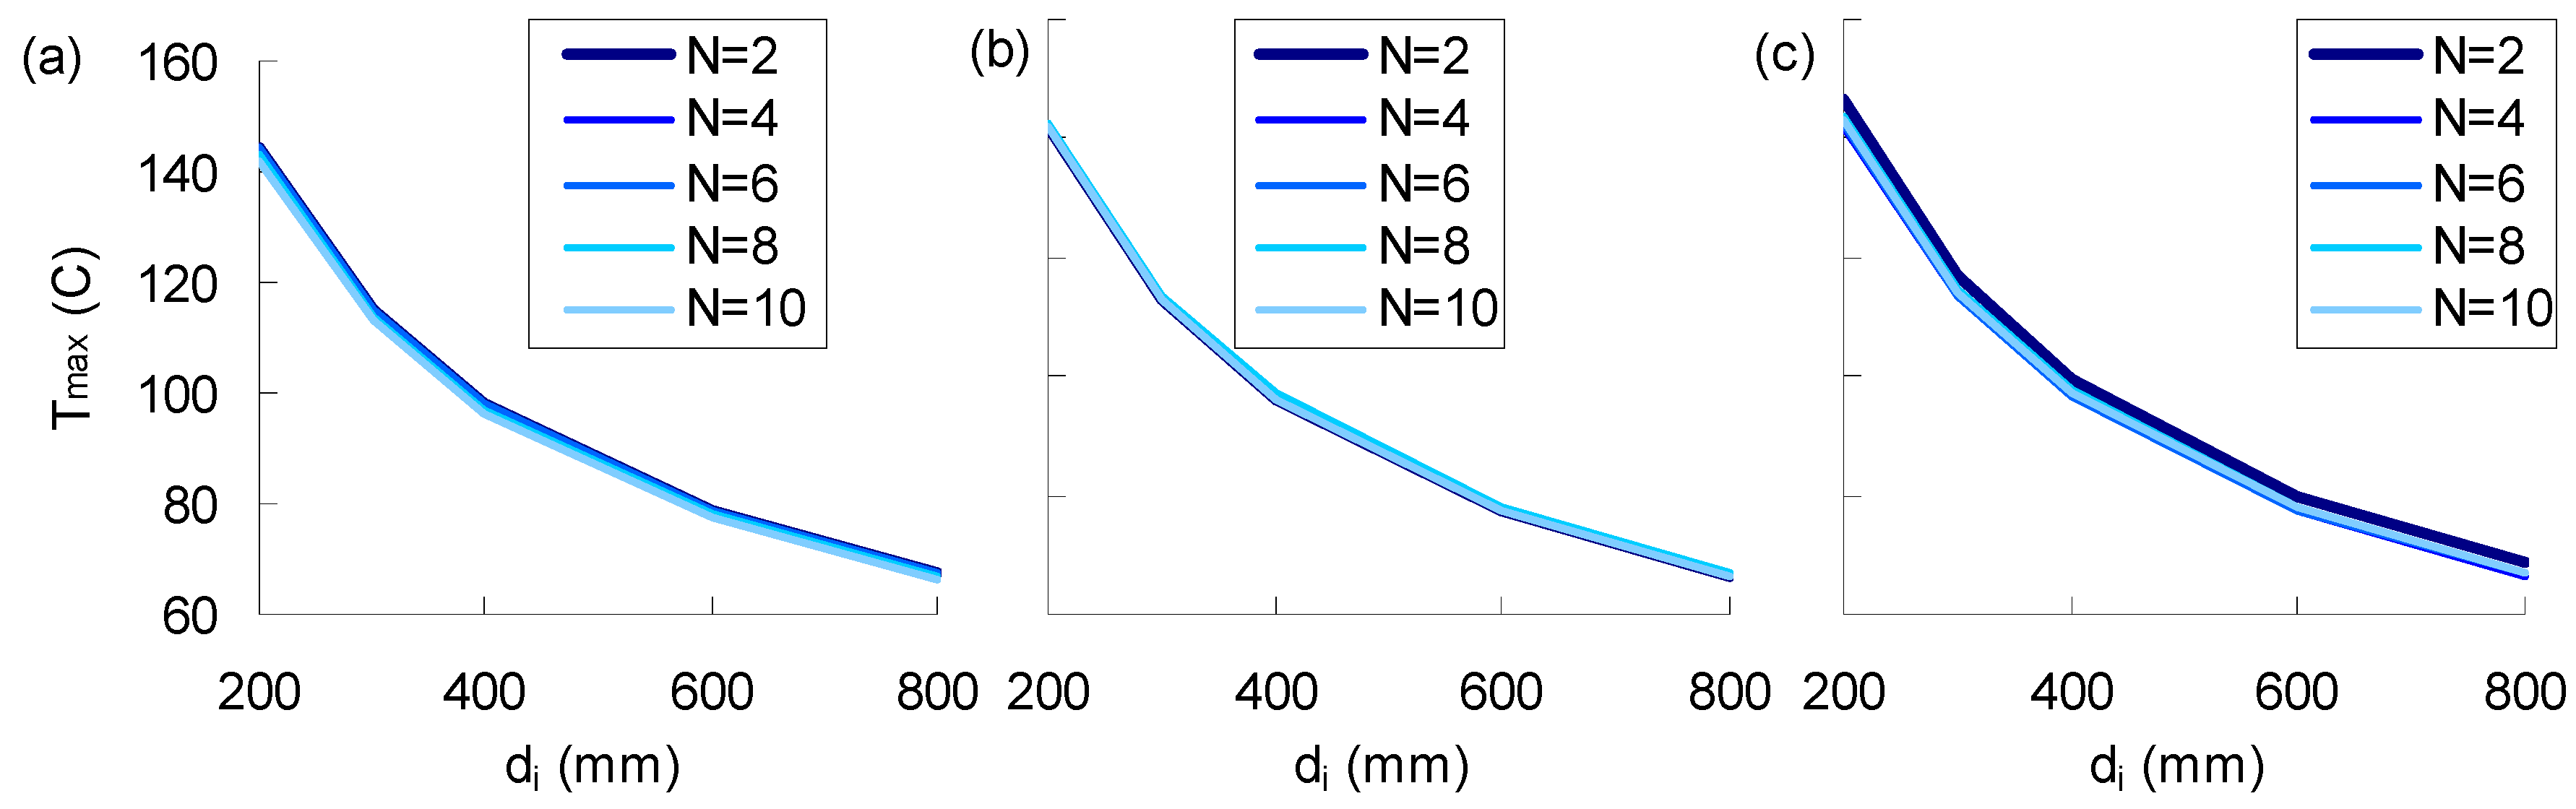
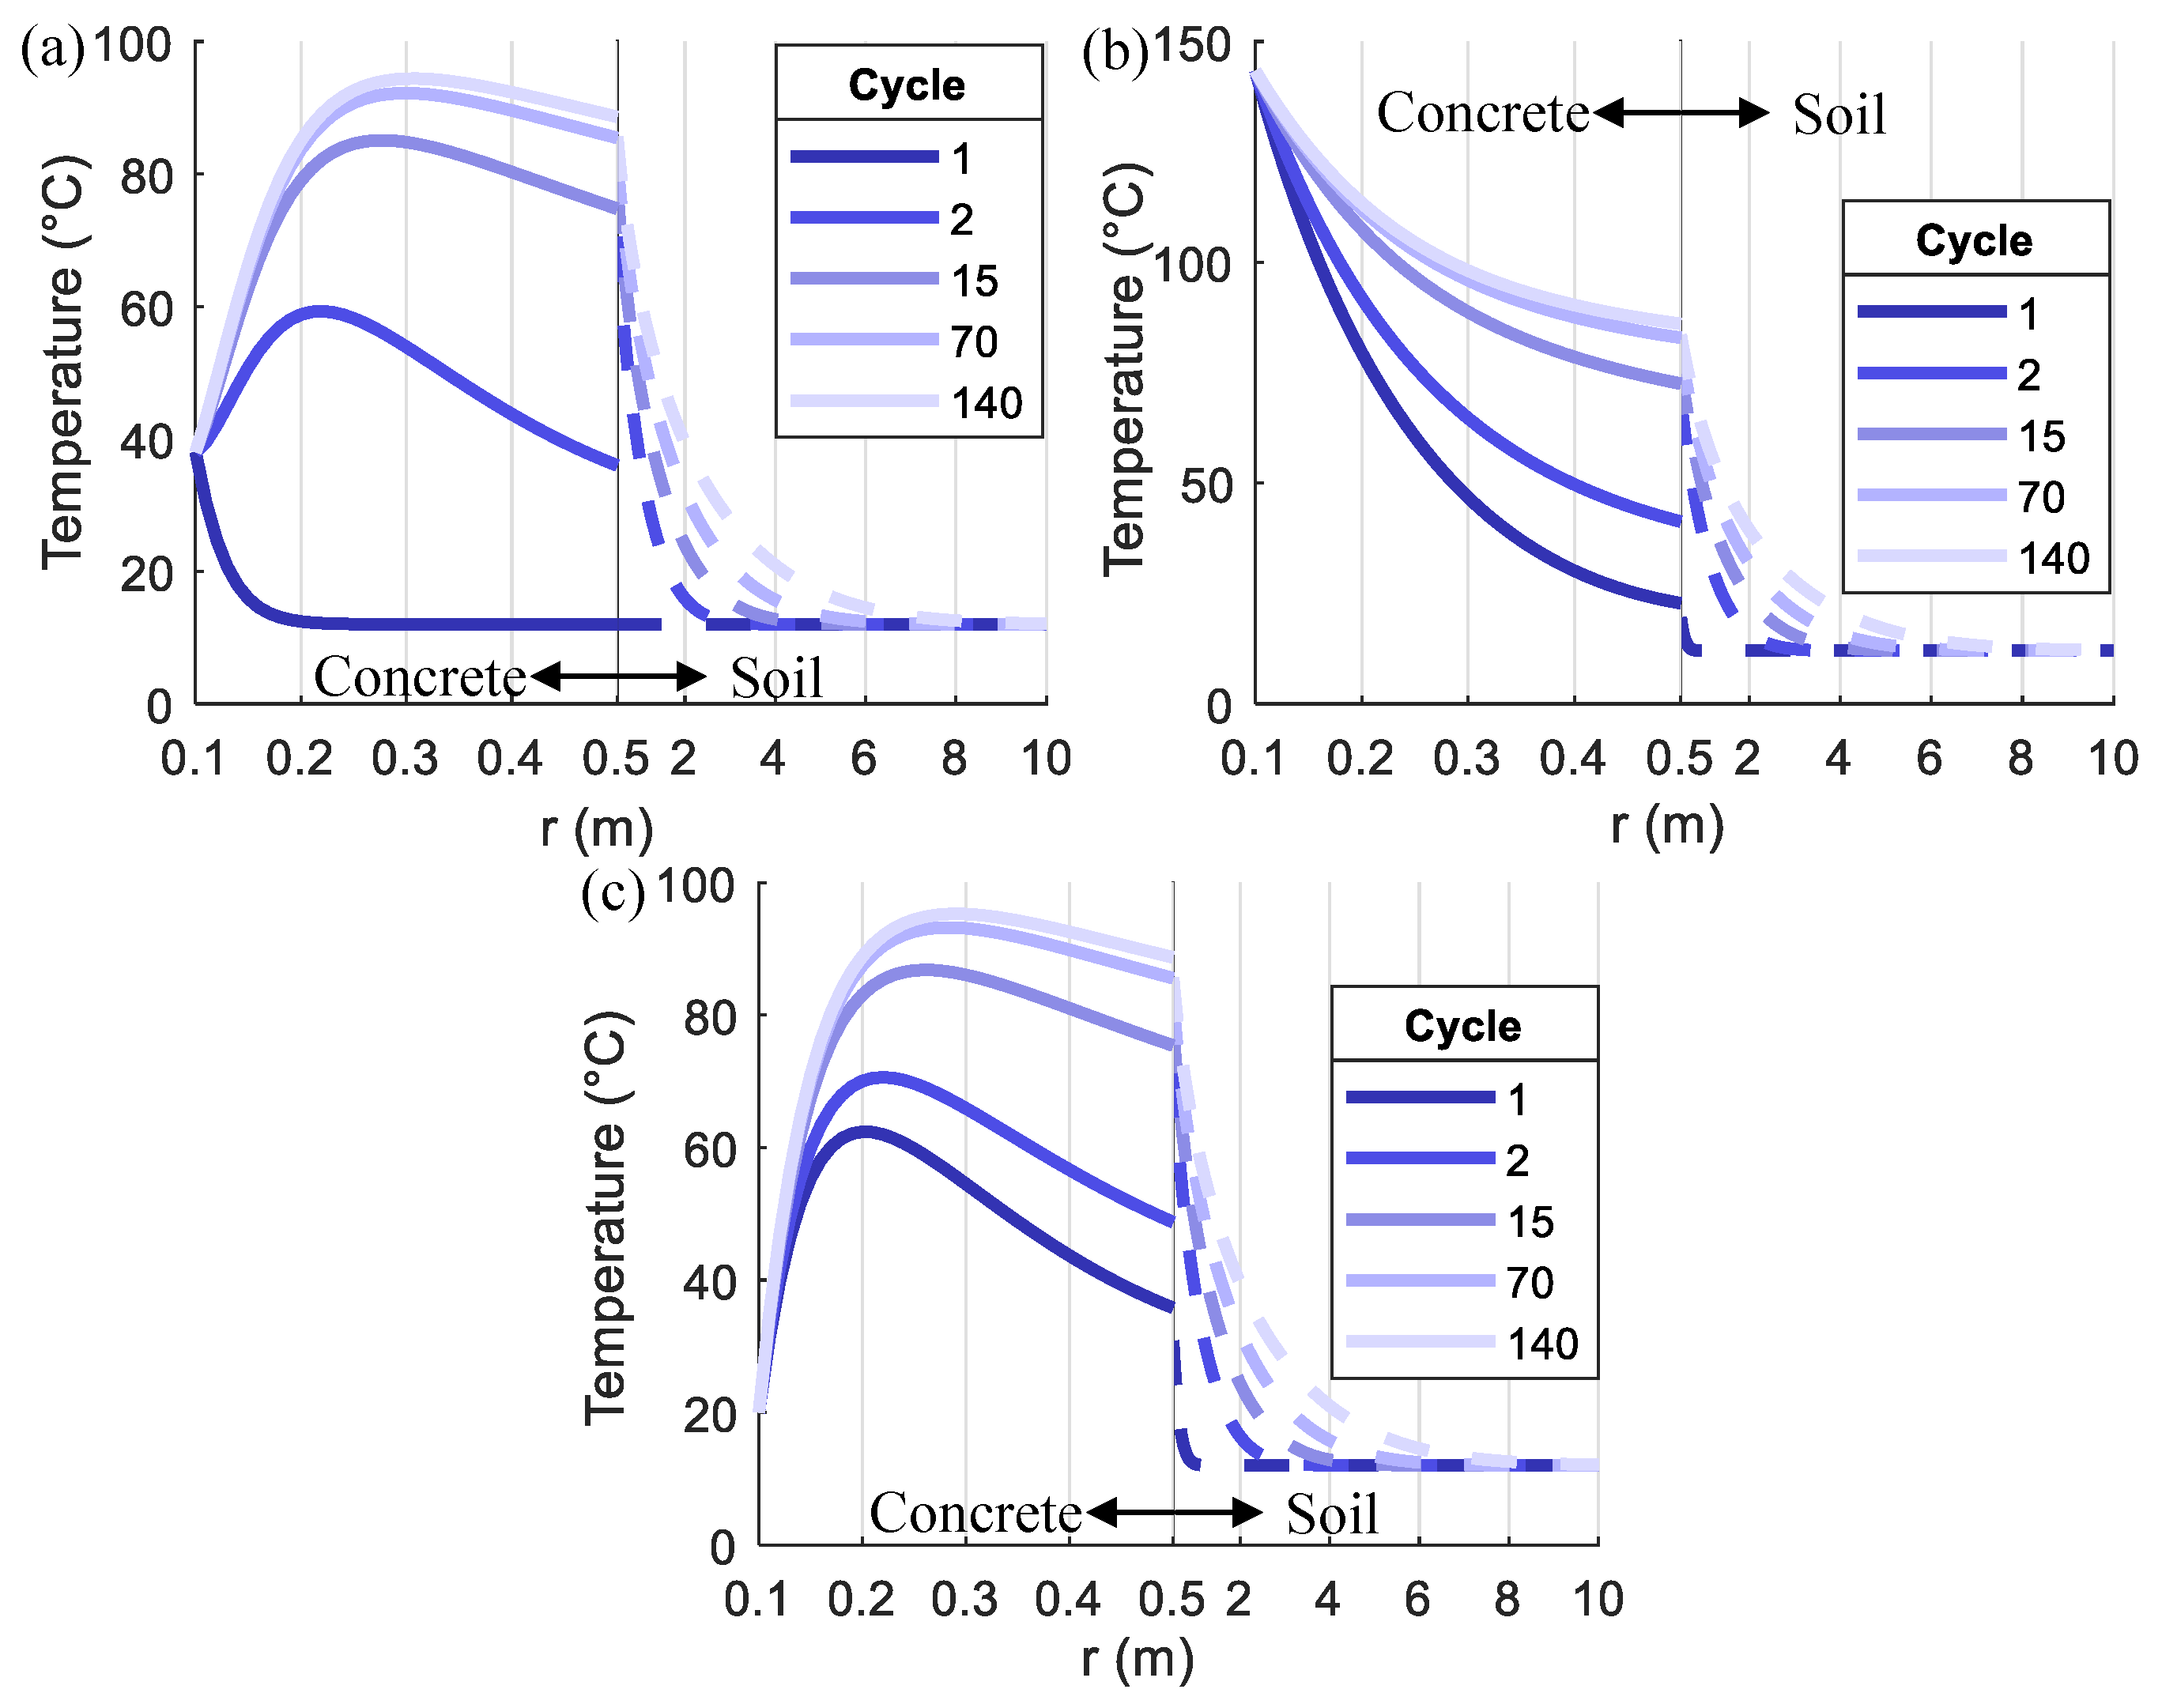
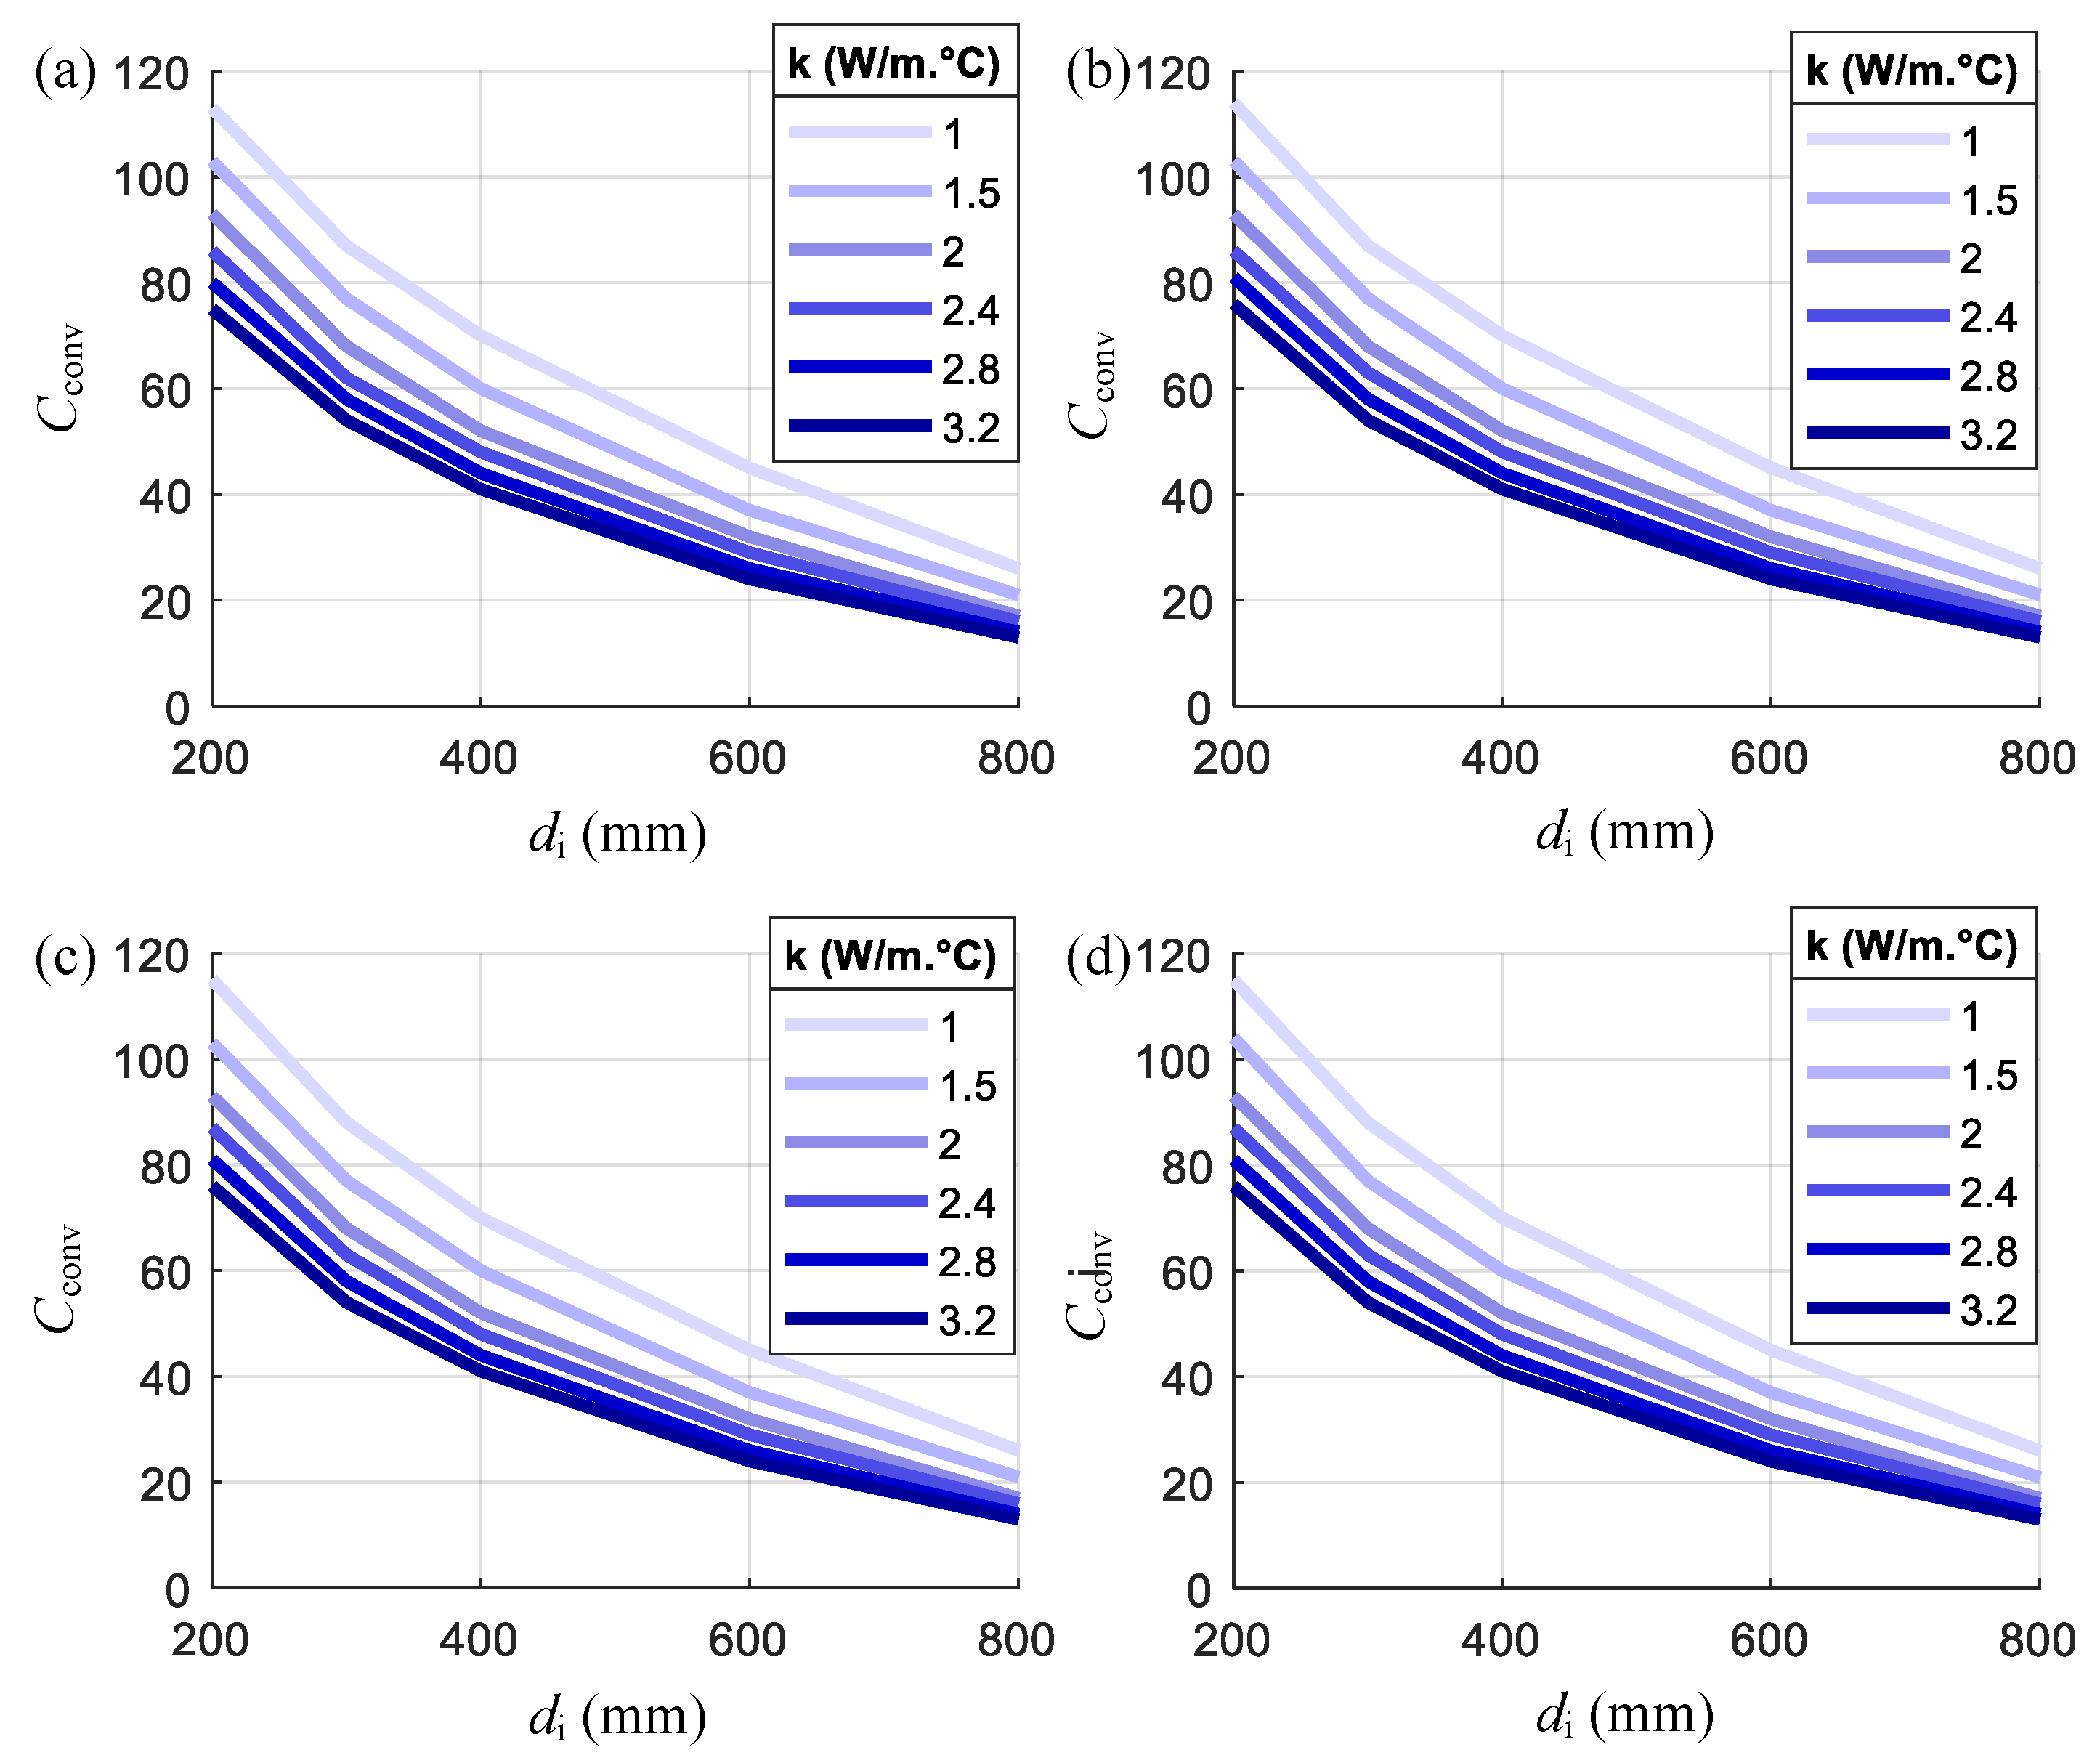
  • As the di increases, the section thickness of the pile foundation reduces, which requires less time for the heat transfer from the inner surface to the outer. Therefore, the temperature change in the larger di cases is more significant, but the temperature distribution along the radius direction is more uniform. The convergence of the temperature variation between cycles in the pile foundation is faster for the larger di cases.
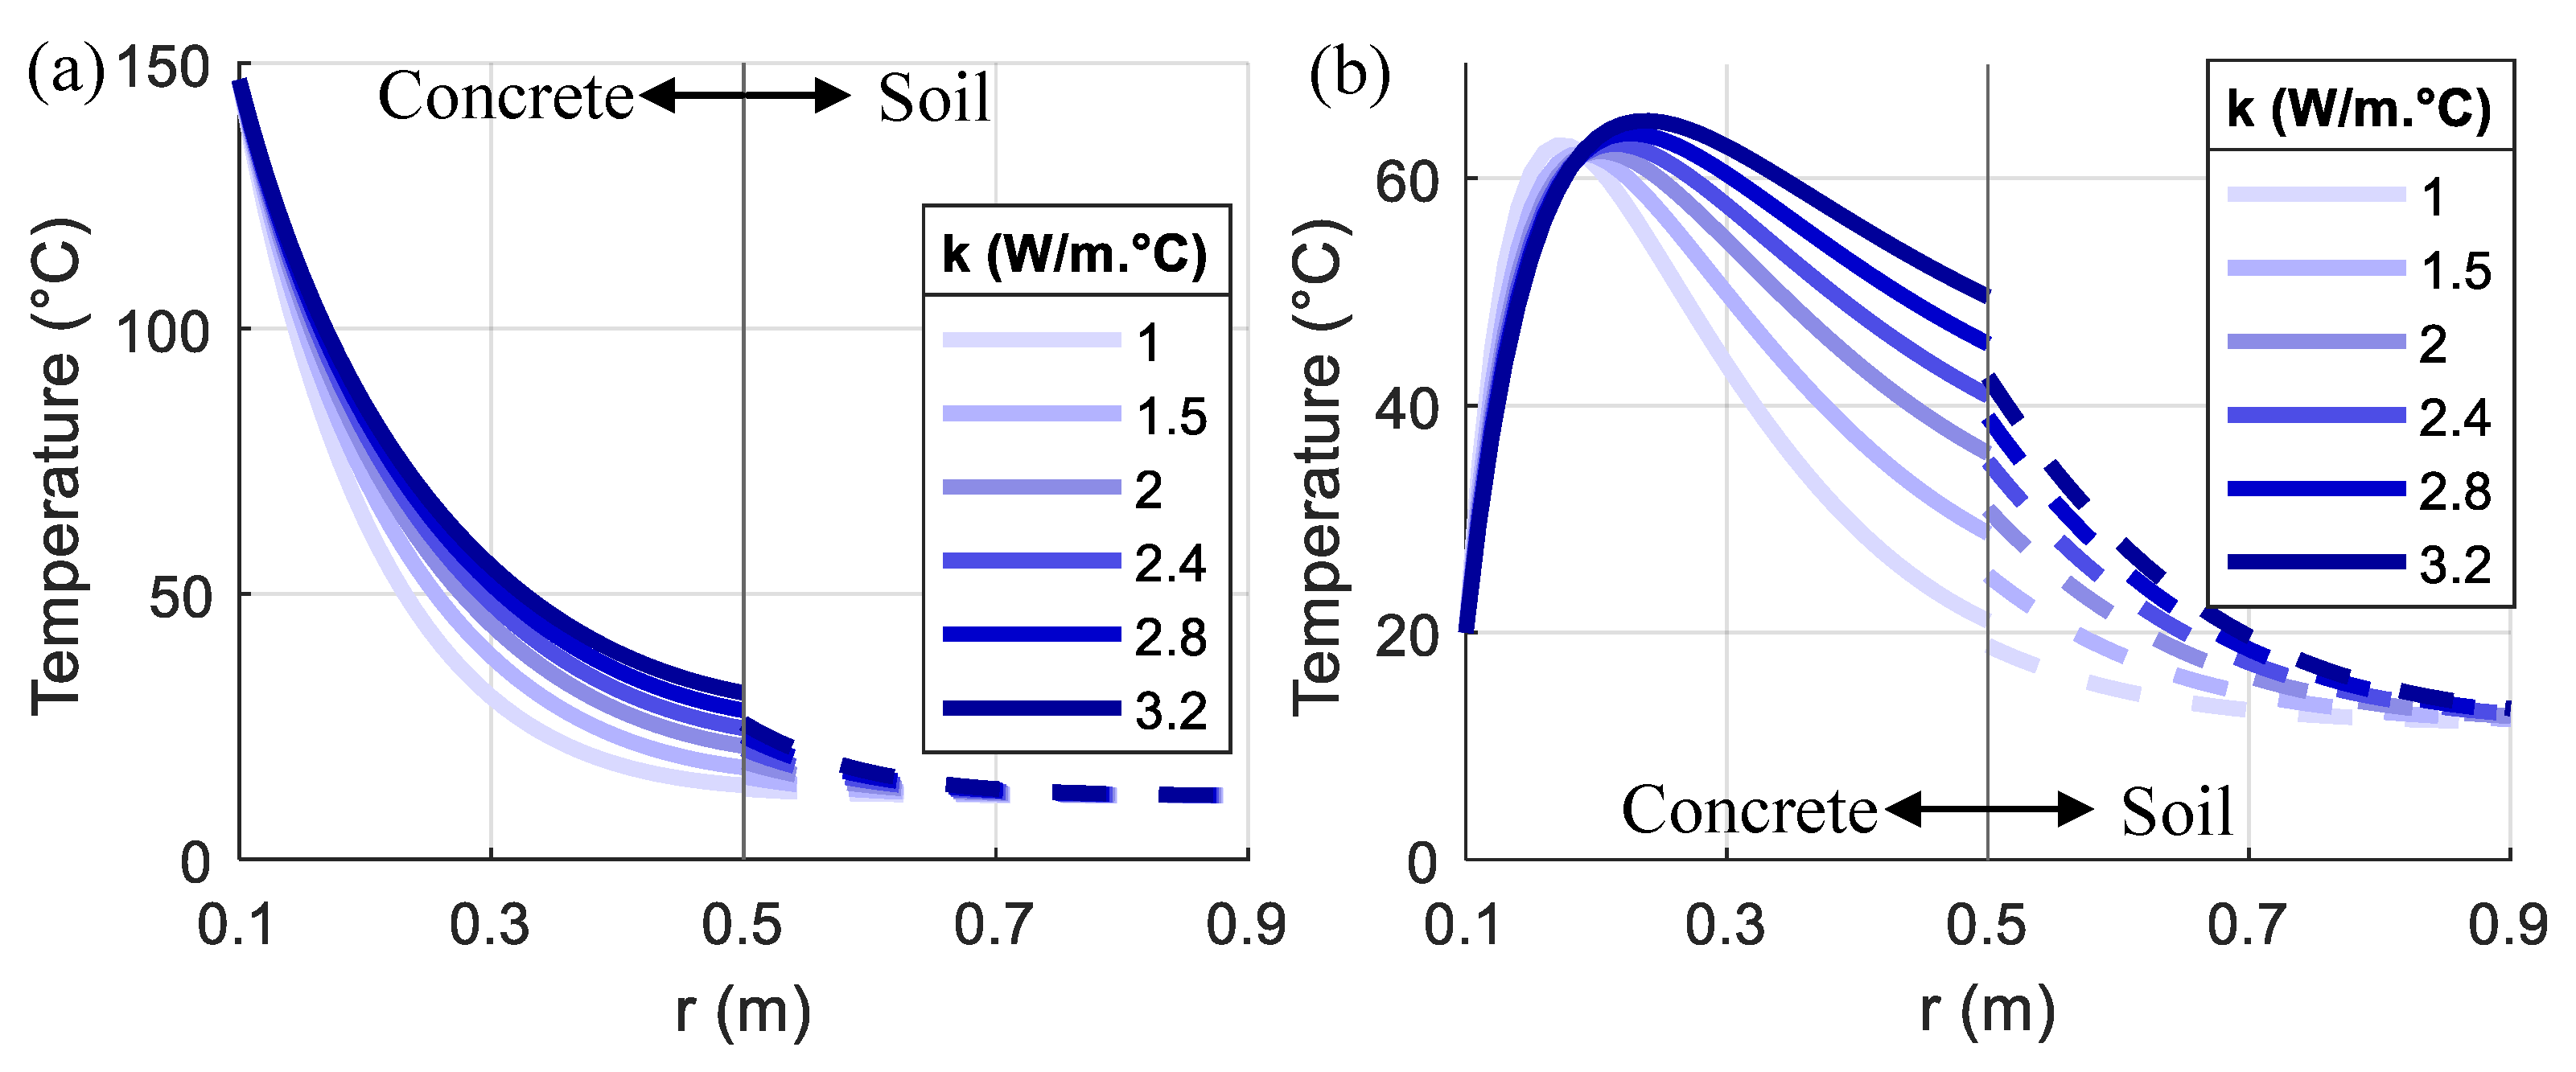
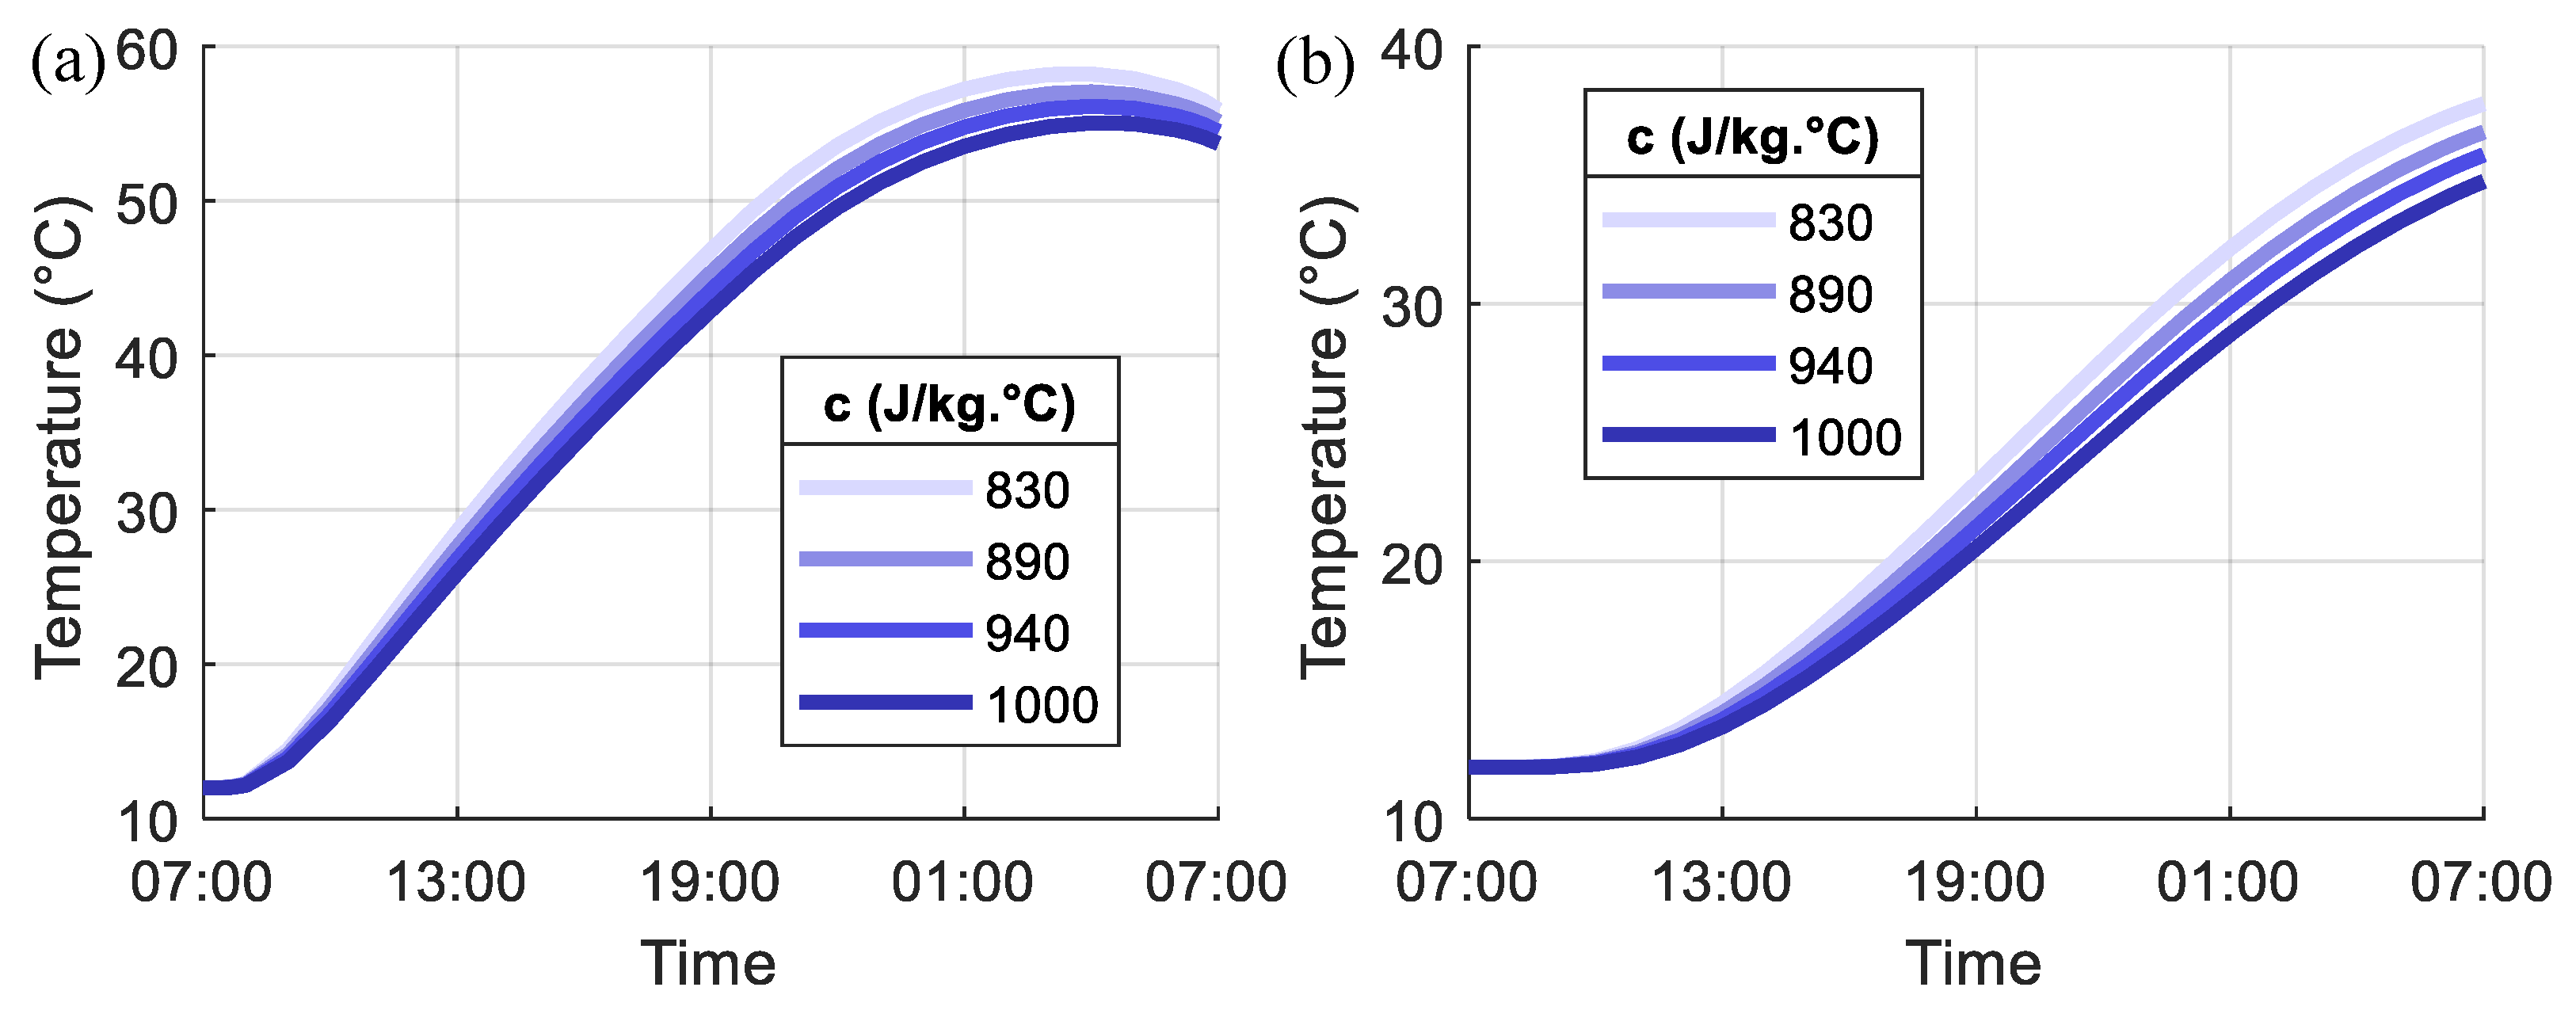
  • As the k increases and c reduces, the heat transfer speed increases, which results in larger temperature changes and higher temperatures in the concrete pile foundation. The convergence of the temperature variation between cycles in the pile foundation also becomes faster as k increases and c reduces. The effect of c is much smaller than that of k.
The research work presented in this paper initiates an investigation of the temperature distribution in the proposed energy storage pile foundation. The numerical model and simulation have several assumptions and limitations including: the cracking and nonlinearity of the concrete thermal properties were not considered; the heat transfer at the bottom surface of the pile foundation was ignored; the temperature in the heated compressed air was assumed to be uniform inside the pile foundation. Future experimental research is needed for verification purposes.

Author Contributions

Conceptualization, D.Z.; data curation, Z.M. and D.S.; formal analysis, Z.M. and D.S.; funding acquisition, D.Z. and J.R.K.; investigation, D.Z., Z.M., C.-S.S. and D.L.; methodology, D.Z., C.-S.S. and D.L.; project administration, J.R.K.; resources, C.-S.S., D.L. and J.R.K.; software, C.-S.S.; supervision, D.Z., C.-S.S., D.L. and J.R.K.; validation, Z.M. and D.S.; visualization, Z.M. and D.S.; writing—original draft, D.Z., Z.M. and D.S.; writing—review and editing, D.Z., C.-S.S., D.L. and J.R.K.

Funding

This research was supported by the Nazarbayev University Research Fund under Grant (#SOE2017001) “Development of a Renewable Energy Storage System using Reinforced Concrete Foundations”. The authors are grateful for this support. Any opinions, findings, and conclusions or recommendations expressed in this material are those of the author(s) and do not necessarily reflect the views of the Nazarbayev University.

Conflicts of Interest

The authors declare no conflict of interest.

References

  1. Hayter, S.; Kandt, A. Renewable Energy Applications for Existing Buildings (Technical Report NREL/CP-7A40-52172); National Renewable Energy Lab. (NREL): Golden, CO, USA, 2011. [Google Scholar]
  2. Rugolo, J.; Aziz, M. Electricity storage for intermittent renewable sources. Energy Environ. Sci. 2012, 5, 7151–7160. [Google Scholar] [CrossRef] [Green Version]
  3. Zhang, L.; Ahmari, S.; Sternberg, B.; Budhu, M. Feasibility study of compressed air energy storage using steel pipe piles. In GeoCongress; ASCE: Reston, WV, USA, 2012. [Google Scholar]
  4. Kim, S.; Ko, J.; Kim, S.; Soo, H.; Tummalapudi, M. Investigation of a small-scale compressed air energy storage pile as a foundation system. In Geotechnical Frontiers 2017: Geotechnical Materials, Modeling, and Testing; GSP 280; ASCE: Reston, VA, USA, 2017. [Google Scholar]
  5. Sabirova, A.; Zhang, D.; Kim, J.; Nguyen, M.; Shon, C. Development of a reinforced concrete foundation system for renewable energy storage. In Proceedings of the 8th Asian Young Geotechnical Engineering Conference, Astana, Kazakhstan, 5–7 August 2016. [Google Scholar]
  6. Tulebekova, S.; Saliyev, D.; Zhang, D.; Kim, J.; Karabay, A.; Turlybek, A.; Kazybayeva, L. Preliminary analytical study on the feasibility of using reinforced concrete pile foundations for renewable energy storage by compressed air energy storage technology. In IOP Conference Series: Materials Science and Engineering; IOP Publishing Ltd.: London, UK, 2017; p. 012023. [Google Scholar]
  7. Zhang, D.; Kim, J.; Tulebekova, S.; Saliyev, D.; Lee, D.H. Structural responses of reinforced concrete pile foundations subjected to pressures from compressed air for renewable energy storage. Int. J. Concr. Struct. Mater. 2018, 12, 74. [Google Scholar] [CrossRef]
  8. Tulebekova, S.; Zhang, D.; Lee, D.; Kim, J.; Barissov, T.; Tsoy, V. Nonlinear responses of energy storage pile foundations with fiber reinforced concrete. Struct. Eng. Mech. 2019, 71, 363–375. [Google Scholar]
  9. Bektimirova, U.; Shon, C.; Zhang, D.; Sharafutdinov, E.; Kim, J. Proportioning and characterization of reactive powder concrete for an energy storage pile application. Appl. Sci. Switz. 2018, 8, 2507. [Google Scholar] [CrossRef]
  10. Bektimirova, U.; Tleuken, A.; Satekenova, E.; Shon, C.; Zhang, D.; Kim, J. Preliminary experimental investigation on the strength and air permeability of reactive powder concrete. Mater. Sci. Forum 2017, 917, 321–328. [Google Scholar] [CrossRef]
  11. Ko, J.; Seo, H.; Kim, S.; Kim, S. Numerical analysis for mechanical behavior of pipe pile utilized for compressed air energy storage. In IFCEE 2018: Installation, Testing, and Analysis of Deep Foundations; GSP 294; ASCE: Reston, VA, USA, 2018. [Google Scholar]
  12. Agibayeva, A.; Ju, H.; Zhang, D.; Moon, S.W.; Kim, J.; Lee, D.H. Application of CFT pile foundation as an energy storage media. In Proceedings of the 2018 International Conference on Advances in Computational Design, Incheon, South Korea, 28–31 August 2018. [Google Scholar]
  13. Laloui, L.; Nuth, M.; Vulliet, L. Experimental and numerical investigations of the behaviour of heat exchanger pile. Int. J. Numer. Anal. Methods Geomech. 2016, 30, 763–781. [Google Scholar] [CrossRef]
  14. Bourne-Webb, P.; Amatya, B.; Soga, K. A framework for understanding energy pile behaviour. Proc. Inst. Civ. Eng. Geotech. Eng. 2013, 166, 170–177. [Google Scholar] [CrossRef]
  15. Faizal, M.; Bouazza, A.; McCartney, J.S.; Haberfield, C. Effects of cyclic temperature variations on thermal response of an energy pile under a residential building. J. Geotech. Geoenviron. Eng. 2019, 145, 04019066. [Google Scholar] [CrossRef]
  16. Murphy, K.D.; McCartney, J.S.; Henry, K.S. Evaluation of thermo-mechanical and thermal behavior of full-scale energy foundations. Acta Geotech. 2015, 10, 179–195. [Google Scholar] [CrossRef]
  17. Di Donna, A.; Loria, A.F.R.; Laloui, L. Numerical study of the response of a group of energy piles under different combinations of thermo-mechanical loads. Comput. Geotech. 2016, 72, 126–142. [Google Scholar] [CrossRef]
  18. Surayatriyastuti, M.; Mroueh, H.; Burlon, S. Numerical analysis of a thermo-active pile under cyclic thermal loads. In Proceedings of the European Geothermal Conference (EGC 2013), Pisa, Italy, 3–7 June 2013; pp. 1–8. [Google Scholar]
  19. Assunção, R.M. Thermal and Thermal-Mechanical Analysis of Thermo-Active Pile Foundations. Ph.D. Thesis, Instituto Superior Técnico, University of Lisbon, Lisbon, Portugal, 2014. [Google Scholar]
  20. Energy Storage Association, Compressed Air Energy Storage, 2019. Available online: http://energystorage.org/compressed-air-energy-storage-caes (accessed on 25 October 2019).
  21. Kodur, V. Properties of concrete at elevated temperatures. ISRN Civ. Eng. 2014, 1–15. [Google Scholar] [CrossRef]
  22. Zhu, H.; Wan, K.T.; Satekenova, E.; Zhang, D.; Leung, C.; Kim, J. Development of Lightweight Strain Hardening Cementitious Composite for Structural Retrofit and Energy Efficiency Improvement of Unreinforced Masonry Housings. Constr. Build. Mater. 2018, 167, 791–812. [Google Scholar] [CrossRef]
  23. Ulykbanov, A.; Sharafutdinov, E.; Chung, C.W.; Zhang, D.; Shon, C.S. Performance-based Model to Predict Thermal Conductivity of Non-Autoclaved Aerated Concrete through Linearization Approach. Constr. Build. Mater. 2019, 196, 555–563. [Google Scholar] [CrossRef]
  24. Shon, C.S.; Mukashev, T.; Lee, D.H.; Zhang, D.; Kim, J.R. Can Common Reed Become an Effective Construction Material? Physical, Mechanical, and Thermal Properties of Mortar Mixture Containing Common Reed Fiber. Sustainability 2019, 11, 903. [Google Scholar] [CrossRef]
  25. Eurocode 2: Design of Concrete Structures: British Standard; BSI: London, UK, 2014.
  26. Shin, K.Y.; Kim, S.B.; Kim, J.H.; Chung, M.; Jung, P.S. Thermo-physical properties and transient heat transfer of concrete at elevated temperatures. Nucl. Eng. Des. 2002, 212, 233–241. [Google Scholar] [CrossRef] [Green Version]
  27. Lie, T.T.; Kodur, V.K.R. Thermal and mechanical properties of steel-fibre-reinforced concrete at elevated temperatures. Can. J. Civ. Eng. 1996, 23, 511–517. [Google Scholar] [CrossRef]
  28. Zheng, W.; Luo, B.; Wang, Y. Microstructure and mechanical properties of RPC containing PP fibres at elevated temperatures. Mag. Concr. Res. 2014, 66, 397–408. [Google Scholar] [CrossRef]
  29. Ju, Y.; Liu, H.B.; Liu, J.H.; Tian, K.P.; Wei, S.; Hao, S. Investigation on thermophysical properties of reactive powder concrete. Sci. China Technol. Sci. 2011, 54, 3382–3403. [Google Scholar] [CrossRef]
  30. Kodur, V.; Khaliq, W. Effect of temperature on thermal properties of different types of high-strength concrete. J. Mater. Civ. Eng. 2011, 23, 793–801. [Google Scholar] [CrossRef]
  31. Wan, L.; Wendner, R.; Liang, B.; Cusatis, G. Analysis of the behavior of ultra high performance concrete at early age. Cem. Concr. Compos. 2016, 74, 120–135. [Google Scholar] [CrossRef] [Green Version]
  32. Kersten, M.S. Thermal Properties of Soils; Bulletin No. 28; University of Minnesota: Minneapolis, MN, USA, 1949. [Google Scholar]
  33. ASHRAE. ASHRAE Handbook—Fundamentals (SI), American Society of Heating, Refrigerating and Air-Conditioning; ASHRAE: Atlanta, GA, USA, 2009. [Google Scholar]
  34. Abu-Hamdeh, N.H. Thermal properties of soils as affected by density and water content. Biosyst. Eng. 2003, 86, 97–102. [Google Scholar] [CrossRef]
  35. Thomas, H.R.; Rees, S.W. Measured and simulated heat transfer to foundation soils. Géotechnique 2009, 59, 365–375. [Google Scholar] [CrossRef]
  36. Brandl, H. Energy foundations and other thermo active ground structures. Geotechnique 2016, 56, 81–122. [Google Scholar] [CrossRef]
Figure 1. Proposed energy storage foundation system (Modified from [5]).
Applsci 09 04776 g001
Figure 2. Thermodynamic processes of compressed air energy storage (CAES) (Modified from [7]).
Applsci 09 04776 g002
Figure 3. Available energy and volume for storage per each column: (a) total available storage energy for a single day; (b) volume for di = 200 mm; (c) volume for di = 800 mm (modified from [8]).
Applsci 09 04776 g003
Figure 4. One day energy storage cycle for a 2-story with 7 × 7 m column spacing: (a) temperature; (b) pressure.
Applsci 09 04776 g004
Figure 5. Maximum temperature in the stored compressed air: (a) 5 × 5 m column spacing; (b) 6 × 6 m column spacing; (c) 7 × 7 m column spacing.
Applsci 09 04776 g005
Figure 6. The 2D plane strain model.
Applsci 09 04776 g006
Figure 7. Temperature profile contour in the 1st loading cycle at: (a) 19:00; (b) 7:00 (end of the loading cycle).
Applsci 09 04776 g007
Figure 8. Temperature change in the first loading cycle: (a) concrete; (b) soil.
Applsci 09 04776 g008
Figure 9. Temperature distribution in the 1st loading cycle: (a) 7:00 to 19:00; (b) 19:00 to 7:00.
Applsci 09 04776 g009
Figure 10. Temperature history for the first 36 loading cycles in the: (a) concrete; (b) soil.
Applsci 09 04776 g010
Figure 11. Maximum temperature of each loading cycle in the: (a) concrete; (b) soil.
Applsci 09 04776 g011
Figure 12. Temperature distribution in different loading cycles at: (a) 7:20; (b) 19:00; (c) 7:00.
Applsci 09 04776 g012
Figure 13. Temperature change in the first loading cycle for different di at: (a) the inner surface of the pile section; (b) the midpoint of the pile section; (c) the outer surface of the pile section.
Applsci 09 04776 g013
Figure 14. Temperature distribution in the first loading cycle for different di at: (a) 19:00; (b) 7:00 (end of the loading cycle).
Applsci 09 04776 g014
Figure 15. Maximum temperature in each loading cycle for different di at: (a) the midpoint of the pile section; (b) the outer surface of the pile section.
Applsci 09 04776 g015
Figure 16. Temperature change in the first loading cycle for different k at: (a) the midpoint of the pile section; (b) the outer surface of the pile section.
Applsci 09 04776 g016
Figure 17. Temperature distribution in the first loading cycle for different k at: (a) 19:00; (b) 7:00 (end of the loading cycle).
Applsci 09 04776 g017
Figure 18. Maximum temperature in each loading cycle for different k at: (a) the midpoint of the pile section; (b) the outer surface of the pile section.
Applsci 09 04776 g018
Figure 19. Temperature change in the first loading cycle for different c at: (a) the midpoint of the pile section; (b) the outer surface of the pile section.
Applsci 09 04776 g019
Figure 20. Cconv for different c: (a) 830 J/kg·°C; (b) 890 J/kg·°C; (c) 940 J/kg·°C; (d) 1000 J/kg·°C.
Applsci 09 04776 g020
Table 1. Study parameters.
Thermal Conductivity (k)Specific Heat Capacity (c)Inner Diameter (di)
[W/m·°C][J/kg·°C][mm]
1.0830200
1.5890300
2.0940400
2.41000600
2.8-800
3.2--

