Abstract
This study aimed to investigate the potential use of carbon nanotubes (CNTs), which are an innovative construction material preferred by many researchers. Long-term microstructure enhancement and on-site application are major reasons to conduct research on CNT-cement composites; thus, a study on mechanical properties as well as the thermal conductivity of CNT-cement composites was carried out. As the CNT content increased, the thermal conductivity of CNT-cement composites was also enhanced. In addition, a couple of microstructure analyses such as isothermal calorimetry, thermal gravimetric analysis and SEM-EDS (Scanning Electron Microscope-Energy Dispersive X-ray Spectroscopy) for observing hydration reaction rate and types of hydration products were conducted to establish the advantage of CNT use in cement composites. Strength development of CNT-cement composites at early ages was slow, although eventually CNTs containing water developed equivalent level of strengths at last as internal curing effects.
1. Introduction
Cement, the major component for concrete, consists of calcium silicates (C3S, C2S), calcium aluminate (C3A), and calcium alumino-ferrite (C4AF). The cement compounds usually react with water, in a process called cement hydration, to produce cement hydrates such as calcium silicate hydrate (C-S-H), and calcium hydroxide (Ca(OH)2). The mechanical properties of microstructures with strong bonding between hydration products can be enhanced as time progresses. In the last several decades, various methods to improve strength and durability of concrete have been examined by many researchers, such as the use of fly ash (FA) or ground granulated blast-furnace slag (GGBFS)—by-products from the fossil-fuel power and iron industry—and the use of mineral additives such as silica fumes [1,2,3].
Recently, the additions of carbon nanotubes (CNTs) or graphene to cement composites or concrete have been shown to improve the mechanical properties and durability of concrete as well as its electrical and thermal conductivity. Li et al. [4] and Konsta-Gdoutos et al. [5] reported that the addition of CNTs improved the early age strength of concrete, and CNTs with a large surface area caused the quick formation of cement hydrates and an increase in the ratio of the C-S-H gel. A total of 0.5% of CNT addition enhanced the compressive strength of concrete by 26%. Kang et al. [6] improved the strength by adding 0.1% CNTs to mixtures of cement and silica fume. Kim et al. [7] focused on the thermal conductivity of CNT-embedded cementitious composites. Choi et al. [8] reported that 1% of CNT addition enhanced the compressive strength by more than 50% compared to ordinary Portland cement (OPC).
In order to develop surface treatment of CNTs for better dispersion [9,10,11], many researchers conducted researches on CNT surface treatment. Pavese et al. [12] worked for the evaluation on wettability before and after oxidation treatment in cement composites. Most research on CNT addition has been conducted to reveal the mechanical properties as well as the microstructures of CNT-cement composites [13,14,15,16]. In addition, several studies have been conducted on the durability of CNT-cement mortars [17,18].
In this study, the mechanical properties such as the compressive strength and flexural strength were tested with respect to the proportion of multi-walled CNTs (MWCNTs) in cement composites. Micro-hydration heat analysis was conducted to evaluate the effects of CNT content on the released cement hydration heat by isothermal calorimetry. Scanning electron microscopy was used to observe CNT distribution and types of hydration products inside the composite pastes. Thermal gravimetric analysis was used to observe the effects of CNT addition on the change in hydration products such as calcium hydroxide and calcium carbonates. Finally, thermal conductivities of CNT-cement composites were measured to investigate the heat transfer capacity. The amount of heat generated between two stainless-steel meshes in the CNT-cement composites was measured to determine the optimal amount of CNT content in the composites.
2. Materials and Methods
2.1. Materials
In order to evaluate the effects of MWCNT additions on the chemical and mechanical properties of cement paste and mortar, 2% concentrated MWCNT solution, which evenly disperses in solutions with high-range water reducer, was used. In the experiment, water was used as the main solvent of the MWCNT solution, with a dispersing agent for effective MWCNT dispersion according to the manufacturer, Ditto Technology from South Korea. The viscosity of the MWCNT solution was 9.0 mPa·s, measured by Brookfield DV-II using an S-18 spindle at a speed of 100 RPM.
The MWCNT solution was placed in an oven at 105 °C to evaporate the water and obtain the image of MWCNT strands using SEM, as shown in Figure 1. Average diameter and length of the MWCNT strands were 20 nm and 1.5 μm, respectively.
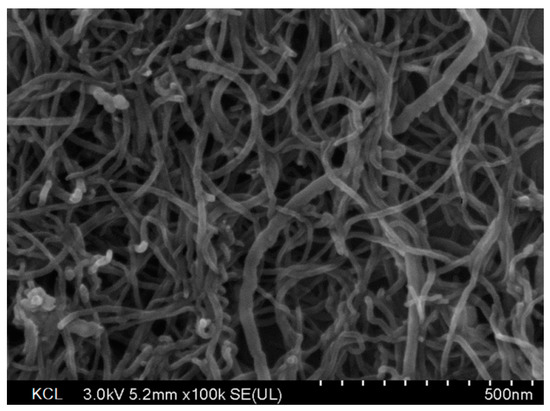
Figure 1.
Scanning Electron Microscopy (SEM) image of the bulk dry multi-walled carbon nanotubes (MWCNTs).
A Blaine surface area of 358 m2/kg and OPC density of 3.15 kg/m3 were used in the experiment. A Bogue calculation of the OPC determined the composition to be 44.7% C3S, 25.0% C2S, 5.0% C3A, and 11.9% of C4AF by mass. The FA used was produced in South Korea, and its fineness and density were 410 m2/kg and 2.29 kg/m3, respectively. The chemical and physical properties of the binder materials are provided in Table 1 and Figure 2.

Table 1.
Chemical and physical properties of raw materials used.
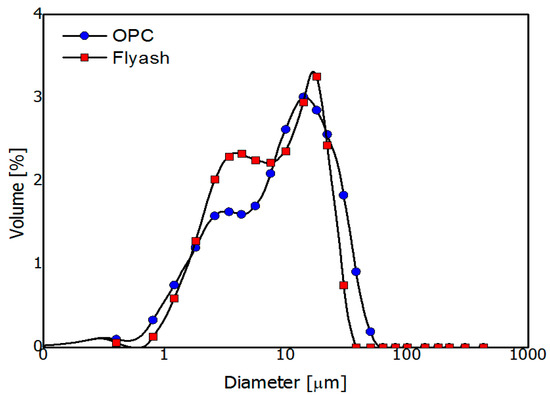
Figure 2.
Particle size distribution of the ordinary Portland cement and fly ash.
2.2. Mix Proportions
The mix proportions are provided in Table 2. The binders used consisted of 80% OPC and 20% FA. Poly-carboxylate based superplasticizer, with a binder ratio of up to 0.4% by weight, was utilized to improve the workability of the cement paste and mortar specimens due to the low water-to-binder ratio (0.28).
Table 2.
Mix proportions of paste and mortar samples containing multi-walled carbon nanotubes (MWCNTs).
The proportion of binder to aggregate was 0.5 for the mortar mixtures. The aggregate used in this study, ISO standard sand, were natural and fine, and consisted of round particles with more than 98% silica contents. As shown in Table 2, the paste mixtures were named as “PC-” with various amounts of MWCNT contents, ranging from 0 to 0.5% to binder mass. “PC00” is the paste label of OPC and FA without MWCNT, and “PC05” indicates 0.5 mass% of MWCNT were added in binders to cast paste specimens for the experiments. In order for water-to-binder ratio to be 0.28, extra water was added in the mixture. This is because MWCNT solution contained 2 wt% of solid contents. The “MC-” mixtures were identical with the “PC-” mixtures, except for the additions of ISO sand.
The mixing procedures for the production of paste and mortar specimens were similar to that specified by ISO 679. All binders were placed and pre-mixed in a 5-L bowl for 30 s with the automatic mortar mixer. Then, MWCNT solution and additional water were applied and mixed in the bowl for an additional 30 s at a low speed, 140 RPM for rotating and 65 RPM for revolving.
Subsequently, 120 s of high-speed mixing, 285 RPM for rotating and 125 RPM for revolving, was performed to produce paste specimens for microstructure analysis. In order to evaluate mechanical properties, durability, and thermal conductivity of the mixtures, ISO sand was added to the fresh paste specimens by mixing at high speed for another 120 seconds.
2.3. Test Methods
Compressive and flexural strength tests were conducted according to ISO 679 using three prismatic specimens with dimensions of 40 mm × 40 mm × 160 mm [19]. After 24 h of curing in a chamber at (21 ± 2) °C and (92 ± 5)% R.H., all specimens were demolded and placed in water containers at (21 ± 2) °C. The strength tests were performed at the ages of 3, 7, 28, 56, and 91 days to observe enhanced strength development.
The hydration heat flow and cumulative heat generated from all paste mixtures containing MWCNT were measured using a TAM-Air isothermal calorimeter. The calorimeter, which was twin-type (sample and reference) and designed to use 20 mL glass ampoules, was capable of measuring eight samples simultaneously. Approximately 4.5 g of paste mixtures were filled in the ampoules, measured on a balance, and placed into the calorimeter. The heat flow was recorded for 7 days and the calorimeter was kept at a constant temperature of (23 ± 1) °C during the experiment.
For SEM image analyses, the samples at 28 days were crushed and dried for 24 h at 40 °C. The samples were carbon-coated and investigated under high vacuum conditions in a Tescan Mira LMH microscope for SEM-EDS analysis. An EDS detector was used to determine the elemental composition of the samples (Quantax EDS, Bruker) with an active analysis area of 30 mm2. The resolution of the equipment was 1 nm per 30 kilo-volts to detect nano-materials in the cement composites.
Mortar specimens were cast in 50 mm-sized cubic molds, in which two sheets of stainless-steel (SS) wire mesh, used as electrodes, were embedded. The SS wire meshes were 45 mm wide and 70 mm high, rectangular in shape, and designed for heat generation. The paste cover for the SS wire meshes were secured with 10 mm distance, and thus, the distance between two electrode sheets was 30 mm.
One of the wire meshes was connected to the power supply as the positive electrode (cathode), and the other mesh was attached as the negative terminal (anode), as shown in Figure 3. CNT-cement composites are expected to be electrical materials because of the high conductivity of CNTs compared to that of ordinary cement composite. The initial voltage applied to the specimens for the heat generation experiment was 200 V. It took differing time periods to reach the highest temperature of each paste specimen.
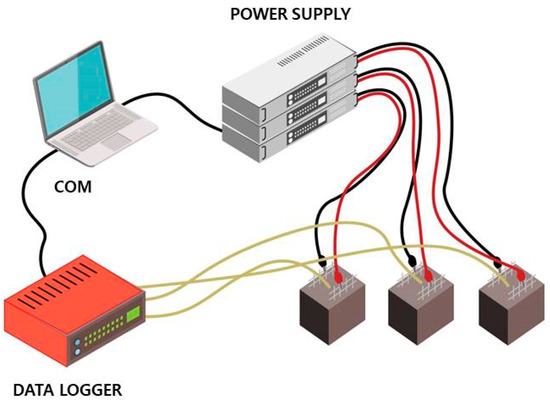
Figure 3.
Experiment setup for heating carbon nanotube-cement (CNT-cement) composite blocks.
Furthermore, temperature data in the center of cube specimens were obtained by embedding thermocouples during the casting of fresh mortars. The thermocouples were directly connected to a data logger to measure the temperatures in real time (Figure 3). Elevated temperature data were utilized to calculate the thermal conductivity of CNT-cement composites by observing the difference between ambient temperature inside the specimens and the peak temperature during the experiments, and the results are provided in Section 3.5.
Thermal gravimetric analysis (TGA) via Rigaku Thermo Plus EVO II was used to observe the mass changes in CNT-cement composite pastes and obtain information on some components in CNT-cement hydrates, such as calcium hydroxides and calcites. CNT-cement composites were crushed and ground to prepare powder samples to pass the 150-μm sieve.
Ten milligrams of samples were loaded in the alumina pan to measure mass changes from ambient temperature to 1000 °C. A temperature rate of 10 °C/min was applied to the sample with 300 mL/min of N2 gas in order to prevent oxidation or carbonation during the test. Furthermore, an experiment was conducted to investigate the phase changes in before-and-after thermal conductivity and evaluate if the CNT-composites for heat transfer on-site would be promising and reproducible. TGA was conducted using reference samples, which were cured for 28 days, and the samples obtained after thermal conductivity experiments.
3. Results and Discussion
3.1. Compressive Strengths
As shown in Table 3, the compressive strength at three days for MC00 (40.0 MPa) was higher than that for mixtures from MC01 (37.7 MPa) to MC05 (33.4 MPa). As time progressed (up to 91 days) MC00 developed a higher compressive strength than the other mixtures. MC00 and MC01 developed almost identical compressive strengths for 91 days, except for the result at 28 days, which indicates that the addition of 0.1 wt% CNT to the total binder weight does not significantly influence the mortar strength.
Table 3.
Compressive strengths of mortar mixtures.
The test results showed that an increase in the CNT dosages added to mixtures led to a decreasing compressive strength. At early ages (three and seven days), the compressive strengths ratio of MC03, MC04, and MC05 to MC00 were 80.4%, 90.9%, and 83.5% for three days and 81.2%, 86.8%, and 85.6% for seven days, respectively. However, compressive strengths for mixtures with 0.3 wt% of CNT solids developed as much as that of MC00 after 28 days.
Thus, it can be considered that CNT hindered the strength development due to the Van der Waals forces at early ages. Low water-to-binder ratio and large amount of CNT contents in the mixtures caused greater non evaporated water-to-binder ratio and chemical shrinkage, and it was influenced on the low hydration reaction at early age due to agglomerated CNT [20]. This caused the reduced compressive strengths at early age.
In addition, it can be considered that CNTs were not actively involved in cement hydration because they have the ability to absorb water. In theory, CNT was known for hydrophobic materials, but experimental results indicated that strength development for CNT mixtures was larger than reference mixtures. It was revealed that the entropy of water molecules increases in limited nano-spaces such as nano channels with hydrogen bonds [21].
No significant differences were observed in the flexural strengths as shown in Table 4. All mixtures exhibited the strength of less than 10 MPa at 28 days, and less than 12 MPa at 91 days. That is, CNT addition did not play an important role in flexural strength development.
Table 4.
Flexural strengths of mortar mixtures.
Thus, strength development was relatively small in the mixtures with a large amount of CNTs owing to internal curing effects. Figure 4 shows the compressive strength development, and the data indicated strength enhancement for mixtures with CNT after 28 days. Although several researchers asserted that CNT played a role in accelerating effect in the first 14 days [22], the experimental results as shown in Figure 4 indicated strength decrease at early age due to agglomerated CNT [20].
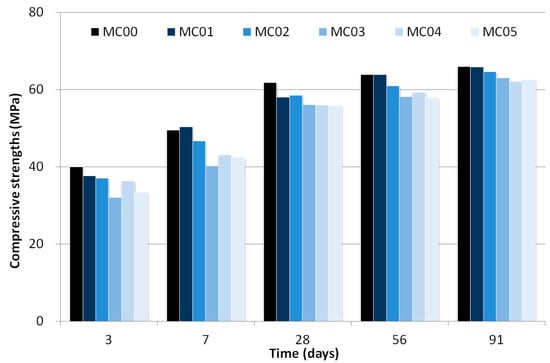
Figure 4.
Compressive strength development as a function of time.
3.2. Isothermal Calorimetry
Experiment results for normalized heat flow are presented in Figure 5. Data on PC00 and PC01 were plotted in Figure 5a,b to draw a comparison with PC02, PC03, PC04, and PC05 in terms of cement hydration reaction periods. Early age heat was produced by cement dissolution to form an amorphous layer of hydration products on the cement particles. Bensted et al. [23] used isothermal calorimetry and established that the heat peak appearing during the first couple of hours was due to the formation of dehydrated gypsum from calcium sulfate hemi-hydrate.
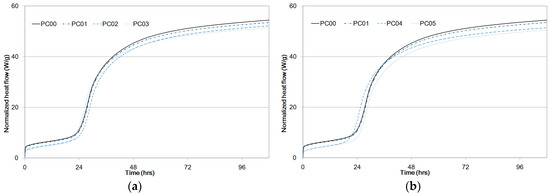
Figure 5.
Specific heat flow of paste samples compared to PC00 and PC01 as a function of time, (a) PC02, PC03, (b) PC04, PC05.
The induction and acceleration periods of PC00 began after an hour and twenty hours, respectively, as shown in Figure 5. The induction periods were initiated after the formation of a protective layer on the C3S particles [24,25] and were complete when this layer was broken and C3S particles were used to form C-S-H and Ca(OH)2, causing the hydration reaction rates to eventually slow down [26]. That is, Alite was used to form C-S-H and Ca(OH)2, and the induction period was complete when the layer was broken with C3S particles.
Setting takes place during the acceleration period, and the silicate begins to quickly hydrate with a maximum rate of heat release [27]. The maximum heat for the second peak of PC00 between the acceleration period and the retardation period was 4.49 mW/g as shown in Table 5. It was observed that maximum peaks of the second curves between the acceleration and retardation periods from PC01 to PC05 were less than that of PC00. An increase in the dosage of CNTs reduced the peak heat because cement hydration at an early age was impeded by CNT particles.
Table 5.
Maximum heat flow for the second peak and cumulative heat.
However, setting delays were not observed in all mixtures, which means that CNT addition did not significantly influence the setting times of cement composite hardening. It can be considered that setting delays directly shift the acceleration and retardation curve positions to the right-hand side [28].
Cumulative heat at an early age for PC00 and PC01 was higher than those for other PC mixtures. Even though a couple of mixtures, PC03 and PC04, developed higher cumulative heat in some regions, the total heat released for PC00 was the highest. The amounts of heat released from the experiments for PC01 to PC05 were in the order of large to small as shown in Figure 6 and Table 5.
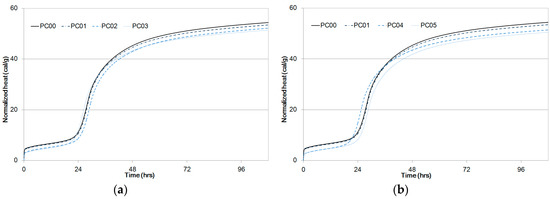
Figure 6.
Normalized heat of paste samples compared to PC00 and PC01 as a function of time, (a) PC02, PC03, (b) PC04, PC05.
The cumulative heat difference between PC00 and PC05 at 108 hours was 3.9 cal/g, and it does not seem to be significant. It can be considered that 28% water-to-binder ratio and the addition of fly ash does not considerably influence the hydration heat. Thus, a 7.2% difference in hydration heat is large enough to explain the strength development shown in Figure 4.
Owing to the Van der Waals forces between CNT particles, early age hydration reaction was slow from the experiment result. However, hydration reaction of the CNT-cement composites progressed in the same way as that of OPC in consequence. As water inside CNTs was not directly reacting with cement particles at early ages, the cumulative heat can be smaller for mixtures in which more CNTs were added.
3.3. SEM-EDS
Figure 7 shows the microstructures of PC00 and PC05 at 28 days of water curing. Major hydration products from cement and fly ash without CNTs were mainly C-S-H, C-A-H, and Ca(OH)2. In order to investigate the effects of CNT addition on the changes in hydration products, SEM-EDS analysis was conducted. Figure 7 shows the main components from cement composites with CNTs.
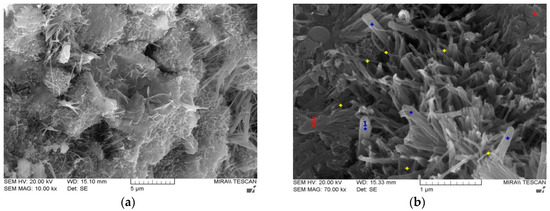
Figure 7.
SEM images for PC00 and PC05, (a) PC00, (b) PC05.
It appears that the CNTs were similar to Ettringite, which were needle-like in shape; however, the CNTs had smaller diameters and curvatures as shown in Figure 7b. It can also be considered that the CNTs dispersed evenly around the hydration products and acted as a bridge between hydration products. Owing to the large surface area of the particles, the long-term strength for the cement composites can be developed with the use of fly ash.
EDS analysis was conducted to determine the components of hydration products, and major elements such as Ca, Si, Al, O, and C were semi-quantified in mass percent as shown in Table 6. The results in Table 6 represented average values for points dotted in the same color.
Table 6.
Electron Dispersive Spectroscopy results from SEM image for PC05.
The blue dot (#1) represents the C-S-H, produced by Ca(OH)2 from the cement hydration reaction and the supply of SiO2 from fly ash. The red dot (#2) indicates the plate crystals that are commonly called Portlandite (Ca(OH)2), which is formed from CaO and water. However, most crystals in the SEM image were C-S-H. CNT particles were dispersed evenly as shown in the SEM image (yellow dots).
3.4. Thermal Conductivity
As explained in Section 2.3, thermal conductivity of CNT-cement composites was measured by applying a certain amount of electricity. Figure 8 shows the test results for thermal conductivity for paste composites at the ages of 28 days. A constant 200 volts was applied, even as currents inside the samples differed.
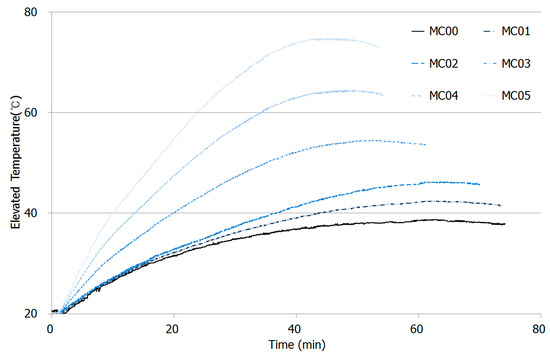
Figure 8.
Thermal conductivity plot for CNT-cement composites with peak temperatures with various CNT additions.
The more CNT added in the mixtures, the higher the increase in temperature was observed. The ambient temperature started in the experiment was 20 degree Celsius, and the peak temperature for MC00 was just 38.8 °C. However, the highest temperature peaks MC01 and MC02 were 42.5 °C and 46.3 °C after 60 min elapsed, which was earlier than MC00.
The slopes for the first 20 min for MC00, MC01, and MC02 were similar, but differences in peak temperature were relatively large. The highest temperature elevated during the experiment was observed on MC05, which contained largest amount of CNT added. MC04 and MC03 developed 64.5 °C and 54.6 °C at 47.2 and 51 min, respectively.
As shown in Table 7, as CNT additions increased in the mixtures, heat production inside the specimens increased, but the time to reach highest temperature for each specimen decreased. That is, CNT played an important role in enhancement of heat transfer capacity caused by electrical conductivity, low resistance, and high current migration [29].
Table 7.
Experiment results for thermal conductivity.
3.5. Thermal Gravimetric Analysis
TGA was conducted to investigate the weight changes in certain ranges for the dehydration and decomposition of hydration products. Three “PC-” mixtures, PC00, PC02, and PC05, after curing for 28 days were used as samples. The weight losses from the ambient temperature to 1000 °C are plotted in Figure 9.
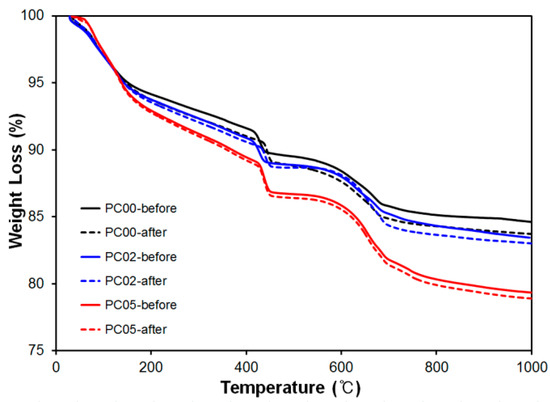
Figure 9.
Thermal Gravimetric Analysis (TGA) results for PC00, PC02 and PC05 before and after thermal conductivity test.
The weight loss rate for PC00 was the most gradual at 150 °C, and otherwise, a stiff slope was observed for PC05. Usually, the dehydration of C-S-H continued till 200 °C, and water was obtained from Ca(OH)2 between 400 and 600 °C [30]. This implies that PC05 contained more water owing to the characteristics of CNTs that absorb more water compared with other mixtures.
To evaluate the phase changes after the thermal conductivity experiments, TGA results for cement composites as references, where heat experiments were not conducted, were indicated by solid lines, “PC-before” in Figure 9. After the thermal conductivity experiments, samples near wire meshes were taken out to conduct TGA to observe the phase changes.
Weight losses between references and samples after heat experiments were not significant; less than one percent difference was observed for all mixtures. This is because heat conductivity experiment was not critically influenced by the deterioration of microstructures in CNT-cement composites, and the maximum temperature difference between ambient temperature and peak temperatures during the test was less than 75 °C in the sample. In addition, it can be considered that dehydration of Ca(OH)2 and decomposition of CaCO3 between references and tested samples was very similar; therefore, the heat experiments did not result in significant phase changes.
4. Conclusions
CNT is a novel construction material because of its enhancement of the concrete property. Furthermore, electrical and thermal conductivity were highly improved with the cement composites because CNTs have high conductivity. In this study, various experiments were conducted to investigate the mechanical properties and hydration reaction of CNT-cement composites with various CNT contents and low water-to-binder ratio (0.28).
Thermal conductivity by CNT addition was simply estimated by designing a thermal conductivity test with two stainless-steel electrodes to develop multi-functional cement composites in the near future. From the test results, thermal conductivity capacity increased as CNT contents become higher in the mixtures. Figure 8 shows that peak temperature for MC00 and MC05 were 38.8 °C and 74.9 °C during the test, so large amount of CNT addition directly influences on the thermal property on cement composites.
As the amount of CNT increased in the mixtures, the compressive strengths decreased initially owing to the water absorption of CNT. However, the strengths of specimens with large amount of CNTs rapidly increased as much as MC00 after 28 days. This was because of the internal curing effects of water contents in and around the CNT particles that released water. Thus, the compressive strength for MC04, which showed the lowest strength, was 94.0 percent of MC00.
CNT addition did not significantly influence cement hydration reaction, as shown by isothermal calorimetry. The largest and smallest cumulative heats (PC00 and PC05) were 54.4 cal/g and 50.5 cal/g, respectively, less than 10 percent difference.
Cement hydrates were formed around the CNT particles inside the pores of hardened cement composites in SEM images, and it can be considered that CNT played a role in connecting cement hydrates. Thus, strength development can be achieved later.
Weight losses for PC00, PC02, and PC05 were measured to find out the different types of hydration products; however, it was concluded that CNT did not have a considerable effect on the change in hydration products. After the thermal conductivity test, significant phase changes were not observed by the mass change data for all mixtures.
It appears that nano-materials do have an influence on concrete properties at the early age, but over time, the strength development is improved. Moreover, hydration reaction and microstructures of CNT-cement composites were similar to normal cement composites. Although CNT did not dramatically improve the strength of composites, it can be considered that CNT is a multifunctional material from thermal conductivity test. Thermal conductivity capacity for CNT-cement composite increased as more CNT was added in the mixtures. The optimum mix proportions of CNT contents and water-to-binder ratio shows potential for improving the concrete property in the construction field. In particular, the thermal conductivity can be applied to bridges and roadways to avoid black ice that can cause traffic accidents by melting surface ice. Pre-fabricated CNT-cement blocks with electrodes can be embedded before concrete pouring as heat resources during roadway construction or pre-cast CNT-concrete bridge-decks can be adopted on-site.
Author Contributions
S.-H.J. and S.O. conceived, designed and conducted experimental program; S.-W.K. contributed materials and analysis tools; S.O. and J.-H.M. wrote the paper; S.-H.J. and J.-H.M. analysed the data and designed the project. All four authors contributed to the discussion and conclusion.
Funding
This research was supported by a grant (19SCIP-B146646-02) from Construction Technology Research Project funded by the Ministry of Land, Infrastructure and Transport of Korea government.
Conflicts of Interest
The authors declare no conflicts of interest.
References
- Bakharev, T.; Sanjayan, J.G.; Cheng, Y.B. Effect of admixtures on properties of alkali-activated slag concrete. Cem. Concr. Res. 2000, 30, 1367–1374. [Google Scholar] [CrossRef]
- Sakulich, A.R.; Bentz, D.P. Mitigation of autogenous shrinkage in alkali activated slag mortars by internal curing. Mater. Struct. 2013, 46, 1355–1367. [Google Scholar] [CrossRef]
- Singh, L.; Kumar, A.; Sing, A. Study of partial replacement of cement by silica fume. Int. J. Adv. Res. 2016, 4, 104–120. [Google Scholar] [CrossRef]
- Li, G.Y.; Wang, P.M.; Zhao, X. Mechanical behavior and microstructure of cement composites incorporating surface-treated multi-walled carbon nanotubes. Carbon 2005, 43, 1239–1245. [Google Scholar] [CrossRef]
- Konsta-Gdoutos, M.S.; Metaxa, Z.S.; Shah, S.P. Multi-scale mechanical and fracture characteristics and early-age strain capacity of high performance carbon nanotube/cement nanocomposites. Cem. Concr. Compos. 2010, 32, 110–115. [Google Scholar] [CrossRef]
- Kang, S.T.; Park, S.H. Experimental study on improving compressive strength of MWCNT reinforced cementitious composites. J. Korea Concr. Inst. 2014, 26, 63–70. [Google Scholar] [CrossRef]
- Kim, G.M.; Yang, B.J.; Cho, K.J.; Kim, E.M.; Lee, H.K. Influences of CNT dispersion and pore characteristics on the electrical performance of cementitious composites. Compos. Struct. 2017, 164, 32–42. [Google Scholar] [CrossRef]
- Choi, H.; Kang, D.; Seo, G.S.; Chung, W. Effect of Some Parameters on the Compressive Strength of MWCNT-Cement Composites. Adv. Mater. Sci. Eng. 2015, 2015, 340808. [Google Scholar] [CrossRef]
- Parveen, S.; Rana, S.; Fangueiro, R. A review on nanomaterial dispersion, microstructure, and mechanical properties of carbon nanotube and nanofiber reinforced cementitious composites. J. Nanomater. 2013, 2013, 710175. [Google Scholar] [CrossRef]
- Musso, S.; Tulliani, J.M.; Ferro, G.; Tagliaferro, A. Influence of carbon nanotubes structure on the mechanical behavior of cement composites. Compos. Sci. Technol. 2009, 69, 1985–1990. [Google Scholar] [CrossRef]
- Lavagna, L.; Musso, S.; Ferro, G.; Pavese, M. Cement-based composites containing functionalized carbon fibers. Cem. Concr. Compos. 2018, 88, 165–171. [Google Scholar] [CrossRef]
- Pavese, M.; Musso, S.; Bianco, S.; Giorcelli, M.; Pugno, N. An analysis of carbon nanotube structure wettability before and after oxidation treatment. J. Phys. Condens. Matter 2008. [Google Scholar] [CrossRef]
- Collins, F.; Lambert, J.; Duan, W.H. The influences of admixtures on the dispersion, workability, and strength of carbon nanotube-OPC paste mixtures. Cem. Concr. Compos. 2012, 34, 201–207. [Google Scholar] [CrossRef]
- Evangelista, A.C.J.; de Morais, J.F.; Tam, V.; Soomro, M.; Di Gregorio, L.T.; Haddad, A.N. Evaluation of carbon nanotube incorporation in cementitious composite materials. Materials (Basel) 2019, 12, 1504. [Google Scholar] [CrossRef]
- Zhang, J.; Liu, X. Dispersion performance of carbon nanotubes on ultra-light foamed concrete. Processes 2018, 6, 194. [Google Scholar] [CrossRef]
- Balasubramaniam, B.; Mondal, K.; Ramasamy, K.; Palani, G.S.; Iyer, N.R. Hydration phenomena of functionalized carbon nanotubes (CNT)/cement composites. Fibers 2017, 5, 39. [Google Scholar] [CrossRef]
- Dalla, P.T.; Tragazikis, I.K.; Exarchos, D.A.; Dassios, K.G.; Barkoula, N.M.; Matikas, T.E. Effect of carbon nanotubes on chloride penetration in cement mortars. Appl. Sci. 2019, 9, 1032. [Google Scholar] [CrossRef]
- Kim, H.K. Chloride penetration monitoring in reinforced concrete structure using carbon nanotube/cement composite. Constr. Build. Mater. 2015, 96, 29–36. [Google Scholar] [CrossRef]
- ISO 679. Cement—Test Methods—Determination of Strength, 2nd ed.; ISO: Geneva, Switzerland, 2009. [Google Scholar]
- Tafesse, M.; Kim, H.K. The role of carbon nanotube on hydration kinetics and shrinkage of cement composite. Cem. Concre. Compos. 2019, 169, 55–64. [Google Scholar] [CrossRef]
- Pascal, T.A.; Goddard, W.A.; Jung, Y. Entropy and the driving force for the filling of carbon nanotubes with water. Proc. Natl. Acad. Sci. USA 2011, 108, 11794–11798. [Google Scholar] [CrossRef]
- Chen, S.J.; Collins, F.G.; Macleod, A.J.; Pan, Z.; Duan, W.H.; Wang, C.M. Carbon nanotube-cement composites: A retrospect. IES J. Part A Civ. Struct. Eng. 2011, 4, 254–265. [Google Scholar] [CrossRef]
- Bensted, J. Seventh International Congress on the Chemistry of Cement; Septima Publishing: Paris, France, 1980; Volume II, p. II/1–6. [Google Scholar]
- Brown, P.W.; Pommersheim, J.; Frohnsdorff, G. A kinetic model for the hydration of tricalcium silicate. Cem. Concr. Res. 1985, 15, 35–41. [Google Scholar] [CrossRef]
- Grutzeck, M.W.; Ramachandran, A.R. An integration of tricalcium silicate hydration models in light of recent data. Cem. Concr. Res. 1987, 17, 164–170. [Google Scholar] [CrossRef]
- Romano, R.C.O.; Cincotto, M.A.; Pileggi, R.G. Hardening phenomenon of Portland cement suspensions monitored by Vicat test, isothermal calorimetry and oscillatory rheometry. Rev. IBRACON Estruturas Mater. 2018, 11. [Google Scholar] [CrossRef]
- Mostafa, N.Y.; Brown, P.W. Heat of hydration of high reactive pozzolans in blended cements: Isothermal conduction calorimetry. Thermochim. Acta 2005, 435, 162–167. [Google Scholar] [CrossRef]
- Odler, I. Hydration, setting and hardening of Portland cement. In Lea’s Chemistry of Cement and Concrete; John Wiley: Hoboken, NJ, USA, 1998; Volume 4, pp. 241–297. [Google Scholar]
- Kim, G.M.; Park, S.M.; Ryu, G.U.; Lee, H.K. Electrical characteristics of hierarchical conductive pathways in cementitious composites incorporating CNT and carbon fiber. Cem. Concr. Compos. 2017, 82, 165–175. [Google Scholar] [CrossRef]
- Kim, M.S.; Jun, Y.; Lee, C.; Oh, J.E. Use of CaO as an activator for producing a price-competitive non-cement structural binder using ground granulated blast furnace slag. Cem. Concr. Res. 2013, 54, 208–214. [Google Scholar] [CrossRef]


© 2019 by the authors. Licensee MDPI, Basel, Switzerland. This article is an open access article distributed under the terms and conditions of the Creative Commons Attribution (CC BY) license (http://creativecommons.org/licenses/by/4.0/).