Control Reference Parameter for Stance Assistance Using a Passive Controlled Ankle Foot Orthosis—A Preliminary Study

 ,
,  ,
,  , , ,
, , ,
Abstract
Featured Application
Abstract
1. Introduction
- (1)
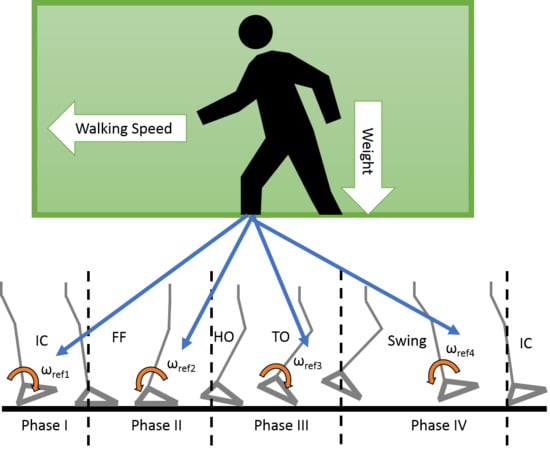
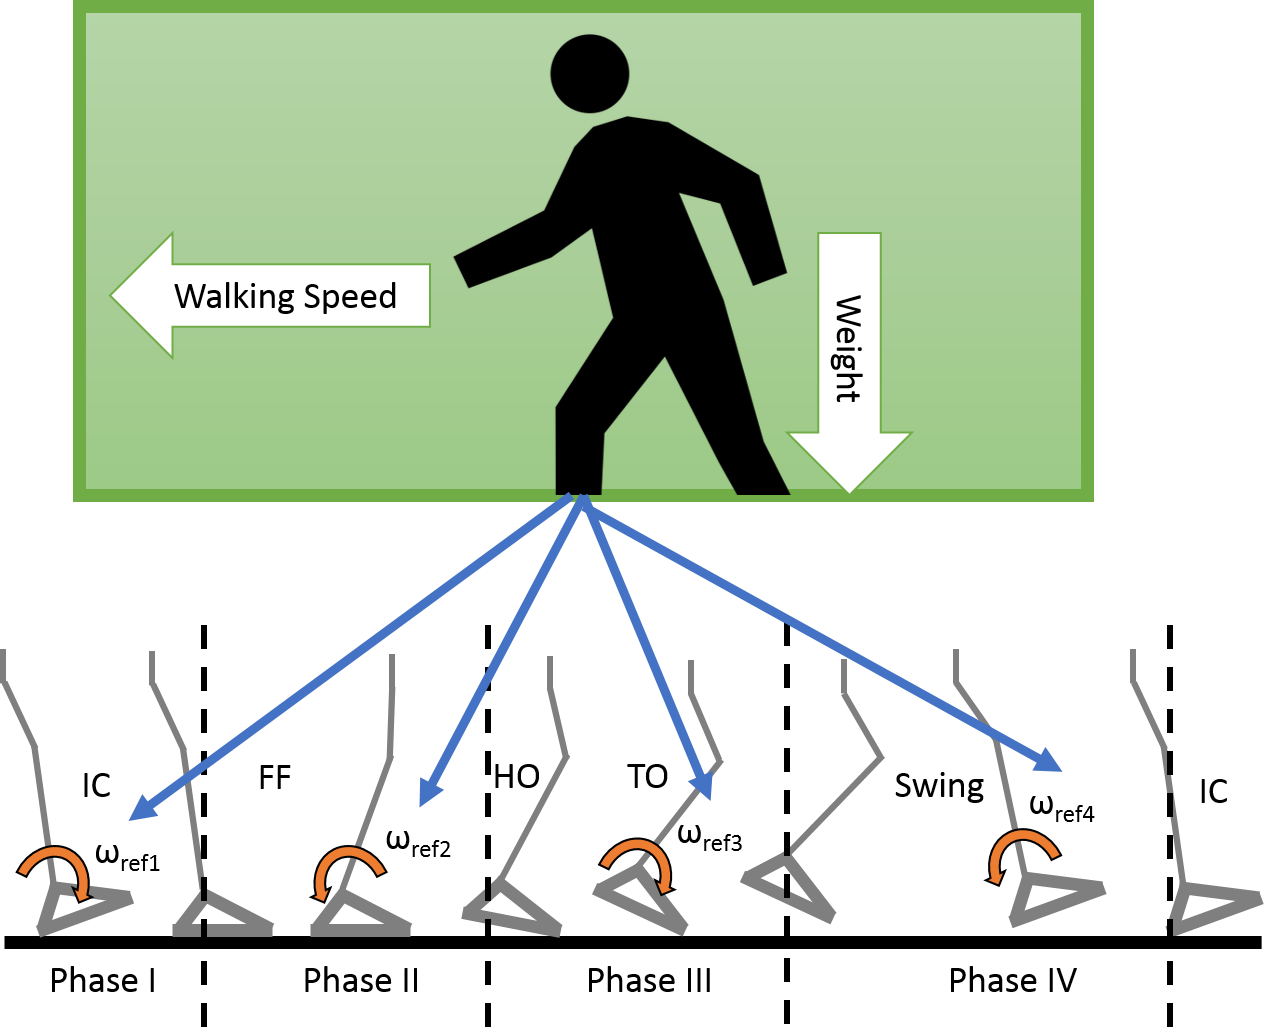
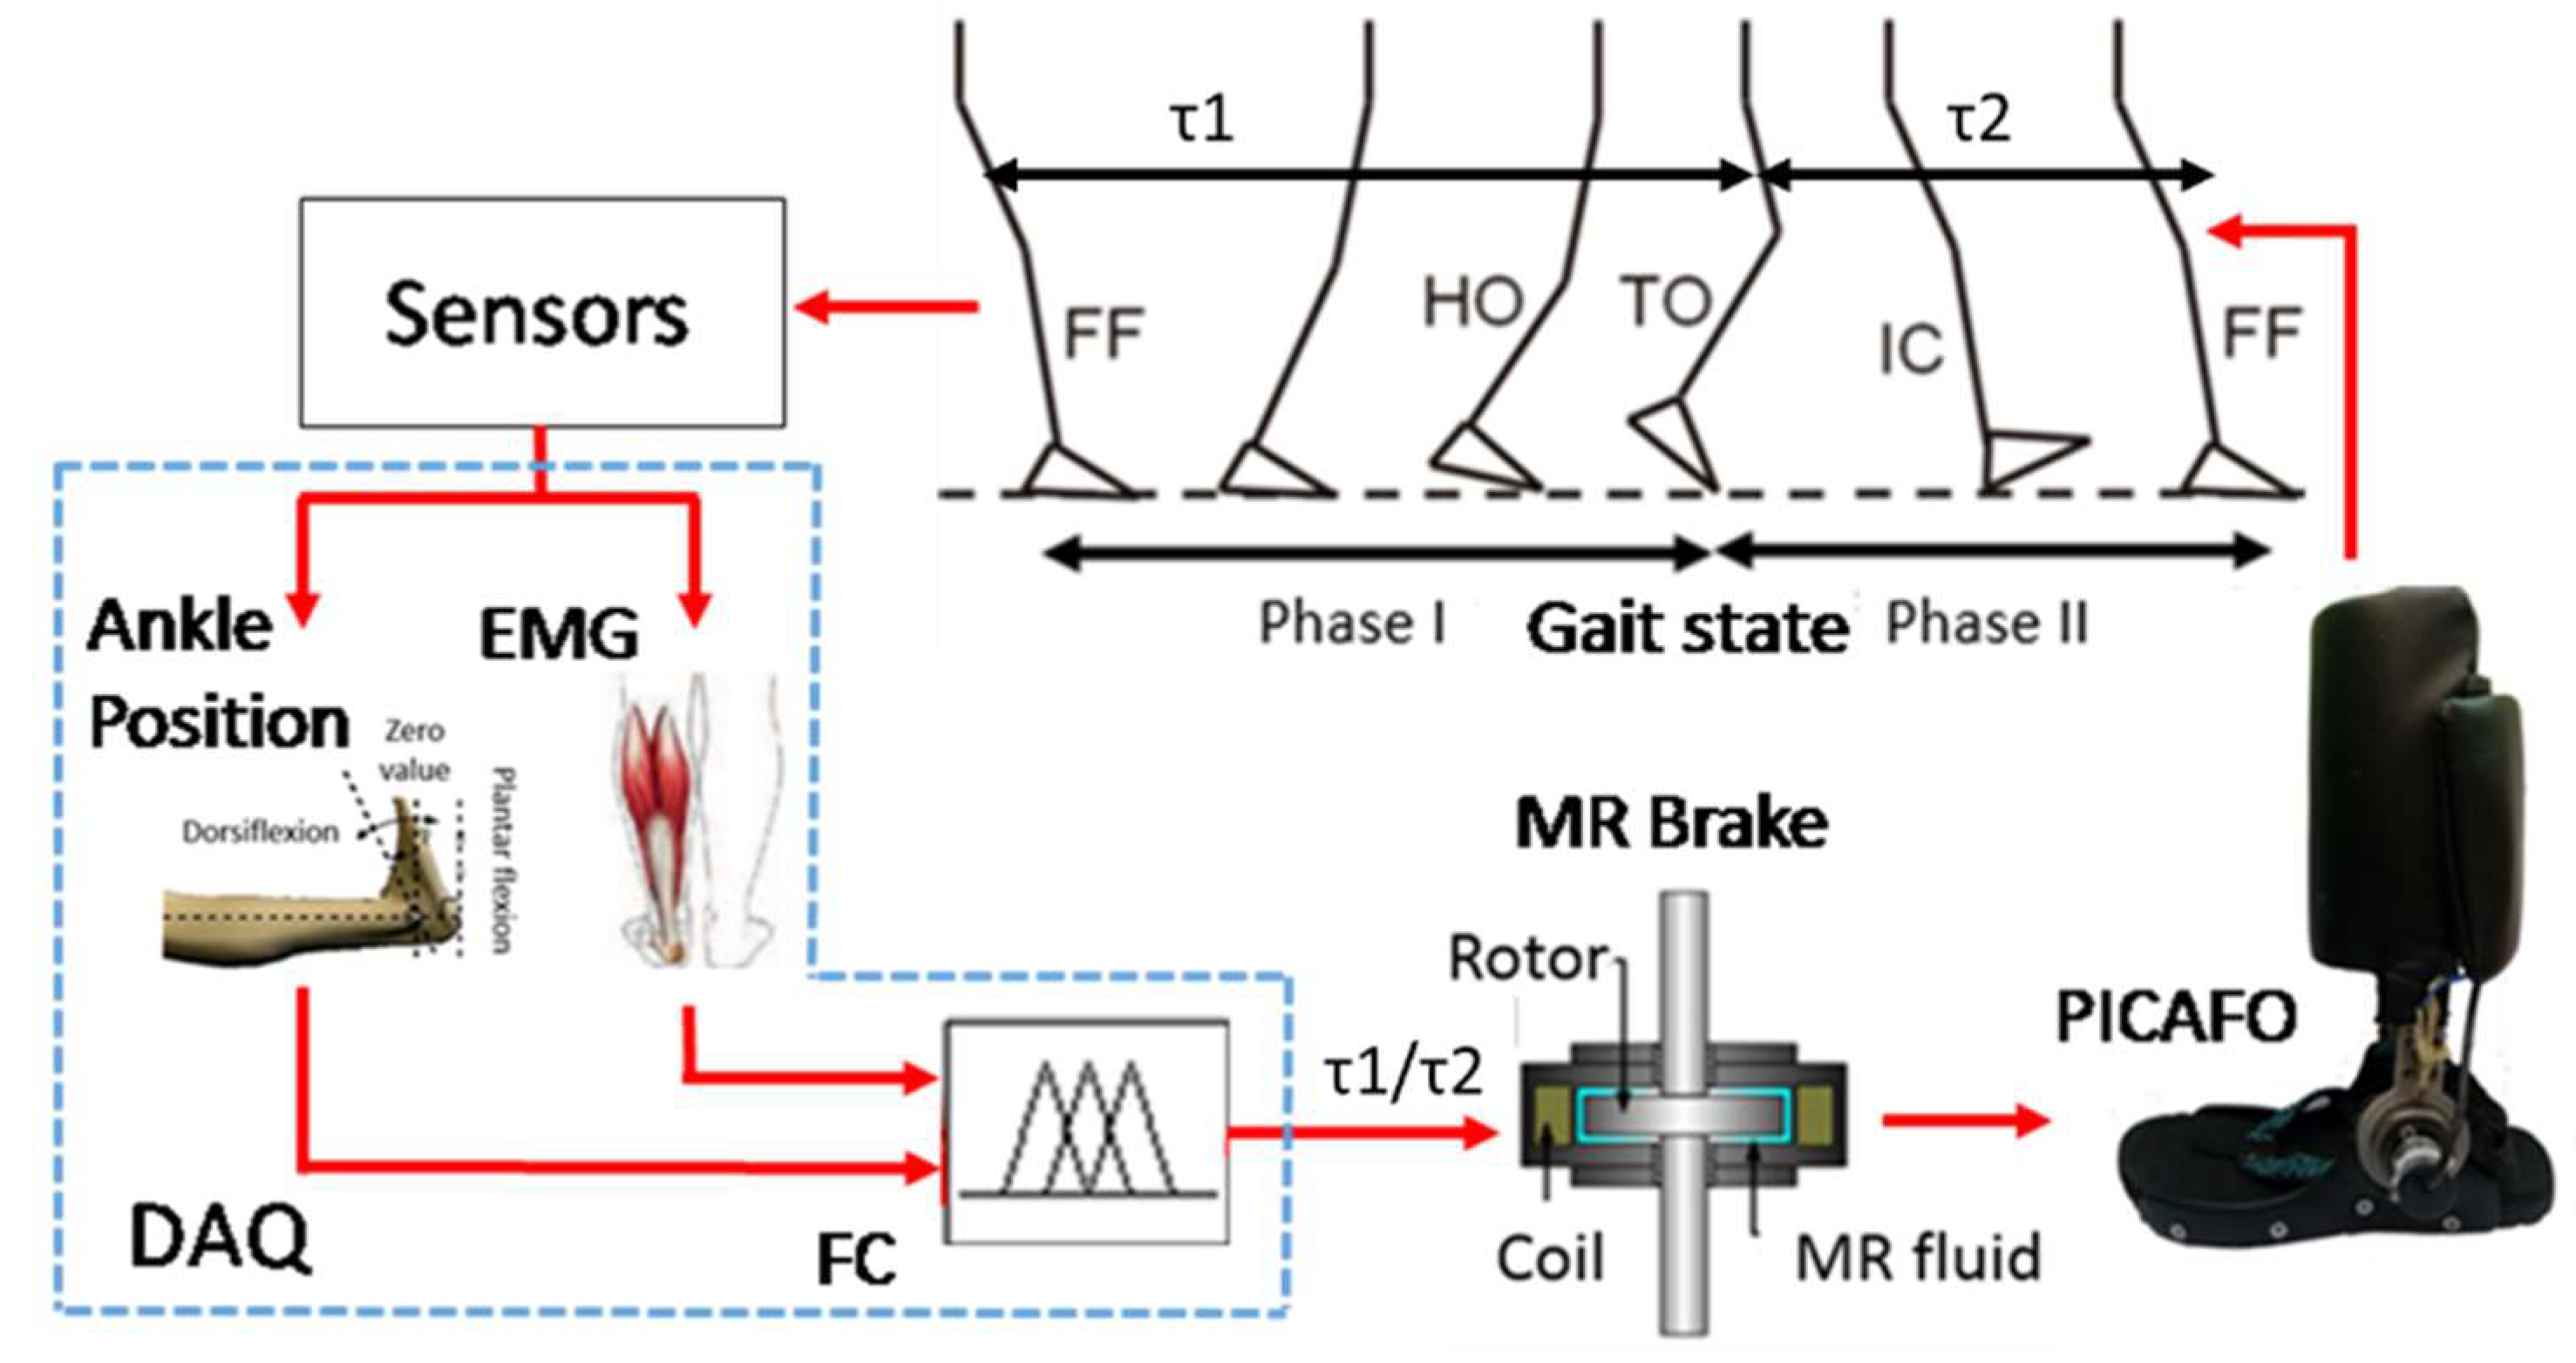
- What is the suitable control reference parameter for stance assistance using PICAFO?Controlling the walking gait at the stance phase is not limited to the joint stiffness only. Other mechanical properties that can serve as the control reference parameter is also presented, such as motion parameter and assistive torque [11]. These mechanical properties are possible to be controlled using active actuators such as tracking and generation of the ankle motion path using electric motors [22,23,24,25], and assistive torque generation using pneumatics muscle [26,27,28] for balancing the body [29]. However, in this study, PICAFO was equipped only with MR brake as the actuator, which is not suitable for implementation of sophisticated control reference such as motion path. On the other hand, additional actuators are not a wise choice due to consideration of complex structure and overall weight of the PICAFO [30]. Because of that, mechanical properties such as ankle torque and ankle angular velocity were chosen to be investigated in this study since these can be controlled using an MR brake [31].
- (2)
- What critical parameter is suitable for estimation of the control reference parameter?Estimating the desired control reference requires information such as ground terrains, walking styles, user’s anthropometrics, and other factors. In the previous study on AFO with MR brake, the control reference estimation which associated with the walking style such as the walking speed has been reported [32,33]. However, without investigation on the effect of the user’s anthropometric such as body mass index (BMI) to the control reference. BMI is commonly used to describe human identity [34]. Thus, an additional critical parameter such as the BMI is expected to increase the control reference estimation accuracy.
2. Materials and Methods
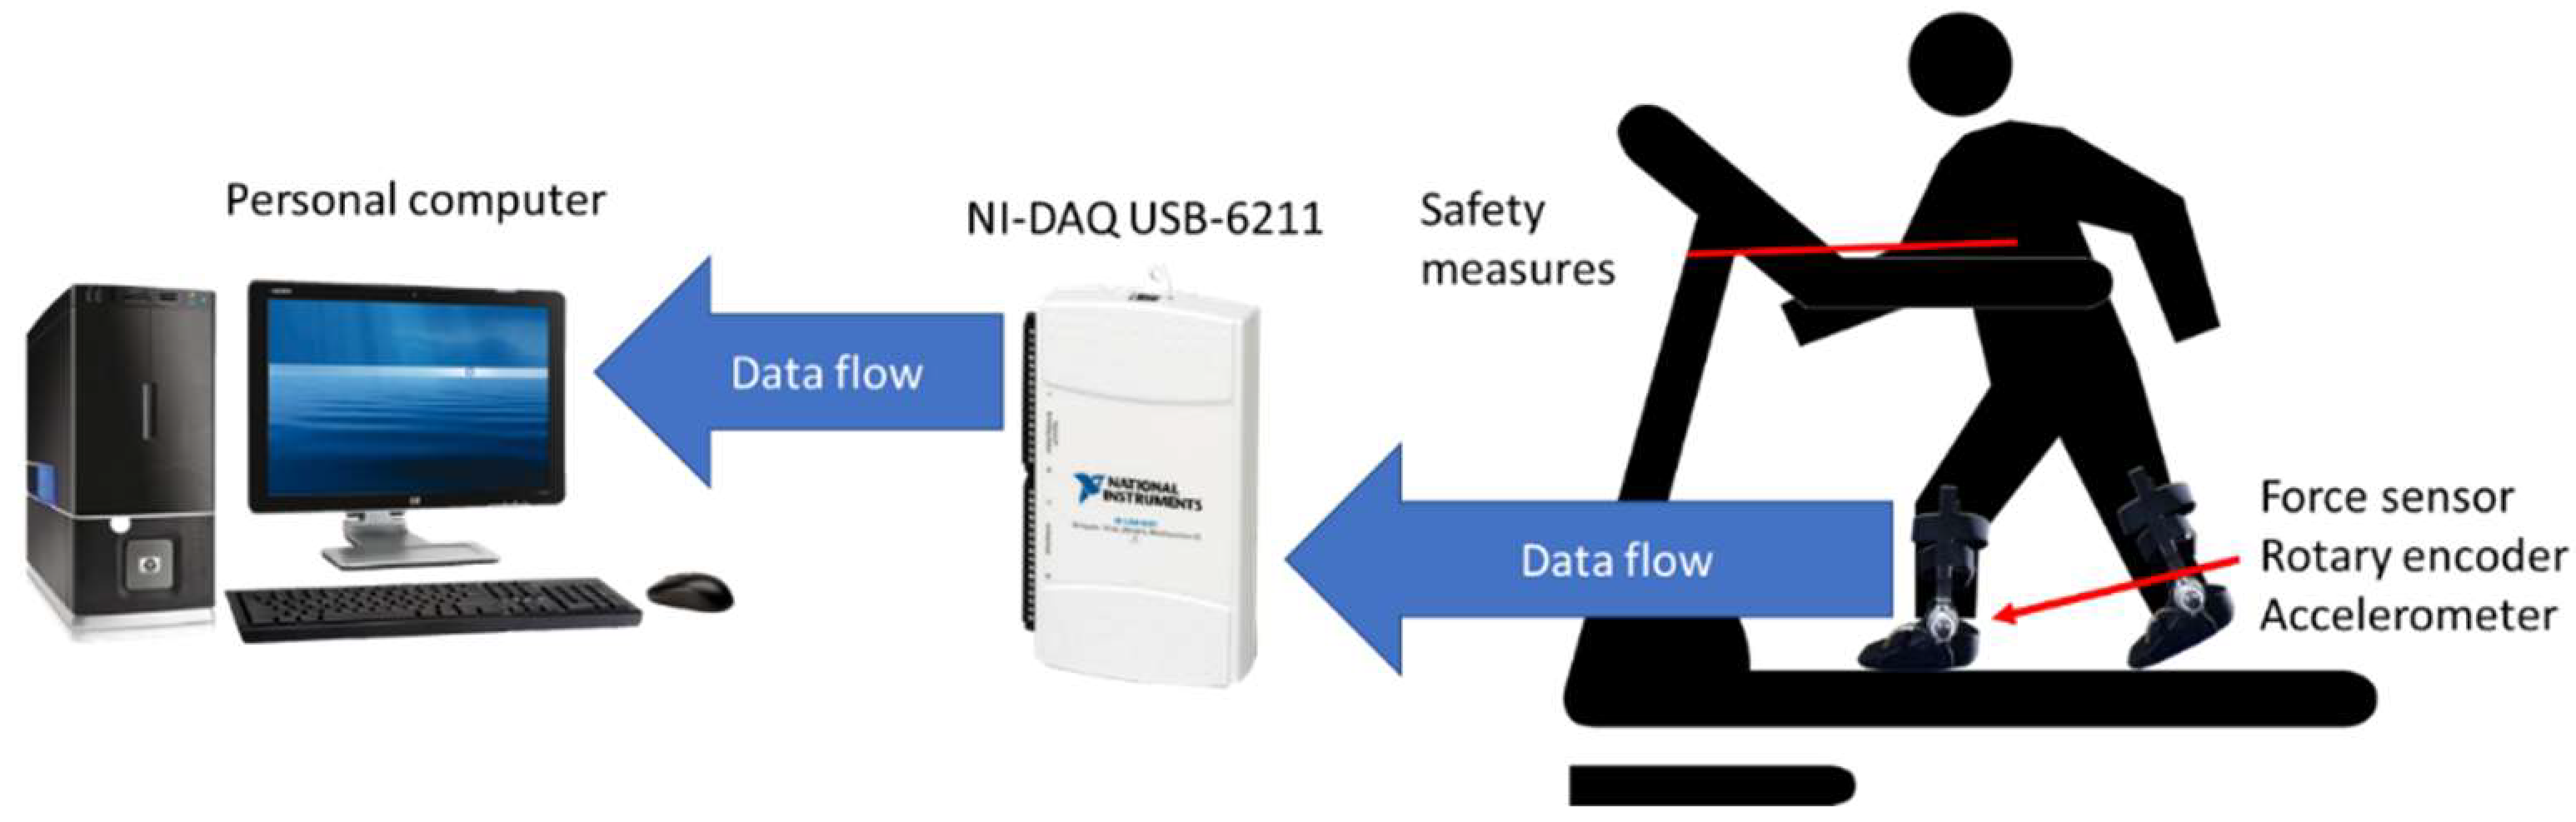
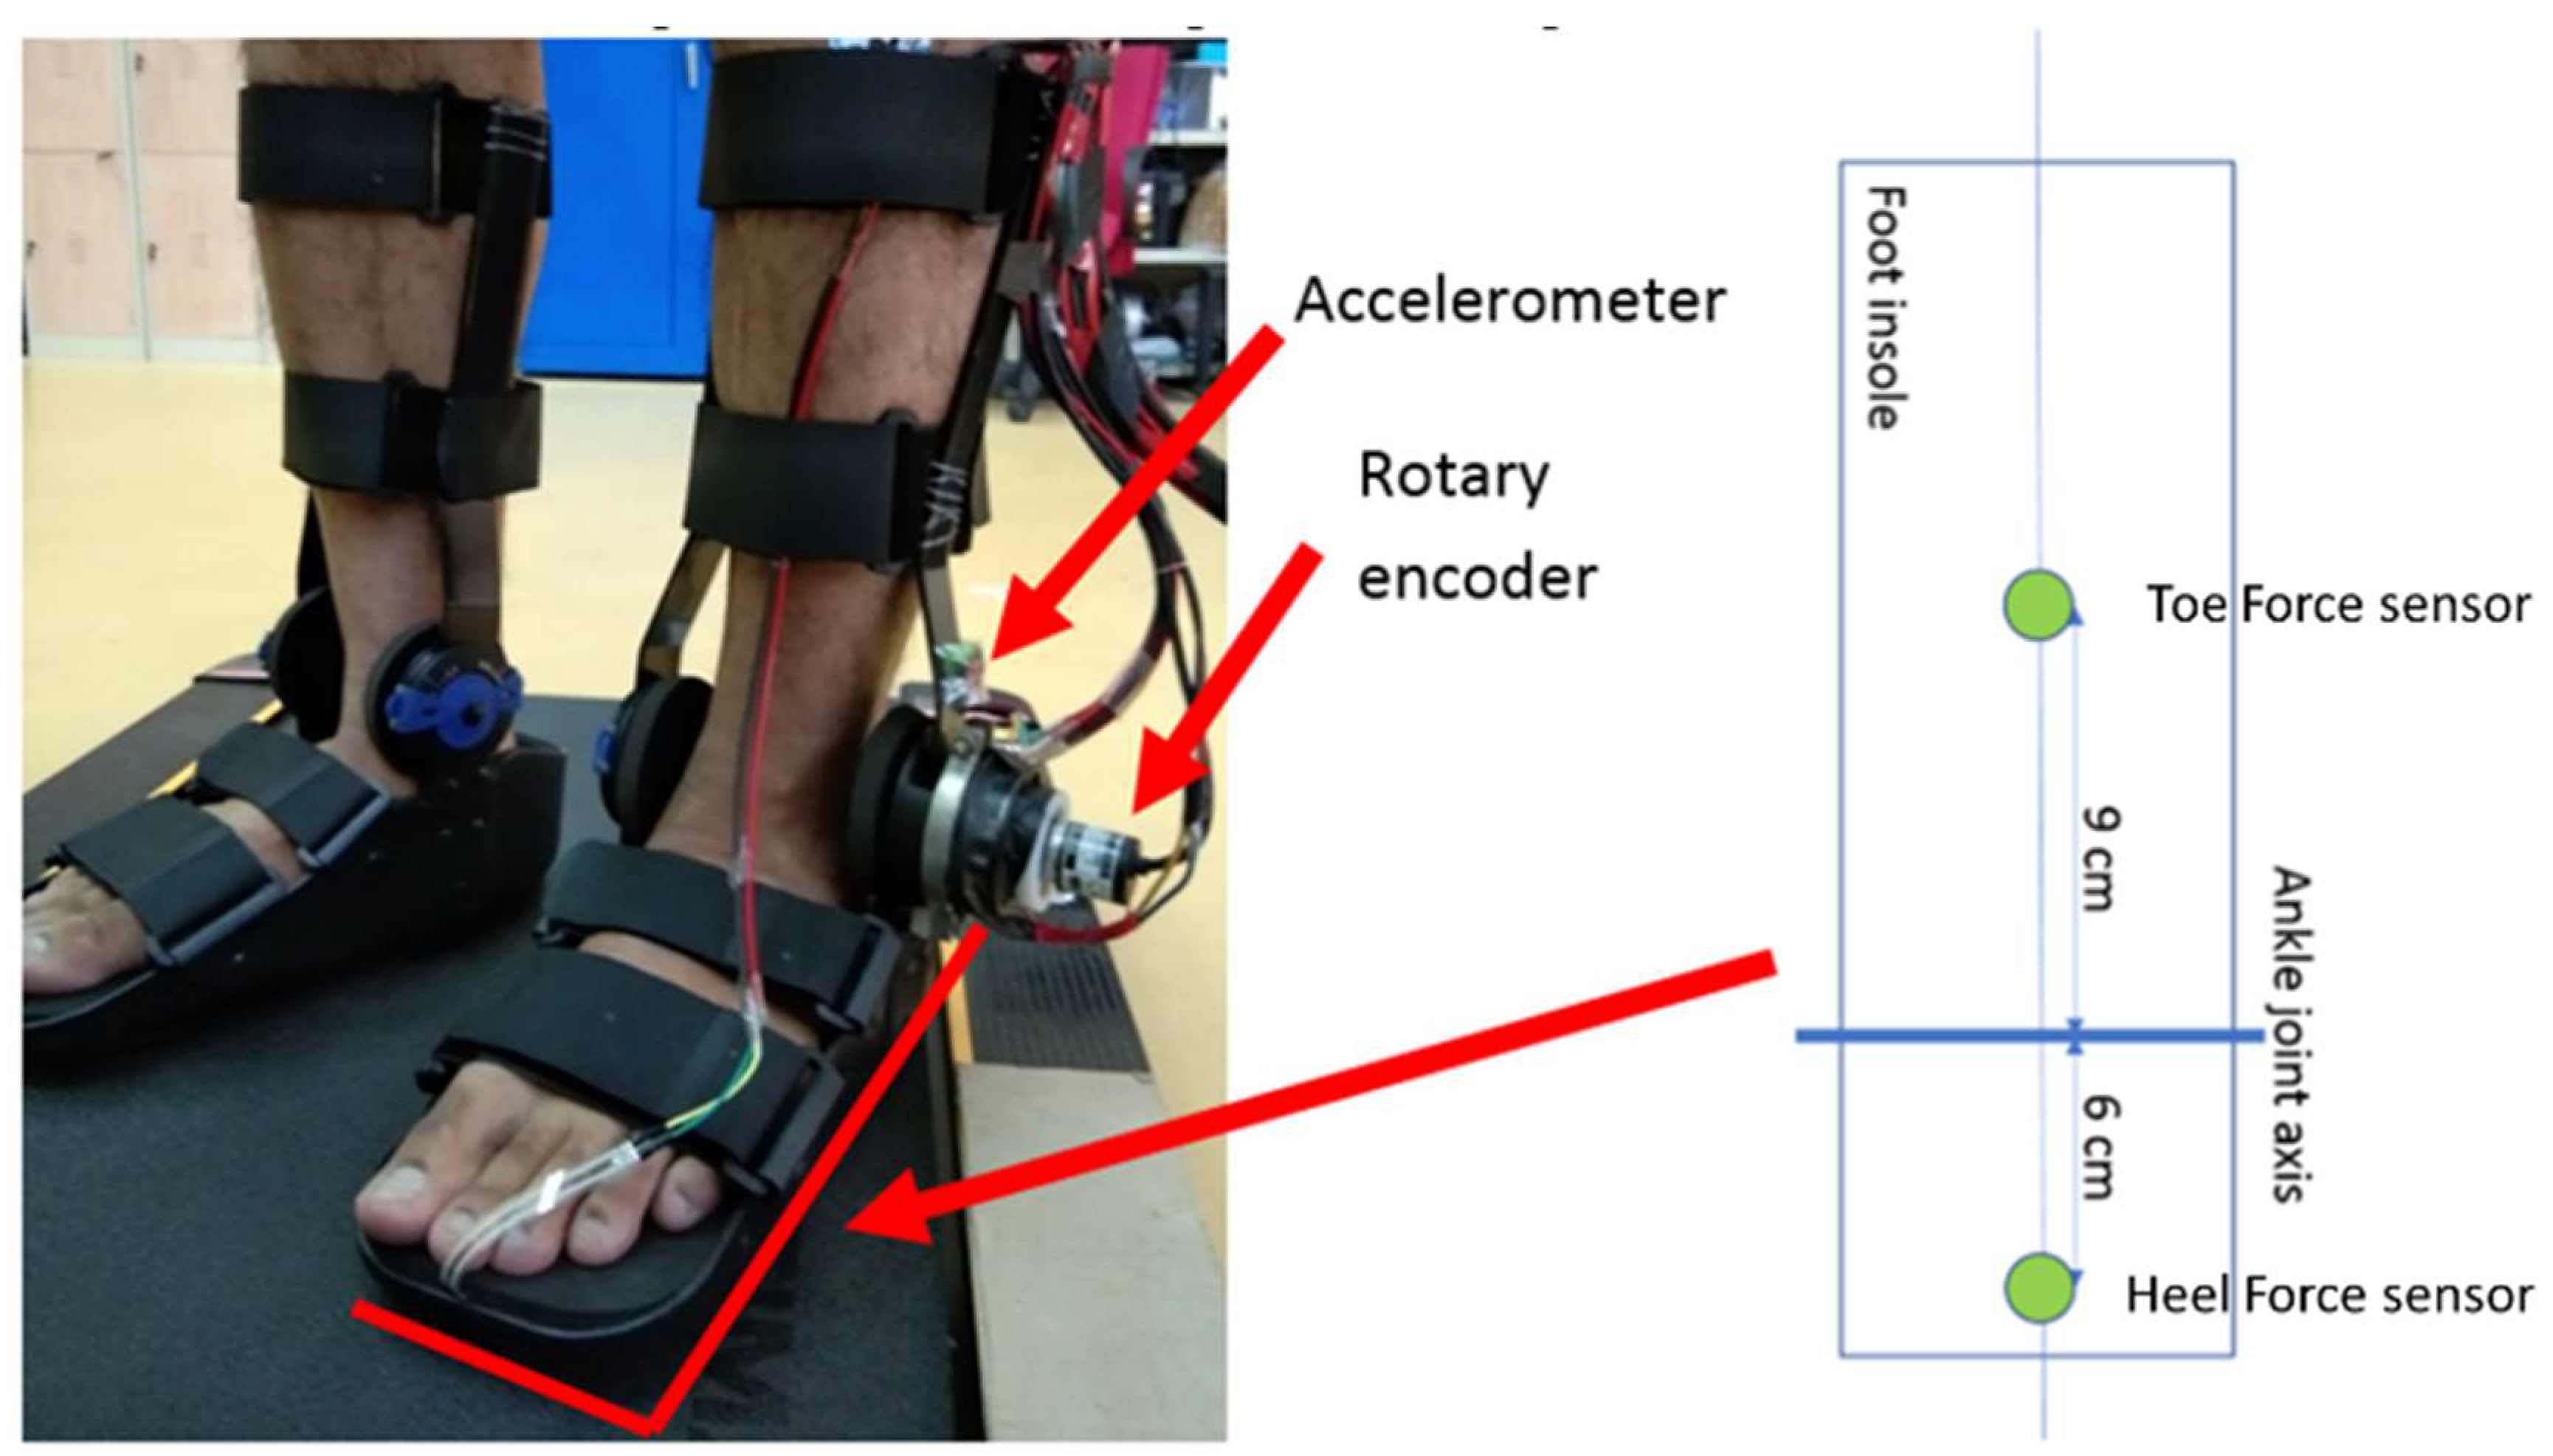
2.1. Data Collection
2.2. Data Processing
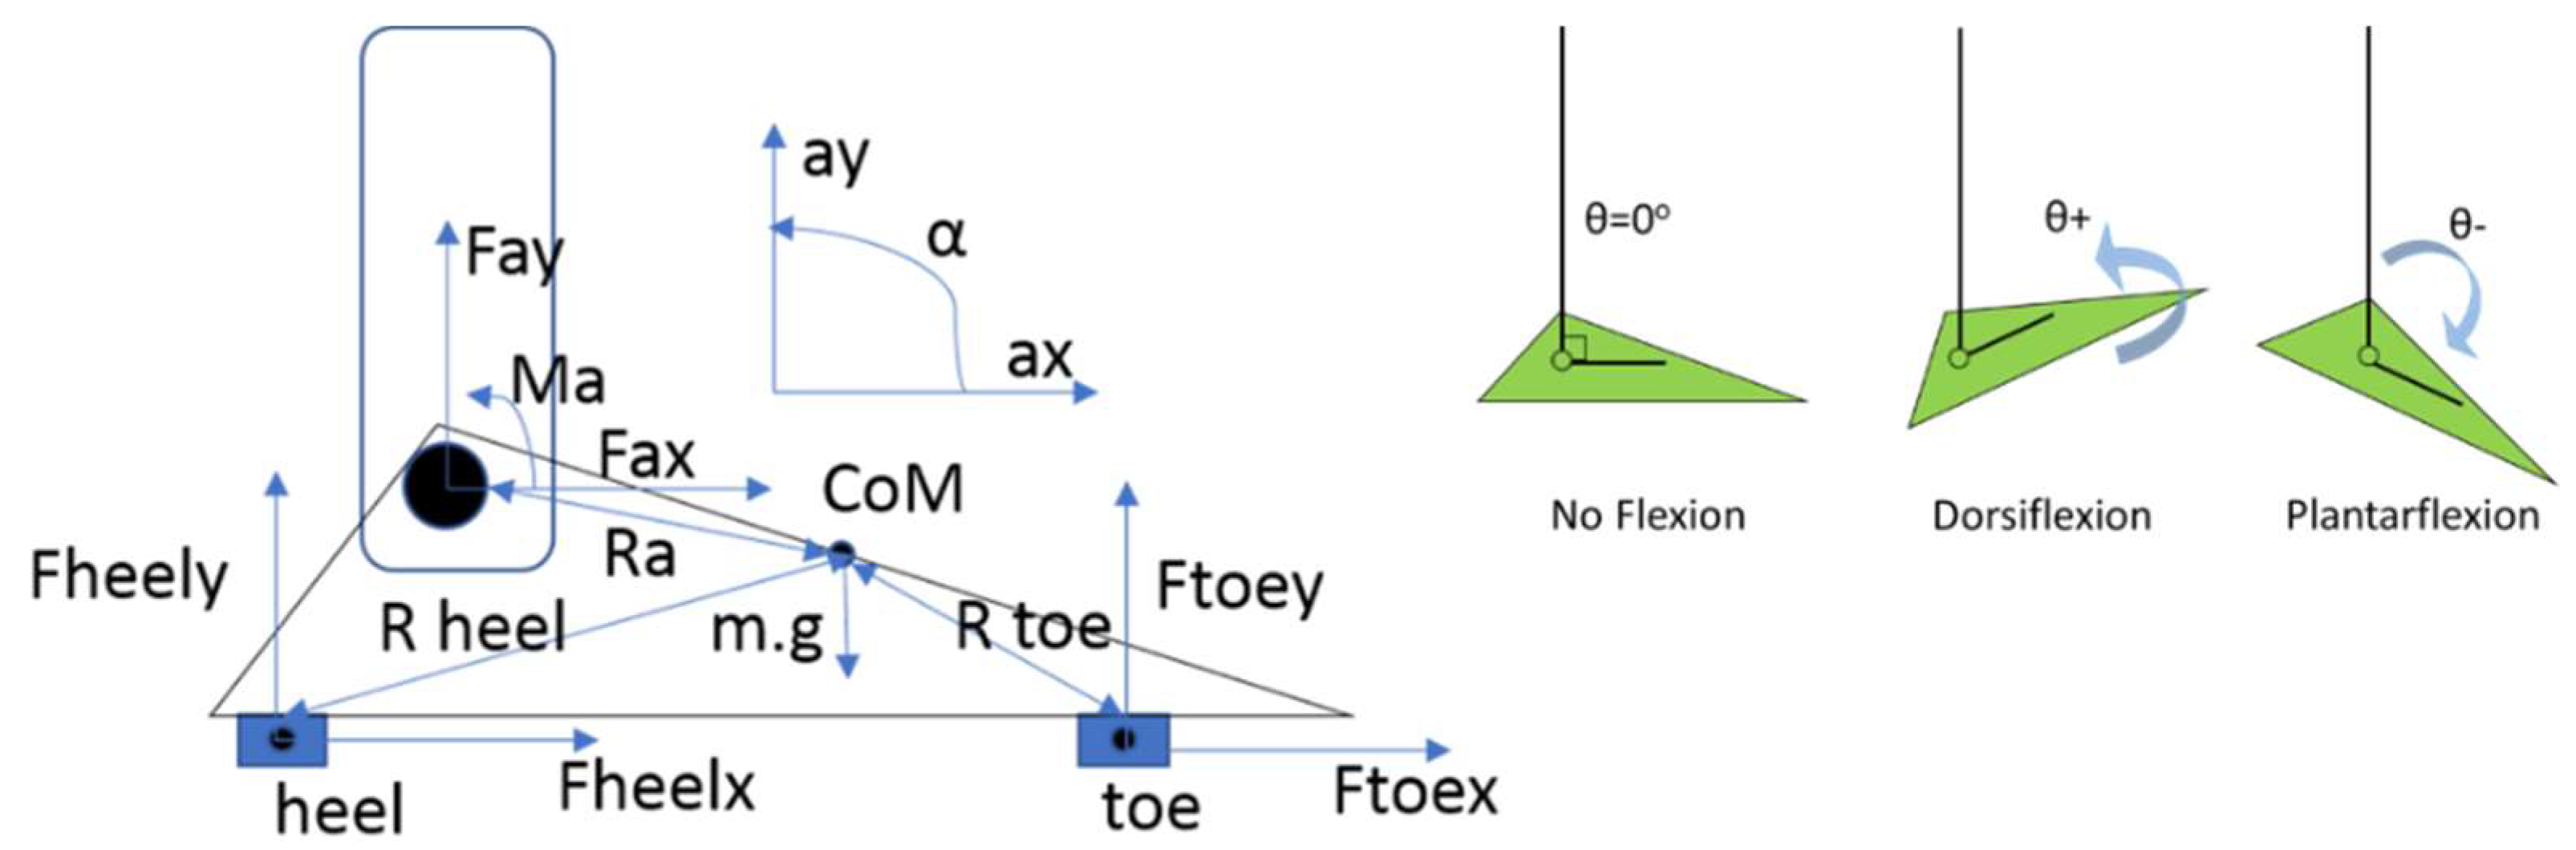
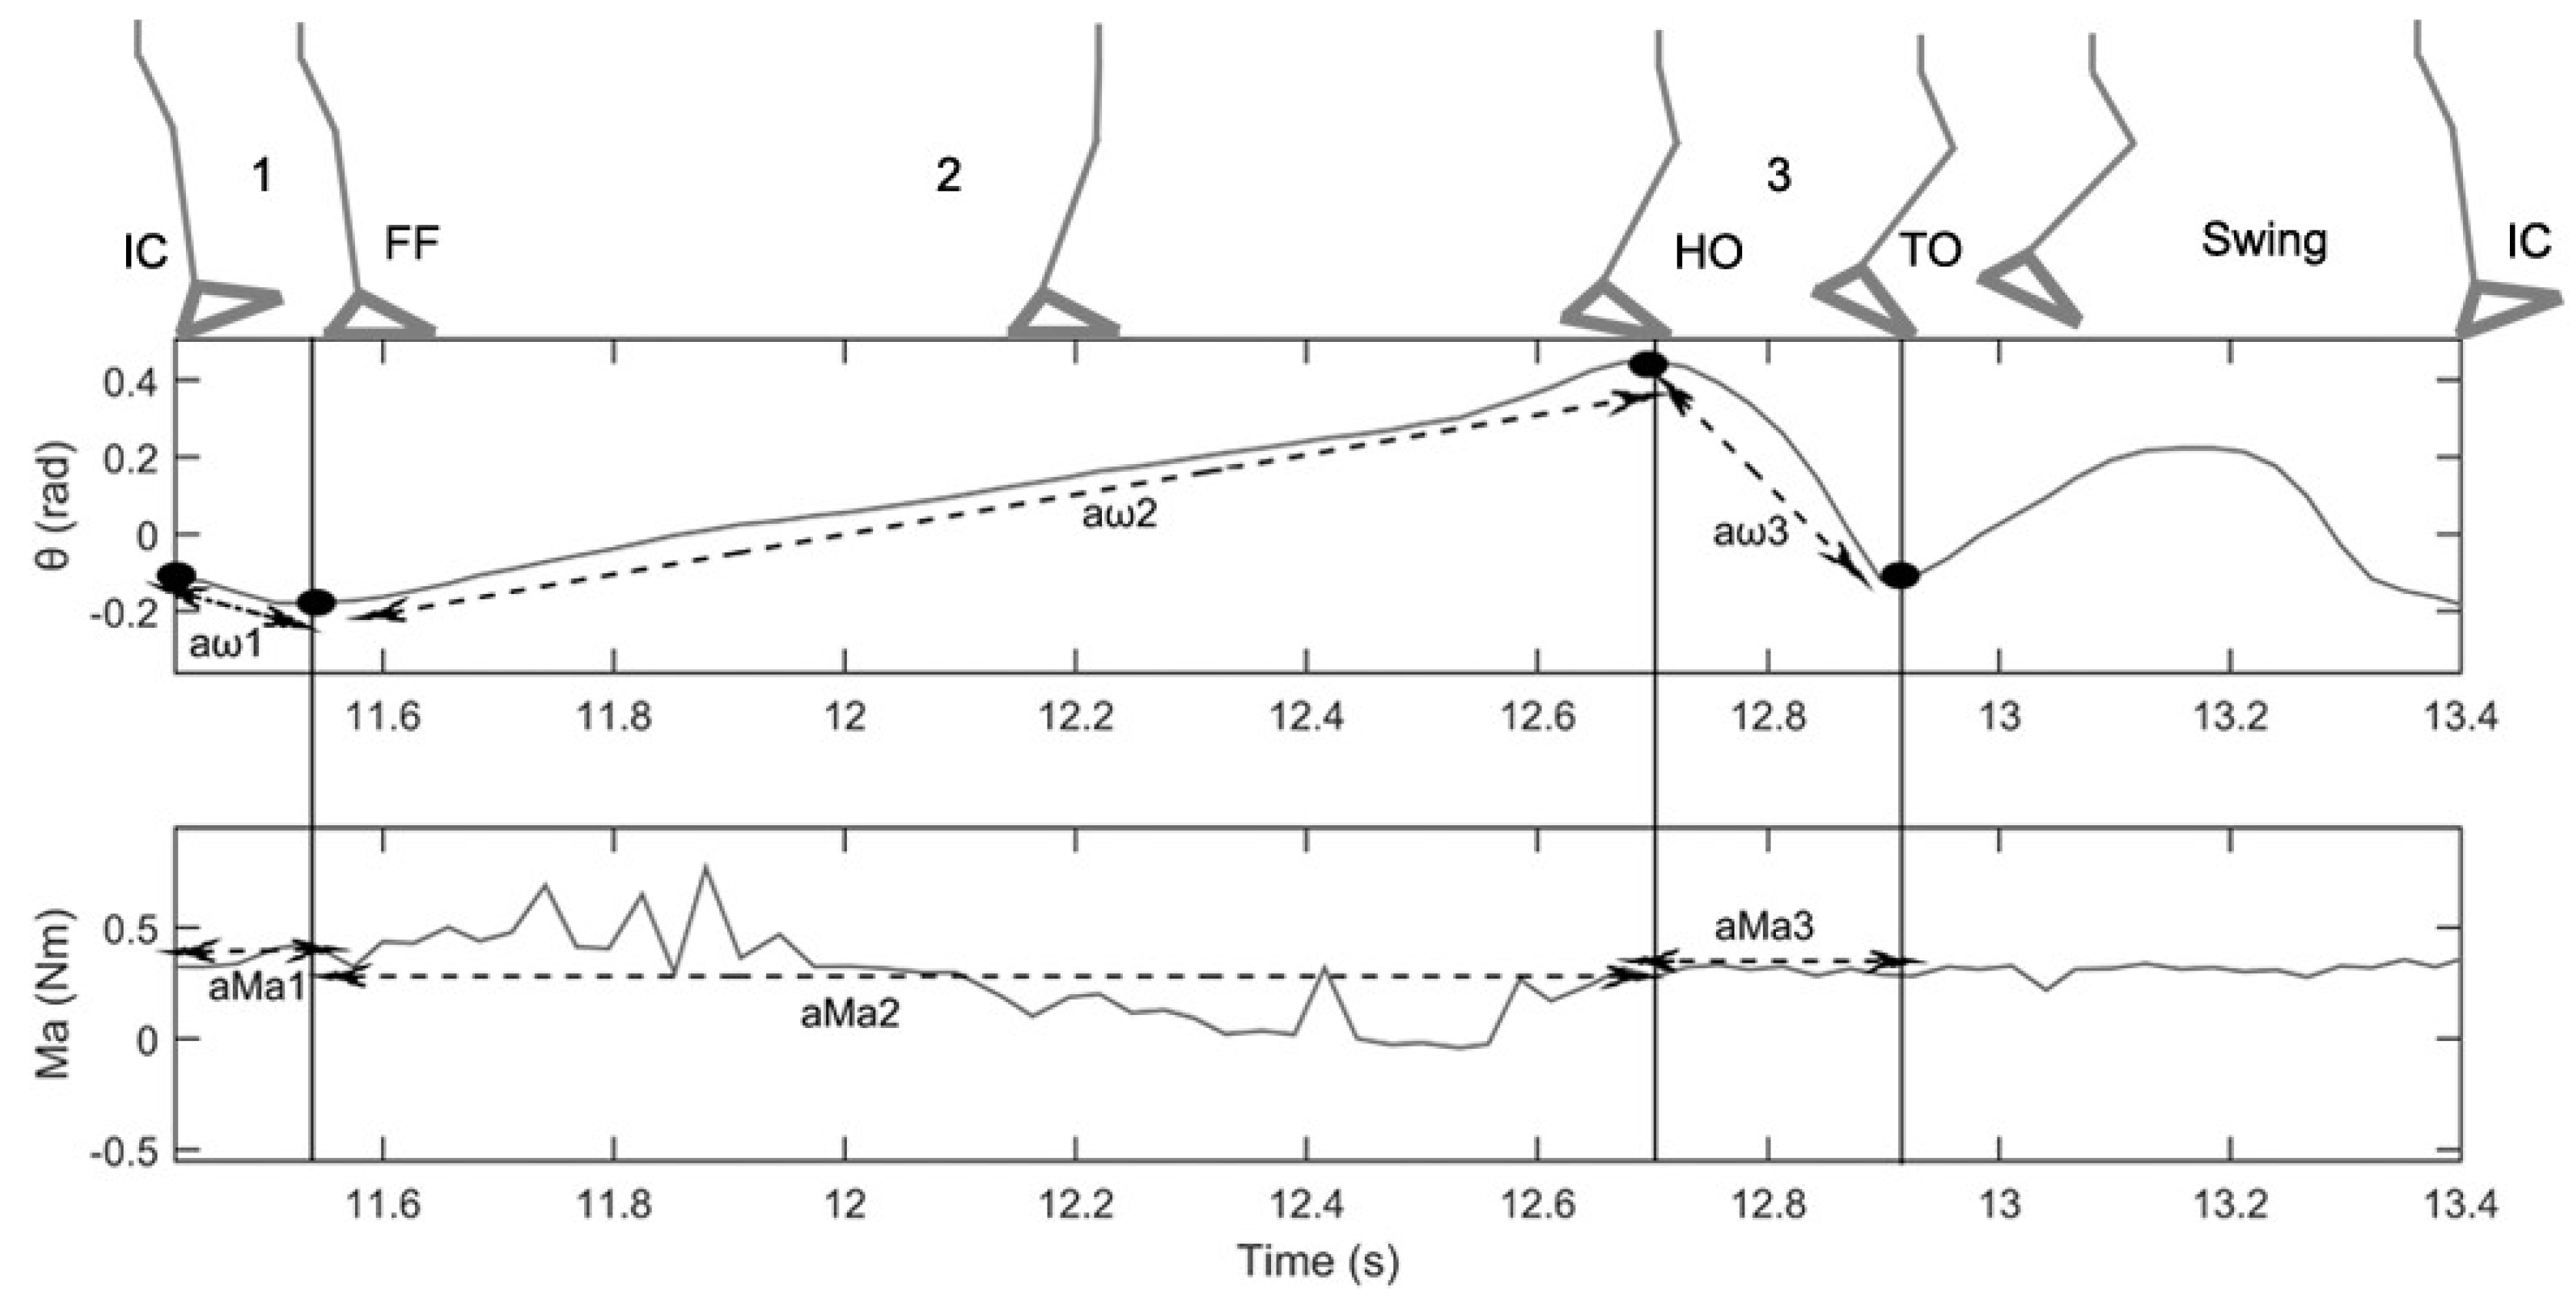
2.3. Data Analysis
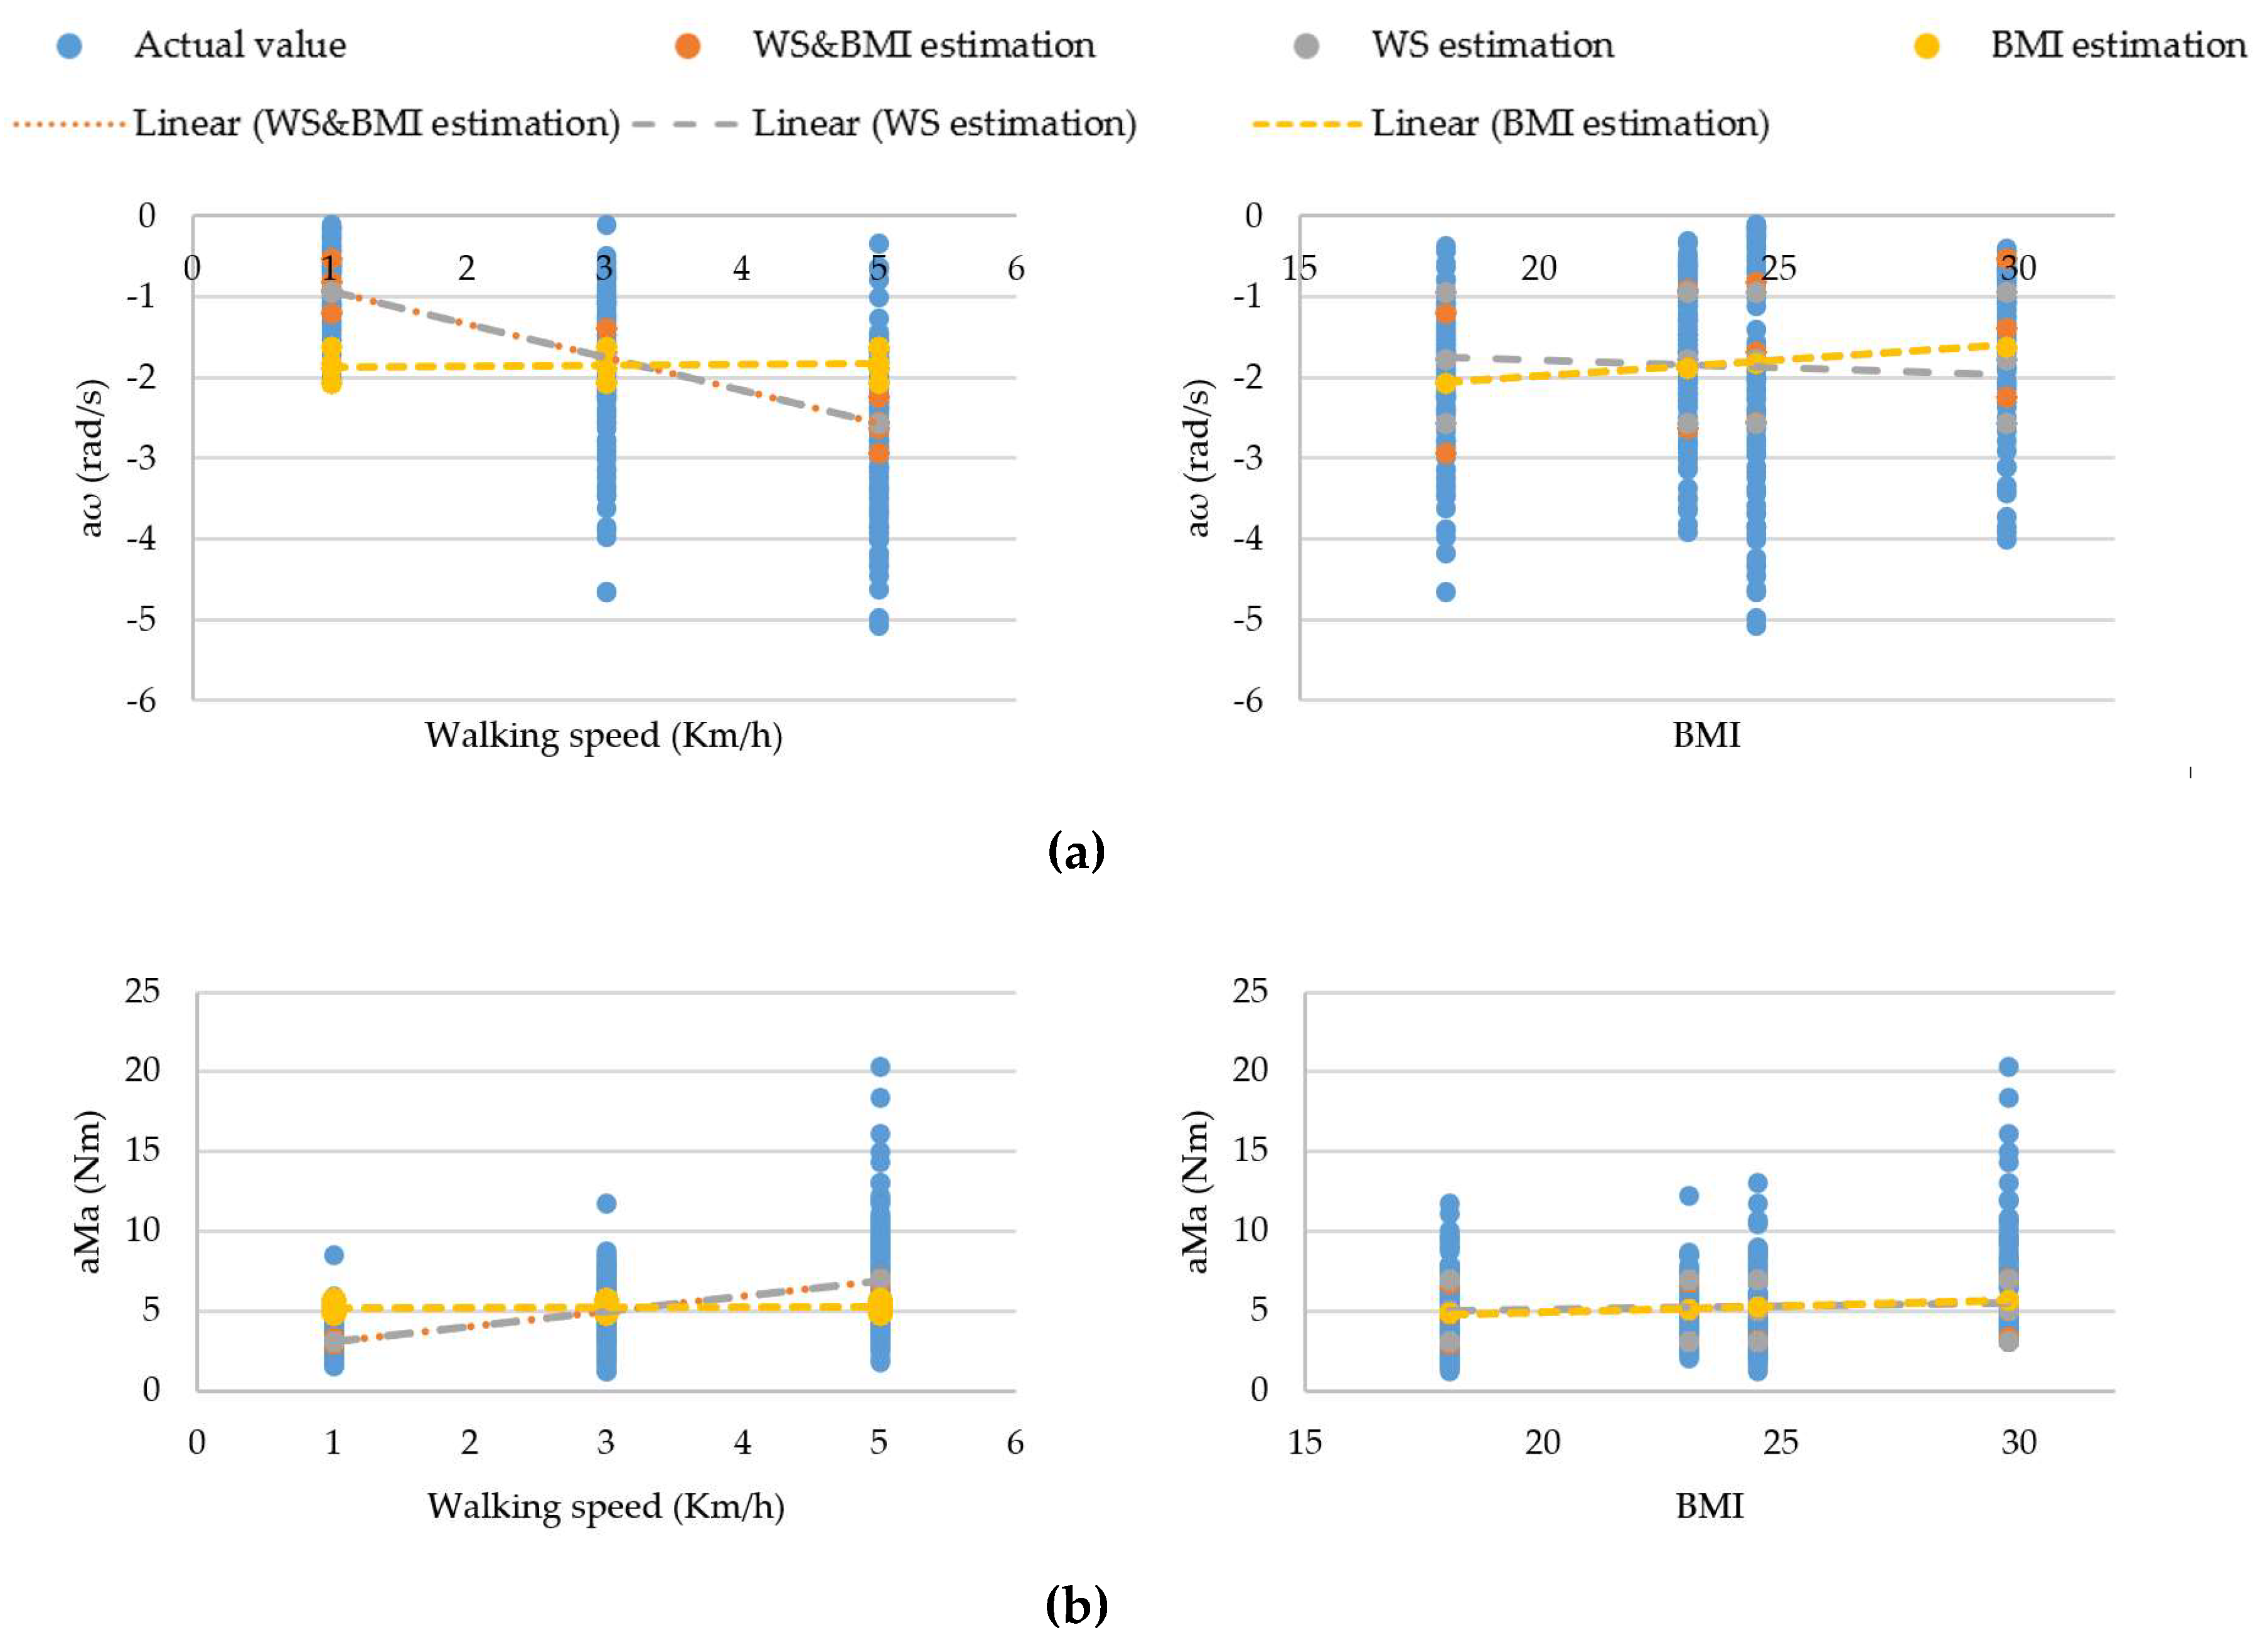
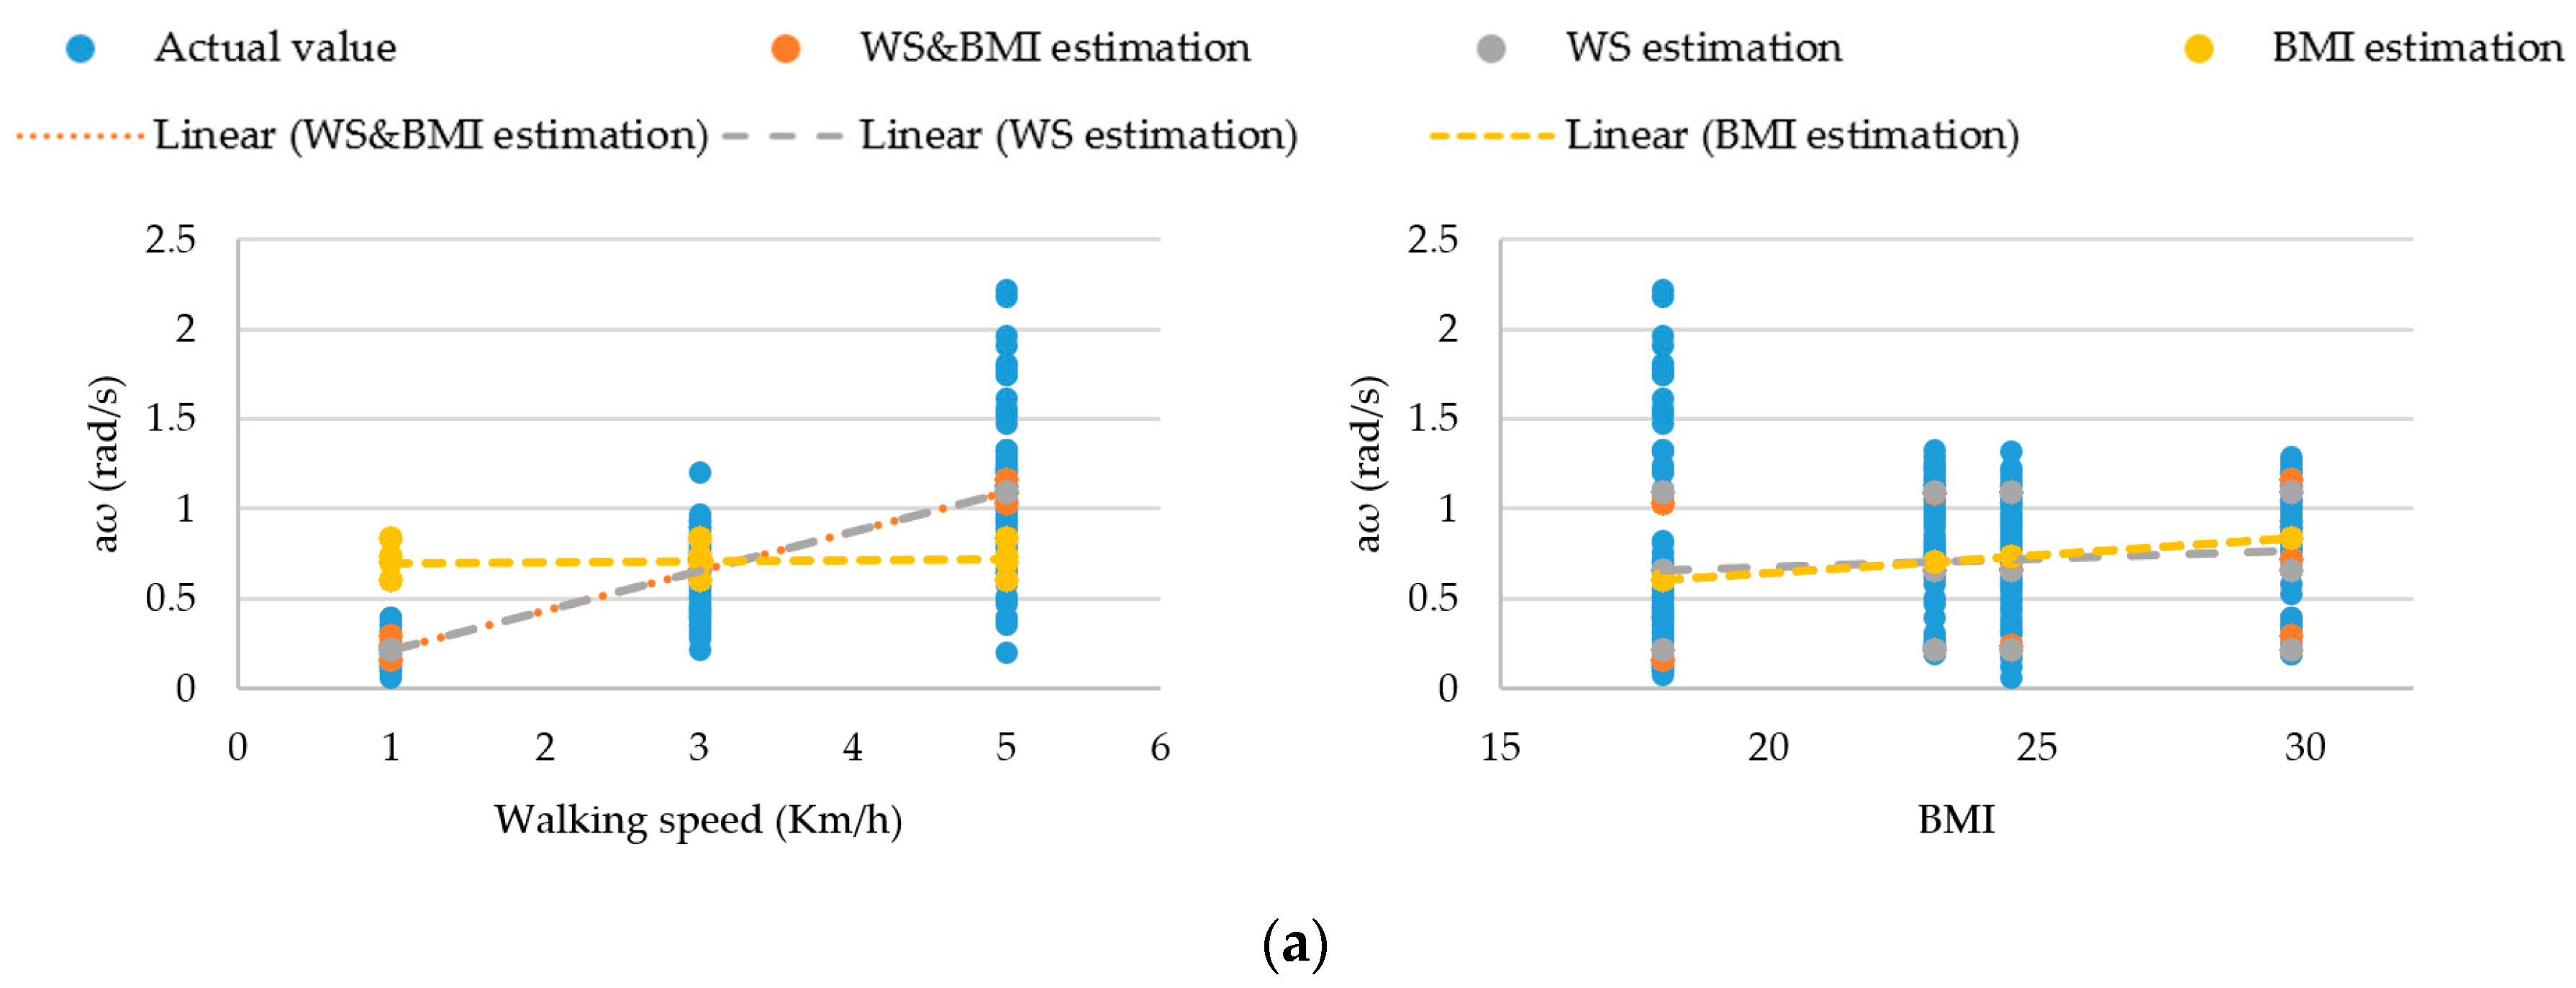
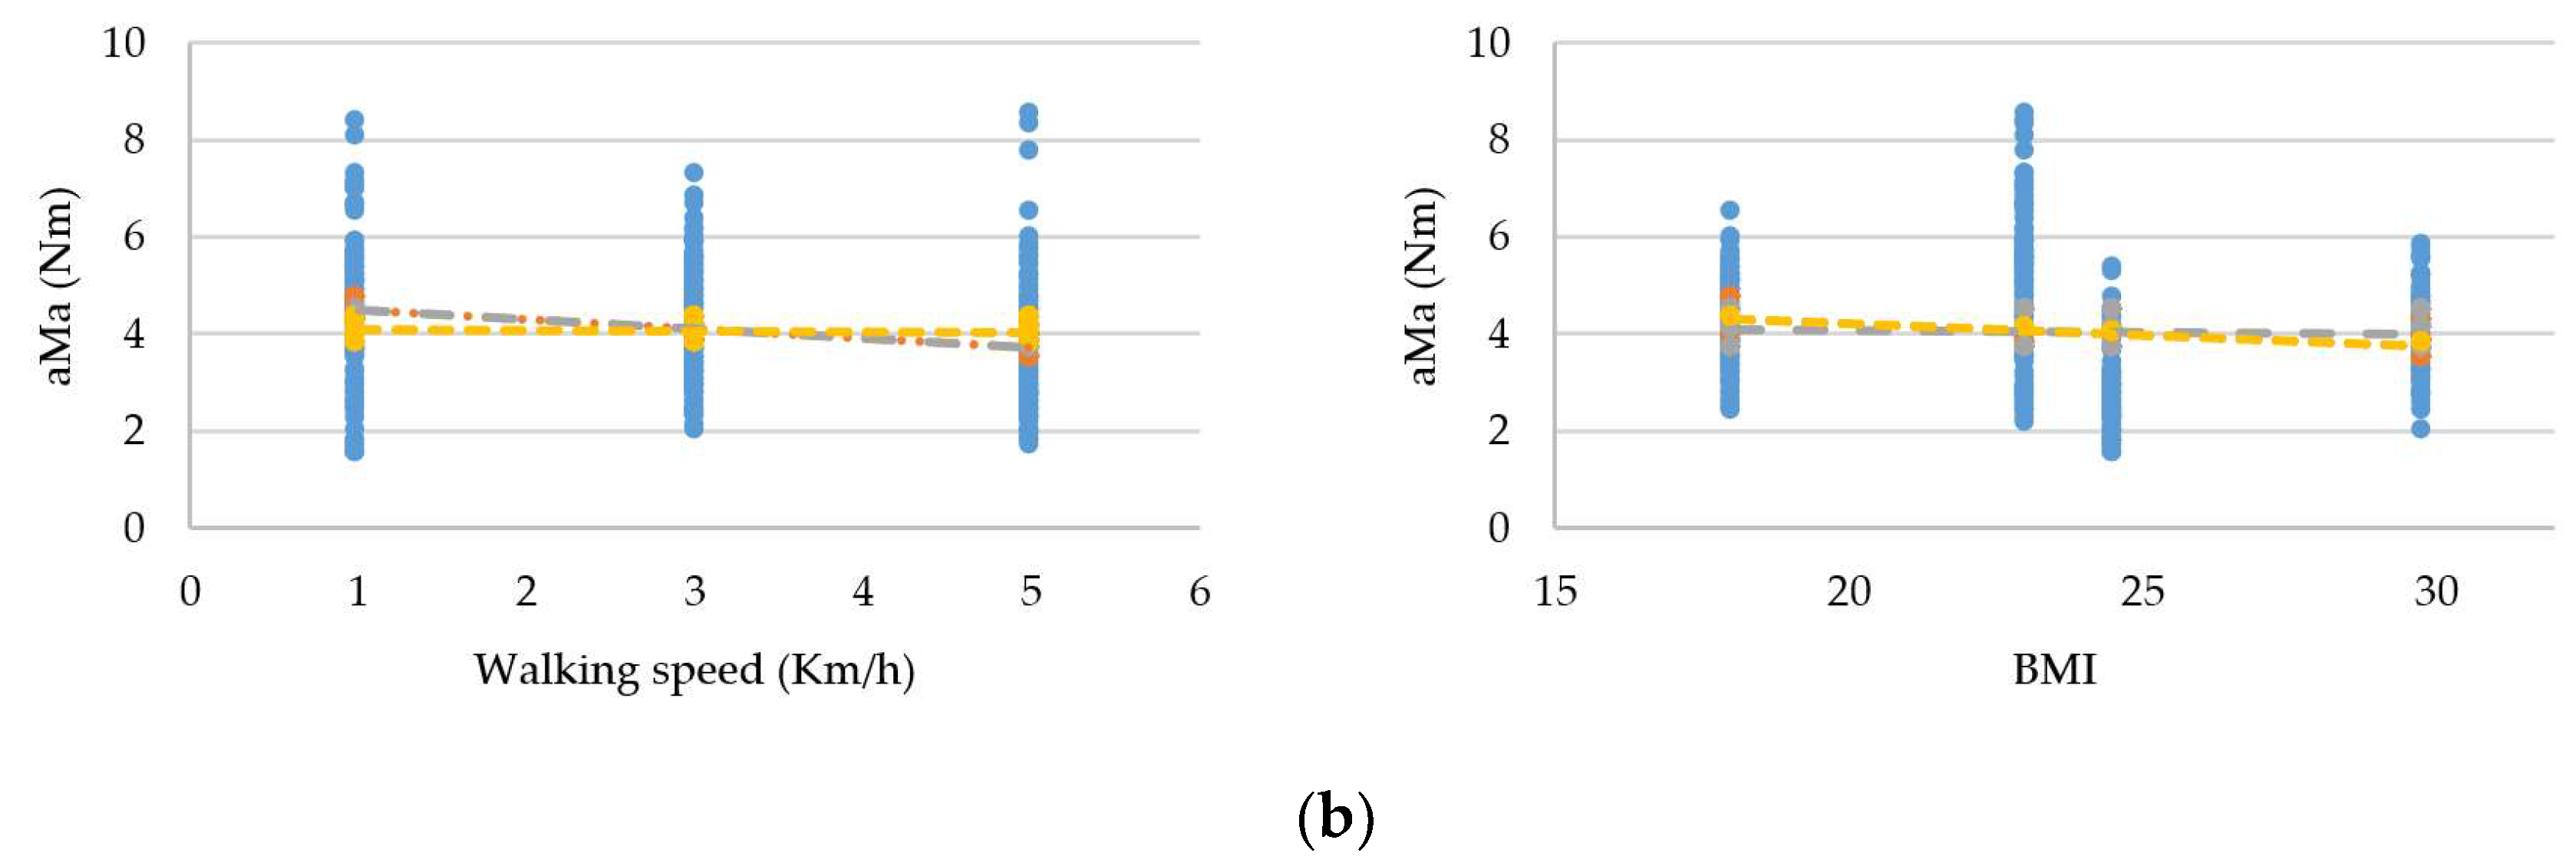
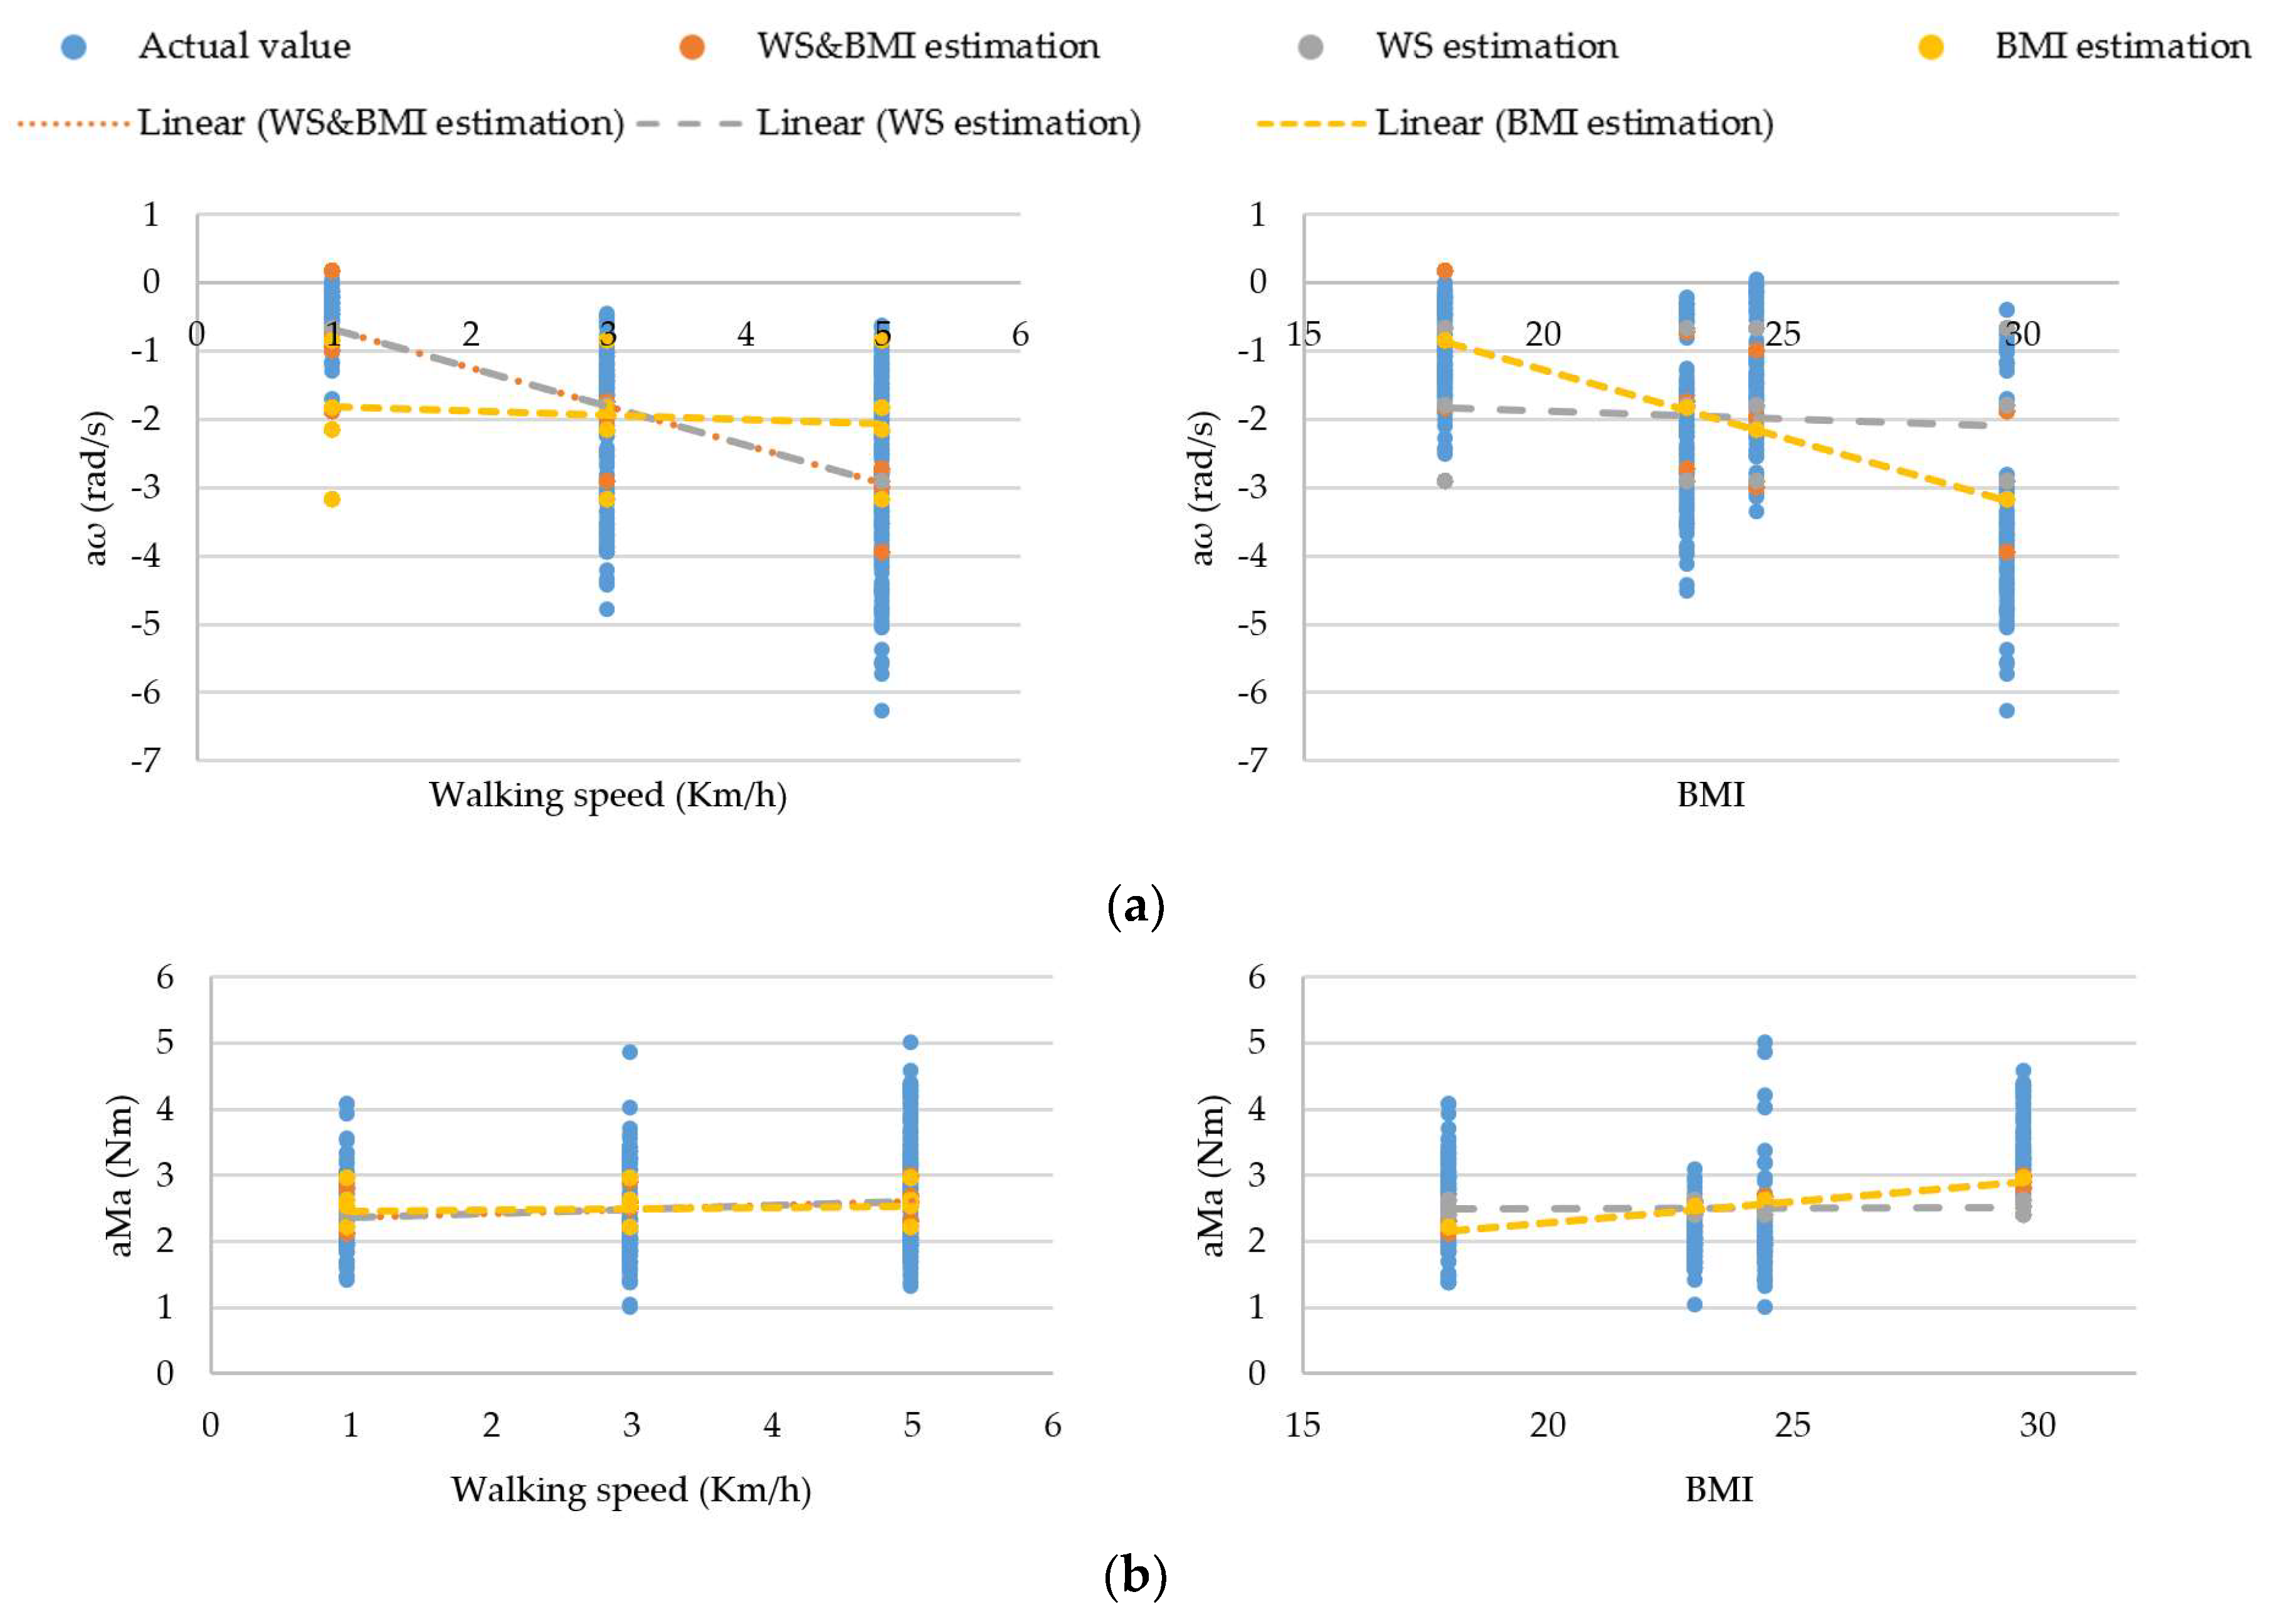
3. Result
4. Discussion
Author Contributions
Funding
Acknowledgments
Conflicts of Interest
References
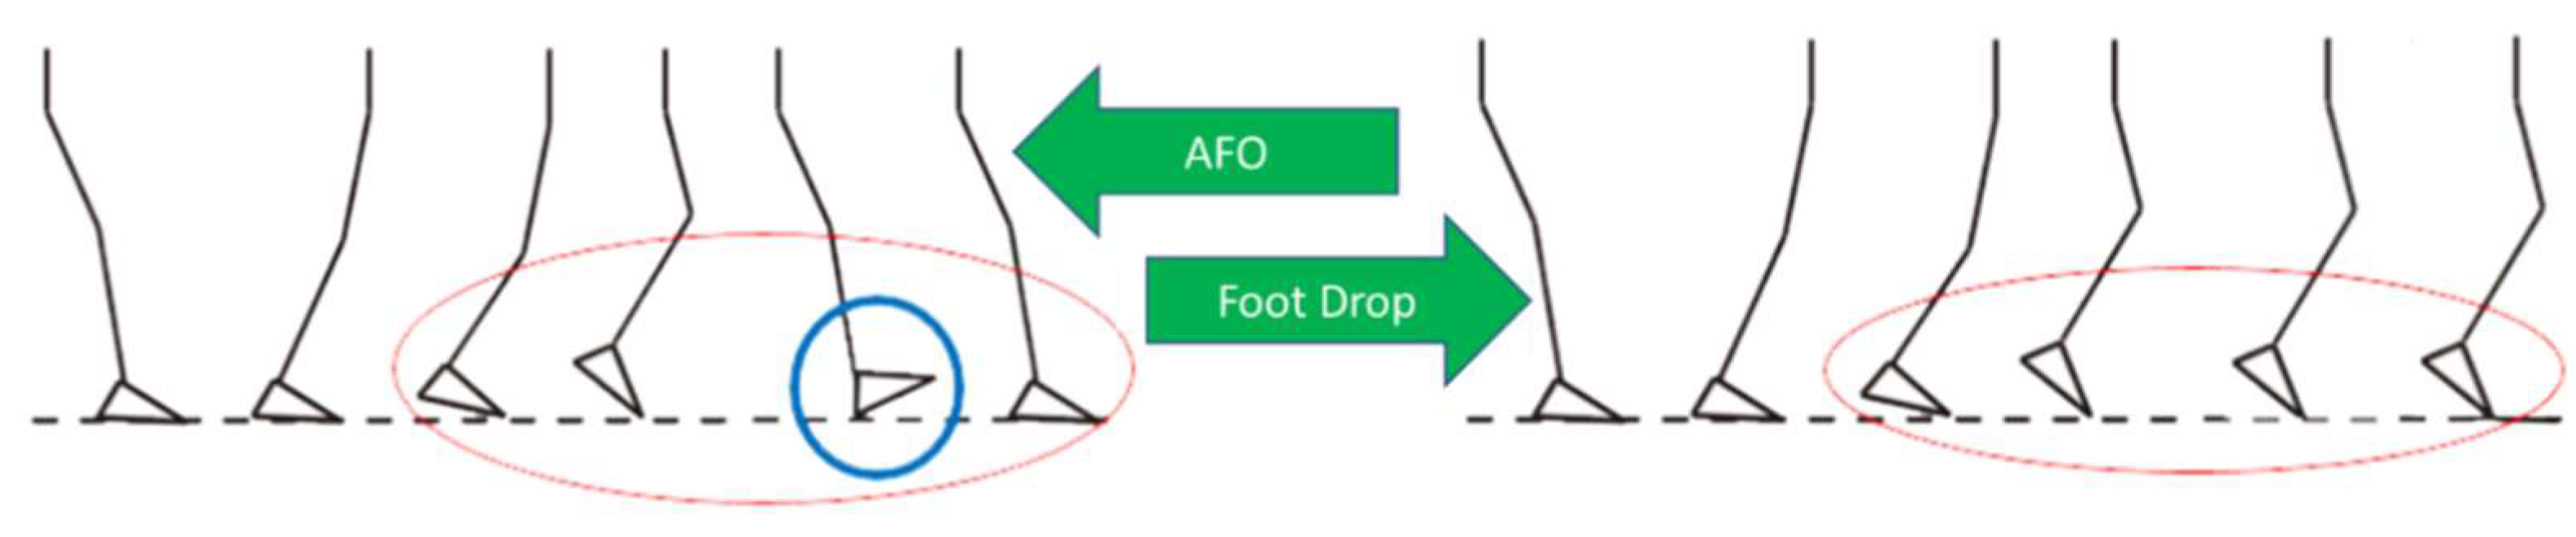
- Burridge, J.; Taylor, P.; Hagan, S.; Swain, I. Experience of clinical use of the Odstock dropped foot stimulator. Artif. Organs 1997, 21, 254–260. [Google Scholar] [CrossRef] [PubMed]
- Huo, W.; Mohammed, S.; Moreno, J.C.; Amirat, Y. Lower limb wearable robots for assistance and rehabilitation: A state of the art. IEEE Syst. J. 2016, 10, 1068–1081. [Google Scholar] [CrossRef]
- Alam, M.; Choudhury, I.A.; Mamat, A.B. Mechanism and design analysis of articulated ankle foot orthoses for drop-foot. Sci. World J. 2014, 2014. [Google Scholar] [CrossRef] [PubMed]
- Roche, N.; Bonnyaud, C.; Geiger, M.; Bussel, B.; Bensmail, D. Relationship between hip flexion and ankle dorsiflexion during swing phase in chronic stroke patients. Clin. Biomech. 2015, 30, 219–225. [Google Scholar] [CrossRef]
- Chisholm, A.E.; Perry, S.D.; McIlroy, W.E. Correlations between ankle-foot impairments and dropped foot gait deviations among stroke survivors. Clin. Biomech. 2013, 28, 1049–1054. [Google Scholar] [CrossRef]
- Tanida, S.; Kikuchi, T.; Kakehashi, T.; Otsuki, K.; Ozawa, T.; Fujikawa, T.; Yasuda, T.; Furusho, J.; Morimoto, S.; Hashimoto, Y. Intelligently controllable Ankle Foot Orthosis (I-AFO) and its application for a patient of Guillain-Barre syndrome. In Proceedings of the 2009 IEEE International Conference on Rehabilitation Robotics, Kyoto, Japan, 23–26 June 2009; pp. 857–862. [Google Scholar]
- Mahon, C.E.; Farris, D.J.; Sawicki, G.S.; Lewek, M.D. Individual limb mechanical analysis of gait following stroke. J. Biomech. 2015, 48, 984–989. [Google Scholar] [CrossRef]
- Collins, S.H.; Bruce Wiggin, M.; Sawicki, G.S. Reducing the energy cost of human walking using an unpowered exoskeleton. Nature 2015, 522, 212–215. [Google Scholar] [CrossRef]
- Mickelborough, J.; van der Linden, M.L.; Tallis, R.C.; Ennos, A.R. Muscle activity during gait initiation in normal elderly people. Gait Posture 2004, 19, 50–57. [Google Scholar] [CrossRef]
- Mishra, A.K.; Srivastava, A.; Tewari, R.P.; Mathur, R. EMG analysis of lower limb muscles for developing robotic exoskeleton orthotic device. Procedia Eng. 2012, 41, 32–36. [Google Scholar] [CrossRef][Green Version]
- Adiputra, D.; Nazmi, N.; Bahiuddin, I.; Ubaidillah, U.; Imaduddin, F.; Rahman, M.A.; Mazlan, S.A.; Zamzuri, H. A review on the control of the mechanical properties of ankle foot orthosis for gait assistance. Actuators 2019, 8, 10. [Google Scholar] [CrossRef]
- Delafontaine, A.; Gagey, O.; Colnaghi, S.; Do, M.-C.; Honeine, J.-L. Rigid ankle foot orthosis deteriorates mediolateral balance control and vertical braking during gait initiation. Front. Hum. Neurosci. 2017, 11, 214. [Google Scholar] [CrossRef] [PubMed]
- Bregman, D.J.J.; de Groot, V.; van Diggele, P.; Meulman, H.; Houdijk, H.; Harlaar, J. Polypropylene ankle foot orthoses to overcome drop-foot gait in central neurological patients: A mechanical and functional evaluation. Prosthet. Orthot. Int. 2010, 34, 293–304. [Google Scholar] [CrossRef] [PubMed]
- Tavernese, E.; Petrarca, M.; Rosellini, G.; Stanislao, E.D.; Pisano, A.; Rosa, G.D.; Castelli, E. Carbon Modular Orthosis (Ca.M.O.): An innovative hybrid modular ankle-foot orthosis to tune the variable rehabilitation needs in hemiplegic cerebral palsy. Neurorehabilitation 2017, 40, 447–457. [Google Scholar] [CrossRef] [PubMed]
- Schrank, E.S.; Hitch, L.; Wallace, K.; Moore, R.; Stanhope, S.J. Assessment of a virtual functional prototyping process for the rapid manufacture of passive-dynamic ankle-foot orthoses. J. Biomech. Eng. 2013, 135, 101011. [Google Scholar] [CrossRef] [PubMed]
- Frascarelli, F.; Masia, L.; Rosa, G.D.; Cappa, P.; Petrarca, M.; Castelli, E.; Krebs, H.I. The impact of robotic rehabilitation in children with acquired or congenital movement disorders. Eur. J. Phys. Rehabil. Med. 2009, 45, 135–141. [Google Scholar]
- Adiputra, D.; Mazlan, S.U.; Zamzuri, H.; Rahman, M.A. Fuzzy logic control for ankle foot equipped with magnetorheological brake. J. Teknol. 2016, 11, 25–32. [Google Scholar] [CrossRef]
- Adiputra, D.; Rahman, M.A.A.; Tjahjana, D.D.D.P.U.; Widodo, P.J.; Imaduddin, F. Controller development of a passive control ankle foot orthosis. In Proceedings of the International Conference on Robotics, Automation and Sciences, Melaka, Malaysia, 27–29 November 2017. [Google Scholar] [CrossRef]
- Adiputra, D.; Mazlan, S.A.; Zamzuri, H.; Rahman, M.A.A. Development of controller for Passive Control Ankle Foot Orthoses (PICAFO) based on Electromyography (EMG) signal and angle. In Proceedings of the Joint International Conference on Electric Vehicular Technology and Industrial, Mechanical, Electrical, and Chemical Engineering (ICEVT & IMECE), Surakarta, Indonesia, 4–5 November 2015; pp. 200–206. [Google Scholar]
- Nazmi, N.; Rahman, M.A.; Yamamoto, S.-I.; Ahmad, S.; Zamzuri, H.; Mazlan, S. A review of classification techniques of EMG signals during isotonic and isometric contractions. Sensors 2016, 16, 1304. [Google Scholar] [CrossRef]
- Nazmi, N.; Rahman, M.A.A.; Yamamoto, S.I.; Ahmad, S.A. Walking gait event detection based on electromyography signals using artificial neural network. Biomed. Signal Process. Control 2019, 47, 334–343. [Google Scholar] [CrossRef]
- Holgate, M.A.; Böhler, A.W.; Sugar, T.G. Control algorithms for ankle robots: A reflection on the state-of-the-art and presentation of two novel algorithms. In Proceedings of the 2nd Biennial IEEE/RAS-EMBS International Conference on Biomedical Robotics and Biomechatronics, Scottsdale, AZ, USA, 19–22 October 2008; pp. 97–102. [Google Scholar]
- Boehler, A.W.; Hollander, K.W.; Sugar, T.G.; Shin, D. Design, implementation and test results of a robust control method for a powered ankle foot orthosis (AFO). In Proceedings of the IEEE International Conference on Robotics and Automation, Pasadena, CA, USA, 19–23 May 2008; pp. 2025–2030. [Google Scholar]
- Blaya, J.A.; Herr, H. Adaptive control of a variable-impedance ankle-foot orthosis to assist drop-foot gait. IEEE Trans. Neural Syst. Rehabil. Eng. 2004, 12, 24–31. [Google Scholar] [CrossRef]
- Chen, B.; Zhao, X.; Ma, H.; Qin, L.; Liao, W.-H. Design and characterization of a magnetorheological series elastic actuator for a lower extremity exoskeleton. Smart Mater. Struct. 2017, 26, 105008. [Google Scholar] [CrossRef]
- Gordon, K.E.; Sawicki, G.S.; Ferris, D.P. Mechanical performance of artificial pneumatic muscles to power an ankle-foot orthosis. J. Biomech. 2006, 39, 1832–1841. [Google Scholar] [CrossRef] [PubMed]
- Gordon, K.E.; Ferris, D.P. Learning to walk with a robotic ankle exoskeleton. J. Biomech. 2007, 40, 2636–2644. [Google Scholar] [CrossRef] [PubMed]
- Fleischer, C.; Hommel, G. EMG-driven human model for orthosis control. In Human Interaction with Machines Workshop; Springer: Dordrecht, The Netherlands, 2006; pp. 69–76. [Google Scholar]
- Emmens, A.R.; van Asseldonk, E.H.F.; van der Kooij, H. Effects of a powered ankle-foot orthosis on perturbed standing balance. J. Neuroeng. Rehabil. 2018, 15, 50. [Google Scholar] [CrossRef]
- Kikuchi, T.; Tanida, S.; Otsuki, K.; Yasuda, T.; Furusho, J. Development of third-generation intelligently controllable ankle-foot orthosis with compact MR fluid brake. In Proceedings of the IEEE International Conference on Robotics and Automation, Anchorage, AK, USA, 3–7 May 2010; pp. 2209–2214. [Google Scholar]
- Jiménez-Fabián, R.; Verlinden, O. Review of control algorithms for robotic ankle systems in lower-limb orthoses, prostheses, and exoskeletons. Med Eng. Phys. 2012, 34, 397–408. [Google Scholar] [CrossRef]
- Kikuchi, T.; Tanida, S.; Yasuda, T.; Fujikawa, T. Automatic adjustment of initial drop speed of foot for intelligently controllable ankle foot orthosis. In Proceedings of the 2013 6th IEEE/SICE International Symposium on System Integration, Kobe, Japan, 15–17 December 2013; pp. 276–281. [Google Scholar]
- Naito, H.; Akazawa, Y.; Tagaya, K.; Matsumoto, T.; Tanaka, M. An ankle-foot orthosis with a variable-resistance ankle joint using a magnetorheological-fluid rotary damper. J. Biomech. Sci. Eng. 2009, 4, 182–191. [Google Scholar] [CrossRef]
- Guanziroli, E.; Cazzaniga, M.; Colombo, L.; Basilico, S.; Legnani, G.; Molteni, F. Assistive powered exoskeleton for complete spinal cord injury: Correlations between walking ability and exoskeleton control. Eur. J. Phys. Rehabil. Med. 2019, 55, 209–216. [Google Scholar] [CrossRef]
- Winter, D.A. Biomechanics and Motor Control of Human Movement; John Wiley & Sons: Hoboken, NJ, USA, 2009. [Google Scholar] [CrossRef]
- Grimmer, M.; Schmidt, K.; Duarte, J.E.; Neuner, L.; Koginov, G.; Riener, R. Stance and swing detection based on the angular velocity of lower limb segments during walking. Front. Neurorobot. 2019, 13, 57. [Google Scholar] [CrossRef]


| Anthropometric Parameters | Subject, Sb | Mean | Standard Deviation | |||
|---|---|---|---|---|---|---|
| 1 | 2 | 3 | 4 | |||
| Body mass (kg) | 45 | 61.3 | 70 | 97.5 | 68.45 | 21.964 |
| Height (m) | 1.58 | 1.63 | 1.69 | 1.81 | 1.678 | 9.912 |
| BMI | 18.026 | 23.072 | 24.509 | 29.761 | 23.842 | 4.827 |
| Gender | Male | Male | Male | Male | - | - |
| Age (year) | 29 | 25 | 25 | 29 | 27 | 2.310 |
| Foot mass (kg) | 2.353 | 2.589 | 2.715 | 3.114 | 2.693 | 0.276 |
| Foot length (m) | 0.135 | 0.14 | 0.15 | 0.17 | 0.1488 | 0.0134 |
| Anthropometric Parameters | Subject, Sb | Mean | Standard Deviation | |||
|---|---|---|---|---|---|---|
| 1 | 2 | 3 | 4 | |||
| I (kgm2 × 10−2) | 0.967 | 1.144 | 1.378 | 2.030 | 1.380 | 0.403 |
| CoG (m) | 0.064 | 0.067 | 0.071 | 0.081 | 0.071 | 0.006 |
| CoM, Ra (m) | 0.068 | 0.070 | 0.075 | 0.085 | 0.074 | 0.067 |
| Rtoe (m) | 0.028 | 0.018 | 0.015 | 0.015 | 0.019 | 0.005 |
| Rheel (m) | 0.122 | 0.132 | 0.135 | 0.135 | 0.131 | 0.005 |
| Case | Stance Phase | Critical Parameter | Control Reference | ||
|---|---|---|---|---|---|
| BMI | WS | aω | aMa | ||
| 1 | IC to FF | √ | √ | ||
| 2 | √ | √ | |||
| 3 | √ | √ | |||
| 4 | √ | √ | |||
| 5 | √ | √ | √ | ||
| 6 | √ | √ | √ | ||
| 7 | FF to HO | √ | √ | ||
| 8 | √ | √ | |||
| 9 | √ | √ | |||
| 10 | √ | √ | |||
| 11 | √ | √ | √ | ||
| 12 | √ | √ | √ | ||
| 13 | HO to TO | √ | √ | ||
| 14 | √ | √ | |||
| 15 | √ | √ | |||
| 16 | √ | √ | |||
| 17 | √ | √ | √ | ||
| 18 | √ | √ | √ | ||
| Phase | Regression Statistics | aω | aMa | ||||
|---|---|---|---|---|---|---|---|
| WS | BMI | WS & BMI | WS | BMI | WS & BMI | ||
| IC to FF | Multiple R (p1) | 0.625 | 0.159 | 0.666 | 0.558 | 0.117 | 0.560 |
| R Square (p12) | 0.391 | 0.025 | 0.444 | 0.311 | 0.014 | 0.314 | |
| Standard Error (Se1) | 0.822 | 1.040 | 0.786 | 2.253 | 2.695 | 2.251 | |
| FF to HO | Multiple R (p2) | 0.830 | 0.199 | 0.837 | 0.246 | 0.154 | 0.277 |
| R Square (p22) | 0.689 | 0.039 | 0.700 | 0.060 | 0.024 | 0.077 | |
| Standard Error (Se2) | 0.235 | 0.413 | 0.231 | 1.245 | 1.270 | 1.236 | |
| HO to TO | Multiple R (p3) | 0.645 | 0.607 | 0.839 | 0.130 | 0.357 | 0.369 |
| R Square (p32) | 0.416 | 0.368 | 0.705 | 0.017 | 0.128 | 0.136 | |
| Standard Error (Se3) | 1.060 | 1.103 | 0.755 | 0.742 | 0.699 | 0.696 | |
| Observations | 480 | 480 | 480 | 480 | 480 | 480 | |
| aω | ||||||
| IC to FF | Coefficients | Standard Error | Lower 95% | Upper 95% | t Stat | P-value |
| Intercept | −1.807 | 0.234 | −2.266 | −1.347 | −7.735 | <0.05 |
| WS | −0.431 | 0.025 | −0.481 | −0.380 | −16.898 | <0.05 |
| BMI | 0.058 | 0.010 | 0.039 | 0.077 | 6.035 | <0.05 |
| FF to HO | Coefficients | Standard Error | Lower 95% | Upper 95% | t Stat | P-value |
| Intercept | −0.238 | 0.069 | −0.372 | −0.103 | −3.461 | <0.05 |
| WS | 0.216 | 0.007 | 0.202 | 0.231 | 28.889 | <0.05 |
| BMI | 0.011 | 0.003 | 0.005 | 0.016 | 3.740 | <0.05 |
| HO to TO | Coefficients | Standard Error | Lower 95% | Upper 95% | t Stat | P-value |
| Intercept | 3.841 | 0.224 | 3.400 | 4.282 | 17.126 | <0.05 |
| WS | −0.508 | 0.024 | −0.557 | −0.460 | −20.783 | <0.05 |
| BMI | −0.177 | 0.009 | −0.195 | −0.159 | −19.244 | <0.05 |
| aMa | ||||||
| IC to FF | Coefficients | Standard Error | Lower 95% | Upper 95% | t Stat | P-value |
| Intercept | 1.348 | 0.669 | 0.033 | 2.662 | 2.015 | <0.05 |
| WS | 0.939 | 0.073 | 0.796 | 1.082 | 12.874 | <0.05 |
| BMI | 0.035 | 0.003 | −0.019 | 0.089 | 1.281 | 0.201 |
| FF to HO | Coefficients | Standard Error | Lower 95% | Upper 95% | t Stat | P-value |
| Intercept | 5.572 | 0.367 | 4.850 | 6.294 | 15.172 | <0.05 |
| WS | −0.187 | 0.040 | −0.265 | −0.108 | −4.659 | <0.05 |
| BMI | −0.039 | 0.015 | −0.068 | −0.009 | −2.565 | <0.05 |
| HO to TO | Coefficients | Standard Error | Lower 95% | Upper 95% | t Stat | P-value |
| Intercept | 0.930 | 0.207 | 0.523 | 1.337 | 4.495 | <0.05 |
| WS | 0.042 | 0.023 | −0.002 | 0.087 | 1.881 | 0.061 |
| BMI | 0.061 | 0.008 | 0.045 | 0.078 | 7.225 | <0.05 |
© 2019 by the authors. Licensee MDPI, Basel, Switzerland. This article is an open access article distributed under the terms and conditions of the Creative Commons Attribution (CC BY) license (http://creativecommons.org/licenses/by/4.0/).
Share and Cite
Adiputra, D.; Abdul Rahman, M.A.; Ubaidillah; Mazlan, S.A.; Nazmi, N.; Shabdin, M.K.; Kobayashi, J.; Mohammed Ariff, M.H. Control Reference Parameter for Stance Assistance Using a Passive Controlled Ankle Foot Orthosis—A Preliminary Study. Appl. Sci. 2019, 9, 4416. https://doi.org/10.3390/app9204416
Adiputra D, Abdul Rahman MA, Ubaidillah, Mazlan SA, Nazmi N, Shabdin MK, Kobayashi J, Mohammed Ariff MH. Control Reference Parameter for Stance Assistance Using a Passive Controlled Ankle Foot Orthosis—A Preliminary Study. Applied Sciences. 2019; 9(20):4416. https://doi.org/10.3390/app9204416
Chicago/Turabian StyleAdiputra, Dimas, Mohd Azizi Abdul Rahman, Ubaidillah, Saiful Amri Mazlan, Nurhazimah Nazmi, Muhammad Kashfi Shabdin, Jun Kobayashi, and Mohd Hatta Mohammed Ariff. 2019. "Control Reference Parameter for Stance Assistance Using a Passive Controlled Ankle Foot Orthosis—A Preliminary Study" Applied Sciences 9, no. 20: 4416. https://doi.org/10.3390/app9204416
APA StyleAdiputra, D., Abdul Rahman, M. A., Ubaidillah, Mazlan, S. A., Nazmi, N., Shabdin, M. K., Kobayashi, J., & Mohammed Ariff, M. H. (2019). Control Reference Parameter for Stance Assistance Using a Passive Controlled Ankle Foot Orthosis—A Preliminary Study. Applied Sciences, 9(20), 4416. https://doi.org/10.3390/app9204416