Abstract
Plastic and rubber based composites containing carbon black (CB) were investigated for the potential to release CB nano-particulates under stress conditions into food simulants. Nanocomposites were exposed to thermal, chemical, and mechanical stress, followed by mechanical abrasion of their surface. Particle sensitive asymmetric flow field-flow fractionation (AF4) with multi angle laser light scattering (MALLS) detection was used to detect and quantify CB nano-particulates. This study demonstrates that, even under dynamic stress conditions, CB nano-particulates are not released from the plastic or rubber compounds into food. This study intends also to propose a general nano-release stress test protocol for plastic materials coming into contact with foodstuff.
1. Introduction
This article is the first in a series of two dealing with the investigation of the potential release of Nanomaterials (NMs) from nanocomposites under intense material stress conditions. NMs offer new or improved properties when used in food packaging materials, but to date there is no broad agreement whether the use of NMs in such products could lead to higher risk for consumers [1,2,3,4]. Risk is the product of hazard (toxicological properties) and exposure [5], thus the risk of NMs that are used in nanocomposites can be assessed by determining whether the NMs are able to be released from packaging into foodstuff at all, and if yes, to which degree.
The number of studies dealing with the potential diffusion based migration of NMs has significantly increased in the last ten years. An overview of the published literature can be found in the reviews by Duncan et al., Kuorwel et al. and Störmer et al. [6,7,8]. Results from these migration studies are often inconsistent and in some cases even contradictory. Positive migration results were typically found either when direct contact of the food (simulant) with the NM was possible e.g., at cutting edges of the test specimen or when the surrounding matrix caused severe interactions with the nanocomposite e.g., due to the swelling or even degradation of the polymer. The investigation of nanocomposites in contact with complex matrices like food or food simulants is still a new analytical field that certainly requires a different analytical approach than for the investigation of classical polymer compounds. The occurrence of experimental errors or artefacts due to inadequate experimental designs might also play a non-negligible role. This issue finds, however, insufficient consideration in the reported studies so far. A comprehensive experimental design (i.e., sample preparation, storage conditions of the samples, matrix interactions, and the choice of analytical method for the detection of NMs) should respect the particulate nature and the stability of the investigated NM at any time during the whole migration experiment, including sample preparation steps and analytical methods.
The inherent complexity of the migration studies on nanocomposites is one reason why risk assessment of NMs still has to be performed on a case-by-case basis [9]. When considering the potential migration of NMs from polymers, it is generally accepted though that NMs are too large to have a significant mobility within a polymer matrix and thus do not have the potential to migrate due to diffusion in the polymer [10,11]. In these studies, supported by migration modelling, a “cut-off diameter” for diffusion of 3–4 nm was derived for NMs incorporated into polyolefins and 1–2 nm in polyethylene terephthalate (PET) or similar polymers. In practice, these small NM sizes are not encountered in nanocomposites that are used as food contact material (FCM). Thus, exposure for consumers will not take place, especially when the NM is fully embedded within the polymer (i.e., fully dispersed and incorporated in the matrix) when mechanical release can also be excluded.
The above mentioned modelling of NM migration considered carbon black (CB) as a worst-case model substance that overestimates the migration of any other NM, due to the low molecular weight of carbon. CB, with its aciniform structure, whereby primary particles are fused together to form aggregates, presents diameters that are well above the mentioned cut-off diameters. Besides theoretical considerations, the non-migration of CB from plastic food packaging materials was experimentally demonstrated in a static migration test [12].
Migration scenarios other than diffusion-based are conceivable: (i) dissolution of the NMs by the contact medium (e.g., acidic food or simulant) either in the polymer matrix or after release and (ii) the desorption of NMs that are not fully embedded in the polymeric matrix (e.g., located at the surface of the nanocomposite) or release of NMs after degradation of the polymeric matrix [6,13,14]. Depending on the intended use of the FCM such release scenarios might be linked to or induced by mechanical, thermal or chemical stress that weakens the polymer.
The intention of this study was to investigate the influence of mechanical, thermal, and chemical stress conditions that were applied to nanocomposites, followed by the potential release of NMs into food simulants and to propose an appropriate test regimen. The stress conditions should include a dynamic mechanical abrasion treatment to simulate the worse case conditions of real-life handling and use of the FCM. This is the first article in a series of two deals with the experimental design in detail and delivers results regarding the potential release of nanoparticles from CB-nanocomposites. In the second article [15] the same release test was performed on other nanocomposites using nanosilver, nano-titanium nitride, and nano-laponite. Together with CB, all four nanomaterials represent, due to their structural and chemical composition, a broad range of nanomaterials that might find application as nano additives in plastic FCMs.
2. Materials and Methods
2.1. Materials
Four different CB grades were selected. Printex® 80 (Orion Engineered Carbons GmbH, Frankfurt am Main, Germany) and Printex® 85 (Orion Engineered Carbons GmbH, Frankfurt am Main, Germany) are typical grades used in plastic food packaging while N550 and N772 are widely used in rubber applications (e.g., gaskets used in the food processing industry). All four CB materials were provided as powder, along with the corresponding plastics (low density polyethylene (LDPE)) and rubber (ethylene propylene diene monomer (EPDM)) plaques. Printex® 80 and Printex® 85 samples (as powders as well as incorporated into LDPE plaques of 90 × 60 × 3 mm) were provided by (Orion Engineered Carbons GmbH, Frankfurt am Main, Germany) on behalf of the International Carbon Black Association (ICBA, New Orleans, LA, USA). N550 and N772 samples (as powders as well as incorporated into EPDM plaques of 140 × 140 × 2 mm) were provided by Birla Carbon (Marietta, GA, USA) on behalf of the ICBA. An overview of the test samples and the typical CB properties are given in Table 1 and Table 2, respectively.

Table 1.
Low density polyethylene (LDPE) and ethylene propylene diene monomer (EPDM) based carbon black (CB)-nanocomposites used as test materials.
Table 2.
Typical properties of the CB grades.
2.2. Nano-Release Study-General Experimental Design
A damaged nanocomposite’s surface might exhibit NMs that are not fully covered with polymer anymore and thus partially protrude the polymer. In turn, this scenario might facilitate the release of NMs when the nanocomposite gets in contact with food. The objective of the stress test was to simulate foreseeable real-life stress conditions on plastics and rubber materials and to see whether or not a stress-induced release of NMs is possible. The general experimental design of the so-called nano-release experiment is schematically displayed in Figure 1. The experiment can be subdivided into three parts:
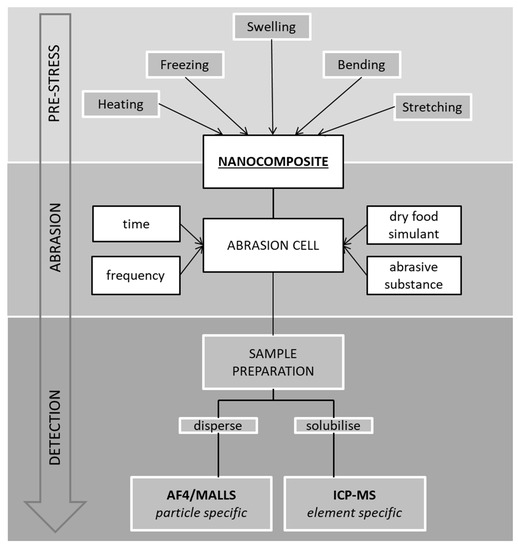
Figure 1.
Schematics of the mechanical nano-release test procedure.
- Pre-stress:relevant mechanical, thermal, and chemical stress conditions that are realistic in practice
- Abrasion test:basic stress test to see whether NMs can be abraded from the nanocomposite’s surface using a dry simulant with an abrasive character simulating intensive use and handling of the nanocomposite.
- Analytical detection of released NMs:depending on the nature of NM, particle- and/or element-specific detection techniques are used to demonstrate whether or not NMs were released from the nanocomposite
During the abrasion test, the nanocomposite is placed in an abrasion cell, loaded with a dry substance, and shaken on a laboratory shaker. Parameters are set to allow the dry substance to homogeneously scrub over a defined area of the nanocomposite’s surface. The type and amount of the dry substance (e.g., salt or sand as an alternative food simulant) as well as the duration and intensity (frequency) of the shaking can be adjusted to achieve an intense but homogeneous abrasion of the surface. The abraded material and the dry food simulant are subsequently collected and analyzed for the presence of potential NMs through Asymmetrical Flow Field-Flow Fractionation (AF4), with Multi-Angle Laser Light Scattering (MALLS) detection for particulate substances (“particle specific”), and/or, if applicable, Inductively Coupled Plasma Mass Spectrometry (ICP-MS) for the solubilized particle-specific elements (“element specific”). In this study, with the case of CB as NM, element specific measurement was not applied due to the inapplicability of ICP-MS to the determination of carbon.
2.2.1. Basic Material Stressing-Abrasion Test
Disks of 53 mm (LDPE samples) and 90 mm (EPDM samples) in diameters were cut out from the nanocomposite plaques and placed in two models of glass Petri dish used as abrasion cells, whereby one contains the nanocomposite and the other one is used as lid (Figure 2).
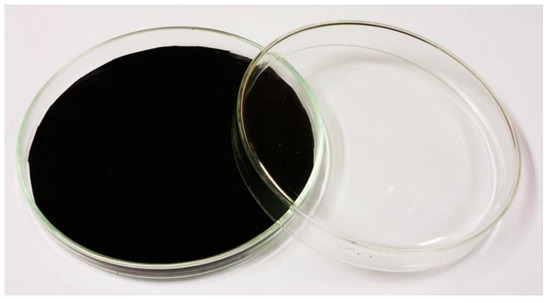
Figure 2.
Ethylene propylene diene monomer (EPDM)-based nanocomposite in an abrasion cell that consists of two glass Petri dishes.
Quartz sand (Büchi Labortechnik GmbH, Essen, Germany) was used as dry-food simulant with abrasive character. This quartz sand exhibits sufficient small grain sizes and hardness to provide homogeneous friction on the polymer’s surface. Sodium chloride was also tested as alternative dry food simulant, but it caused problems during the analytical measurements. 0.5 g of quartz sand was added in the small cells (d = 53 mm for LDPE samples) with a contact surface of 0.22 dm2. Large cells (d = 90 mm for EPDM samples) were loaded with 1.0 g of quartz sand with 0.64 dm2 sample contact area. All of the cells were sealed with parafilm to keep them closed and tight.
The abrasion cells were then placed on an orbital shaker (GFL 3017, Gesellschaft für Labortechnik, Burgwedel, Germany) causing the sand to homogeneously scrub the plastics and rubber surface at 250 rpm for 30 min. Tests were performed in triplicates.
Upon completion of the abrasion period, all loose solids i.e., the sand and eventually abraded material, were carefully transferred into 15 mL centrifugal vials. The disks were rinsed with 96% ethanol and the liquid collected into the same centrifugal vials. The vials were then filled with 96% ethanol to the 15 mL mark and then shaken for 15 min to detach and disperse any potential loose CB particulates that might have been abraded. The vials were finally left to rest for 10 min for the sand to settle down. Approximately 5 mL of the clear supernatants were carefully transferred into sample vials for AF4 analysis.
2.2.2. Additional Material Stress Conditions that Might Induce the Release of CB
The abrasion test described above is the basic dynamic test to stress the nanocomposite’s surface and to pick-up the potentially abraded CB nano-particulates. In real life, the FCM could be exposed to other mechanical constraints, thermal cycles, or aggressive chemicals that could further weaken the polymer and thus facilitate the release of NMs after abrasion. Such potential stress situations were simulated in this study, as follows.
- Thermal stress by heat:The LDPE and EPDM compounds were placed in closed foil pans and stored at 100 °C for 24 h in a temperature controlled oven.
- Thermal stress by freezing:The LDPE and EPDM compounds were placed in closed foil pans and stored at −50 °C for 24 h in a temperature controlled freezer.
- Chemical stress by swelling with solvents:The LDPE and EPDM compounds were placed in stainless steel cells, immersed in 100 mL of isooctane or toluene for LDPE and EPDM, respectively, and then stored for 24 h at 40 °C in a temperature controlled oven. All samples were stored for two days under a fume-hood to evaporate any remaining solvent prior to being subjected to the abrasion test.
- Mechanical stress test by stretching:Rectangular strips of 88 × 59 × 3 mm and of 88 × 59 × 2 mm were prepared from the LDPE and EPDM plaques, respectively. These specimens were clamped in a universal tensile strength testing apparatus equipped with a traverse path sensor. The LDPE strips were vertically stretched by 5 mm and the EPDM specimens by 50 mm. Cut-outs for the subsequent abrasion test were taken from the center of the strips.
Each “pre-stress” material treatment was followed by the basic abrasion test, as described above.
2.3. Analytical Set-Up for the Detection of CB Nano-Particulates in the Abrasion
2.3.1. Preparation of CB Reference Dispersions
100 mg/L stock dispersion of each of the CB powders (Printex® 80, Printex® 85, N550 and N772) was prepared in 96% ethanol. 10 mg of CB were placed in 50 mL centrifugal vials and filled with 40 mL 96% ethanol. To break the agglomerates, the dispersions were sonicated for 10 min using an ultra-sonication tip (Vibra Cell VC 50T, Sonics & Materials Inc., Newtown, CT, USA, 50 Watt, 20 kHz, operated at 100% output), which was placed directly into the centrifugal vials. All dispersions were then quantitatively transferred into 100 mL measuring flasks and filled to the mark with 96% ethanol. All four dispersions in ethanol remained stable, even after storage for more than 24 h at room temperature.
2.3.2. AF4 and MALLS Measurements
The AF4 measurements were carried out with an “AF2000 MT Series mid temperature” (Postnova Analytics, Landsberg, Germany). The system was equipped with a 350 µm channel and a cellulose membrane (cut-off: 5 kDa). For the determination of the particles size distribution, a 21-angle-MALLS detector “PN3621” (Postnova Analytics, Landsberg, Germany) was used.
CB nano-particulates of all four dispersions were separated using the following AF4 method. At an injection flow of 0.2 mL/min 1 mL of the respective CB dispersion was injected and focused into the AF4 system for 10 min. The optimized AF4 conditions for the CB dispersions are as follows. The cross-flow was kept constant at 2.5 mL/min (start conditions). Within a transition time of 1 min, the focusing of the sample was terminated and the elution of sample started. The cross-flow was then rapidly reduced linearly to 1.5 mL/min within 0.4 min, followed by a parabolic decrease (power gradient 0.20) to 0.1 mL/min in 10 min, and another linear reduction to 0 mL/min in another 10 min. The channel was flushed at the end by the detector flow for 10 min without any cross flow to empty the channel completely. The detector flow was kept constant at 0.7 mL/min for the entire run. The channel was maintained at a temperature of 40 °C.
To correlate the MALLS detector outputs with the injected mass of CB, the diluted reference dispersions were used for MALLS calibration. For all CB dispersions, a series of dilutions from a fresh 100 mg/L stock dispersion were prepared at 0 (blank), 5, 10, 25, 50, 75, 100, and 125 ng/mL in 96% ethanol. The AF4 fractograms were integrated at all detection angles (except the 7° angle) of the MALLS detector to obtain the peak areas that are directly proportional to the injected mass.
The CB material was completely dispersed in 96% ethanol with no sediment, thus the weighed mass of CB corresponds to the mass of CB in the dispersion. The CB standard dispersions can therefore be used for calibration of the MALLS output by the peak areas.
Furthermore, the results of the light scattering experiment were used to calculate the aggregate size of the dispersed CB through the radius of gyration, rg.
3. Results
3.1. Characterisation and Quantification of CB in Dispersion
The signals at all MALLS detector angles (except the 7° angle) were used to calculate the CB particle size distribution (PSD) using a random coil fit in the software. For this exercise, 75 ng/mL dispersions were used for PX 80 and PX 85 and 125 ng/mL for N550 and N772. PX 80 and PX 85 exhibit a similar PSD, as do N550 and N772 with each other. In general, the PSD of PX 80 and PX 85 was narrower than that of N550 and N772. The results are summarized in Table 3. The radius of gyration (rg), also known as root mean square radius, describes the distribution of mass around the centre of gravity of a particular particle. This calculation is based on the angular variation of the MALLS signal intensities and it is independent of the shape of the particle. A geometrical radius can be calculated to take into account the shape of the particle [16]. In Table 3, the recalculated geometrical sizes under the assumption of compact spheres (dsphere) and random coils (lcoil) are also displayed. It must be noted that the real shape of CB (aciniform aggregates) deviates somewhat from these ideal geometrical forms.
Table 3.
Particle size distribution of CB dispersed in 96% ethanol. Particle sizes calculated as radius of gyration (rg) as well as geometrical sphere diameter and end-to-end distance of random coils.
In the AF4 fractogram, CB elutes at a low cross-flow rate. PX 80 and PX 85 particles elute between t = 17–32 min, N550 and N772 between t = 20–32 min. The dispersant 96% ethanol did not cause any interfering signals in these time windows.
For all CB dispersions, a series of dilutions from a fresh 100 mg/L stock dispersion were prepared at 0 (blank), 5, 10, 25, 50, 75, 100, and 125 ng/mL in 96% ethanol. The AF4 fractograms were integrated at all detection angles (except the 7° angle) of the MALLS detector to obtain the peak areas that are directly proportional to the injected mass. The CB particles were completely dispersed in 96% ethanol with no sediment, thus the weighed mass of CB corresponds to the mass of CB in the dispersion. The CB standard dispersions could therefore be used for the calibration of the MALLS output by the peak areas.
Identical concentrations of PX 80 and PX 85 dispersions caused higher signal intensities in the AF4 fractogram than both rubber grades, N550 and N772. Whilst even the lowest concentrated dispersion of PX 80 and PX 85 (i.e., 5 ng/mL) could be differentiated from the blank and the next higher concentration (10 ng/mL), the N550 and N772 dispersions at 25 ng/mL were the lowest concentrations that could be clearly differentiated for these rubber grades. Consequently, 5 ng/mL was set as the detection limit of the device for PX 80 and PX 85, and 25 ng/mL for N550 and N772 for a 1 mL injection volume. The correlation between the scattered light intensities and the injected mass of CB is exemplified in Figure 3, with the AF4 fractograms being recorded at the 92° detector angle, and in Figure 4 through the calibration curve that was obtained from the integration of the total peak area at all angles. The results for all CB dispersions are summarized in Table 4.
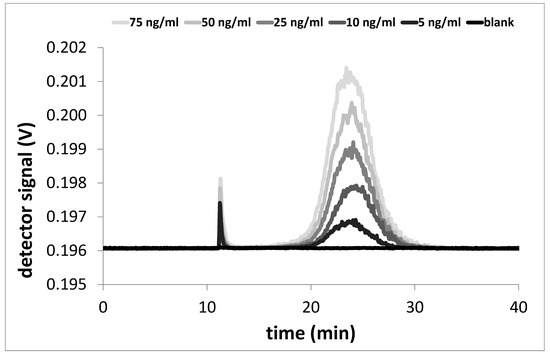
Figure 3.
Asymmetrical Flow Field-Flow Fractionation/Multi-Angle Laser Light Scattering (AF4/MALLS) fractograms of PX 80 dispersed in 96% ethanol (1 mL injection, 92° detector).
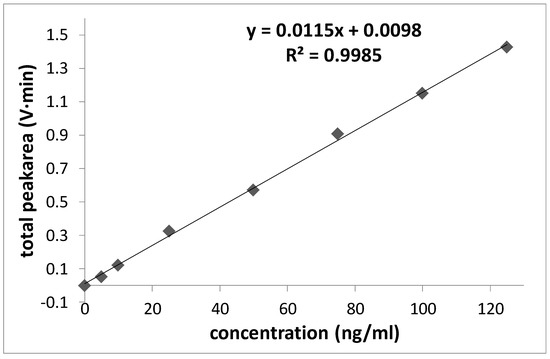
Figure 4.
Sum of all MALLS detector angle areas (total area) versus concentration of PX 80 (1 mL injections).
Table 4.
Total peak areas of the respective CB standards used for the calibration.
3.2. Recovery of CB Redispersed from Quartz
Sodium chloride (p.A., Sigma-Aldrich, St. Louis, MO, USA) and quartz sand (Büchi Labortechnik GmbH, Essen, Germany) were tested for their suitability as dry-food simulant. Both materials exhibit sufficient small grain sizes and hardness to provide a homogeneous friction of the polymer surface. Both simulants are insoluble in 96% ethanol and they are easy to be washed off for extracting the abraded matter.
To evaluate the influence of the dry simulant on the detectability of the CB particles, a compatibility test was performed. In separate vials, 1.0 g of the dry simulants were added to 100 mL of freshly prepared 100 mg/L CB dispersions and shaken for 15 min on a laboratory shaker. The dispersions were then stored at room temperature. After a few minutes, all of the dispersions with sodium chloride showed extensive flocculation of the CB and eventually sedimentation. In contrast, the CB dispersions spiked with quartz sand remained stable with the sand slowly and completely settled at the bottom of the vials. Therefore, quartz sand was considered to be a suitable abrasion medium for CB, whereas sodium salt was not further considered for this study but it may be suitable for other NMs.
The preparation with quartz sand was repeated for the four CB grades; 1.0 g in 15 mL polypropylene centrifugal tubes containing 10.0 mL of 75 ng/mL PX 80/PX 85 and 125 ng/mL N550/N772. After 15 min of shaking, the four dispersions were left to rest for 10 min, during which the sand settled completely at the bottom of the vials. Approximately 5 mL of the clear supernatants were carefully transferred into AF4 vials and 1 mL of each was injected for analysis. A blank sample (i.e., sand shaken with 96% ethanol with no CB) was also tested. The recovery was compared to the AF4/MALLS signals of CB dispersions with no contact to sand (references).
AF4/MALLS fractograms showed slightly lower signal intensities for the dispersions having been in contact with the sand (Figure 5). The recovery rates on triplicate injections were calculated as 87% for PX 80, 82% for PX 85, 75% for N550, and 79% for N772.
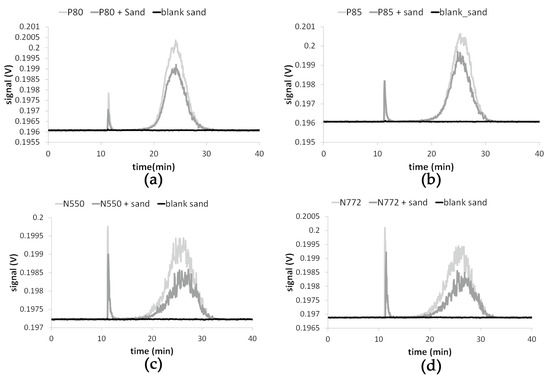
Figure 5.
AF4/MALLS fractograms of reference dispersions (dark grey) with no contact to sand and recovery dispersions with contact to sand (bright grey) of 75 ng/mL PX 80 (a) and PX 85 (b), as well as 125 ng/mL N550 (c) and N772 (d).
Even if some CB remain adsorbed on the sand surface, the quartz sand is deemed suitable as a dry-food simulant for the purpose of this study.
3.3. Results of the Nano-Release Study
After the abrasion test was performed on the LDPE and EPDM nanocomposites (without pre-conditioning) the areas that were abraded with sand showed a dull, scratched surface (Figure 6). This indicated a gentle and homogeneous abrasion of the surface. After transferring the abraded material and the sand into 96% ethanol, AF4/MALLS measurements were performed to detect potential CB nano-particulates. The relevant AF4 elution times for CB were between t = 17 to 32 min, but no signal other than that obtained from the sand blank (without contact to a nanocomposite) was recorded (Figure 7).
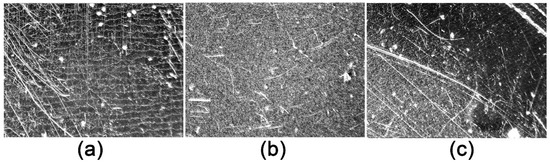
Figure 6.
Surface texture of (a) unstressed and (b) stressed low density polyethylene (LDPE) carbon black (CB)-nanocomposites. (c) shows the transition region between abraded (lower left region) and unstressed (upper right region) polymer surface at which the cell closure was placed (images taken at hundredfold magnification with an optical light microscope).
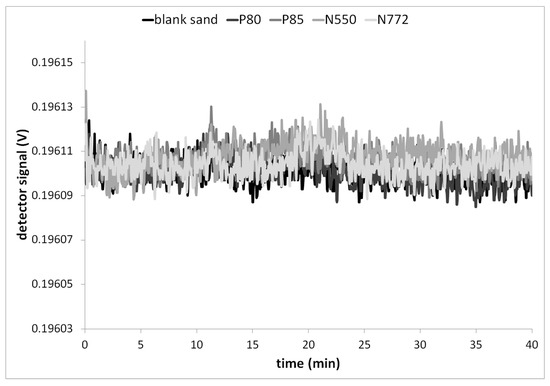
Figure 7.
AF4 fractograms of the nanocomposites that were abraded for 30 min with quartz sand compared to blank quartz sand.
Prior to the abrasion test, the specimens of the LDPE and EPDM samples were subjected to pre-stressing under various conditions. After the heat treatment (24 h at 100 °C), all materials showed a significantly higher plasticity but no deformation or change in surface integrity was observed. Once cooled down to room temperature no differences to the original nanocomposites were perceived. Storing the nanocomposites at low temperatures (24 h at −50 °C) resulted in no obvious changes of the LDPE compounds, whilst the EPDM specimens showed increased stiffness, though still flexible and not brittle. Once warmed up to room temperature in a desiccator preventing condensate formation, all samples returned to their original flexibility. The swelling of the nanocomposites with solvents did not cause apparent differences with the original LDPE nanocomposites. The EPDM specimens did however swell while in contact with toluene and shrunk after being desiccated in the oven (Figure 8). Furthermore, the EPDM samples ended up being significantly less flexible after this chemical treatment.
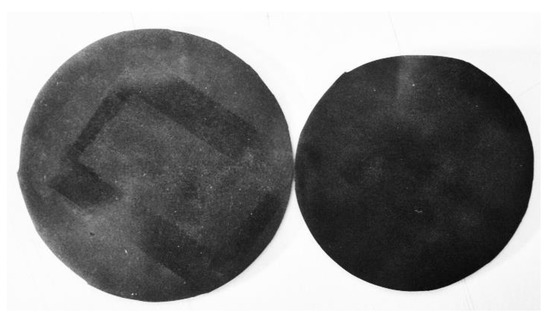
Figure 8.
N550-EPDM compound before (left) and after (right) immersion in toluene for 24 h at 40 °C.
Mechanical stressing seemed to affect only the LDPE samples. Once detached from the clamps, the LDPE strips were found slightly elongated with a significant reduction in thickness at their center (by approximately 1 mm out of 3 mm). On the contrary, the EPDM strips retained their original shape with no visible changes.
Although preconditioning seemed to influence the integrity of the nanocomposites in some cases, the AF4 measurements on the dispersants from the subsequent abrasion test showed no signal for CB (Figure 9), thus indicating the absence of CB release. These findings were validated by fortification of the re-dispersed abrasion/sand samples with a known amount of CB-dispersion (25 µL of a 1 mg/L PX 80/PX 85 stock dispersion were added to 5 mL supernatant for a resulting 5 ng/mL CB content; due to lower signal intensities, the N550 and N772 supernatants were spiked to 25 ng/mL). Examples for PX 80 are shown in Figure 9. The CB signal demonstrates that the sand matrix did not influence the detectability of CB. In other words, CB would have been detected if released as uncoated CB particles from the nanocomposites through abrasion with or without preconditioning.
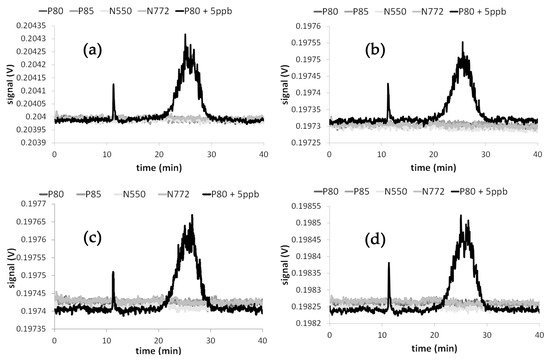
Figure 9.
AF4 fractograms of abraded nanocomposites that were pre-stressed by heat (a), deep-freezing (b), solvent swelling (c), and stretching (d). The black curves are the fractograms of samples that were additionally fortified with carbon black (in this case PX 80 at 5 ng/mL).
4. Discussion and Conclusions
Exposure to CB nano-particulates that were used in FCM is unlikely when the NM is fully incorporated into a polymer matrix [12,17] because the mobility of CB nano-particulates is too low to cause migration based on Fickian diffusion. In practice, conditions of use could impact the integrity of the polymers and, as a consequence, could cause the NMs to not be fully embedded anymore within the host polymer matrix. There are thus legitimate concerns that intensive use of the food contact material under stress conditions might facilitate the release of CB nano-particulates.
To date, the number of studies on the mechanical stress related release of NMs from nanocomposites is very limited. Addo Ntim et al. [18] investigated the release of silicon dioxide and titanium dioxide nanoparticles from ceramic cookware after stress conditions that simulated intensive use. A linear abrader equipped with scrubbing pads, steel wool, or a tungsten carbide burr was used to abrade the surface of the ceramic coating. Single-particle inductively coupled plasma mass spectrometry (sp-ICP-MS) was used to determine the release of silicon dioxide and titanium dioxide particulates and to differentiate them from solubilized ionic species. Release of particles was only detected after abrasion of the surface with the tungsten carbide burr. As the authors stated, this condition obviously damaged the ceramic coating beyond reasonable use. Although the other abrasion conditions with scrubbing pad and steel wool can also be considered as severe, any release of nanomaterials was not detected.
Clearly, an investigation of the potential release of NMs from nanocomposites requires suitable analytical techniques [19,20,21] and a suitable experimental design [5]. Due to the particulate nature of CB [22,23,24,25], both requirements must be met. In a previous study we have demonstrated the non-migration of CB in a static migration experiment using AF4/MALLS [12]. In this new study, the focus was not on diffusion based migration of CB, but on release that is caused by mechanical abrasion of the surface and potentially triggered by various pre-stress treatments. To this end, a suitable abrasive dry substance was selected ensuring the stability of the CB dispersion for the AF4/MALLS measurements. The combination of quartz sand and 96% ethanol gave the best results. Verification that abrasion did occur effectively was achieved by microscopical images that demonstrated homogeneous matting of the nanocomposite’s surface after abrasion. To simulate the intensive use of FCM and to draw worst case scenarios where the polymer integrity could be affected, the nanocomposites were subjected to thermal, chemical and mechanical stress prior to the abrasion test. Heating aimed at enhancing the flexibility of the polymer, deep-freezing at making the surface more brittle, the immersion in a solvent at swelling the LDPE, or increasing the stiffness and brittleness of the EPDM. Finally, stretching was to decrease the thickness of the polymer surrounding the CB nano-particulates. Under all of these conditions, both without and with pre-stressing, no release of CB was detected.
The overall limit of detection (LOD) of the method, considering the LOD of the device, the recovery rates, the nanocomposite area in contact with the dry simulant, as well as the amount of abrasive sand and ethanol used were in relation to the food contact area 0.78 µg/dm² for PX 80, 0.83 for PX 85, 0.78 for N550, and 0.74 for N772. Assuming a surface to volume ratio of 6 dm² per kg of food, according to the European Union (EU) cube model, this corresponds to a detection limit of approximately 5 µg of CB per kg of food. From the migration experiments, it can be concluded that, when considering that these LODs were achieved even under severe stress conditions, CB will not be released into food under normal conditions of use and that exposure of the consumer to CB nano-particulates is not to be expected.
Author Contributions
J.B. and R.F. conceived and designed the experiments; J.B. performed the experiments; J.B. and R.F. analyzed the data; J.B. contributed reagents/materials/analysis tools; J.B. and R.F. wrote the paper.
Funding
This research received no external funding.
Acknowledgments
This study was commissioned by the ICBA (International Carbon black Association), 701 Poydras Street, Suite 5000, New Orleans, Louisiana 70139-5099, USA.
Conflicts of Interest
The authors declare no conflict of interest.
References
- Duncan, T.V. Applications of nanotechnology in food packaging and food safety: Barrier materials, antimicrobials and sensors. J. Colloid Interface Sci. 2011, 363, 1–24. [Google Scholar] [CrossRef] [PubMed]
- Bumbudsanpharoke, N.; Ko, S. Nano-food packaging: An overview of market, migration research, and safety regulations. J. Food Sci 2015, 80, 910–923. [Google Scholar] [CrossRef] [PubMed]
- Pocas, F.; Franz, R. Overview on European Regulatory Issues, Legislation, and EFSA Evaluations of Nanomaterials. In Nanomaterials for Food Packaging-Materials, Processing Technologies, and Safety Issues; Elsevier: Amsterdam, The Netherlands, 2018. [Google Scholar]
- Peters, R.J.B.; Bouwmeester, H.; Gottardo, S.; Amenta, V.; Arena, M.; Brandhoff, P.; Marvin, H.J.P.; Mech, A.; Moniz, F.B.; Pesudo, L.Q.; et al. Nanomaterials for products and application in agriculture, feed and food. Trends Food Sci. Technol. 2016, 54, 155–164. [Google Scholar]
- Hardy, A.; Benford, D.; Halldorsson, T.; Jeger, M.J.; Knutsen, H.K.; More, S.; Naegeli, H.; Noteborn, H.; Ockleford, C.; Ricci, A.; et al. Guidance on risk assessment of the application of nanoscience and nanotechnologies in the food and feed chain: Part 1, human and animal health. EFSA J. 2018, 16, 5327. [Google Scholar]
- Duncan, T.V.; Pillai, K. Release of Engineered Nanomaterials from Polymer Nanocomposites: Diffusion, Dissolution, and Desorption. ACS Appl. Mater. Interfaces 2015, 7, 2–19. [Google Scholar] [CrossRef] [PubMed]
- Kuorwel, K.K.; Cran, M.J.; Orbell, J.D.; Buddhadasa, S.; Bigger, S.W. Review of mechanical properties, migration, and potential Aapplications in active food packaging systems containing nanoclays and nanosilver. Compr. Rev. Food Sci. Food Saf. 2015, 14, 411–430. [Google Scholar] [CrossRef]
- Störmer, A.; Bott, J.; Kemmer, D.; Franz, R. Critical review of the migration potential of nanoparticles in food contact plastics. Trends Food Sci. Technol. 2017, 63, 39–50. [Google Scholar] [CrossRef]
- Commission Regulation (EU). On plastic materials and articles intended to come into contact with food; Official Journal of the European Union: Brussels, Belgium, 14 January 2011. [Google Scholar]
- Bott, J.; Störmer, A.; Franz, R. A model study into the migration potential of nanoparticles from plastics nanocomposites for food contact. Food Packag. Shelf Life 2014, 2, 73–80. [Google Scholar] [CrossRef]
- Franz, R.; Welle, F. Mathematic modelling of migration of nanoparticles from food contact polymers. In The Use of Nanomaterials in Food Contact Materials-Design, Application, Safety; Veraart, R., Ed.; DEStech Publications Inc.: Lancaster, PA, USA, 2017. [Google Scholar]
- Bott, J.; Störmer, A.; Franz, R. Migration of nanoparticles from plastic packaging materials containing carbon black into foodstuffs. Food Addit. Contam. 2014, 31, 1769–1782. [Google Scholar] [CrossRef] [PubMed]
- Duncan, T.V. Release of engineered nanomaterials from polymer nanocomposites: The effect of matrix degradation. ACS Appl. Mater. Interfaces 2015, 7, 20–39. [Google Scholar] [CrossRef] [PubMed]
- Fernandez-Rosas, E.; Vilar, G.; Janer, G.; González-Gálvez, D.; Puntes, V.; Jamier, V.; Aubouy, L.; Vázquez-Campos, S. Influence of nanomaterial compatibilization strategies on polyamide nanocomposites properties and nanomaterial release during the use phase. Environ. Sci. Technol. 2016, 50, 2584–2594. [Google Scholar] [CrossRef] [PubMed]
- Bott, J.; Franz, R. Investigations into the Potential Abrasive Release of Nanomaterials due to Material Stress Conditions—Part B: Silver, Titanium Nitride, and Laponite Nanoparticles in Plastic Composites. Appl. Sci. 2019, 9. in press. [Google Scholar]
- Andersson, M.; Wittgren, B.; Wahlund, K.-G. Accuracy in Multiangle Light Scattering Measurements for Molar Mass and Radius Estimations. Model Calculations and Experiments. Anal. Chem. 2003, 75, 4279–4291. [Google Scholar] [CrossRef] [PubMed]
- IARC. IARC monographs on the evaluation of carcinogenic risks to humans. In Carbon Black, Titanium Dioxide and Talc; International Agency For Research On Cancer: Lyon, France, 2010. [Google Scholar]
- Ntim, S.A.; Norris, S.; Scott, K.; Thomas, T.A.; Noonan, G.O. Consumer use effects on nanoparticle release from commercially available ceramic cookware. Food Control 2018, 87, 31–39. [Google Scholar] [CrossRef]
- Laux, P.; Tentschert, J.; Riebeling, C.; Braeuning, A.; Creutzenberg, O.; Epp, A.; Fessard, V.; Haas, K.-H.; Haase, A.; Hund-Rinke, K.; et al. Nanomaterials: Certain aspects of application, risk assessment and risk communication. Arch. Toxicol. 2018, 92, 121–141. [Google Scholar] [CrossRef]
- Noonan, G.O.; Whelton, A.J.; Carlander, D.; Duncan, T.V. Measurement methods to evaluate engineered nanomaterial release from food contact materials. Compre. Rev. Food Sci. Food Saf. 2014, 13, 679–692. [Google Scholar] [CrossRef]
- Singh, G.; Stephan, C.; Westerhoff, P.; Carlander, D.; Duncan, T.V. Measurement eethods to detect, characterize, and quantify engineered nanomaterials in foods. Compre. Rev. Food Sci. Food Saf. 2014, 13, 693–704. [Google Scholar] [CrossRef]
- Gray, C.A.; Muranko, H. Studies of robustness of industrial aciniform aggregates and agglomerates--carbon black and amorphous silicas: A review amplified by new data. J. Occup. Environ. Med. 2006, 48, 1279–1290. [Google Scholar] [CrossRef] [PubMed]
- Voll, M.; Kleinschmit, P. Carbon, 6. Carbon Black, in Ullmann’s Encyclopedia of Industrial Chemistry; Wiley-VCH Verlag: Weinheim, Germany, 2010. [Google Scholar]
- Wang, M.-J.; Gray, C.A.; Reznek, S.R.; Mahmud, K.; Kutsovsky, Y.; Black, C. Encyclopedia Of Polymer Science and Technology; John Wiley & Sons, Inc.: Hoboken, NJ, USA, 2002; pp. 52–91. [Google Scholar]
- Watson, A.Y.; Valberg, P.A. Carbon Black and Soot: Two Different Substances. AIHAJ 2001, 62, 218–228. [Google Scholar] [CrossRef] [PubMed]


© 2019 by the authors. Licensee MDPI, Basel, Switzerland. This article is an open access article distributed under the terms and conditions of the Creative Commons Attribution (CC BY) license (http://creativecommons.org/licenses/by/4.0/).