Featured Application
This study provides technical information on the implementation of real-time ECG signal processing.
Abstract
Recently, with the active development of wearable electrocardiogram (ECG) devices such as smart-bands or portable ECG devices, efficient ECG signal processing technology that can be applied in real-time has been actively studied. However, a wearable ECG device is exposed to various noise situations, thereby reducing the reliability of the detected R point or QRS interval. In addition, as early warning techniques in healthcare systems have been studied, real-time ECG signal processing techniques have become very important in wearable ECG devices. In this paper, we propose an efficient real-time R and QRS detection method using two kinds of first-order derivative filters and a max filter to analyze ECG signals measured from wearable ECG devices in real-time. The proposed method detects the R point and QRS interval in units of a sliding window for real-time processing and combines the detected R points in each sliding window. Also, the reliability of the detected R points and RR intervals is examined through noise region analysis using the histogram characteristic of a sample point. The performance of the proposed method was verified by the MIT-BIH database (DB), CYBHi DB and real ECG data measured from the developed wearable ECG patch. The proposed method achieves Se = 99.80%, +P = 99.80%, and DER = 0.36% against MIT-BIH DB. In addition, the proposed method enables accurate R point detection and heart rate variability (HRV) analysis even with noisy ECG signals.
1. Introduction
ECG conveys valuable diagnostic information about heart functioning. Its analysis and processing play an important and significant role in the diagnosis of heart diseases. A typical electrocardiogram consists of five characteristic waves: P, Q, R, S, and T waves. This series of waveforms correspond to each phase of cardiac activities [1]. The identification of these waves is a critical step in analyzing the ECG signal and has been made possible by analyzing their morphological patterns.
The heartbeats of the MIT-BIH DB are classified into five types according to the AAMI standard [2]. The normal sinus rhythm (N or NSR), left bundle branch block (L or LBBB), right bundle branch block (R or RBBB), atrial escape (e) and nodal (junctional) escape (j) beats belong to class N (non-ectopic). Class S includes atrial premature (A), aberrated atrial premature (a), nodal (junctional) premature (J), and supra-ventricular premature (S). Class V includes premature ventricular contraction (V) and ventricular escape (E). Class F includes fusion of ventricular and normal (F), class Q includes paced (/), fusion of paced and normal (f), and unclassified (Q). Figure 1 shows four representative heart beats concerning arrhythmia in the MIT-BIH DB: the atrial premature beat (APB), junctional premature beat (JPB), premature ventricular contraction (PVC), and atrial fibrillation (AF). APB occurs when an ectopic focus in the atria discharges before the next sinus impulse [3]. The premature impulse may depolarize the atria and subsequently the ventricles, provided that the myocardium and conduction system have repolarized. This appears as a premature P-wave and QRS complex occurring earlier than expected. Additionally, the P wave morphology of APBs is different from sinus P wave and may be a deformed or negative P wave. JPBs arise from an ectopic focus within the atrioventricular (AV) junction [4]. These cause premature QRS complexes without a preceding P wave, and the QRS morphology is very similar to sinus complexes. A PVC is caused by an ectopic cardiac pacemaker located in the ventricle. PVCs are characterized by premature and bizarrely shaped QRS complexes that are unusually long (typically >120 ms) and appear wide on the ECG. These complexes are not preceded by a P wave, and a T wave is usually large and oriented in a direction opposite the major deflection of QRS [5,6]. AF is an irregular and often rapid heart rate that can increase your risk of strokes, heart failure and other heart-related complications [7]. Likewise, an arrhythmia is a problem with the rate or rhythm of your heartbeat. This means that the heart beats too quickly, too slowly, or with an irregular pattern. The most basic and important step for detecting arrhythmias with various aspects is R-peak or QRS complex detection.
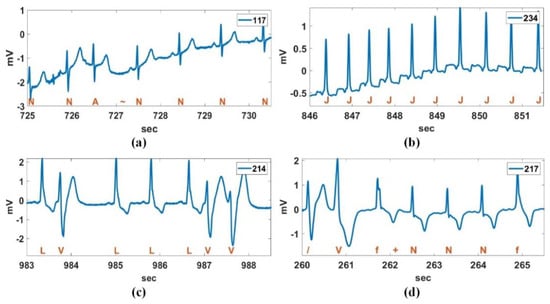
Figure 1.
Four representative heart beats concerning arrhythmia; (a) atrial premature beat (APB), (b) junctional premature beat (JPB), (c) premature ventricular contraction (PVC), and (d) atrial fibrillation (AF).
Recent technological advances in sensors, low-power integrated circuits, and wireless communications have accelerated the tremendous growth of medical wearable devices. This advance originates from the need to monitor a patient over an extensive period of time. Especially, Internet of Medical Things (IoMT)-based wearable devices can monitor long-term physiological signals and upload data to the cloud via a wireless communication system [8]. Figure 2 shows the concept of a wireless patient monitoring system. The system consistently monitors the bio-signals of patients and sends the measured bio-signals to the wearable smart device or central monitoring system [9,10]. For cardiac patients, wearable heart monitoring sensors have already become a life-saving intervention ensuring continuous monitoring during daily life. Patients can be equipped with wireless, miniature and lightweight sensors [11]. The sensors store the bio-signals in real-time and then periodically upload the data to a DB server [11]. The recorded bio-signals may be analyzed in the wearable device itself to predict a warning level. If the early analyzed result is above a threshold, a warning alarm is sent to the medical staff of the hospital [12]. In order to acquire accurate response with less computational complexity as well as a light weight and long battery time, the development of a fast and accurate algorithm for wearable heart monitoring sensors is needed. For a remote ECG monitoring application, R or QRS detection is a preliminary step for detecting the heartbeat for the subsequent rhythm classification. A computationally efficient R or QRS detection algorithm is indispensable for the low-power operation of a wearable ECG device. The QRS detection algorithms developed to date can be categorized as derivative [13], digital filters [14,15,16], Wavelet transform [17,18], Hilbert transform [19,20], phasor transform [21], adaptive threshold [22,23], morphology [24,25], and signal energy [14,26,27,28] based algorithms. The mentioned methods show superb QRS detection performance; however, major issues under the mobile environment include the low-complexity algorithms and real-time processing methods related to power efficiency and processing speed.
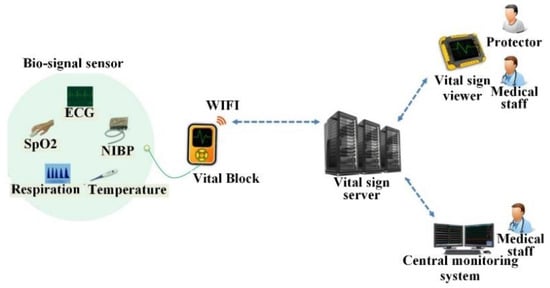
Figure 2.
Portable wireless patient monitoring system. ECG: electrocardiogram, SpO2: Oxygen saturation, NIBP: Non-invasive blood pressure.
Recently, derivative-based QRS detection methods are still being studied due to their low complexity [29,30]. Zhang et al. [29] have presented a pulse-triggered R peak detection algorithm for ECG signals based on the second derivative. This method uses a QRS morphology for R peak detection and is computationally inexpensive. However, in this method, the detection of the Q wave, a trough in the ECG signal, should precede R peak detection. Therefore, if a Q wave is contaminated by noise or there is no trough point of the Q wave, the R point detection performance is significantly lowered. Rivas et al. [30] proposed a QRS detector using derivation and adaptive thresholding. In this method, the accuracy of the initial maximum peak detected as the R peak greatly affects the overall performance and has a disadvantage of being sensitive to noise. The derivative-based method has been placed in the spotlight again with the development of wearable ECG devices: however, it is sensitive to noise. In addition, the existing methods do not have a criterion to determine whether the detected R peak is a true R peak or noise due to the absence of a noise detection function, which may cause errors in the RR interval calculation and further HRV analysis.
This paper proposes an efficient real-time R or QRS detection technique with low computational complexity and high accuracy for portable and wearable ECG monitoring systems. First, we introduce a simple method of connecting R peaks detected for each sliding window for real-time processing and describe an avoidance technique of R peaks with low reliability caused by noise and the R peak mismatch problem between sling windows for extracting precise RR intervals. Furthermore, an R peak detection method by using a pair of first-order derivative filters is introduced, and a detection method of the negative R peak or premature ventricular contraction (PVC), which is different from general R peak, is expressed mathematically. The proposed method is verified by the MIT-BIH DB [2] and CYBHi DB [31,32]. Besides this, the HRV analysis is performed using actual ECG data measured by the portable ECG monitoring device developed in this study.
The paper is organized as follows. Section 2 introduces the sliding window processing for real-time processing, simple and efficient noise detection using a vertical histogram, the proposed real-time R peak detection method using a pair of derivative filters, and an exclusion technique for unreliable RR intervals. In Section 3, the detection performance of the proposed method is demonstrated using the MIT-BIH DB and actual ECG data measured from the developed ECG patch. In addition, time cost and noise effects for the proposed method are analyzed. Section 4 presents the conclusion.
2. Materials and Methods
2.1. Sliding Window for Real-Time Processing
Figure 3 shows a connection example of R peaks detected per successive sliding window for real-time processing. In the figure, denotes the n-th detected R-peak in the t-th sliding window. In the proposed method, the R peak is detected in the sliding window unit for real-time processing. Thereafter, overlapping R peaks ( and in the figure) are detected between the sliding windows to merge the detected R peaks for each sliding window, and the detected R peaks in the front (t-th) and rear (t+1-th) sliding windows are connected using the detected overlapping R peaks. The setting for the sliding window is set considering bradycardia. To get a successive R peak sequence even for bradycardia (less than 60 heartbeats per minute), the length of the sliding window and overlapped interval between sliding windows should be at least 3 s and 1 s, respectively. In the proposed method, the size of sliding window is set to 2000 samples (about 5.6 s) based on MIT-BIH DB (360 samples/s), and the step size of sliding window is set to 1600 samples. This means the overlapped interval between sliding windows is 400 samples (about 1.1 s). Thus, the length of the sliding window and overlapped interval can be adjusted according to the sampling rate of the measured ECG signal.
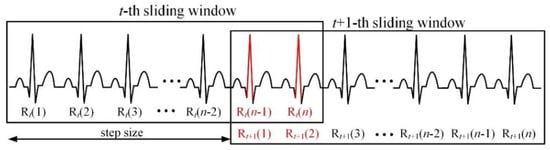
Figure 3.
Connection of R peaks detected per successive sliding window for real-time processing.
2.2. Simple and Efficient Noise Detection Method Using Vertical Histogram
The measured ECG signal is corrupted by various noises, which makes exact R detection difficult. The noise of the ECG signal is classified as muscle artifact (MA), baseline wander (BW), and electrode motion artifact (EMA), as shown in Figure 4. The ECG noises are extracted from the MIT-BIH Noise Stress Test DB (NSTDB) [33]. MAs occur when skeletal muscles contract, the patient moves or because of shivering due to the inappropriate temperature of the environment [34]. The main problem with these interferences is the spectral overlap between the ECG and the muscle noise. BW is a type of low-frequency noise which adds to the ECG signal, resulting in a varying baseline. This noise is caused by changes in the impedance between the electrode and the patient’s skin. These changes might be caused by movement, breathing or by perspiration, leading to a change of distance between the source of the signal, the heart, and the electrodes [35]. EMA is generally considered the most troublesome problem, as it can mimic the appearance of ectopic beats and cannot be removed easily by simple filters, as with noise of other types [33]. ECG signals measured in a measurement room or with a stable posture are relatively clean, but ECG signals measured under motion may contain various noises.
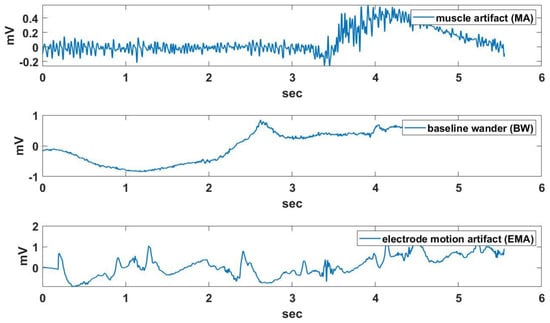
Figure 4.
An example of muscle artifact (MA), baseline wander (BW), and electrode motion artifact (EMA) effects.
The proposed method is basically robust to BW because it uses the product of two kinds of derivative filters. In addition, the processing of the sliding window unit can minimize the influence of false detection by strong noise. The proposed noise detection method is designed to cope with BW and EMA. The vertical histogram for the region of interest (ROI) around the signal point to detect MA and EMA is shown in Figure 5.
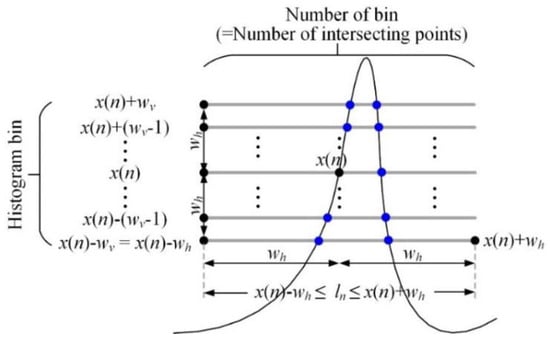
Figure 5.
Vertical histogram for the ROI around the magnified signal point.
The magnified signal for applying the vertical histogram is created by multiplying the original signal by 100 and rounding it to nearest integer because the original signal in the MIT-BIH DB has a small range of 10 mV. The histogram sum for the magnified signal point with the total number of bins and histogram is obtained as follows:
where . The total number of bins in the histogram for is always the same, but the range of bin values depends on the signal height of . Also, the histogram represents the number of bin (signal height) for the ECG signal in the ROI, and the histogram value becomes large in the local region where the frequency is high, such as MA.
The characteristics of the vertical histogram in the noise region (A, B, and C) and ECG signal region (D, E, and F) is shown in Figure 6. In the figure, the noisy signal was created by adding MA to the Record 234 signal of MIT-BIH DB. The noise region generally has a higher vertical histogram value per bin, whereas a typical ECG signal region has a different vertical histogram distribution depending on the location of the signal point being processed. For the ECG signal, the vertical histogram at the peak point of the important P, R, and T waves (D in the figure; i.e., the peak of the P wave) is concentrated in the low bin section. The rising or falling interval of the important wave (E in the figure) has a flat histogram distribution over the entire bin range, while the flat interval (F in the figure) has a histogram distribution densified in a specific bin. As a result, we can see that the sum of the vertical histograms in the noise region is larger than the normal ECG signal region. Thus, a vertical histogram sum at each signal point is used to distinguish the noise point from the normal signal point.
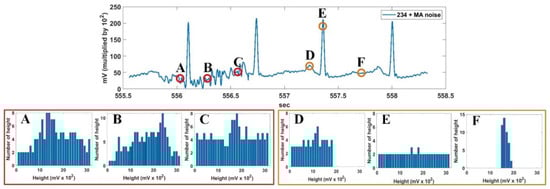
Figure 6.
Characteristics of vertical histogram in noise region (A–C) and ECG signal region (D–F).
The noise region detection result using the vertical histogram sum and max filter is shown in Figure 7. The baseline for calculating the vertical histogram is obtained by applying a 1 x 10 median filter to the noisy signal. In the second-row figure, a 1 x 31 max filter is applied twice to the vertical histogram sum to obtain the outline of the vertical histogram sum. The threshold for detecting the noise interval is set to Nth = 120. This threshold was experimentally obtained using the difference of the sum of respective vertical histograms for the MA signal of NSTDB [33] and the ECG signals of MIT-BIH DB [2].
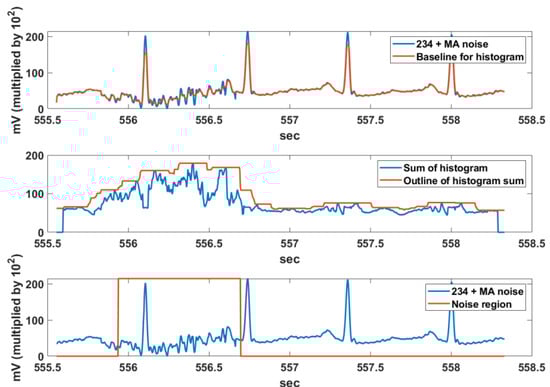
Figure 7.
Noise region detection using the vertical histogram sum and max filter.
2.3. Proposed Real-Time R and QRS Detection Method Using a Pair of Derivative Filters
Figure 8 shows the entire block-diagram of the proposed real-time R and QRS detection method using a pair of derivative filters. The proposed method consists largely of an R-point detection module, a noise detection module, a detected R-point connection module, and an inaccurate RR elimination module. First, the proposed method detects the R peak using two kinds of first order derivative filter, [1, −1] and [−1, 1]. The [−1, 1] filter detects a rapid rising interval of the QRS, while the [1, −1] filter detects a drastic falling interval. The multiplication of each derivative filter result then suppresses the P wave or T wave and noise while enhancing the QRS interval. By applying the max filter to the multiplication of the derivative filter results, the QRS interval and R peak are detected through the normalization and threshold of 0.3. This threshold is applied to the normalized max filter result, which is the final stage of QRS interval detection, and applies to all records of MIT-BIH DB.
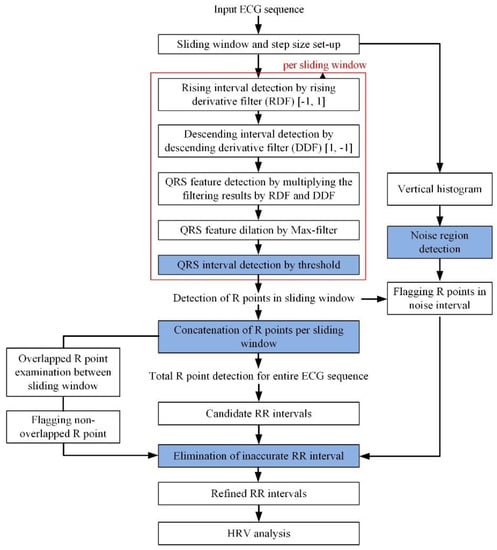
Figure 8.
Entire block-diagram of proposed real-time R and QRS detection method. HRV: heart rate variability.
Figure 9 shows an example of the QRS detection procedure using a pair of derivative filters for the Record 234 signal of MIT-BIH DB. The QRS interval including the R peak includes an abrupt rising and falling section compared to other signal intervals. The derivative filter result for the original ECG signal of the sliding window size is obtained as follows:
where means the derivative filters and is obtained as follows, while denotes half of the signal point interval to which the derivative filters are applied; is used in this paper.
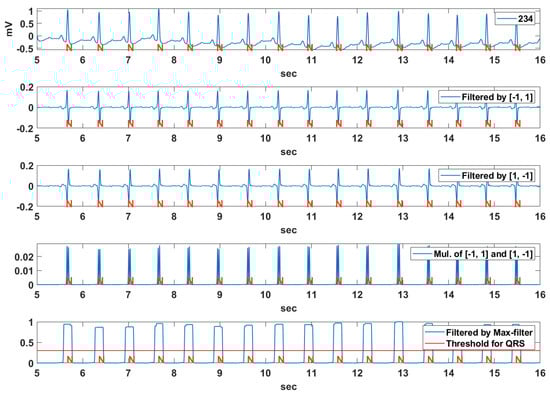
Figure 9.
An example of the QRS detection procedure using pair of derivative filters for Record 234 of MIT-BIH DB.
The subscript α denotes the type of the derivative filter, and α = 1 or −1 denote the derivative filter to detect the rising or falling section, respectively. The basic characteristics of the QRS interval including both rapid rising and falling sections are obtained by multiplying the results of the two kinds of derivative filters as follows:
In order to integrate the detected rising and falling section, the max filter is applied to the multiplication result of the derivative filters as follows:
where means half of the filter size of the maximum filter. As shown in Figure 10, by applying the threshold to the normalized max filter result , the candidate QRS interval is obtained as follows:
where is a threshold value for determining whether the current signal point belongs to the candidate QRS point. If the number of consecutive candidate QRS points (successive columns of “1” in the figure) exceeds a certain threshold, the interval is classified as a candidate QRS interval including R. The extended candidate QRS interval to improve the reliability of the R detection rate is obtained by adding an additional interval ( in Figure 10) to both sides of the candidate QRS interval.
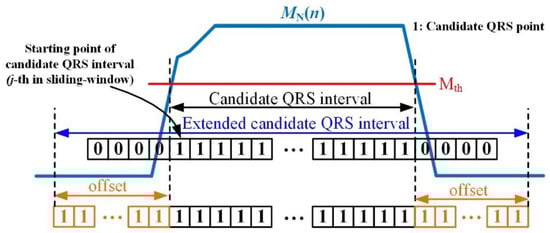
Figure 10.
Candidate QRS interval obtained from the max filter and threshold.
The position of the R peak is retrieved in the extracted candidate QRS interval of Figure 10. The R peak detection method depends on the shape of the R wave to be detected, which is largely divided into a normal case (positive R) and PVC case (inverse R or PVC). The shape of the normal R peak represents a high positive R peak, whereas the shape of the R peak in PVC appears as a deep negative R peak. Accordingly, the R peak position in the candidate QRS interval is obtained by considering two cases, as follows:
where is a coefficient value to compare positive with negative R peaks such as PVC. The coefficient value is set to search for a negative R or PVC below the average of the ECG signal in the sliding window. In the PVC beat, the difference between the average value of the sliding window and the negative peak value is much larger than that between the positive peak value and the average value of the sliding window. In this study, based on the average of the sliding window, it is assumed that PVC is when the negative peak value is times larger than the positive peak value. As shown in Figure 11, the position of the R peak detected in the local signal corresponding to the candidate QRS interval is converted to the R peak position in the sliding window with reference to the offset value, as follows:
where is the point position in the sliding window, and subscripts and denote the sliding window and the local signal interval corresponding to the candidate QRS, respectively. In addition, the R peak position in the original signal is calculated by step size as follows:
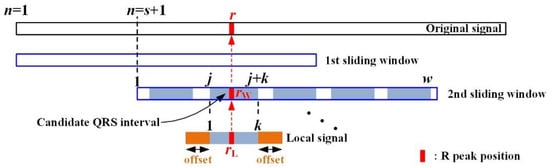
Figure 11.
R peak position in sliding window and local signal.
Figure 12 shows the QRS detection result using a pair of derivative filters and the max filter for the Record 108, 111, 118, 217, and 214 sections in MIT-BIH DB. The annotations, N, L, R, /, and V, as mentioned in the introduction, represent NSR, LBBB, RBBB, Paced, and PVC rhythms, respectively. The MIT-BIH ECG signals used in the experiments were filtered by a low-pass filter with a 40 Hz cut-off frequency. The Record 108 section is an exceptional NSR rhythm, which contains bigger P waves and inverse QRS complexes. The Record 111 section are LBBB rhythms including notched QRS complexes and bigger T waves, and the Record 118 section are RBBB rhythms including deformed P waves and inverted T waves. The Record 217 section is a paced rhythm that includes deep S waves and bigger T waves, and the Record 214 section is a complex rhythm with both LBBB and PVC beats. We can see that the bigger P and T waves are suppressed while the QRS complex is enhanced from the multiplication result of the derivative filter pair. The QRS complex can also be detected by using a constant threshold () for the normalized maximum filter result for the multiplication of the pair of derivative filters.
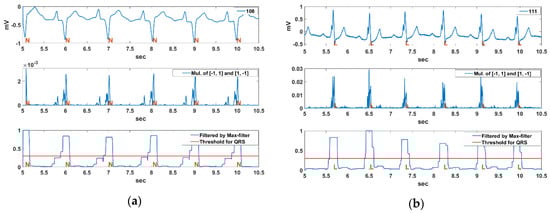
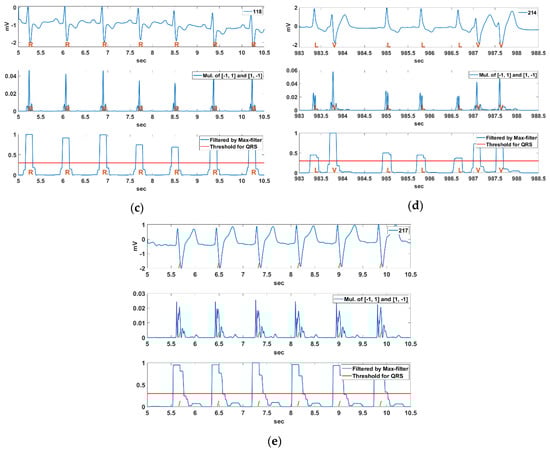
Figure 12.
QRS detection result using a pair of derivative filters and a max filter for Record (a) 108, (b) 111, (c) 118, (d) 217, (e) 214 sections in MIT-BIH DB.
2.4. Exclusion of Unreliable RR Intervals
The reliability of the detected R points is considered in two aspects; i.e., (1) whether detected R exists in the noise region, or (2) whether the first R in the current sliding window overlaps with the R in the previous sliding window. Figure 13 shows an example for the exclusion of unreliable RR intervals. In the figure, represents the position of the n-th detected R point in the entire ECG signal. If R (16) is an unreliable R point detected in the noise region, RR (15) and RR (16) thus calculated are also unreliable and should be excluded from the ECG analysis. Also, if R (18) is the first detected R point in the current sliding window and does not overlap with the R points in the previous sliding window, the detected R points between the sliding windows lack continuity. As a result, RR (17) calculated by R (18) is unreliable and excluded from the ECG analysis. However, R (18) and R (19) are guaranteed to have continuity, so RR (18) is a reliable RR interval. This relationship is expressed as follows:
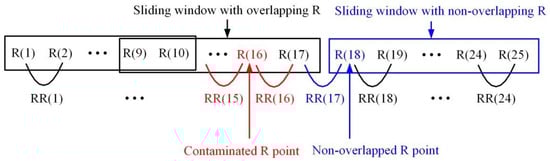
Figure 13.
Exclusion of unreliable RR intervals.
3. Results
The performance of the proposed R and QRS detection algorithm is evaluated on a standard MIT-BIH DB. The DB contains two-channel ECG recordings in digital format from 47 subjects comprising 25 men and 22 women of age groups of 32–89 and 23–89, respectively. Approximately 60% of the total subjects were inpatients. The DB contains an 11 bit resolution, 10 mV range, 360 Hz sampling frequency, and complete annotations [2]. The verification of the proposed method consists of R-point detection performance, processing time, and detection performance analysis for noise.
3.1. R Point Detection Performance
Figure 14 shows the R point detection result for the Record 108, 111, 118, 217, 214 sections in MIT-BIH DB based on the QRS interval detected in Figure 12. Although the Record 108 section includes bigger P-waves and inverse QRS intervals, the positions of the inverse QRS and PVC were well detected. In the figure, the x in Record 108 means a non-conducted P-wave (blocked APB). This shows that there will not be a QRS complex following. The Record 111 section includes notched QRS intervals and relatively large T waves; however, periodic R points were well detected. The R detection of the Record 118 section is very easy compared to other signal sections. The Record 217 section includes deep S waves and large T waves; however, positive R points were well detected. We can also see that the positive R points and the PVC beats in the Record 214 section including large T waves are well detected.
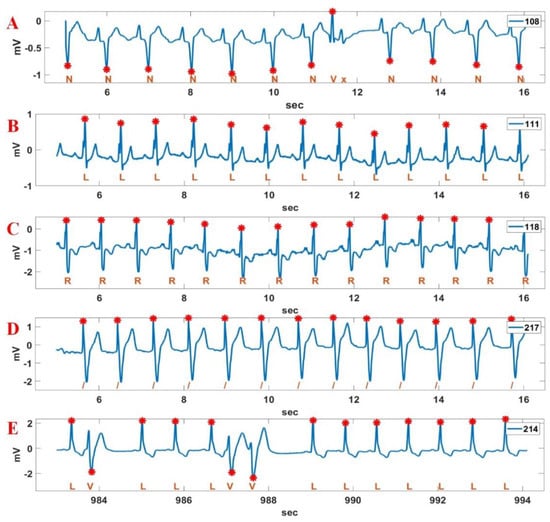
Figure 14.
R point detection result for various Record sections in MIT-BIH DB. A: 108; B: 111; C: 118; D: 217; E: 214.
The CYBHi DB (1000 samples/s) [31,32]—which comprises off-the-person data—is also used to verify the R point detection performance of the proposed method. The signals of the DB contain more noise compared to the MIT-BIH DB. The sliding window length of 3000 samples and the step size of 1500 samples are used for the experiment. The ECG signals of the CYBHi DB used in the experiments were filtered by a low-pass filter with a 40 Hz cut-off frequency. Figure 15 shows the R point detection result for the Record 20110719-RMAF-CI-8B, 20110718-ARS-CI-8B, and 20110718-ARS-CI-85 sections in the CYBHi DB. While the 20110719-RMAF-CI-8B section contains bigger T waves, the 20110718-ARS-CI-8B section and 20110718-ARS-CI-85 section contain DC wandering and bigger P waves. Nevertheless, it can be seen that the proposed method detects the R point relatively accurately.
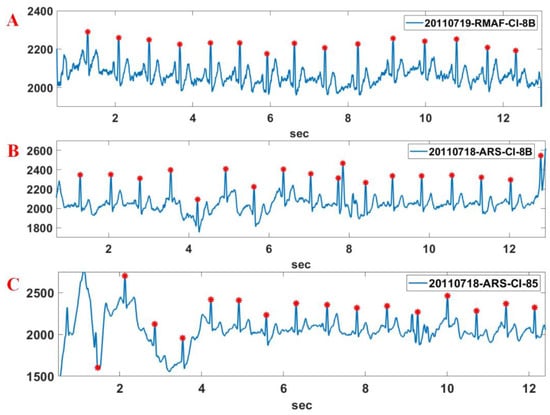
Figure 15.
R point detection result for various Record sections of CYBHi DB. A: 20110719-RMAF-CI-8B; B: 20110718-ARS-CI-8B; C: 20110718-ARS-CI-85.
To evaluate the R peak performance of the proposed method, commonly used detector performance indexes are applied, including false negative (FN), which means failing to detect a true beat (actual QRS); and false positive (FP), which represents a false beat detection. By using FN and FP, the sensitivity (Se), positive prediction (+P), and detection error rate (DER) are calculated by using Se [%] = TP/(TP+FN), +P [%] = TP/(TP+FP), and Der [%] = (FP + FN)/(TP + FN), respectively. The true positive (TP) is the total number of the true positive beats correctly detected by the algorithm. Additionally, the denominator () represents the number of total QRS [34]. Table 1 shows the detection results of the proposed method for all 48 recordings in the MIT-BIH DB. As shown in Table 1, the proposed method achieves Se = 99.80%, +P = 99.80%, and DER = 0.36% against MIT-BIH DB.

Table 1.
Detection results of the proposed method for all 48 recordings in the MIT-BIH DB.
Table 2 shows the supplementary function and detection performance comparison of the proposed method with the existing methods. The criterion of real-time feasibility means that the average calculation time for the 1 s ECG signal of Record 111 is less than 10 ms. The proposed method has a high Se and +P but a low DER, similar to that of other methods. R points contaminated by noise affect the RR interval and furthermore the HRV. Therefore, the elimination of erroneously calculated RR intervals due to contaminated R values is very important in the analysis of patient condition. The proposed method not only detects the R point (or QRS) but also detects noises and the erroneously calculated RR interval in order to compute a reliable HRV.
Table 2.
Supplementary function and detection performance comparison of the proposed method with the existing methods.
3.2. Time Cost Analysis
The time cost of the proposed method is analyzed for several of records from the MIT-BIH DB (360 Hz) using Matlab 2019 in Win 10 with Intel i7 4-core CPU and 8G RAM. Figure 16 shows the calculation time per 1000 iterations for 11 seconds of Record 108, 111, 118, 217, and 214. The respective average processing time is 33.81 ms for Record 108, 33.18 ms for Record 111, 32.94 ms for Record 118, 33.00 ms for Record 217, and 31.26 ms for Record 214. The total processing average time for an 11 second period is less than 32.84 ms, which implies that the proposed method is suitable for real-time ECG signal processing.
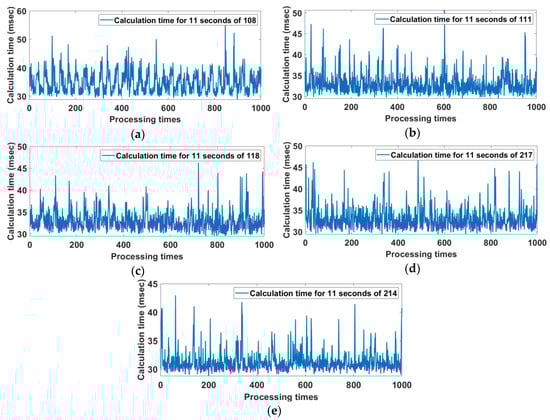
Figure 16.
Calculation time per 1000 iterations for 11 seconds of Record (a) 108, (b) 111, (c) 118, (d) 217, and (e) 214.
3.3. Analysis of Noise Effects
This section attempts to analyze the reliability of the proposed method for noisy signals. For the experiment, a relatively stable Record 234 with a constant RR interval was contaminated at 5 s intervals by the MA and BW of the NSTDB [33], as shown in Figure 17. The third-row figure shows the R points and noise regions detected in the noisy Record 234 signal. The noise regions were detected by the noise detection method using the vertical histogram introduced in Section 2.2. In the noise region, the low signal level represents non-noise regions, while the high signal level means noise regions. Also, the R-points indicated by the triangle are the R-points contaminated by noises and are excluded from the RR interval analysis because the contaminated R-point degrades the accuracy of the RR interval analysis.
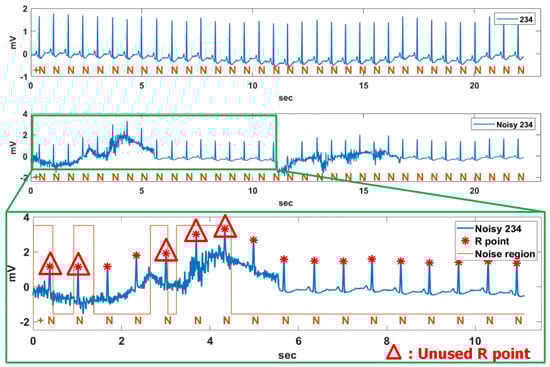
Figure 17.
Unused R point in noise region for noisy Record 234 contaminated by MA and BW.
The analysis similarity for the original Record 234 and the noisy Record 234 is shown in Figure 18. In the case of the noisy Record 234, half of the total signal was contaminated by noise. As a result, the contaminated R points were excluded from the analysis of the figure, and the overall detection time was reduced by half. The average beat-per-minute (BPM), average RR interval, root mean square of successive differences (RMSSD) and width and length in a Poincaré plot are 92.44 bpm, 0.65 s, 0.04 s, 0.02, and 0.05 for the original Record 234 and 92.62 bpm, 0.65 s, 0.04 s, 0.03, and 0.05 for the noisy Record 234, respectively. We can see that the analysis result of the noisy Record 234 is similar to that of the original Record 234, even though it was undermined by MA and BW.
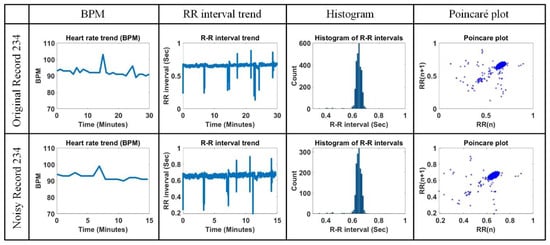
Figure 18.
Comparison of beats per minute (BPM), RR interval trend, histogram of RR interval, and Poincaré plot for original Record 234 and noisy Record 234.
3.4. Analysis of Actual Data Measured by Wearable ECG Device
Actual ECG data were measured by a developed wearable ECG patch with a 250 Hz sampling rate, as shown in Figure 19a, where the ECG patch was developed by TriBell-Lab and ETRI (Electronics and Telecommunications Research Institute) in South Korea. The ECG signals measured by the ECG patch are stored in the hospital DB via Bluetooth, Gateway (Bluetooth to WiFi), AP, and the hospital internal network, and are analyzed in real-time using the proposed algorithm. Ten minutes of ECG data at a fixed posture and walking for a 36-year-old man without heart disease were measured. Figure 19b,c show the 1 min length for two situations. Also, the R points on the measured ECG signals were detected by the proposed method.
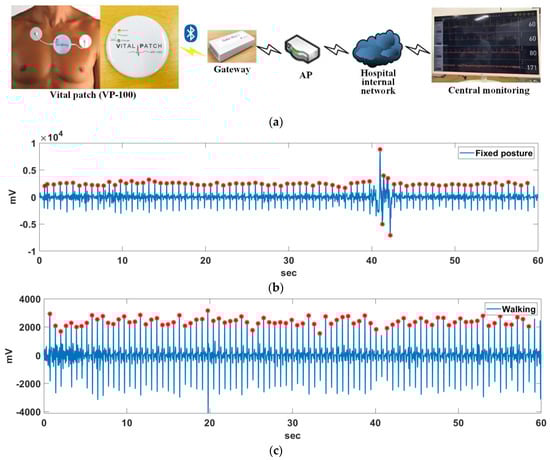
Figure 19.
(a) Developed wearable ECG patch; R point detection result with (b) a fixed posture and (c) walking.
Figure 20 shows the comparison of BPM, RR interval trend, histogram of RR interval, and Poincaré plot for the measured ECG signal with a fixed posture and walking. The average BPM, average RR interval, RMSSD, and width and length in the Poincaré plot are 86.75 bpm, 0.69 s, 0.08 s, 0.05, and 0.09 for the measured ECG signal in a fixed posture and 97.12 bpm, 0.62 s, 0.08 s, 0.06, and 0.09 for the measured ECG signal when walking, respectively. The BPM is higher when walking than with a fixed posture, but the other parameter values are very similar. It can be seen that the histogram distribution of the RR intervals for walking is a little more irregular than for a fixed posture. Also, the Poincaré plot is more clean when walking than in a fixed position. Through simple experiments, it can be seen that the proposed method can induce reliable analysis results in other parameters except BPM even in the presence of some movement.
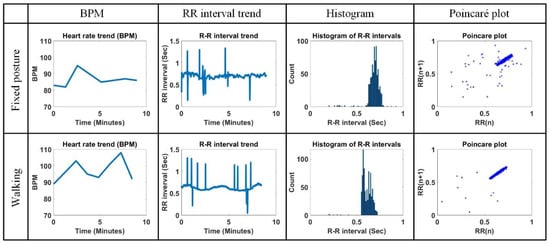
Figure 20.
Comparison of BPM, RR interval trend, histogram of RR interval, and Poincaré plot for measured ECG signal in fixed posture and walking.
4. Discussion
In the performance comparison of Section 3.1, the proposed method has the third lowest DER. The methods with the lowest DER and the second lowest DER are those in [28] and [19], respectively. However, since those methods do not have a noise detection function and post-processing for R points and RR intervals contaminated by noises, it may be difficult to calculate a reliable HRV. The reason why the proposed method has similar Se and + P is because the numbers of FPs and FNs are similar. This means that the existing methods may obtain biased FP and FN results as they are processed in the record unit of the MIT-BIH DB, while the proposed method achieves FP and FN values with a uniform distribution due to the effect of increasing the amount of data by processing in the sliding window unit. Therefore, we can assume that the proposed method will have relatively uniform FP and FN values regardless of the kind of experimental data.
In this paper, we examined the ideas for real-time processing as well as the proposed R detection technique for ECG signal analysis. Although many R point or QRS detection algorithms based on various theories have been developed to date, the R detection algorithms used in portable or wearable ECG devices should have a low complexity and calculation time. This is due to the lack of reliable algorithms applicable to real-time ECG analysis. With the development of signal processing technology, the detection accuracy difference of the R point or QRS interval for each algorithm is less than 0.5%, which is almost meaningless. In addition, the noise reduction technique used experimentally in each study may be limited in real application, because the ECG noises generated from various measurement environments are very complicated. For example, high-frequency signals and saturated signals may be alternated. It is actually very difficult to remove such complex noises. As a countermeasure to solve this problem, as suggested in this paper, it may be more efficient in real ECG analysis to detect abnormal signal intervals and remove RR intervals that lack reliability; that is, developing a technique that measures the reliability of detected R or calculated RR intervals is just as important as developing a QRS detection algorithm with a higher detection rate [36,37]. In addition, many current studies focus on distinguishing between normal and arrhythmic signals. However, in the future, classification techniques for various types of arrhythmia should be studied based on the opinions of medical staff.
5. Conclusions
This paper presents an efficient real-time R point and QRS detection technique using two kinds of derivative filters and a max filter with ECG signal processing for a sliding window unit. The proposed derivative filter processing suppresses non-QRS intervals such as P and T waves while improving the QRS interval. Since the ECG signal measured by a wearable device is often deformed by various noises, a noise detection function is very important for reliable HRV analysis. In this paper, the vertical histogram-based noise detection technique is used to check whether the detected R point is in a section contaminated by noises. By removing contaminated R points and RR intervals among the detected R points, the reliability of the HRV analysis could be improved. In the future, studies to analyze the effects of ECG noise on HRV should be accompanied by QRS detection technology.
Author Contributions
Conceptualization, T.W.B.; methodology, T.W.B.; software, T.W.B.; validation, T.W.B.; formal analysis, T.W.B.; investigation, T.W.B.; resources, K.K.K.; data curation, K.K.K.; writing-original draft preparation, T.W.B.; writing—review and editing, T.W.B.; visualization, T.W.B.
Funding
This work was supported by Electronics and Telecommunications Research Institute(ETRI) grant funded by the Korean government. [19ZD1100, Development of ICT Convergence Technology for Daegu-Gyeongbuk Regional Industry].
Conflicts of Interest
The authors declare no conflict of interest.
References
- Sadhukhan, D.; Mitra, M. R-peak detection algorithm for ECG using double difference and RR interval processing. Procedia Technol. 2012, 4, 873–877. [Google Scholar] [CrossRef]
- MIT-BIH Arrhythmia Database Directory. Available online: https://physionet.org/physiobank/database/html/mitdbdir/intro.htm#annotations (accessed on 7 August 2019).
- Premature Atrial Contraction. Available online: https://ecgwaves.com/ecg-topic/premature-atrial-contraction-beat-complex (accessed on 7 August 2019).
- Premature Junctional Complex. Available online: https://litfl.com/premature-junctional-complex-pjc (accessed on 7 August 2019).
- ECG Tutorial: Ventricular Arrhythmias. Available online: https://www.uptodate.com/contents/ecg-tutorial-ventricular-arrhythmias (accessed on 7 August 2019).
- Premature Ventricular Contraction. Available online: https://emedicine.medscape.com/article/761148-overview (accessed on 7 August 2019).
- Atrial Fibrillation. Available online: https://www.mayoclinic.org/diseases-conditions/atrial-fibrillation/symptoms-causes/syc-20350624 (accessed on 7 August 2019).
- Arefin, M.R.; Rezai, R.F. Computationally efficient QRS detection analysis based on dual-slope method. In Proceedings of the 36th Annual International Conference of the IEEE Engineering in Medicine and Biology Society, Chicago, IL, USA, 26–30 August 2014; pp. 2274–2277. [Google Scholar]
- Dimiter, V.D. Medical internet of things and big data in healthcare. Healthc. Inform. Res. 2016, 22, 156–163. [Google Scholar] [CrossRef] [PubMed]
- Medtech and the Internet of Medical Things. Available online: https://www2.deloitte.com/global/en/pages/life-sciences-and-healthcare/articles/medtech-internet-of-medical-things.html (accessed on 24 September 2019).
- Madias, J.E. A proposal for monitoring patients with heart failure via smart phone technology-based electrocardiograms. J. Electrocardiol. 2016, 49, 699–706. [Google Scholar] [CrossRef] [PubMed]
- Android App for Patient Monitoring. Available online: https://www.amrita.edu/center/awna/research/patient-monitoring-app (accessed on 24 September 2019).
- Arzeno, N.M.; Deng, Z.D.; Poon, C.S. Analysis of first-derivative based QRS detection algorithms. IEEE Trans. Biomed. Eng. 2008, 55, 478–484. [Google Scholar] [CrossRef] [PubMed]
- Pan, J.; Tompkins, W.J. A real-time QRS detection algorithm. IEEE Trans. Biomed. Eng. 1985, 32, 230–236. [Google Scholar] [CrossRef] [PubMed]
- Hamilton, P.S.; Tompkins, W.J. Quantitative investigation of QRS detection rules using the MIT/BIH arrhythmia database. IEEE Trans. Biomed. Eng. 1986, BME-33, 1157–1165. [Google Scholar] [CrossRef]
- Castells-Rufas, D.; Carrabina, J. Simple real-time QRS detector with the MaMeMi filter. Biomed. Signal Process. Control 2015, 21, 137–145. [Google Scholar] [CrossRef]
- Yochuma, M.; Renaudb, C.; Jacquira, S. Automatic detection of P, QRS and T patterns in 12 leads ECG signal based on CWT. Biomed. Signal Process. Control 2016, 25, 46–52. [Google Scholar] [CrossRef]
- Meraha, M.; Abdelmalika, T.A.; Larbi, B.H. R-peaks detection based on stationary wavelet transform. Comput. Methods Programs Biomed. 2015, 121, 149–160. [Google Scholar] [CrossRef]
- Benitez, D.S.; Gaydecki, P.A.; Zaidi, A.; Fitzpatrick, A.P. A new QRS detection algorithm Based on the Hilbert transform. In Proceedings of the Computers in Cardiology 2000, Cambridge, MA, USA, 24–27 September 2000; pp. 379–382. [Google Scholar]
- Zhang, F.; Lian, Y. Wavelet and Hilbert transforms based QRS complexes detection algorithm for wearable ECG devices in wireless Body Sensor Networks. In Proceedings of the IEEE Biomedical Circuits and Systems Conference, Beijing, China, 26–28 November 2009; pp. 225–228. [Google Scholar]
- Martínez, A.; Alcaraz, R.; Rieta, J.J. Application of the phasor transform for automatic delineation of single-lead ECG fiducial points. Physiol. Meas. 2010, 31, 1467–1485. [Google Scholar] [CrossRef]
- Christov, I.I. Real time electrocardiogram QRS detection using combined adaptive threshold. Biomed. Eng. Online 2004, 3, 28. [Google Scholar] [CrossRef] [PubMed]
- Karimipour, A.; Homaeinezhad, M.R. Real-time electrocardiogram P-QRS-T detection–delineation algorithm based on quality-supported analysis of characteristic templates. Comput. Biol. Med. 2014, 52, 153–165. [Google Scholar] [CrossRef] [PubMed]
- Zhang, F.; Lian, Y. Effective ECG QRS detection based on multiscale mathematical morphology filtering. IEEE Trans. Biomed. Circuits Syst. 2009, 3, 220–228. [Google Scholar] [CrossRef] [PubMed]
- Yazdani, S.; Vesin, J.M. Extraction of QRS fiducial points from the ECG using adaptive mathematical morphology. Digit. Signal Process. 2016, 56, 100–109. [Google Scholar] [CrossRef]
- Farashi, S.A. multiresolution time-dependent entropy method for QRS complex detection. Biomed. Signal Process. Control 2016, 24, 63–71. [Google Scholar] [CrossRef]
- Phukpattaranont, P. QRS detection algorithm based on the quadratic filter. Expert Syst. Appl. 2015, 42, 4867–4877. [Google Scholar] [CrossRef]
- Kim, J.; Shin, H. Simple and robust realtime QRS detection algorithm based on spatiotemporal characteristic of the QRS complex. PLoS ONE 2016, 11, e0150144. [Google Scholar] [CrossRef]
- Zhang, X.; Lian, Y. A 300-mV 220-nW event-driven ADC with real-time QRS detection for wearable ECG sensors. IEEE Trans. Biomed. Circuits Syst. 2014, 8, 834–843. [Google Scholar] [CrossRef]
- Gutiérrez-Rivas, R.; García, J.J.; Marnane, W.P.; Hernández, Á. Novel real-time low-complexity QRS complex detector based on adaptive thresholding. IEEE Sens. J. 2015, 15, 6036–6043. [Google Scholar] [CrossRef]
- Silva, H.P.; Lourenço, A.; Fred, A.; Raposo, N.; Aires-de-Sousa, M. Check your biosignals here: A new dataset for off-the-person ECG biometrics. Comput Methods Programs Biomed. 2014, 113, 503–514. [Google Scholar] [CrossRef]
- Check Your Biosignals Here Initiative (CYBHi) Dataset for Off-the-Person Electrocardiography (ECG) Biometrics. Available online: https://zenodo.org/record/2381823#.XYn59kYzabh (accessed on 24 September 2019).
- MIT-BIH Noise Stress Test Database. Available online: https://physionet.org/physiobank/database/nstdb (accessed on 7 August 2019).
- American National Standard ANSI/AAMI EC 57:2012, Testing and Reporting Performance Results of Cardiac Rhythm and ST-Segment Measurement Algorithms. Available online: https://webstore.ansi.org/RecordDetail.aspx?sku=CARDIO+MEDICAL+DEVICE+PACKAGE (accessed on 8 August 2019).
- Hoglinger, M. Electronics and Information Technology. Bachelor’s Thesis, Jonannes Kepler University, Linz, Austria, 2016. [Google Scholar]
- Eguchi, K.; Aoki, R.; Yoshida, K.; Yamada, T. Reliability evaluation of R-R interval measurement status for time domain heart rate variability analysis with wearable ECG devices. In Proceedings of the 39th Annual International Conference of the IEEE Engineering in Medicine and Biology Society (EMBC), Seogwipo, Korea, 11–15 July 2017; pp. 1307–1311. [Google Scholar]
- Eguchi, K.; Aoki, R.; Shimauchi, S.; Yoshida, K.; Yamada, T. R-R interval outlier processing for heart rate variability analysis using wearable ECG devices. Adv. Biomed. Eng. 2018, 7, 28–38. [Google Scholar] [CrossRef]
© 2019 by the authors. Licensee MDPI, Basel, Switzerland. This article is an open access article distributed under the terms and conditions of the Creative Commons Attribution (CC BY) license (http://creativecommons.org/licenses/by/4.0/).