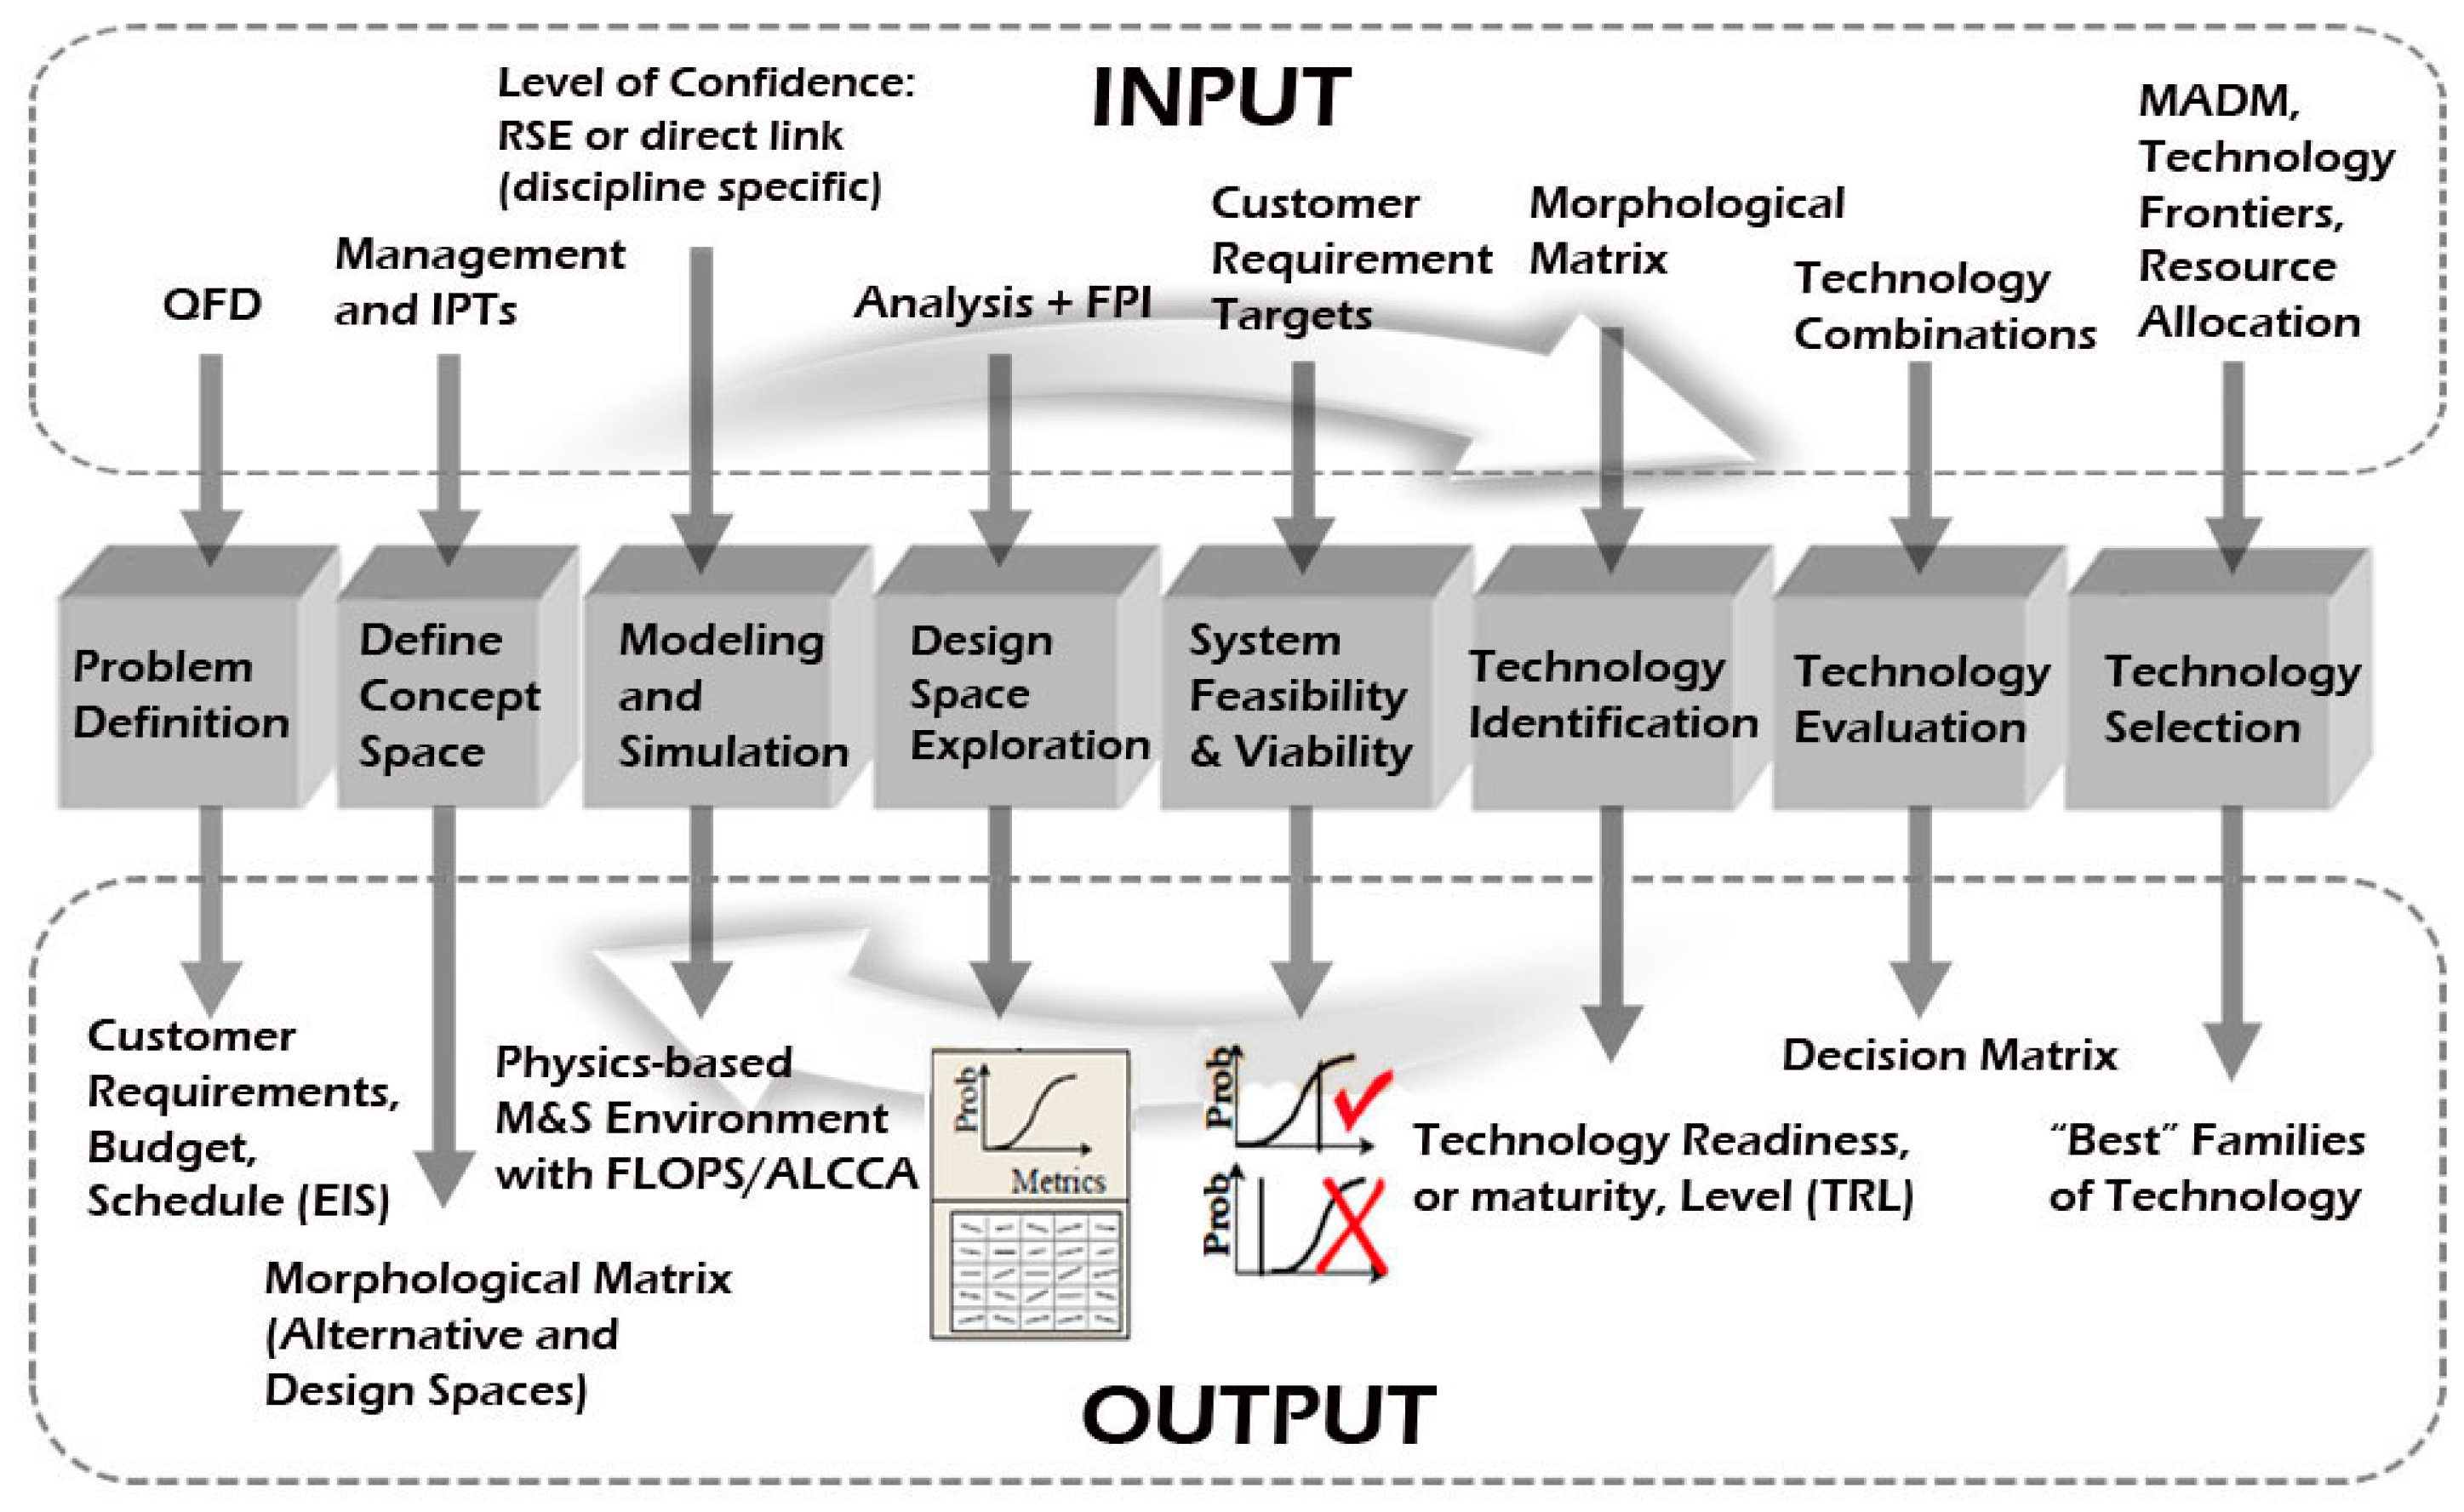
Article

Sensitivity Analysis and Technology Evaluation for a Roadable Personal Air Vehicle at the Conceptual Design Stage

Department of Aerospace Engineering, Sejong University, 209, Neungdong-Ro, Gwangjin-Gu, Seoul 05006, Korea
*
Author to whom correspondence should be addressed.
Appl. Sci. 2019, 9(19), 4121; https://doi.org/10.3390/app9194121
Submission received: 30 August 2019 / Revised: 23 September 2019 / Accepted: 26 September 2019 / Published: 2 October 2019
(This article belongs to the Special Issue Autonomous Micro Aerial Vehicles: Methods and Applications)

Abstract

:
In this study, the technology identification, evaluation, and selection (TIES) method was implemented to explore an optimum design space appropriate for a personal air vehicle (PAV) at the conceptual design stage. A morphological matrix was employed to identify possible alternative configurations and performance targets. The Microsoft Excel add-in JMP, a commercial statistical tool, and a PAV sizing tool developed for this study were used for modelling and simulation. After the screening test, seven design variables having significant impacts on the design were finally chosen, specifically the range, maximum speed, cruise speed, cruise altitude, passengers, takeoff ground roll, and stall speed. Response surface equations (RSEs) were created as a function of the seven design variables. The generated RSEs were then used to perform a Monte Carlo simulation (MCS) to explore a feasible design space. As a result, it was confirmed that all seven design variables can be employed for an optimization process. In addition, k-factor and technology sensitivity analyses were conducted to evaluate applicable technologies quantitatively. Consequently, the selected set includes a flow circulation flap, leading edge blowing, a nanocoating, liquid metal, and an advanced composite material, which are technologies that greatly influenced the target criteria. Furthermore, the target value variations were analyzed as the k factors changed.

1. Introduction

A personal air vehicle (PAV), a type of future transportation, is an emerging aviation market that may provide on-demand aviation services to resolve traffic congestion. Because the desire for rapid door-to-door air travel that also avoids traffic jams is drawing attention to new possible transportation systems, it is expected that PAVs will play a key role as one such transportation system in the near future.
In response to this paradigm shift, the U.S. government has initiated several projects, such as the Personal Air Vehicle Exploration (PAVE) and the Next Generation Air Transportation System (NextGen), focusing especially on the Small Aircraft Transportation System (SATS). In addition, certain aviation companies such as Terafugia, AeroMobil, and PAL-V are pioneering new markets for roadable PAVs.
A team of researchers at the Georgia Institute of Technology has conducted research to develop promising roadable aircraft concepts that meet a set of potential design requirements. In their research, a notional roadable aircraft concept was designed and analyzed to meet a generic set of roadable aircraft performance requirements. Subsequently, a number of different propulsion system architectures were considered and quantitatively compared. Finally, requirement and technology trade-off studies were conducted in relation to a notional roadable aircraft concept [1].
Although several roadable aircraft including PAVs have been developed and completed their flight tests successfully, the commercialization of roadable aircraft has been delayed due to well-known safety and certification problems of interest to both regulators and industry. Even if these issues are resolved in the very near future, the prices of roadable aircraft should be competitive before they can enter the aviation market. Moreover, it is necessary to consider an optimization process, widely used in a variety of industries, for the design of the complex systems needed during the PAV development process in order to maximize the efficiency of these vehicles [2]. To make these aircraft less sensitive to both economic and environmental factors, it is essential to employ optimization techniques such as fuzzy clustering analysis in the conceptual design. Moreover, it is necessary to consider an uncertainty analysis. Traditional uncertainty analyses need many sampling points to simulate uncertain models. These methods include a large number of calculations to achieve the required level of accuracy. A method with dynamic surrogate models based on a fuzzy clustering analysis can increase the efficiency of an uncertainty analysis and reduce the effects of error propagation on uncertainty models. Such a method should show that the calculated uncertainty from an uncertainty analysis can be reduced effectively while optimizing the performance to meet reliability and robustness targets [3].
Aircraft design requires collaborative work among experts in various fields to make the proper decisions and therefore achieve the expected performance outcomes at a lower cost and with less risk. An agile decision support system (ADSS) for aircraft design that comprehensively integrates and applies modeling and simulation (M&S), artificial intelligence, data mining, and group decision-making technology was proposed. The ADSS provides a rich set of simulation, assessment, and optimization tools for decision makers, offering an important objective reference for effectively improving the accuracy of decisions [4].
The development of unmanned aerial vehicles (UAVs) has attracted much attention in the aviation industry for decades. Chung et al. presented the design, manufacturing, and flight testing of an electric-powered experimental flying wing unmanned aerial vehicle (UAV) [5]. The design process began by defining the performance requirements, including the stall speed, maximal speed, cruise altitude, absolute ceiling, as well as turn radius and speed. Gokcin et al. developed a methodology for sizing the electric propulsion subsystems of UAVs [6]. An electric-powered UAV is heavier than a petroleum UAV in all scenarios. A report from the U.S. Department of Defense (DoD) addressed some significant technologies needed for various UAVs [7].
Sunlight is considered inexhaustible, and solar-powered UAVs can be in continuous flight in theory if they do not require maintenance. Therefore, many researchers have focused on solar-powered aircrafts. Brandt and Gilliam presented a methodology for the conceptual design of a solar-powered aircraft [8].
An optimization process is vital during the conceptual design process of an aircraft because an optimization process can enable maximum aircraft performance by considering many different design variables [9]. Among the variety of design variables currently used, an aerodynamic analysis for initial sizing is typically conducted with a surrogate modeling technique. In general, a surrogate model is used to retain the predictive capability of the design space while reducing the computational cost [10].
The response surface methodology (RSM) developed by Box and Wilson in 1950 was used as the optimization process mentioned above to minimize the computational costs in a study [11]. The tendency to get trapped in local minima is a shortcoming in conventional gradient-based optimization techniques. Generic algorithms are more efficient than conventional gradient-based optimization techniques. An optimal sizing method based on generic algorithms, minimum power cruising speed, and mass parameterization was developed [12]. Furthermore, in this study, the technology identification, evaluation, and selection (TIES) method was implemented to explore an optimum design space appropriate for PAVs during the conceptual design.

2. Design of Experiment

A designed experiment is a test or series of tests in which purposeful changes are made to the input variables of a process or system to enable observation and identification of the reasons behind changes in the output response. The use of an experimental design in these areas can result in products that are easier to manufacture and that that offer enhanced field performance and reliability, a lower product cost, and shorter product design and development times [13]. Design of experiment (DOE) is typically linked to a statistical analysis to gain the maximum amount of information with minimal effort, leading to a reduction in the total design cycle time. When a data analysis on either the response parameters or response variations is likely, it is generally recommended to visualize the DOE with a graph if necessary.
In this study, the following DOE techniques were employed: (i) factorial design, (ii) fractional factorial design, and (iii) central composite design.

2.1. Factorial Design

This design method includes all possible combinations of all factors at all levels. There can be two or more levels, but the number of levels influences the number of experiments needed. For two factors at p levels, 2 P experiments are needed for a full factorial design [14].

2.2. Fractional Factorial Design

Fractional factorial designs are designs that include the greatest number of important combinations of the variables. The significance of effects found by using these designs is expressed using statistical methods. Quite often, the experimental design problem is defined as finding the minimum number of experiments for the given purpose [14].

2.3. Central Composite Design

The central composite design (CCD) is one of the most important designs for fitting second-order response surface models. It involves the use of a two-level factorial or fraction combined with the following 2k axial or star points. As a result, the design can involve, for instance, F factorial points, 2k axial points, and n c center runs.
The sequential nature of the design becomes very obvious. The factorial points represent a variance-optimal design for a first-order model or a first-order + two-factor interaction model. Center runs clearly provide information about the existence of curvature in the system. If curvature is found in the system, the addition of axial points allows for efficient estimations of the pure quadratic terms [15].

3. TIES Method

The technology identification, evaluation, and selection (TIES) method outlines a comprehensive and robust methodology for decision-making in the early phases of aircraft design. This method provides the decision maker with the ability to easily assess and balance the effects of various technologies in the absence of sophisticated, time-consuming mathematical formulations for project resource allocation. The method also provides a framework where technically feasible and economically viable alternatives can be identified with accuracy and speed while the impact on the cost is quantified. The method proposes a framework in which a variety of advanced design methodologies, such as the response surface methodology and Monte Carlo simulation, can be linked. Through the implementation of each step as shown in Figure 1, the best family of alternatives for a customer-focused overall measure of value can be identified and assessed subjectively or objectively [16].

3.1. Problem Definition

The TIES method systematically identifies and evaluates new technologies in eight steps. In the first step, it requires the identification of the problem and determination of the target values for the design. The target values for the PAV design are presented in Table 1. The rationale for the target values is as follows.
The maximum takeoff weight (MTOW) is considered as one of the most important factors in aircraft design because it affects not only aircraft performance metrics such as the stall speed but also the cost analysis via the weight data. In this study, the target value for the PAV MTOW was determined by considering an existing fixed-wing PAV developed by AeroMobil [17].
The wing span must be considered as one of design variables with length constraint in a fixed-wing PAV design, as the vehicle should be able either to take off from or land on a road if necessary. In this study, it was assumed that PAVs take off from and land on a four-lane road. In general, a fixed-wing PAV requires a wing-folding mechanism. The wing root chord was determined by considering the minimum width of the vehicle, because the wing root chord has the greatest impact on the vehicle’s width when the vehicle is in the driving mode [18].
Wing loading (W/S) plays a key role in determining the wing area when designing an aircraft. It is also considered as a significant factor affecting the lift coefficient, wetted area, and wing span. In addition, the aircraft performance is typically influenced by W/S, meaning that it must be considered during the design of an aircraft. Due to the lack of information available, the authors decided to determine a target value for W/S by investigating statistical data for general aircraft of a size similar to that of a fixed-wing PAV [19].
The power-to-weight ratio (P/W) is also considered as a highly important factors affecting the aircraft performance. In particular, it is considered as a significant variable during the engine selection process. The P/W ratio was also estimated using available statistical data [19].

3.2. Define Concept Space

3.2.1. Define the Technology and Concept Space

In general, there are numerous combinations of subsystems that can meet the requirements of the design of any complex system, such as an aircraft. Identifying possible alternatives for the configuration of aircraft is usually achieved by constructing a morphological matrix. The morphological matrix consists of rows and columns. Generally, rows include information about the major characteristics, whereas columns contain information pertaining to possible design alternatives. After completing the construction of the morphological matrix, a baseline design concept is typically determined based on the decision maker’s experience and knowledge.

3.2.2. Define the Design Space

After the main configuration of the aircraft is determined, the design variables should be specified to quantify the variables that may affect the PAV performance physically. Because design variables are not isolated during the conceptual design process but vary continuously, the objective is to find optimized conditions for the design by repeating the calculation process in particular regions.

3.3. Modeling and Simulation

In order to evaluate the impacts of the concepts chosen from the morphological matrix, modeling and simulation are necessary. This requires a clear understanding of the performance of the baseline case. In this study, as a tool for modeling and simulation, the software programs of MS Excel, JMP developed by SAS [20], and the aforementioned PAV sizing tool developed for this study were employed.
The roadable PAV sizing tool programmed with both Excel and Visual Basic for Applications is composed of a mission sheet, a concepts sheet, a technology sheet, a constraint analysis sheet, an aerodynamic sheet, a propulsion sheet, and a weight sheet.
As shown in Figure 2, the PAV sizing tool requires the following steps: (i) specify the design variables, (ii) choose the mission profile and option, (iii) calculate the performance and perform a constraint analysis, and (iv) iterate the sizing process and perform optimization. The baseline configuration of the PAV is shown in Figure 3 and Figure 4.

3.4. Design Space Exploration

The design space exploration step involves a screening test, the generation of meta-models of the design variables, and a Monte Carlo simulation (MCS). In the screening test, a sensitivity study is typically performed to identify design variables that may have a great impact on the target values. A possible design range is then obtained by collaboration between the meta-model and the MCS.

3.4.1. Screening Test

As mentioned above, a screening test is typically used to identify the design variables that largely affect the target values among the design variables. In this study, the fractional factorial design approach was utilized with twelve design variables and seven response variables for screening test purposes. There are two levels for each design variable, and 128 experiments in total were performed. The actual design range for each variable was estimated by means of inverse scaling of the design variables.
In order to capture the effects of all of the design variables at once, the DOE had to be used along with not only a regression analysis but also a Pareto plot with a p-value. The vertical axis is the frequency of occurrence, but it can alternatively represent the important unit of design variables. Because the values are in decreasing order, the cumulative function is a concave function. To take the example in Figure 5, in order to design the maximum takeoff weight (MTOW) by 80% target value, it is sufficient to consider the first five design variables, i.e., takeoff ground roll, passengers, cruising speed, maximum speed, range. The purpose of the Pareto chart is to highlight the most important among a (typically large) set of factors. In quality control, it often represents the most common sources of defects, the highest occurring type of defect, or the most frequent reasons for customer complaints, and so on. In this study, based on the Pareto plot and cumulative density distribution, the authors explored the design variables that could take into account the variability of a target value at 80% through a screening test.
A regression analysis establishes a fitted equation to explain the behavioral pattern of the data, and the regression analysis is usually validated with the p-value. In the statistics literature, the p-value is defined, when the null hypothesis is true, as a probability that quantifies the idea of statistical significance of the evidence. Therefore, the null hypothesis is adopted when the p-value has a value between 0 and 1 (typically greater than 0.05). Null hypotheses are types of conjectures used in statistical tests, which are formal methods of reaching conclusions or making decisions on the basis of data. The hypotheses are core elements of statistical inference, heavily used in the interpretation of scientific experimental data, to separate scientific claims from statistical noise. The statement being tested in a test of statistical significance is called the null hypothesis. The test of significance is designed to assess the strength of the evidence against the null hypothesis. Usually, the null hypothesis is a statement of “no effect” if the p-value is greater than 0.05. In this study, seven design variables were ultimately selected after exploring the Pareto graph and completing the p-value estimation. The selected design variables are tabulated in Table 2.

3.4.2. Response Surface Methodology

Response surface methodology (RSM) is defined as a method that predicts the relationship between design variables and responses. In other words, it is designed to retain the predictive capability within the design space while reducing the computational cost. To be explicit, the methodology provides a multi-variate linear regression equation to generate the response model of a complex system involving multiple control variables, as follows:
y = β 0 + i = 1 k β i x i + i = 1 k β i i x i 2 + i = 1 k 1 j = i + 1 k β i j x i x j ,
where y is the response, x i and x j are the design variables, and β 0 , β i , β i i , and β i j are the regression coefficients.
In order to realize the optimized RSM model, central composition design (CCD) was employed in conjunction with the regression analysis. The CCD was created through the aforementioned JMP software. In total, 143 experimental points were created with design variables chosen after the screening test. The actual design range was estimated through inverse scaling of the selected design variables. To evaluate the accuracy of the optimized response surface equation (RSE), the coefficient of determination metric was evaluated. The coefficient of determination ( R 2 ) represents the variation of the response accounted for by an approximate model. It is given by the following:
R 2 = 1 ( Y j Y ^ j ) 2 ( Y j Y ¯ ) 2 ,
where Y j is the exact response, Y ^ j is the predicted response, and Y ¯ is the mean value of the exact response. It should be noted that the coefficient of determination is always between 0 and 1. However, the coefficient of determination may not be considered as a valid metric in a multi-variate regression because the summation of the residual is generally reduced as the number of design variables increases; thus, the coefficient of determination tends to increase. To overcome these concerns, the adjusted R-squared ( A R 2 ), a modified version of the coefficient of determination, was introduced, as follows:
A R 2 = 1 ( Y j Y ^ j ) 2 / n k 1   ( Y j Y ¯ ) 2 / n 1 .
In this equation, n is the sample size and k is the total number of explanatory variables in the model. As shown in Table 3, as either R 2 or A R 2 moves closer to 1, it becomes easier to explain the relationship between the design variables and the responses. In this study, JMP software was used to calculate the regression coefficients. The calculated coefficients are shown in Table 4.

3.4.3. Monte Carlo Simulation

A Monte Carlo simulation is a type of simulation that relies on repeated random sampling and statistical analysis to compute the results. This method of simulation is very closely related to random experiments for which a specific result is not known in advance [21]. Mathematical models can be deterministic or stochastic. A deterministic model is one in which the state variables are uniquely determined by parameters in the model and by sets of previous states of these variables. Therefore, deterministic models perform the same way for a given set of parameters and initial conditions, and their solution is unique. Conversely, stochastic model parameters are described by random variables or distributions rather than by a single value. Correspondingly, state variables are also described by a probability distribution. Thus, a stochastic model yields a manifold of equally likely solutions, allowing the modeler to evaluate the inherent uncertainty of a natural system [22].
To explore the design space fully, an MCS with 10,000 cases was run with the generated RSE. To generate the 10,000 cases randomly, the MS Excel program was used. Cumulative distribution function (CDF) plots were used to assess the feasibility and viability of the design space.

3.5. Determine System Feasibility and Viability

In order to determine the feasibility and viability of the system, the MCS results were fed into the CDF and the feasibility of the system was assessed through a comparison with the target values. The desirability function was then used for the results of the RSM. A schematic of the feasibility and viability of the system is presented in Figure 6.

3.5.1. Cumulative Distribution Function

In the probability and statistics literatures, the CDF is defined as the probability that a real-valued random variable, denoted as X , will take a value less than or equal to x . The CDF is given by the following:
F ( x ) = P ( X x ) ,
where the right-hand side represents the probability that a random variable X takes on a value less than or equal to x . Figure 7 and Table 5, Table 6 and Table 7 show the target values and feasible design space.
Based on the results generated by the MCS, it was observed that the feasible design space for MTOW is from 2238 to 3219 lbs. and the target value for the MTOW is less than 2500 lbs. A probability that is capable of satisfying the target value for MTOW is 26.7%. In a similar way, the feasible design space for wing span is from 29 to 40 ft and a probability that is capable of satisfying the target value for wind span is 100%. The feasible design space for wing root chord is from 5.1 to 6.9 ft and a probability that is capable of satisfying the target value for wind root chord is 2.5%. The feasible design space for W/S is from 15 lb / f t 2 to 19 lb / f t 2 and a probability that is capable of satisfying the target value for W/S is 50%. The feasible design space for the P/W ratio is from 0.061 hp/lb to 0.089 hp/lb and a probability that is capable of meeting the target value for the wind span is 50%. With regard to fuel efficiency, it is a qualitative variable, and the feasible design space is from 9.36 to 14.84 mpg. Although the wing root chord design variable appears to show a low probability that meets the target value, it was confirmed that all design variables could be used for the optimization process. Hence, this indicates that it is possible to optimize the baseline design values in the feasible design space.

3.5.2. Parameter Optimization

A desirability function is typically used for optimizing the model created by the RSM. The desirability function approach is based on the concept of optimizing multiple response processes. The desirability functions are categorized as response maximization, response minimization, and assigning a target value, as shown in Equations (5)–(7) as follows:
d i = { 0 i f   y ^ i < y i L ( y ^ i y i L T i y i L ) s i f   y i L < y ^ i < T i 1 i f   y ^ i > T i ,
d i = { 1 i f   y ^ i < T i ( y ^ i y i U T i y i U ) s i f   T i y ^ i y i U 0 i f   y ^ i > y i U ,
d i = { ( y ^ i y i L T i y i L ) s i f   y i L y ^ i T i ( y ^ i y i U T i y i U ) t i f   T i < y ^ i y i U 0 i f   y ^ i > y i U ,
where T i is the target value, y i is the desired response, y i L is the lower value, and y i U is the upper value.
The goal of the desirability function approach is to find the combination of design variables by which the geometric mean is maximized for each desirability function. The geometric mean is a mean or average indicating the central tendency or a typical value of a set of numbers using the product of their values. The geometric mean is defined as the nth root of the product of n numbers, as shown in Equation (8). The function shape can be determined by changing the variables. Once these variables are defined as greater than 1, they approach the target values [23]:
D = ( d 1 × d 2 × × d n ) 1 n .
JMP software provides the capability of determining a “desirability function”. In this study, the authors used the capability for six responses (MTOW, wing span, wing root chord, W/S, P/W, and fuel efficiency) and performed optimization with response maximization.
In Figure 8, the x- and y-axes represent the design variables and responses, respectively. In addition, the characteristic of desirability is depicted in Figure 8. The optimized design variables and target values are summarized in Table 8 and Table 9, respectively. It should be noted that the optimized target values were evaluated by the PAV sizing tool, which means that the values were not estimated by the RSE. As depicted in Table 9, it was found that all design variables except for the wing root chord reach the target values. The wing root chord design variable was investigated further in the technology identification section below.

3.6. Technology Identification

This technology identification section identifies latent technologies that meet the target values. After identifying applicable technologies, it is necessary to evaluate their impacts quantitatively. These impacts can be modeled as a technology impact factor, called the k factor. In this study, the k factors were fed into the PAV sizing tool calculation as weighted parameters. For example, the k factors can be used as the tool calculates the weight, drag force, and so forth. Finally, the k factors were determined after considering the pros and cons and the technology readiness level (TRL), as shown in Table 10. Equation (9) describes how the k factors are used in the PAV sizing tool:
W f u s e l = k c a r s y s t e m × [ 0.065 × ( E W 2000 ) × 0.175 ] ,
where W is the fuselage weight, k is a factor related to the fuselage weight, and EW is the empty weight.
There are so many technologies to improve the aerodynamic performance of a roadable PAV in the future. Flow circulation control, pneumatic channel wing, distributed propulsion, etc., can be used as high lift devices. In addition, the Goldschmied fuselage, nanocoating, piezoelectric active skin, etc., can be used to reduce fuselage drag in the future. However, in this study, only one representative technology was chosen for each TRL as shown in Table 10.

3.6.1. Flow Circulation Flap

A flow circulation flap utilizes the principle of the Coanda effect, which enables a flow at a slit to attach over the wing. This results in an increase in the lift force due to the generation of the downwash effect. According to a computational experiment by Montanya and Marshall [24], the lift coefficient of a NASA SC (2)-0414 airfoil with a 30 degree flap angle is increased by 30% compared to the zero flap angle case; the lift coefficient is estimated to be 3.3. The k factor for the lift coefficient in this study was defined with values of 0.1 and −0.15 for the friction drag and 0.01 and 0.05 for the aero structure weight factor and electronics weight factor, respectively.

3.6.2. Leading Edge Blowing

Leading edge blowing is a technique that delays flow separation by injecting a flow over the leading edge [25]. This increases the stall angle such that the maximum lift coefficient can be increased. The ultimate objective of leading edge blowing is to use flow control to delay leading edge separation from the airfoil, which in practical terms will allow the removal of the leading edge slat devices [26]. However, the technique has also adverse effects, such as increasing the weight due to the complexity of the system. Therefore, in this study, the authors defined the k factor with values of −0.1 for the friction drag and 0.01 for the aero structure weight factor.

3.6.3. Nanocoating

The crude material such as the nanocoating used here is composed of nanoscale acrylic polymer beads. In the conceptual design, the nanocoating is applicable to all surfaces because it is not necessary to modify the geometric design. Once the nanocoating is applied, it is expected that a laminar and turbulent flow reduces the drag force by 40% and 15%, respectively. This in turn increases the fuel efficiency by 2% [27]. Nanocoating does not require geometric design modifications, and can be applied to any surface except windows. Nanocoating is currently being tested on Russian aircraft so that this TRL 7 technology could be applicable to a roadable PAV in the future. In this study, the k factors for the lift, drag, and weight were determined after considering the pros and cons.

3.6.4. Piezoelectric Active Skin

Piezoelectric active skin refers to the technique of vibrating the wing surface in a direction where it resists a turbulent flow. This results in increasing the lift coefficient as well as decreasing the drag coefficient. A research group from Southampton University conducted a study of the relationship between the piezoelectric active skin technique and the lift/drag coefficients by applying the technique to the upper surface of a NACA 0015 airfoil [28]. According to their results, applying the technique helps to increase the lift coefficient and decrease the drag coefficient when the Reynolds number is defined as 4.8 × 10⁵. However, in a low Reynolds number condition, it was reported that the technique had little impact on the lift/drag coefficients. This technology is included in the technology identification because of the large effect of lift and drag coefficients on PAV designs where stability is important. In this study, the k factors for the lift, drag, and weight were determined after considering the pros and cons.

3.6.5. Liquid Metal

Liquid metal was developed by NASA, the California Institute of Technology, and the U.S. Department of Energy [29]. Liquid metal is a type of alloy, a mixture of three of more metals, with characteristics similar to plastic that cools quickly and has more than twice the strength of titanium [30]. Liquid metal has certain unique properties. For example, molding is relatively easy with this material, and it is light in weight compared to other metals. This technology is included in the technology identification because aircraft manufacturers claim that it can be used for aircraft structural components. It combines a high degree of elasticity and strength. Although this TRL 6 technology concept has been demonstrated, it is not yet applicable to the aerospace industry. Thus, in this study, the k factor for the liquid metal was determined after considering the specific advantages.

3.7. Technology Evaluation

The technologies from the technology impact matrix in Table 10 were assessed by creating a DOE for the k factors using the provided design ranges. The DOE used for the technology evaluation was a factorial design, and 256 experimental samples in total were prepared to evaluate the impact of each combination of technologies. The method used to determine the k factors for the evaluation of each combination of technologies is described below.
In Table 11, −1 indicates that the technology is not fused into the design, whereas +1 indicates the fusing of the technology in the design. For example, in the 130th experiment, both T1 and T8 were fused into the design, and they had effects on Friction Drag Factor (FDF), Aero Structure Weight Factor (ASWF), Car System Weight Factor (CSWF), Lift Factor (LF), and Electronic Weight Factor (EWF). Thus, the k factors for T1 and T8 were implemented into the baseline factors as follows:
F D F = 1 + ( 0.15 ) + ( 0 ) ,
A S W F = 1 + ( 0.01 ) + ( 0.05 ) ,
C S W F = 1 + ( 0 ) + ( 0.05 ) ,
S F = 1 + ( 0.1 ) + ( 0 ) ,
E W F = 1 + ( 0.05 ) + ( 0 ) .
A portion of all possible technology combinations with respect to the optimized target values is summarized in Table 12.

3.8. Technology Selection

One of the objectives during the technology evaluation step is to find any combinations of technologies that cause the design variables to reach the target values to meet the requirements. In the previous section, we observed that the wing root chord design variable was not able to reach the target value. Hence, under the condition guaranteeing that the other design variables are within the feasible design space, a few technology combinations were chosen to satisfy the target value for the wing root chord. Finally, with eight technology combinations, it was confirmed that the wing root chord design variable reached the target value, which was 5.3. The selected technology combinations and the final target values are tabulated in Table 13 and Table 14, respectively.

4. Sensitivity Analysis

4.1. Technology

In order to conduct a technology sensitivity analysis, each technology infuses the optimized design variables to determine how the design variables change. In general, a technology sensitivity analysis enables one to observe how a target value varies when the technology is infused in the design space. In this study, technology sensitivity analyses were performed with the eight selected technologies. The deviations for each of the target responses are depicted in Figure 9, Figure 10, Figure 11, Figure 12 and Figure 13. As a result, the following observations were made. (i) The advanced composite material (T8) technology has the greatest impact on the MTOW and reduces it by 3.4%. (ii) The flow circulation flap (T1) and advanced ducted fan (T5) technologies have the lowest impacts on the MTOW, reducing it by 1.2%. (iii) The piezoelectric active skin (T4) technology increases the MTOW by 0.6%. Both the wing span and wing root chord show identical trends with regard to the MTOW. (iv) The flow circulation flap (T1) technology has the greatest impact on the P/W ratio, reducing it by 8.7%. (v) The advanced ducted fan (T5) technology has the lowest impact on the P/W, reducing it by 3%. (vi) The liquid metal (T6) and advanced composite material (T8) technologies increase the P/W by 0.4% and 0.5%, respectively. (vii) Regarding the fuel efficiency, all technologies increase the fuel efficiency. For instance, the nanocoating (T3) technology increases the fuel efficiency by 8.4%.

4.2. K Factor

The k factors are fed into the PAV sizing tool calculation, in this case with the calculated weight and drag force as weighted parameters. Additionally, a k factor sensitivity analysis enables us to analyze how each k factor affects the design space. Accordingly, the k-factor sensitivity analysis can help decision makers during the PAV design process find the proper technologies that contain the best combinations of technologies. In this study, a k-factor sensitivity analysis was conducted with 19 factors that could have an impact on the optimized design results. The lower and upper bounds for the k factors were correspondingly defined with negative and positive 10% intervals. As a result, 12 factors were finally chosen after considering the sensitivity results. The selected factors are as follows: the combustion engine Specific Fuel Consumption (SFC), combustion engine weight, propulsion efficiency, structure weight, landing gear weight, car system weight, cabin weight, morphing mechanism weight, electronic weight, parachute weight, induced drag, and friction drag. Based on the observations from the k-factor sensitivity analysis, here are the findings. (i) As the “combustion engine SFC” factor increases, the MTOW/wing span/wing root chord value increases while the power-to-weight ratio/fuel efficiency decreases. (ii) As the “combustion engine weight” factor increases, the MTOW/wing span/wing root chord value increases while the power-to-weight ratio/fuel efficiency decreases. (iii) As the “propulsion efficiency” factor increases, the MTOW/wing span/wing root chord/power-to-weight ratio decreases while the fuel efficiency increases. (iv) As the “structure weight” factor increases, the MTOW/wing span/wing root chord value increases while the power-to-weight ratio/fuel efficiency decreases. As can be seen, the factors related to the weight (i.e., the “combustion engine weight” and the “structure weight”) have identical tendencies as the k factors are varied. (v) As the “induced drag” and “friction drag” increase, the MTOW/wing span/wing root chord/power-to-weight ratio increases while the fuel efficiency decreases. All of these results are shown in Figure 14 and Figure 15.

5. Conclusions

In this study, an optimization study with the TIES method was conducted on a PAV from a conceptual design standpoint. By investigating an existing design similar to roadable PAVs in South Korea, target goals were specified. Based on a market analysis, target values for the following design variables were specified: (i) MTOW, (ii) wing span, (iii) wing root chord, (iv) W/S, (v) P/W, and (vi) fuel efficiency. A morphological matrix was employed to define the concept space with the conventional type of system design. For modeling and simulation, JMP software developed by SAS, Microsoft Excel, and a PAV sizing tool developed for this study were utilized. To explore the design space, both a screening test and a Pareto front analysis were conducted to determine the design variables that had the greatest influence on the design. As a result, seven design variables were finally chosen, specifically the range, maximum speed, cruise speed, cruise altitude, passengers, takeoff ground roll, and stall speed. A CCD was constructed to sample experimental points with the selected design variables. RSE values were then generated using the sample points. To evaluate the accuracy of the generated RSEs, the coefficient of determination was calculated and evaluated. Consequently, it was found that the metric values are close to 1. Using the generated RSEs, an MCS was performed to propagate the metrics of interest and to explore the design space within the provided design ranges. Based on the results from the MCS, it was observed that a probability of meeting the target value for the MTOW is 26.7%. Similarly, the wing span value was 100%, the wing root chord value was 2.5%, the W/S ratio was 50%, and the P/W ratio was 50%. Moreover, the design range for fuel efficiency was estimated to be from 0.061 hp/lb to 0.089 hp/lb; therefore, it was confirmed that all design variables could be used for the optimization process. The optimized design variables were then acquired using JMP’s desirability function. However, it was found that the wing root chord design variable could not reach the target value, as expected.
In the technology identification and evaluation steps, several applicable technologies having significant impacts on the design were explored to determine if the technologies allow the design variables to meet the target values by infusing suitable technologies. Finally, eight technologies were chosen for the wing root chord design variable. In addition, a k-factor sensitivity analysis was performed to assess the technologies quantitatively. As a result, it was observed that the factors of flow circulation flap, leading edge blowing, nanocoating, liquid metal, and advanced composite material had the greatest influence on the target values. Furthermore, the variations in the target values were analyzed as the k factors changed.

Author Contributions

S.-B.K. was responsible for all tasks related to the work, from conceptualization, establishing the methodology, to data analysis entirely; J.-Y.Y. was responsible for the writing of the original manuscript; H.-Y.H. managed the overall project and reviewed it.

Funding

This work was supported by the National Research Foundation of Korea (NRF) grant funded by the Korean government (MSIT) (No. 2019R1F1A1042533).

Conflicts of Interest

The authors declare no conflict of interest.

References

  1. Lim, D.W.; Justin, C.; Mavris, D. Advanced general aviation concept study for a roadable aircraft. In Proceedings of the 15th AIAA Aviation Technology, Integration, and Operation Conference, Dallas, TX, USA, 22–26 June 2015. AIAA paper 2015–3001. [Google Scholar]
  2. Vanderplaats, G.N. Numerical Optimization Techniques for Engineering Design, 3rd ed.; McGraw-Hill: New York, NY, USA, 2001. [Google Scholar]
  3. Du, S.; Wang, L. Aircraft Design Optimization with Uncertainty Based on Fuzzy Clustering Analysis. J. Aerosp. Eng. 2016, 29, 04015032. [Google Scholar] [CrossRef]
  4. Li, N.; Tan, R.; Huang, Z. Agile decision support system for aircraft design. J. Aerosp. Eng. 2016, 29, 04015044. [Google Scholar] [CrossRef]
  5. Chung, P.; Ma, D.; Shiau, J. Design, Manufacturing, and Flight Testing of an Experimental Flying Wing UAV. Appl. Sci. 2019, 9, 3043. [Google Scholar] [CrossRef]
  6. Gokcin, C.; Mathias, E.; Dimitri, N.M. A Methodology for Sizing and Analysis of Electric Propulsion Subsystems for Unmanned Aerial Vehicles. In Proceedings of the 54th AIAA Aerospace Sciences Meeting, AIAA SciTech Forum, San Diego, CA, USA, 4–8 January 2016. [Google Scholar]
  7. Cambone, S.A.; Krieg, K.J.; Pace, P.; Wells, L., II. Unmanned Aircraft Systems Roadmap 2005–2030; U.S. Dept. of Defense: Washington, DC, USA, 2005.
  8. Brandt, S.A.; Gilliam, F.T. Design Analysis Methodology for Solar-Powered Aircraft. J. Aircr. 1995, 32, 703–709. [Google Scholar] [CrossRef]
  9. Shin, K.; Hwang, H.; Ahn, J. Mission analysis of solar UAV for high-altitude long-endurance flight. J. Aerosp. Eng. 2018, 31, 04018010. [Google Scholar] [CrossRef]
  10. Joo, H.; Hwang, H. Surrogate aerodynamic model for initial sizing of solar high-altitude long-endurance UAV. J. Aerosp. Eng. 2017, 30, 04017064. [Google Scholar] [CrossRef]
  11. Myers, R.; Carter, K.; Carter, W. Response Surface Methodology. J. Technometrics. 1989, 31, 137–157. [Google Scholar]
  12. Anderson, J.D., Jr. Aircraft Performance and Design; McGraw-Hill: New York, NY, USA, 1999. [Google Scholar]
  13. Montgomery, D.C. Design and Analysis of Experiments, 9th ed.; Wiley: Hoboken, NJ, USA, 2017. [Google Scholar]
  14. Leiviska, K. Introduction to Experiment Design. Available online: https://www.oulu.fi/sites/default/files/content/Introduction%20to%20Experiment%20Design_2013.pdf (accessed on 6 August 2019).
  15. Mavris, D.; Kerby, M. Technology Identification, Evaluation, and Selection for Commercial Transport Aircraft. In Proceedings of the 58th Annual Conference of Society of Allied Weight Engineers, San Jose, CA, USA, 24–26 May 1999. [Google Scholar]
  16. Loftin, L.K. Subsonic Aircraft: Evolution and the Matching of Size to Performance; NASA Reference Publication 1060: Washington, DC, USA, 1980.
  17. AeroMobil: Flying Car. Available online: https://www.aeromobil.com/aeromobil-4_0-stol/ (accessed on 6 August 2019).
  18. Korea Ministry of Government Legislation. Regulations on the Structure and Facility Standards of Roads; Korea Ministry of Government Legislation: Sejong, Korea, 2015.
  19. Raymer, D. Aircraft Design: A Conceptual Approach, 6th ed.; AIAA ARC: Reston, VA, USA, 2018. [Google Scholar]
  20. JMP. Design of Experiments Guide. 2007. Available online: https://www.jmp.com/en_us/home.html https://www.aeromobil.com/aeromobil-4_0-stol/ (accessed on 6 August 2019).
  21. Raychaudhuri, S. Introduction to Monte Carlo Simulation. In Proceedings of the Winter Simulation Conference, Miami, FL, USA, 7–10 December 2008. [Google Scholar]
  22. Wainwright, J.; Mulligan, M. Environmental Modeling: Finding Simplicity in Complexity, 2nd ed.; John Wiley & Sons: Hoboken, NJ, USA, 2013. [Google Scholar]
  23. Derringer, D.; Suich, R. Simultaneous Optimization of Several Response Variables. J. Qual. Technol. 2018, 12, 214–219. [Google Scholar] [CrossRef]
  24. Montanya, J.; Marshall, D. Circulation Control and Its Application to Extreme Short Take-Off and Landing Vehicles. In Proceedings of the 45th AIAA Aerospace Sciences Meeting and Exhibit, Reno, NV, USA, 8–11 January 2007. [Google Scholar]
  25. McLachlan, B. Study of a Circulation Control Airfoil with Leading/Trailing-Edge Blowing. In Proceedings of the 25th AIAA Aerospace Sciences Meeting, Reno, NV, USA, 24–26 March 1987. [Google Scholar]
  26. Heap, H.; Crowther, W. A review of current leading edge device technology and of options for innovation based on flow control. In Proceedings of the RAeS Conference, London, UK, 1–4 December 2003. [Google Scholar]
  27. Moaven, K.; Rad, M.; Taeibi-Rahni, M. Experimental investigation of viscous drag reduction of superhydrophobic nano-coating in laminar and turbulent flows. Exp. Therm. Fluid Sci. 2013, 51, 239–243. [Google Scholar] [CrossRef]
  28. Amir, M.; Kontis, K. Application of Piezoelectric Actuators at Subsonic Speeds. J. Aircr. 2008, 45, 1419–1430. [Google Scholar] [CrossRef]
  29. NASA. Liquidmetal: Redefining Metals for the 21st Century. Available online: https://www.nasa.gov/vision/earth/technologies/liquidmetal.html (accessed on 6 August 2019).
  30. Liquid Metal. Available online: http://www.liquid-metal.info (accessed on 6 August 2019).
Figure 1. Procedure and composition of the technology identification, evaluation, and selection (TIES) method. RSE, Response Surface Evaluation; QFD, Quality Function Deployment; IPT, Integrated Product Team; FPI, Fuzzy Performance Index; MADM, Multi Attribute Decision Making; EIS, Enterprise Investment Scheme; FLOPS, Flight Optimization System Program; ALCCA, Aircraft Life Cycle Cost Analysis.
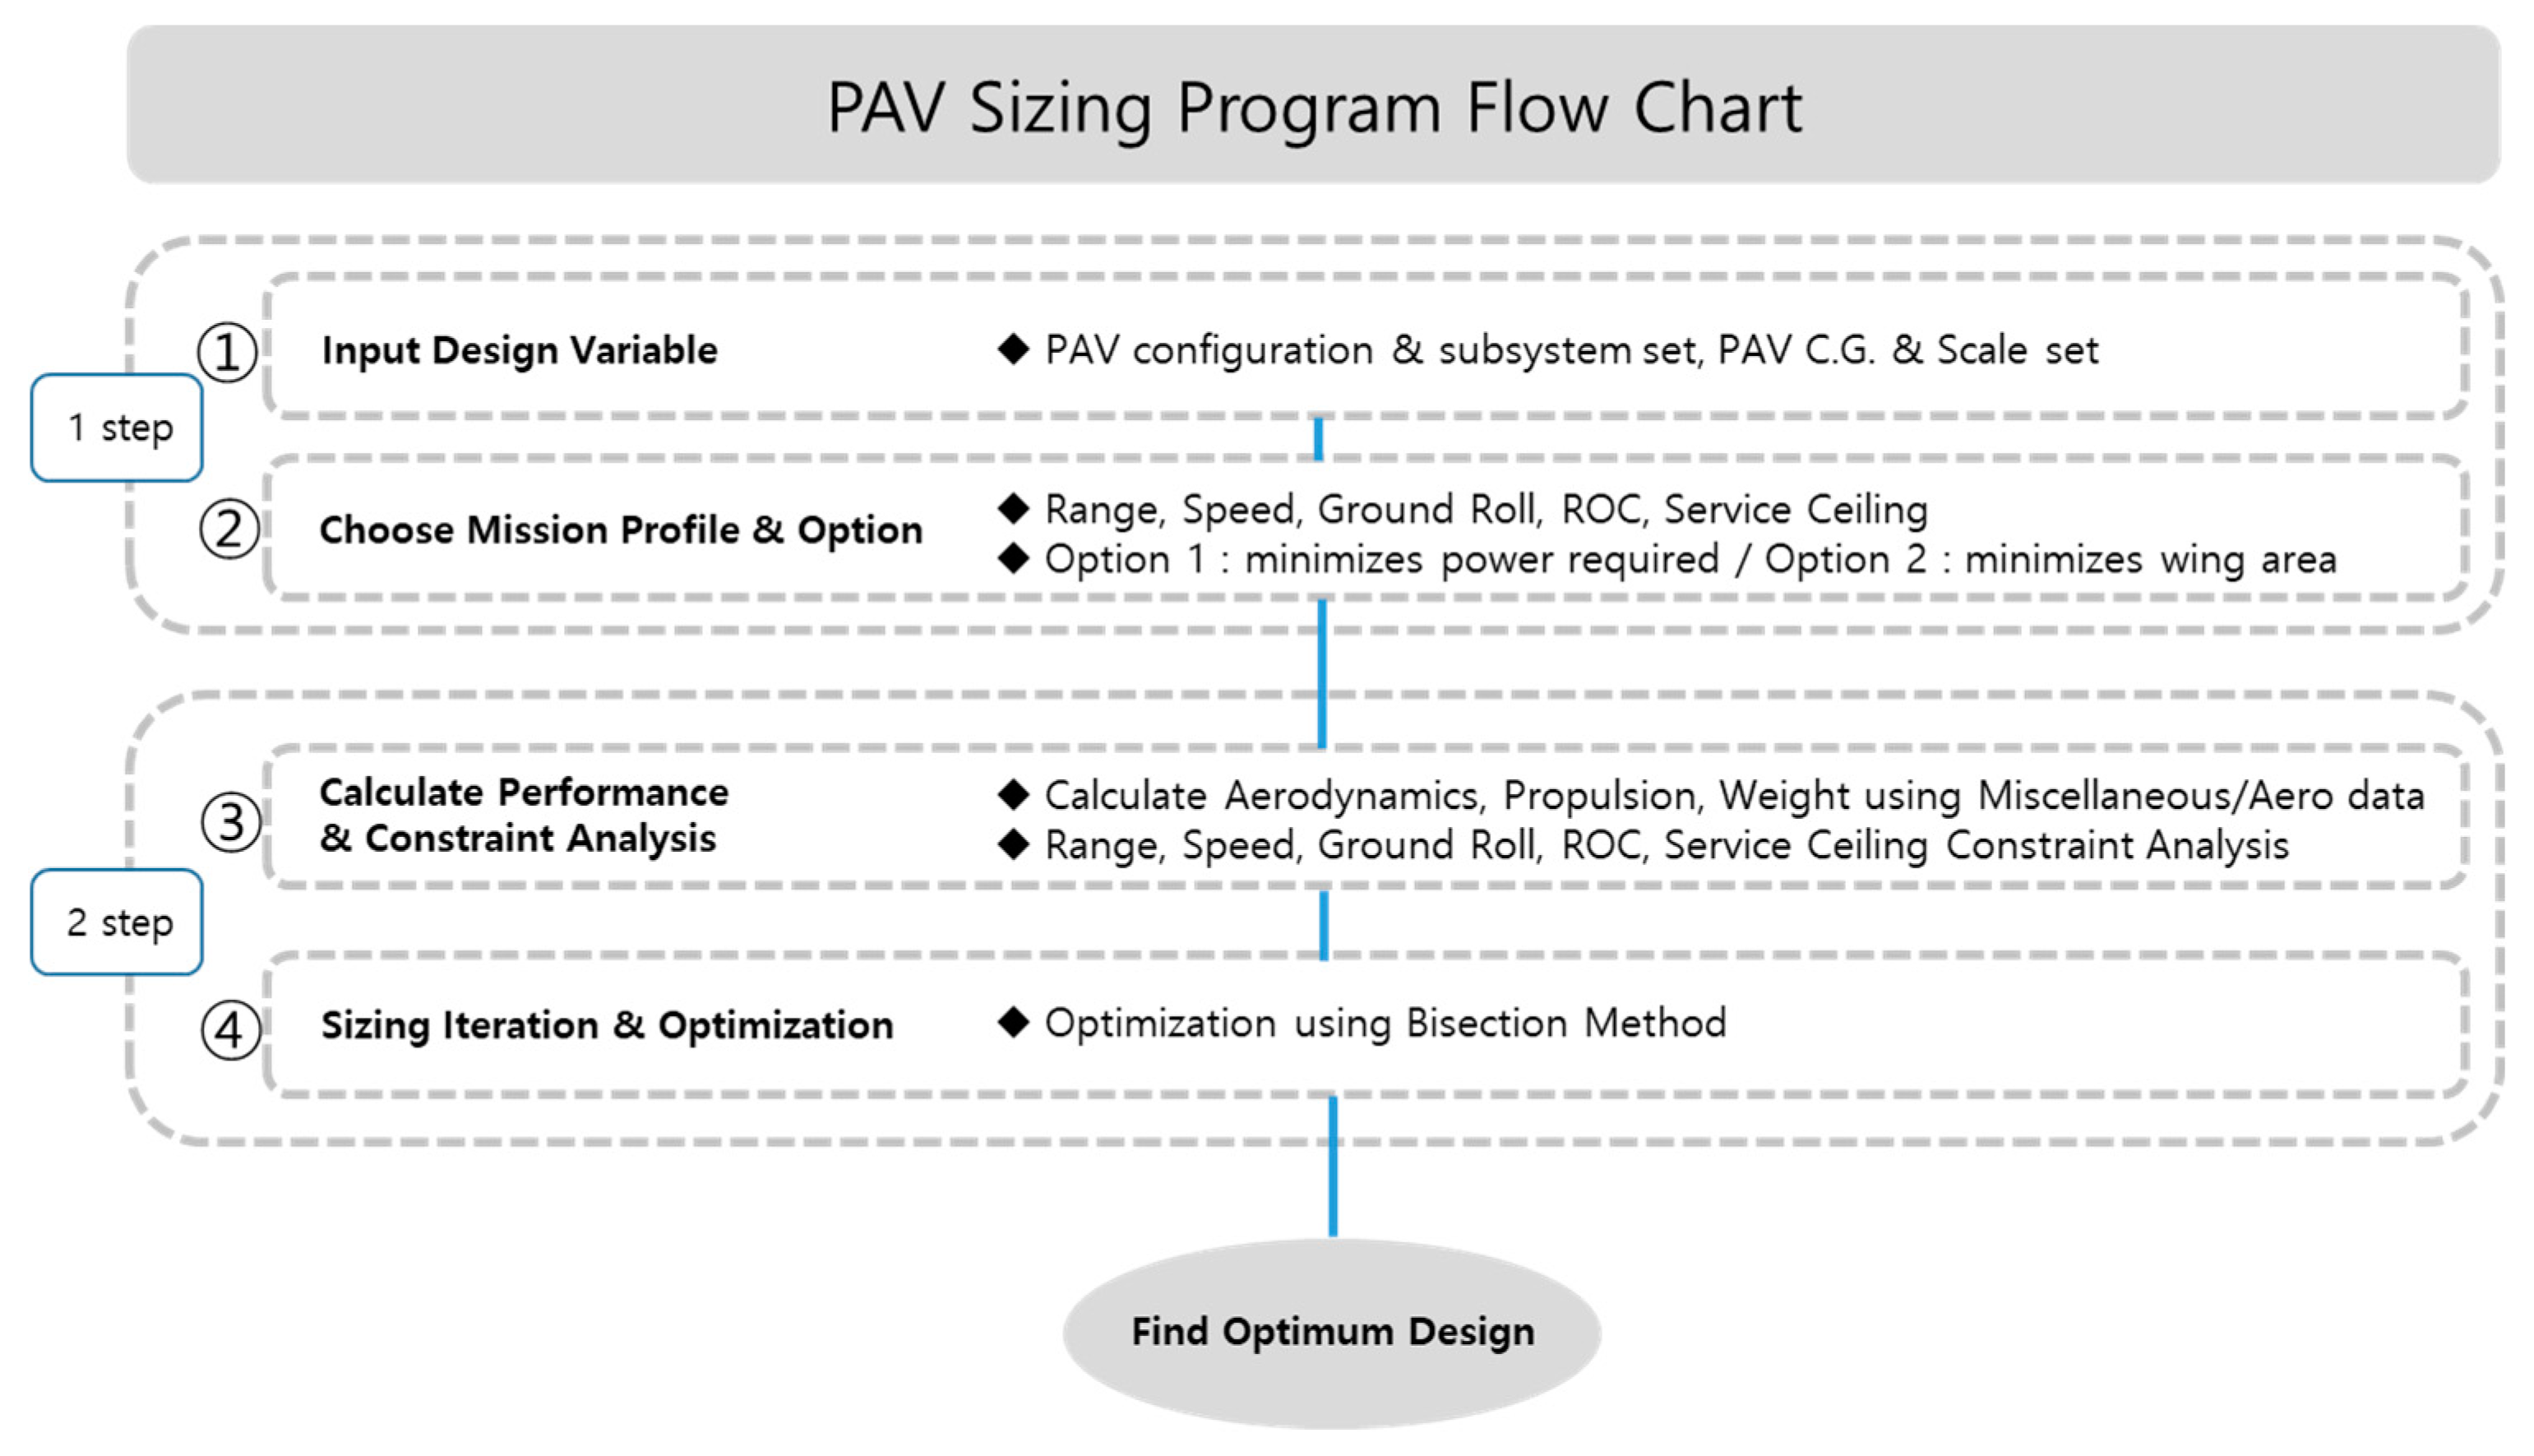
Applsci 09 04121 g001
Figure 2. Personal air vehicle (PAV) sizing program flow chart. C.G., Center of Gravity; ROC, Rate of Climb.
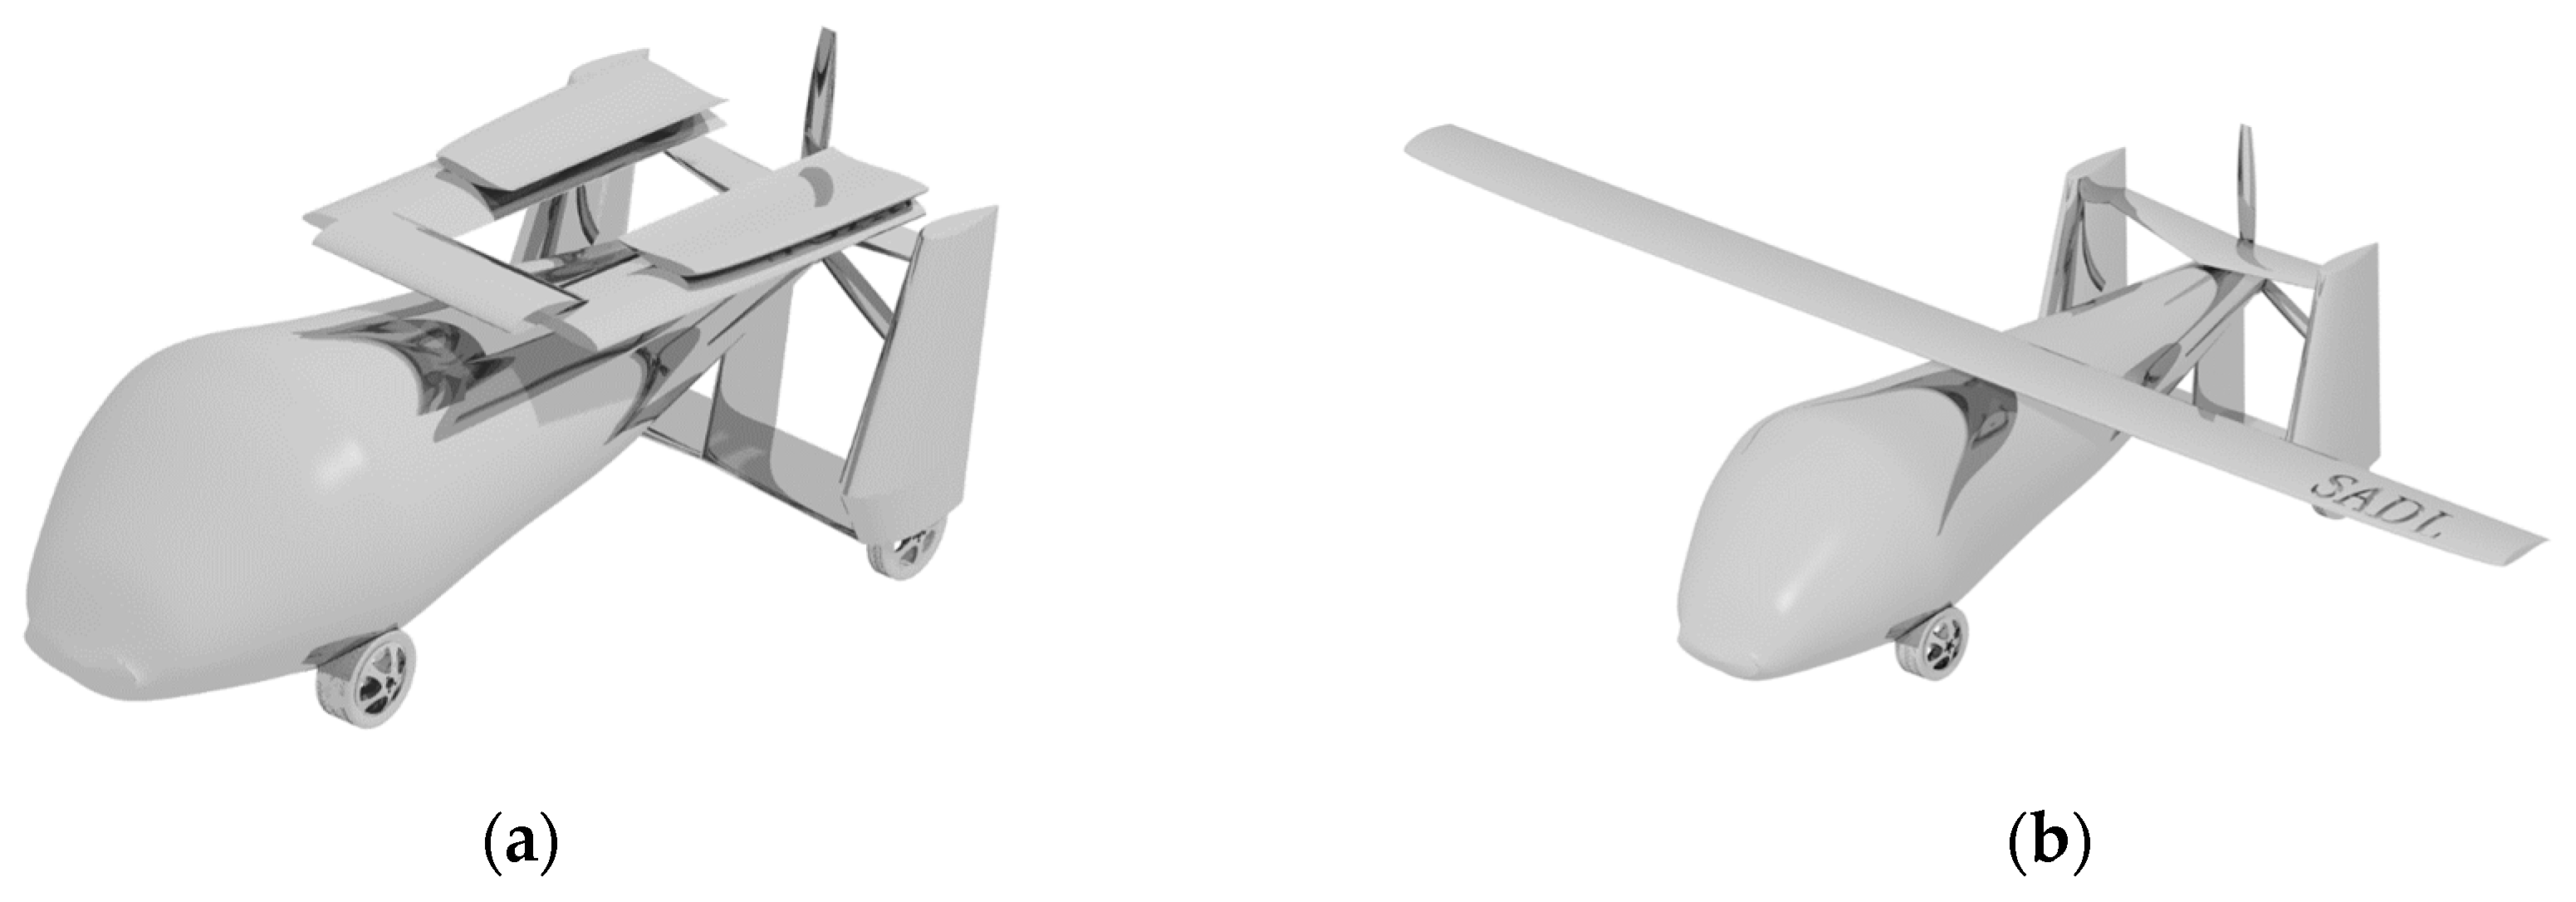
Applsci 09 04121 g002
Figure 3. PAV configuration: (a) description of drive mode; (b) description of flight mode.
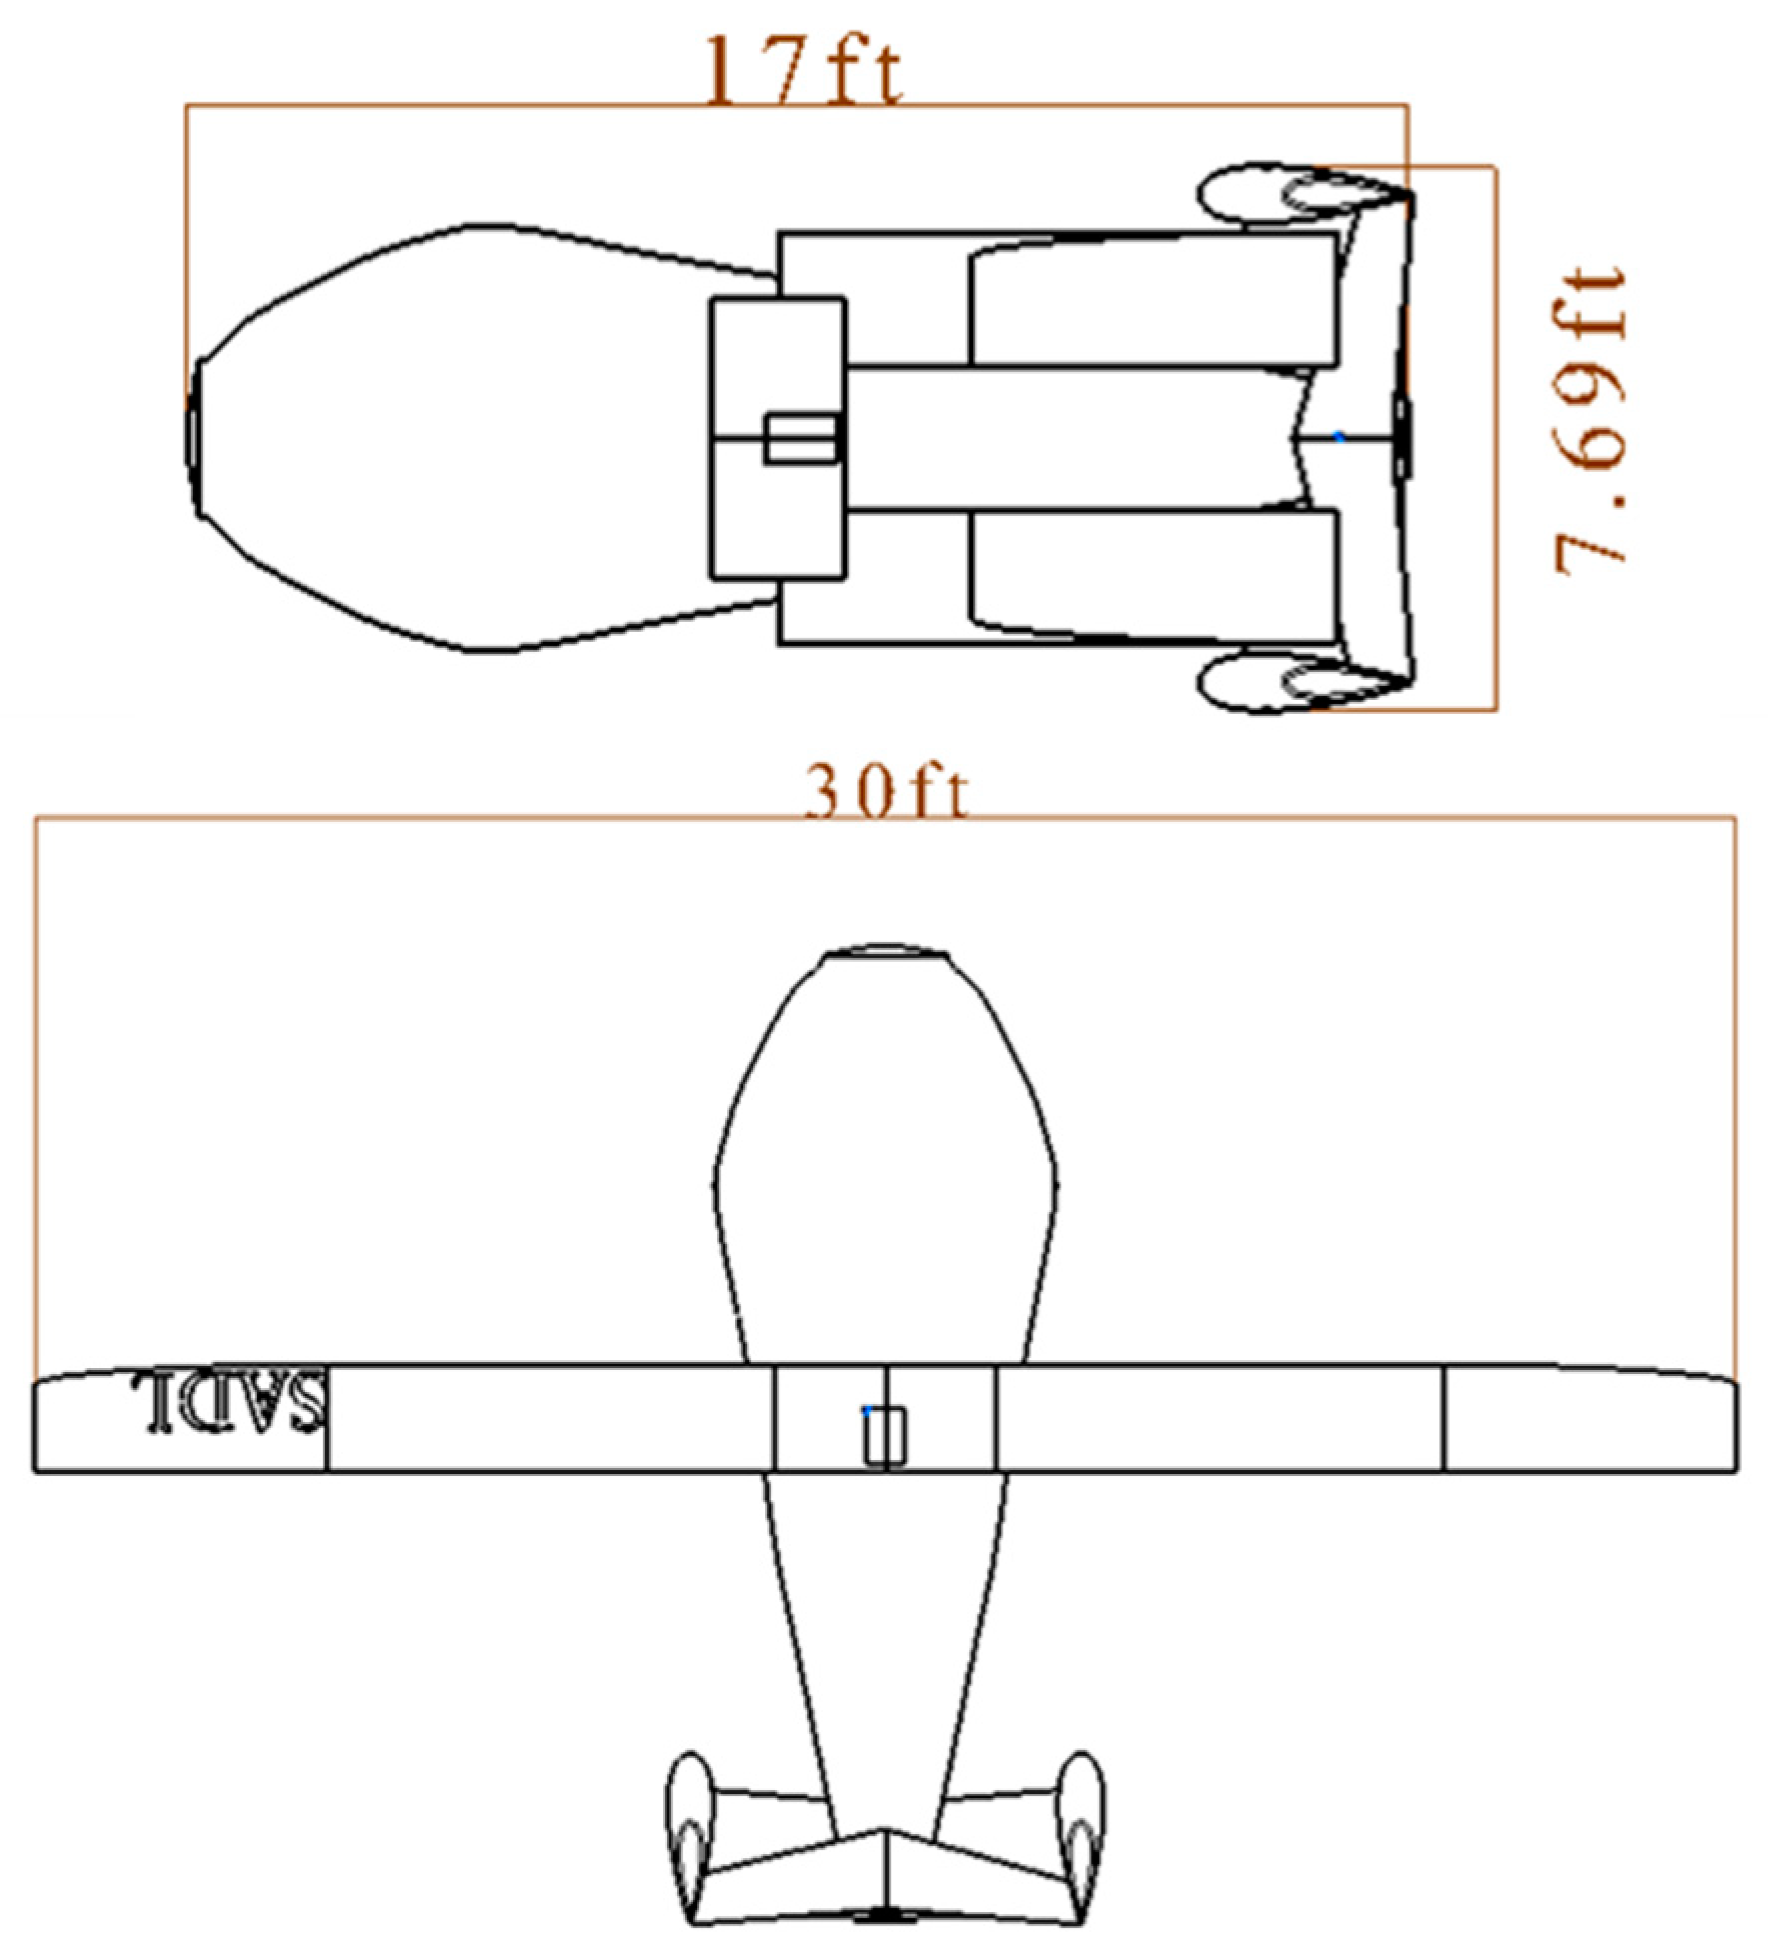
Applsci 09 04121 g003
Figure 4. Roadable PAV size dimension from CATIA.
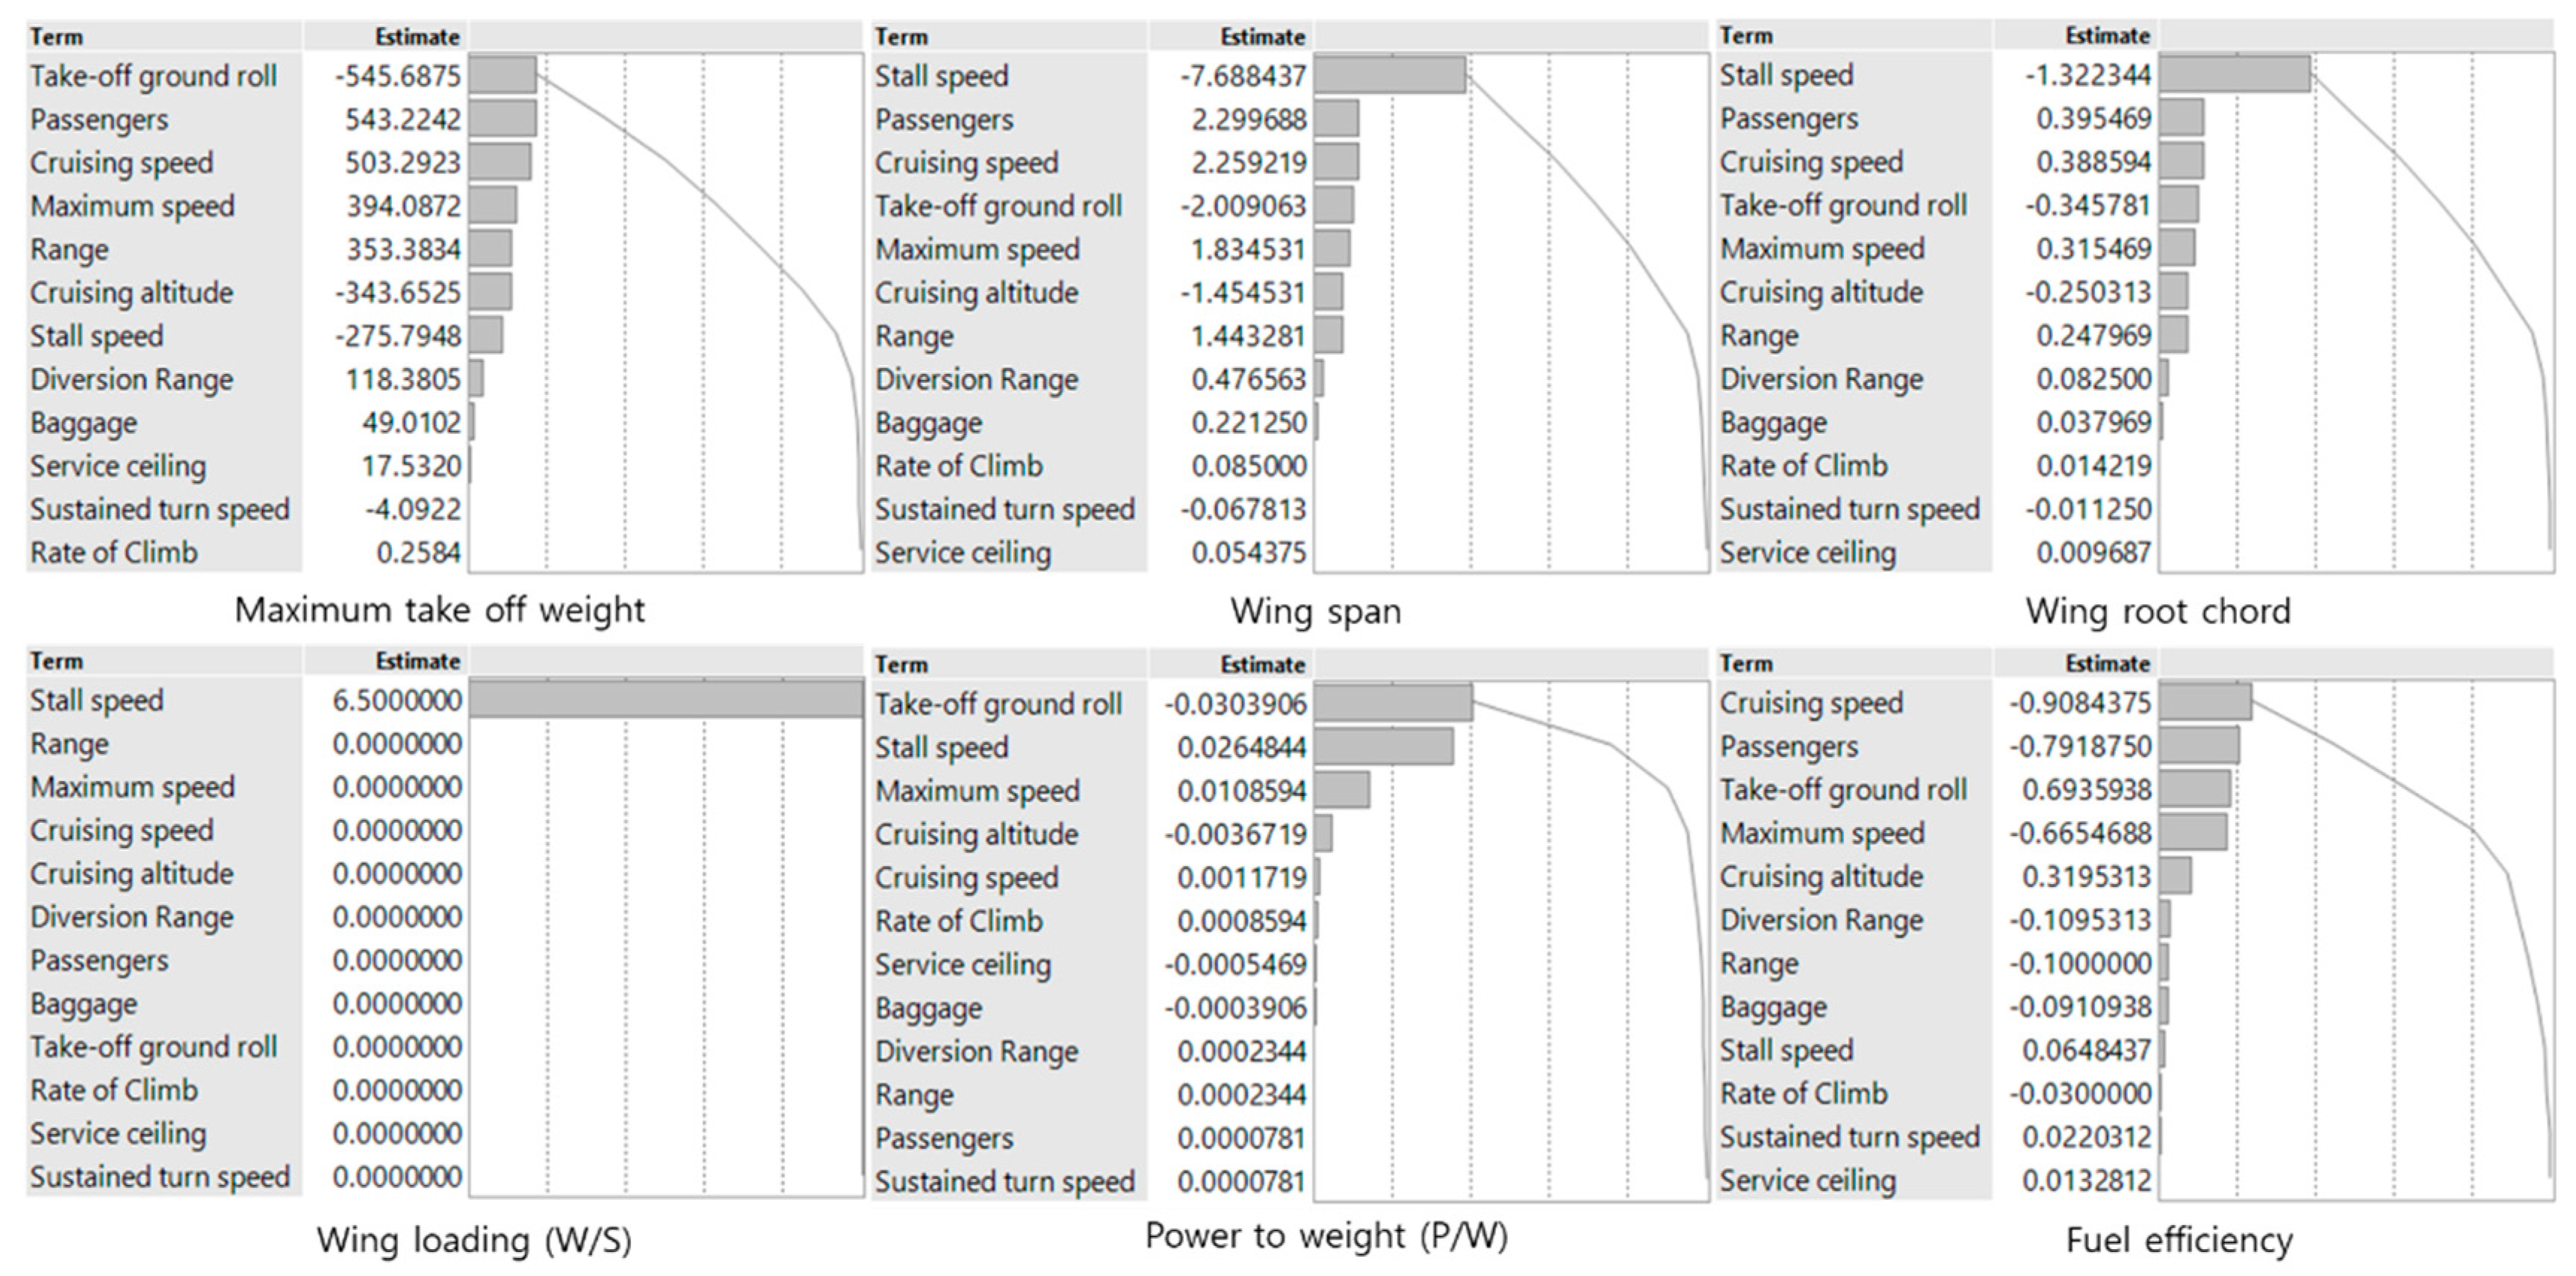
Applsci 09 04121 g004
Figure 5. Pareto plot of design objective parameters.
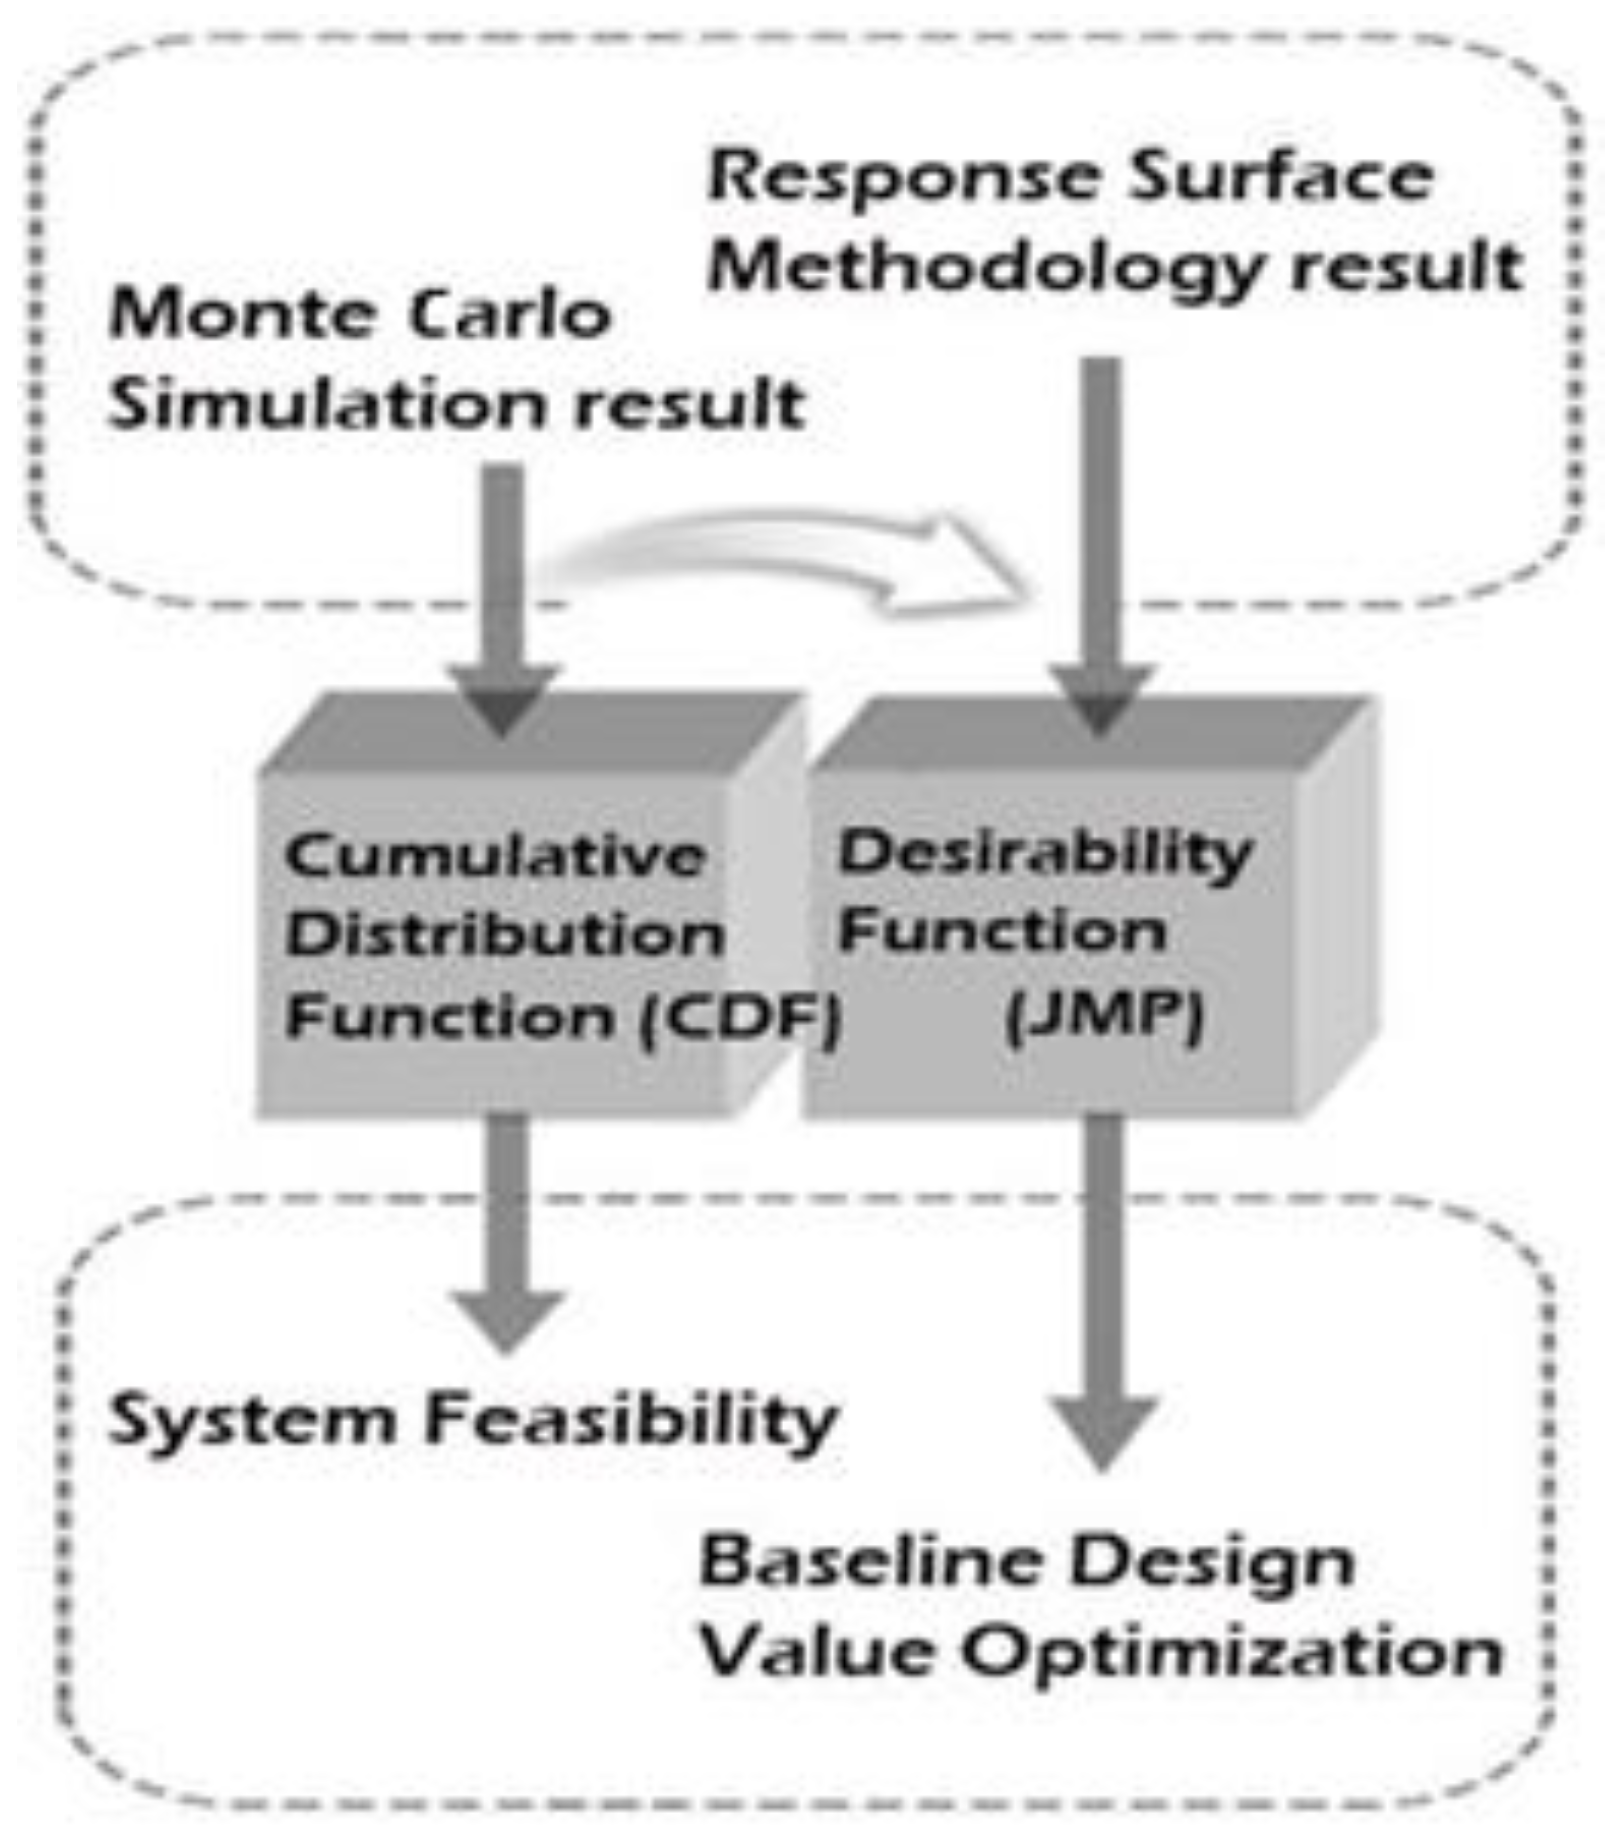
Applsci 09 04121 g005
Figure 6. System feasibility and viability determination procedure flow chart.
Applsci 09 04121 g006
Figure 7. Feasible design space for target design variables.
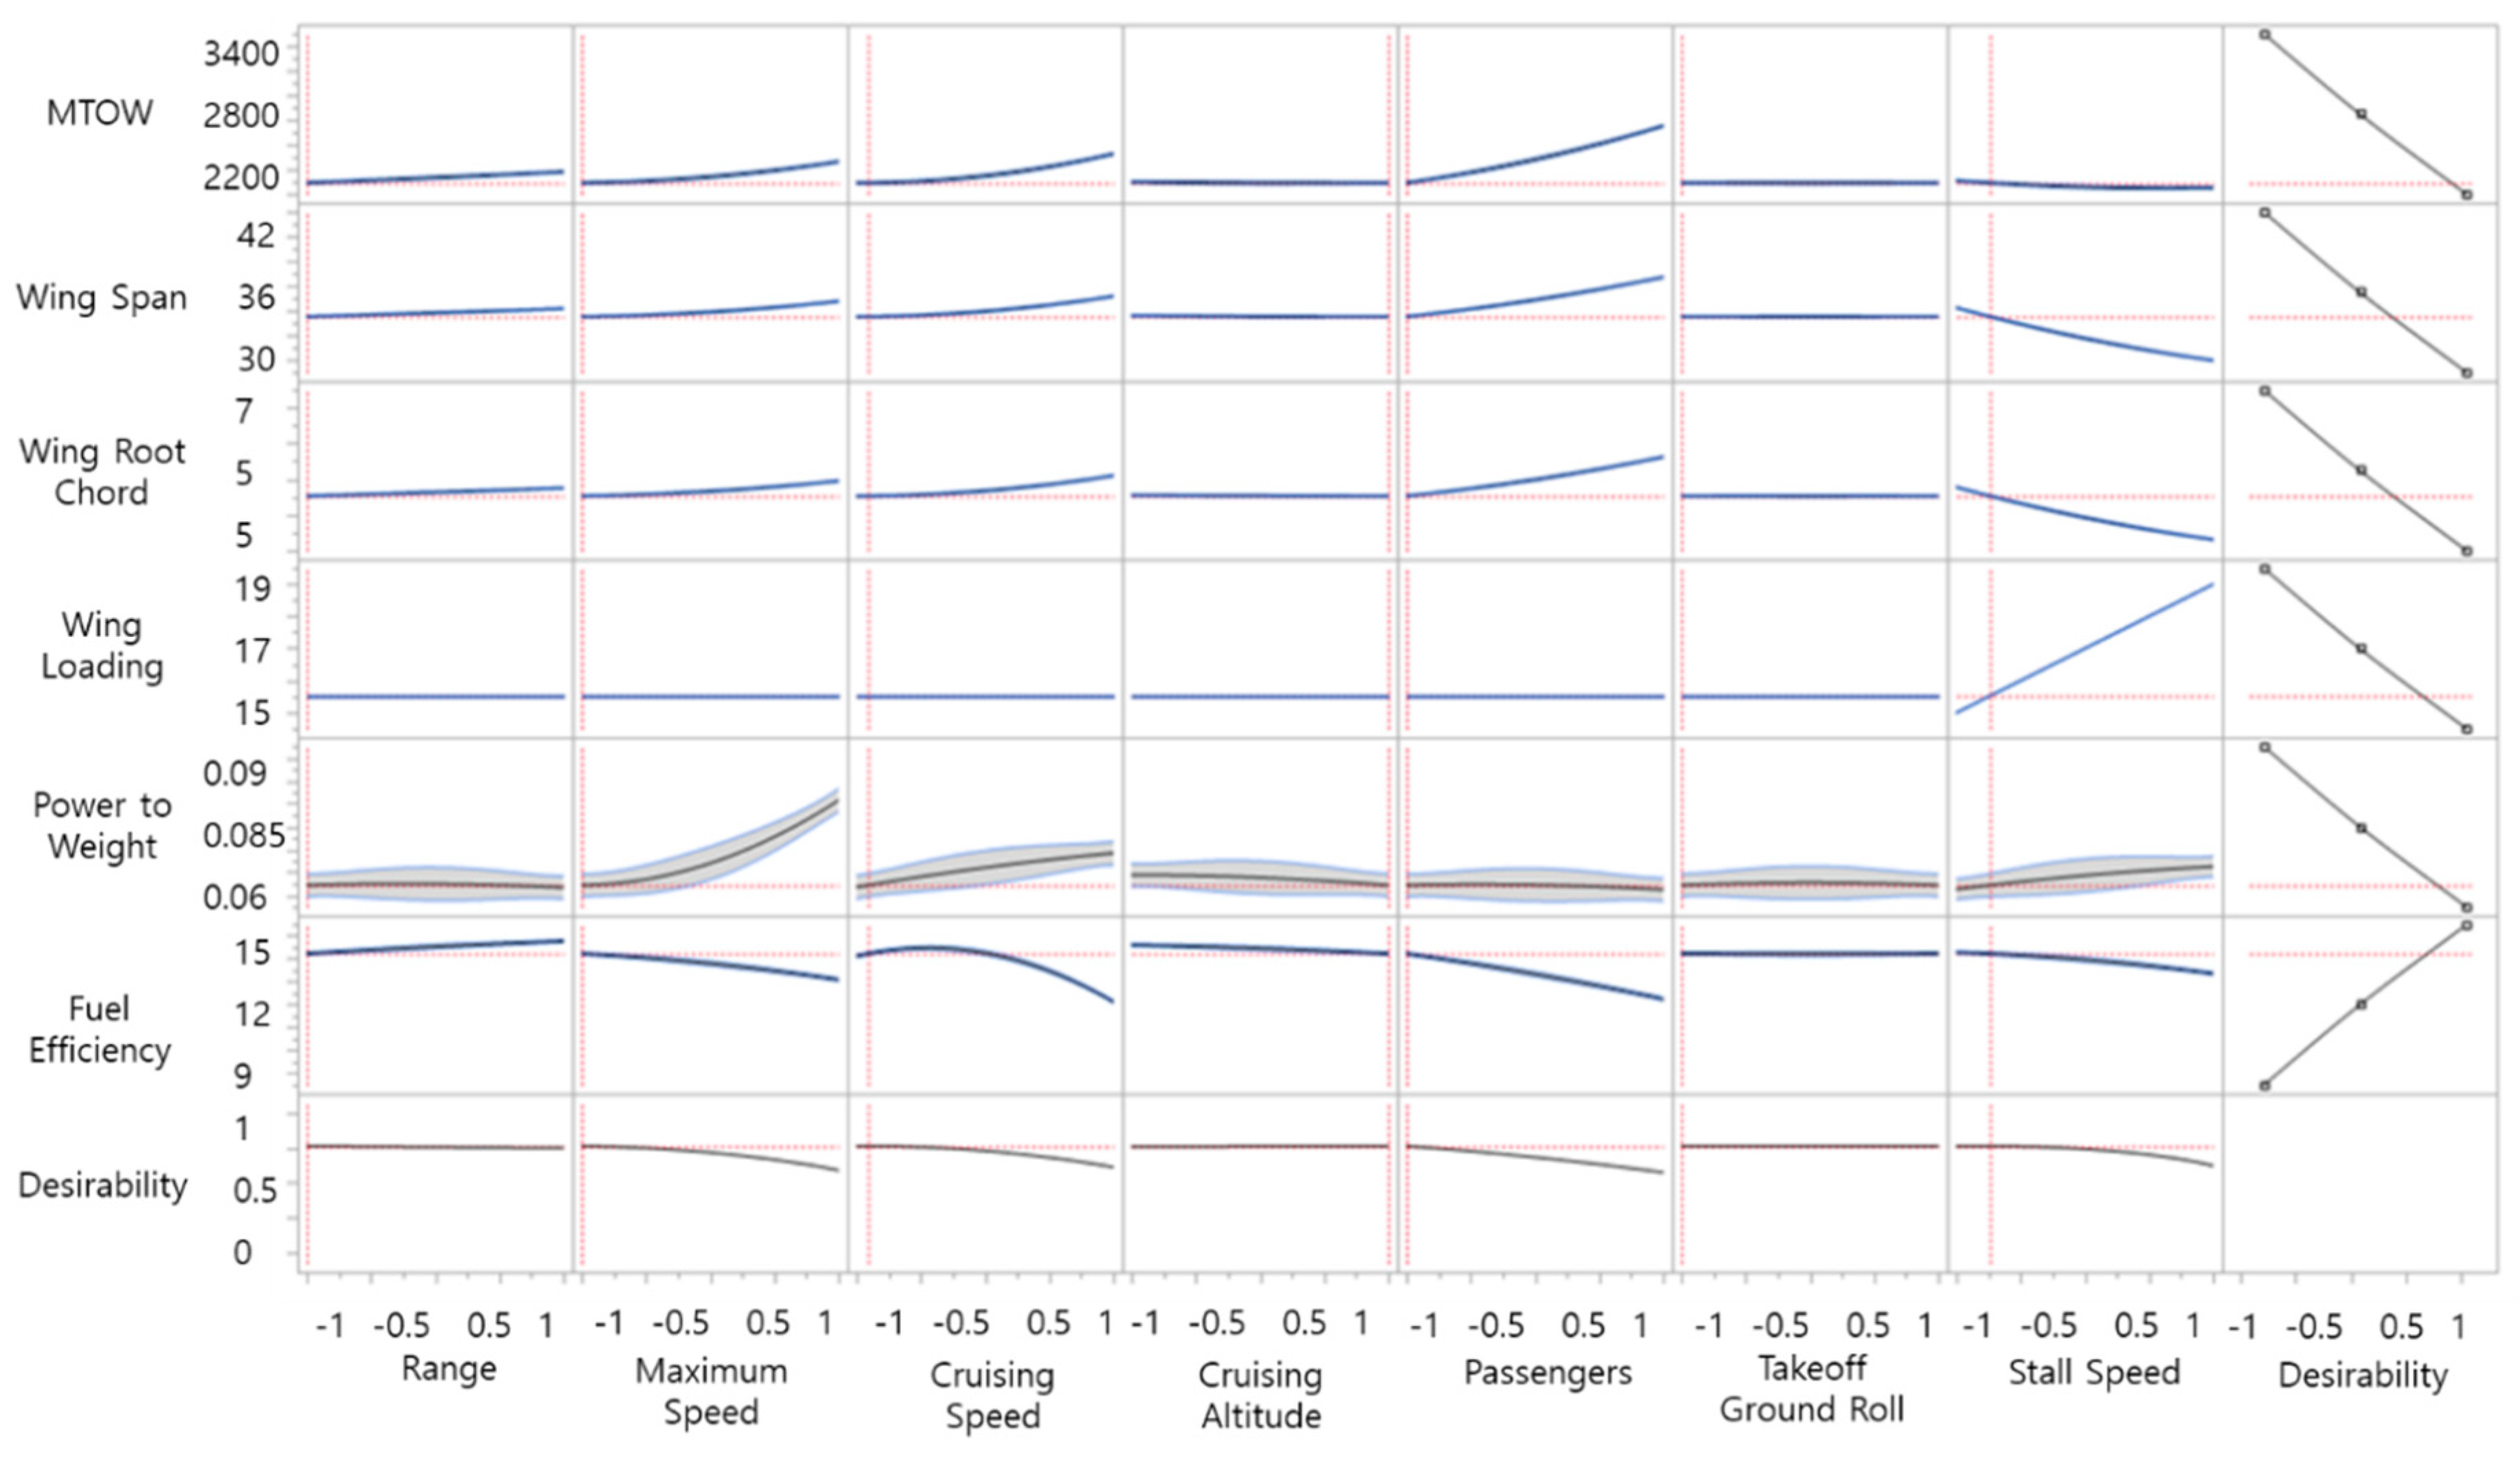
Applsci 09 04121 g007
Figure 8. Optimized responses vs. design variables.
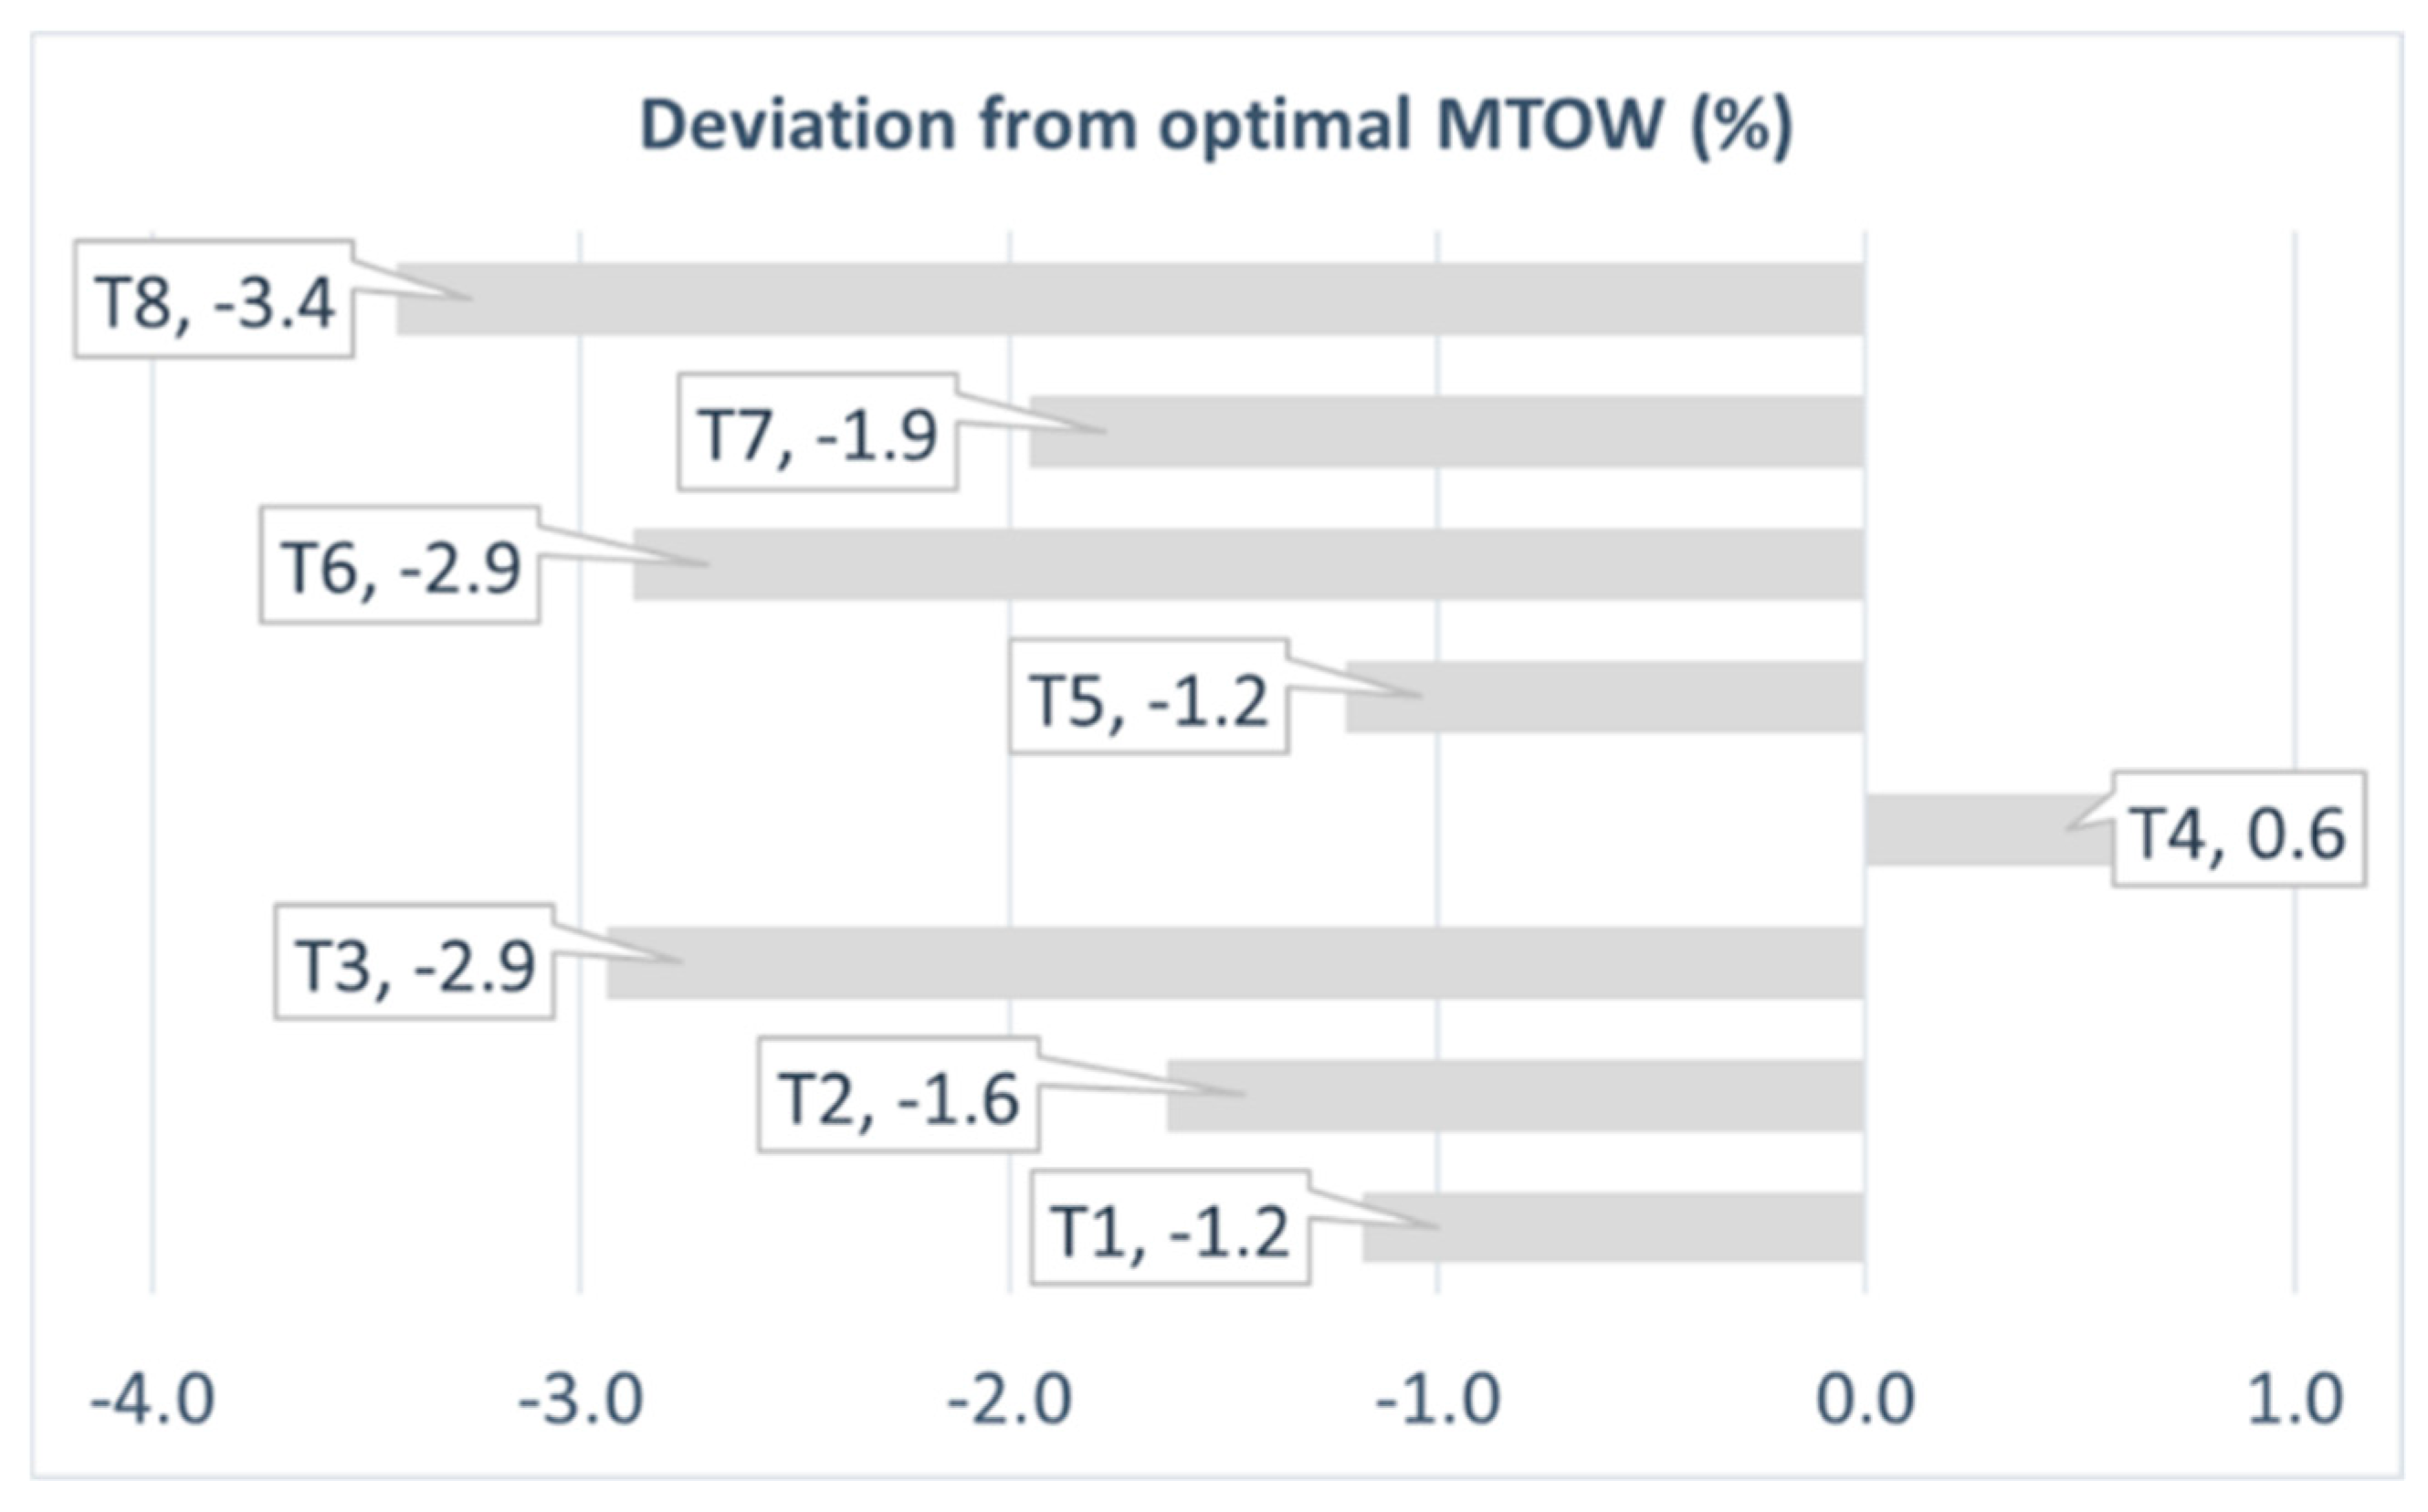
Applsci 09 04121 g008
Figure 9. Technology sensitivity analysis: deviation from optimal MTOW target value.
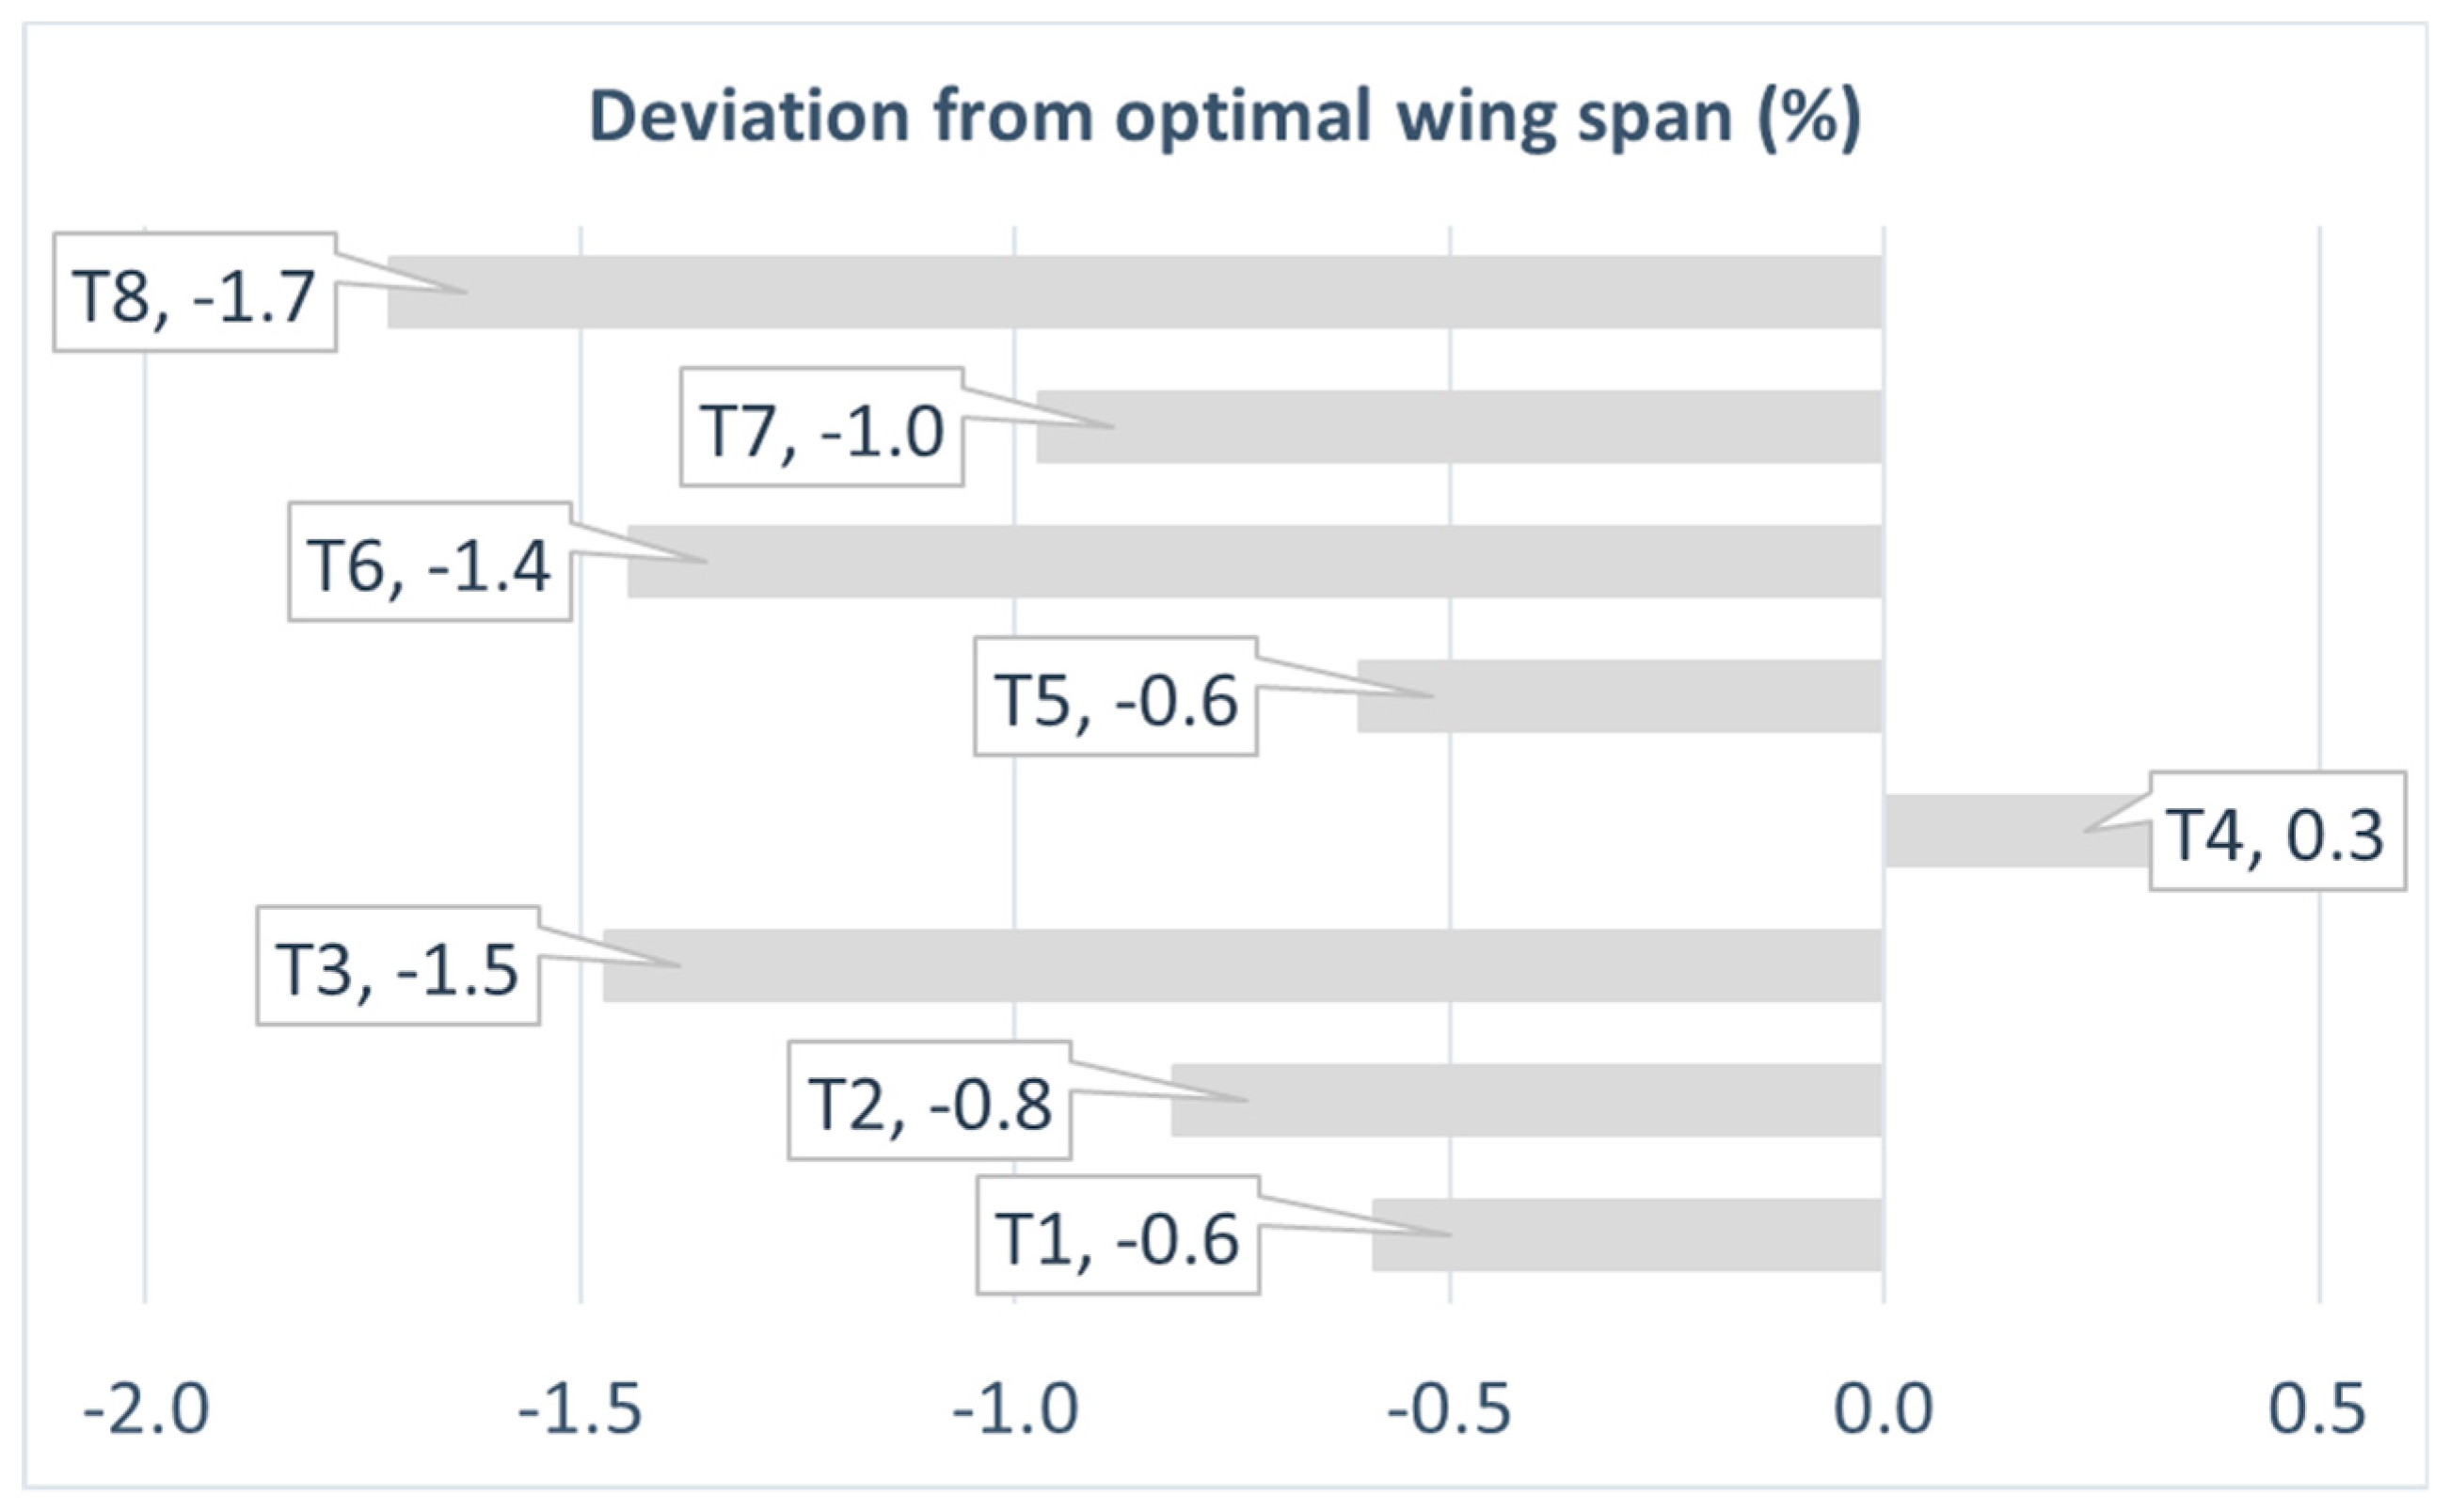
Applsci 09 04121 g009
Figure 10. Technology sensitivity analysis: deviation from optimal wing span target value.
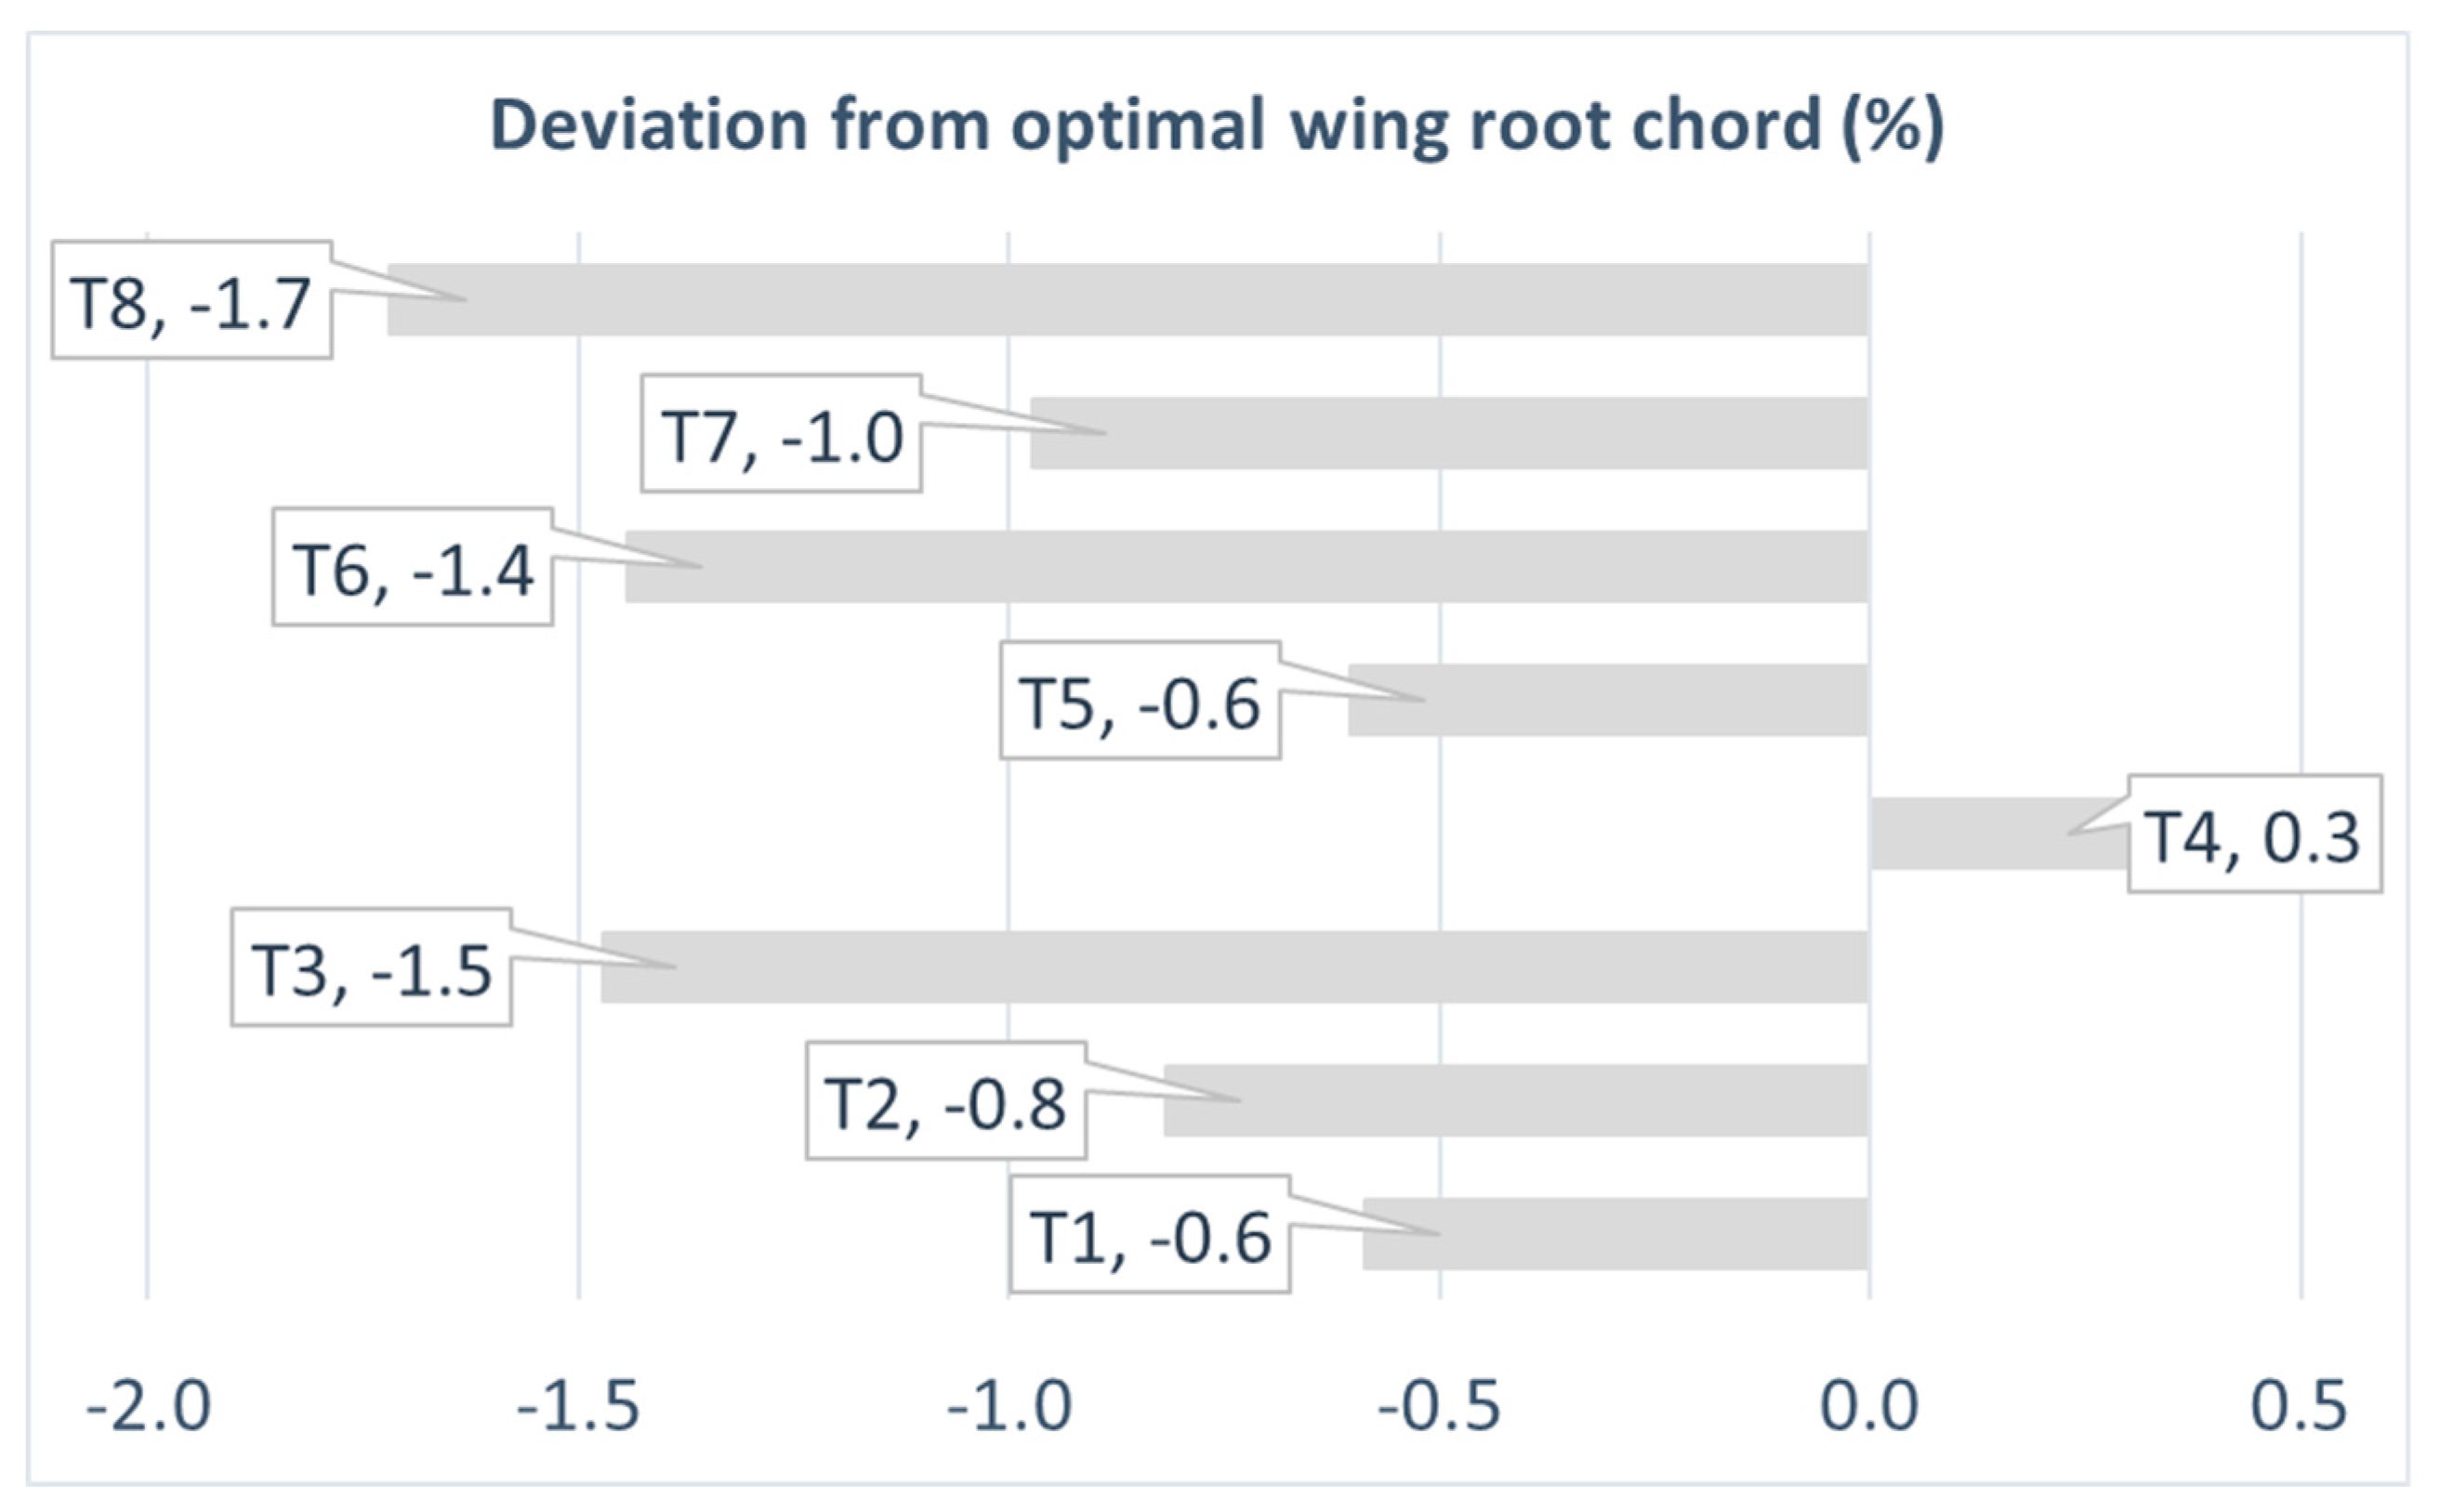
Applsci 09 04121 g010
Figure 11. Technology sensitivity analysis: deviation from optimal wing root chord target value.
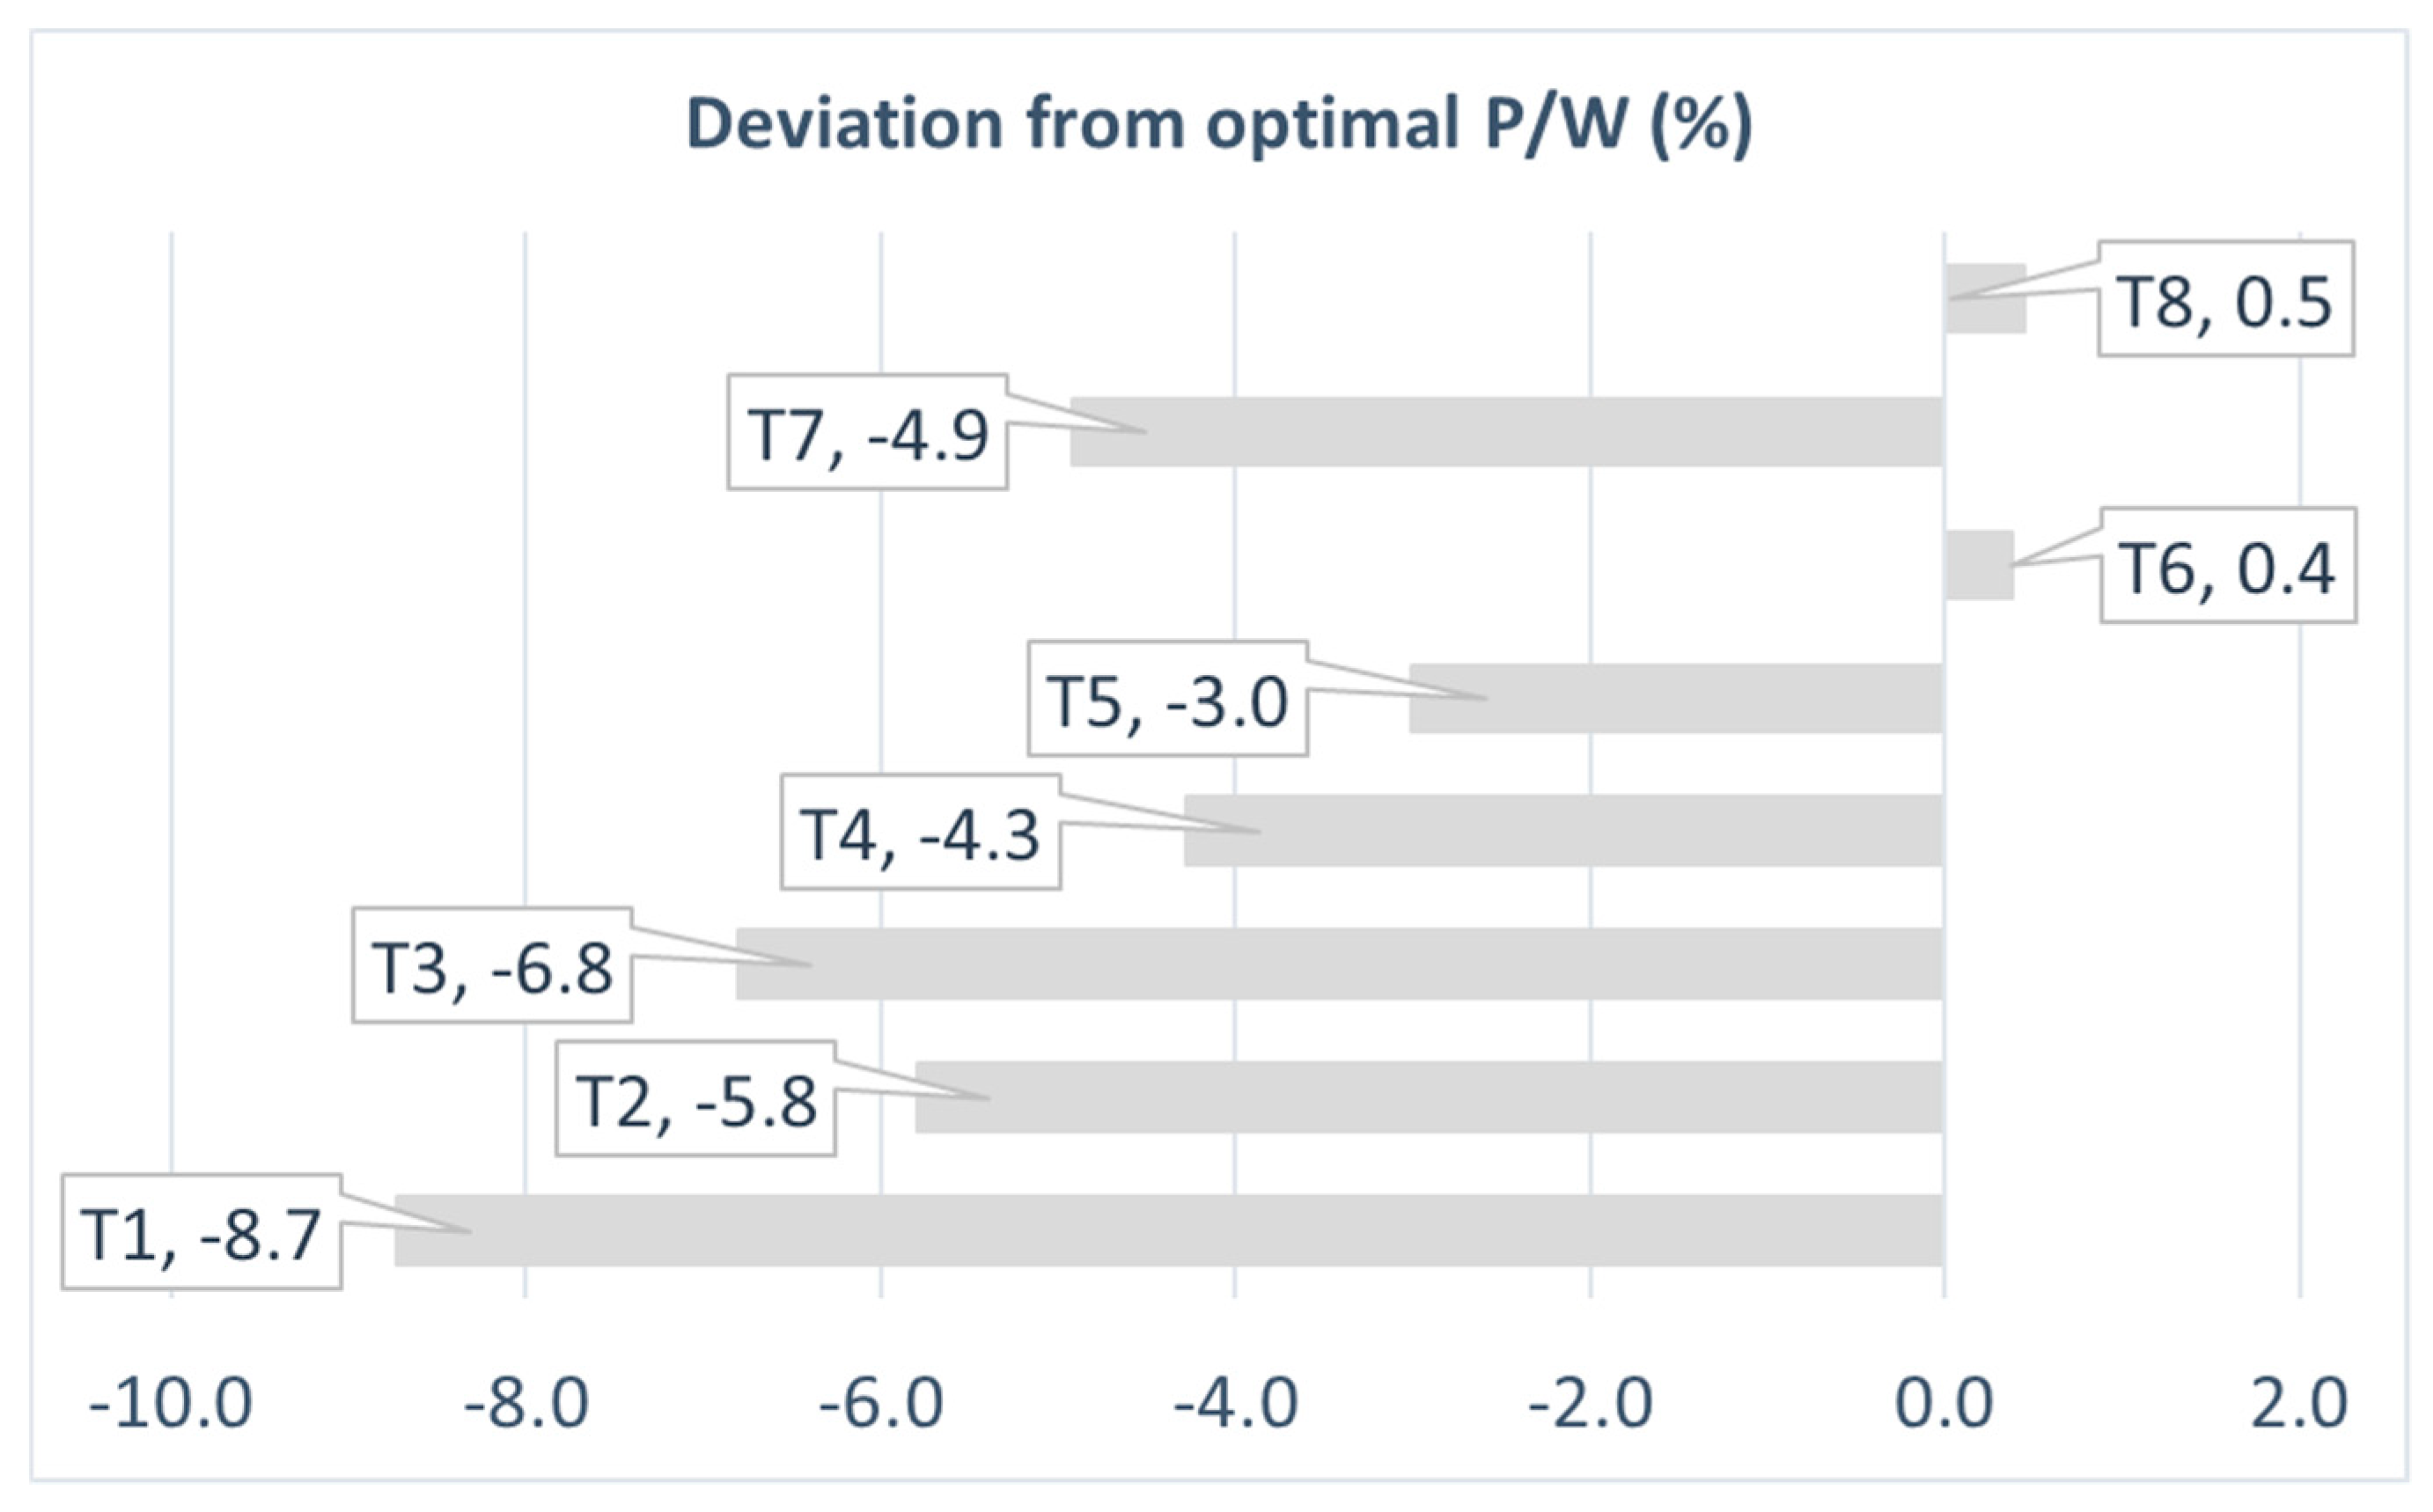
Applsci 09 04121 g011
Figure 12. Technology sensitivity analysis: deviation from optimal power-to-weight target value.
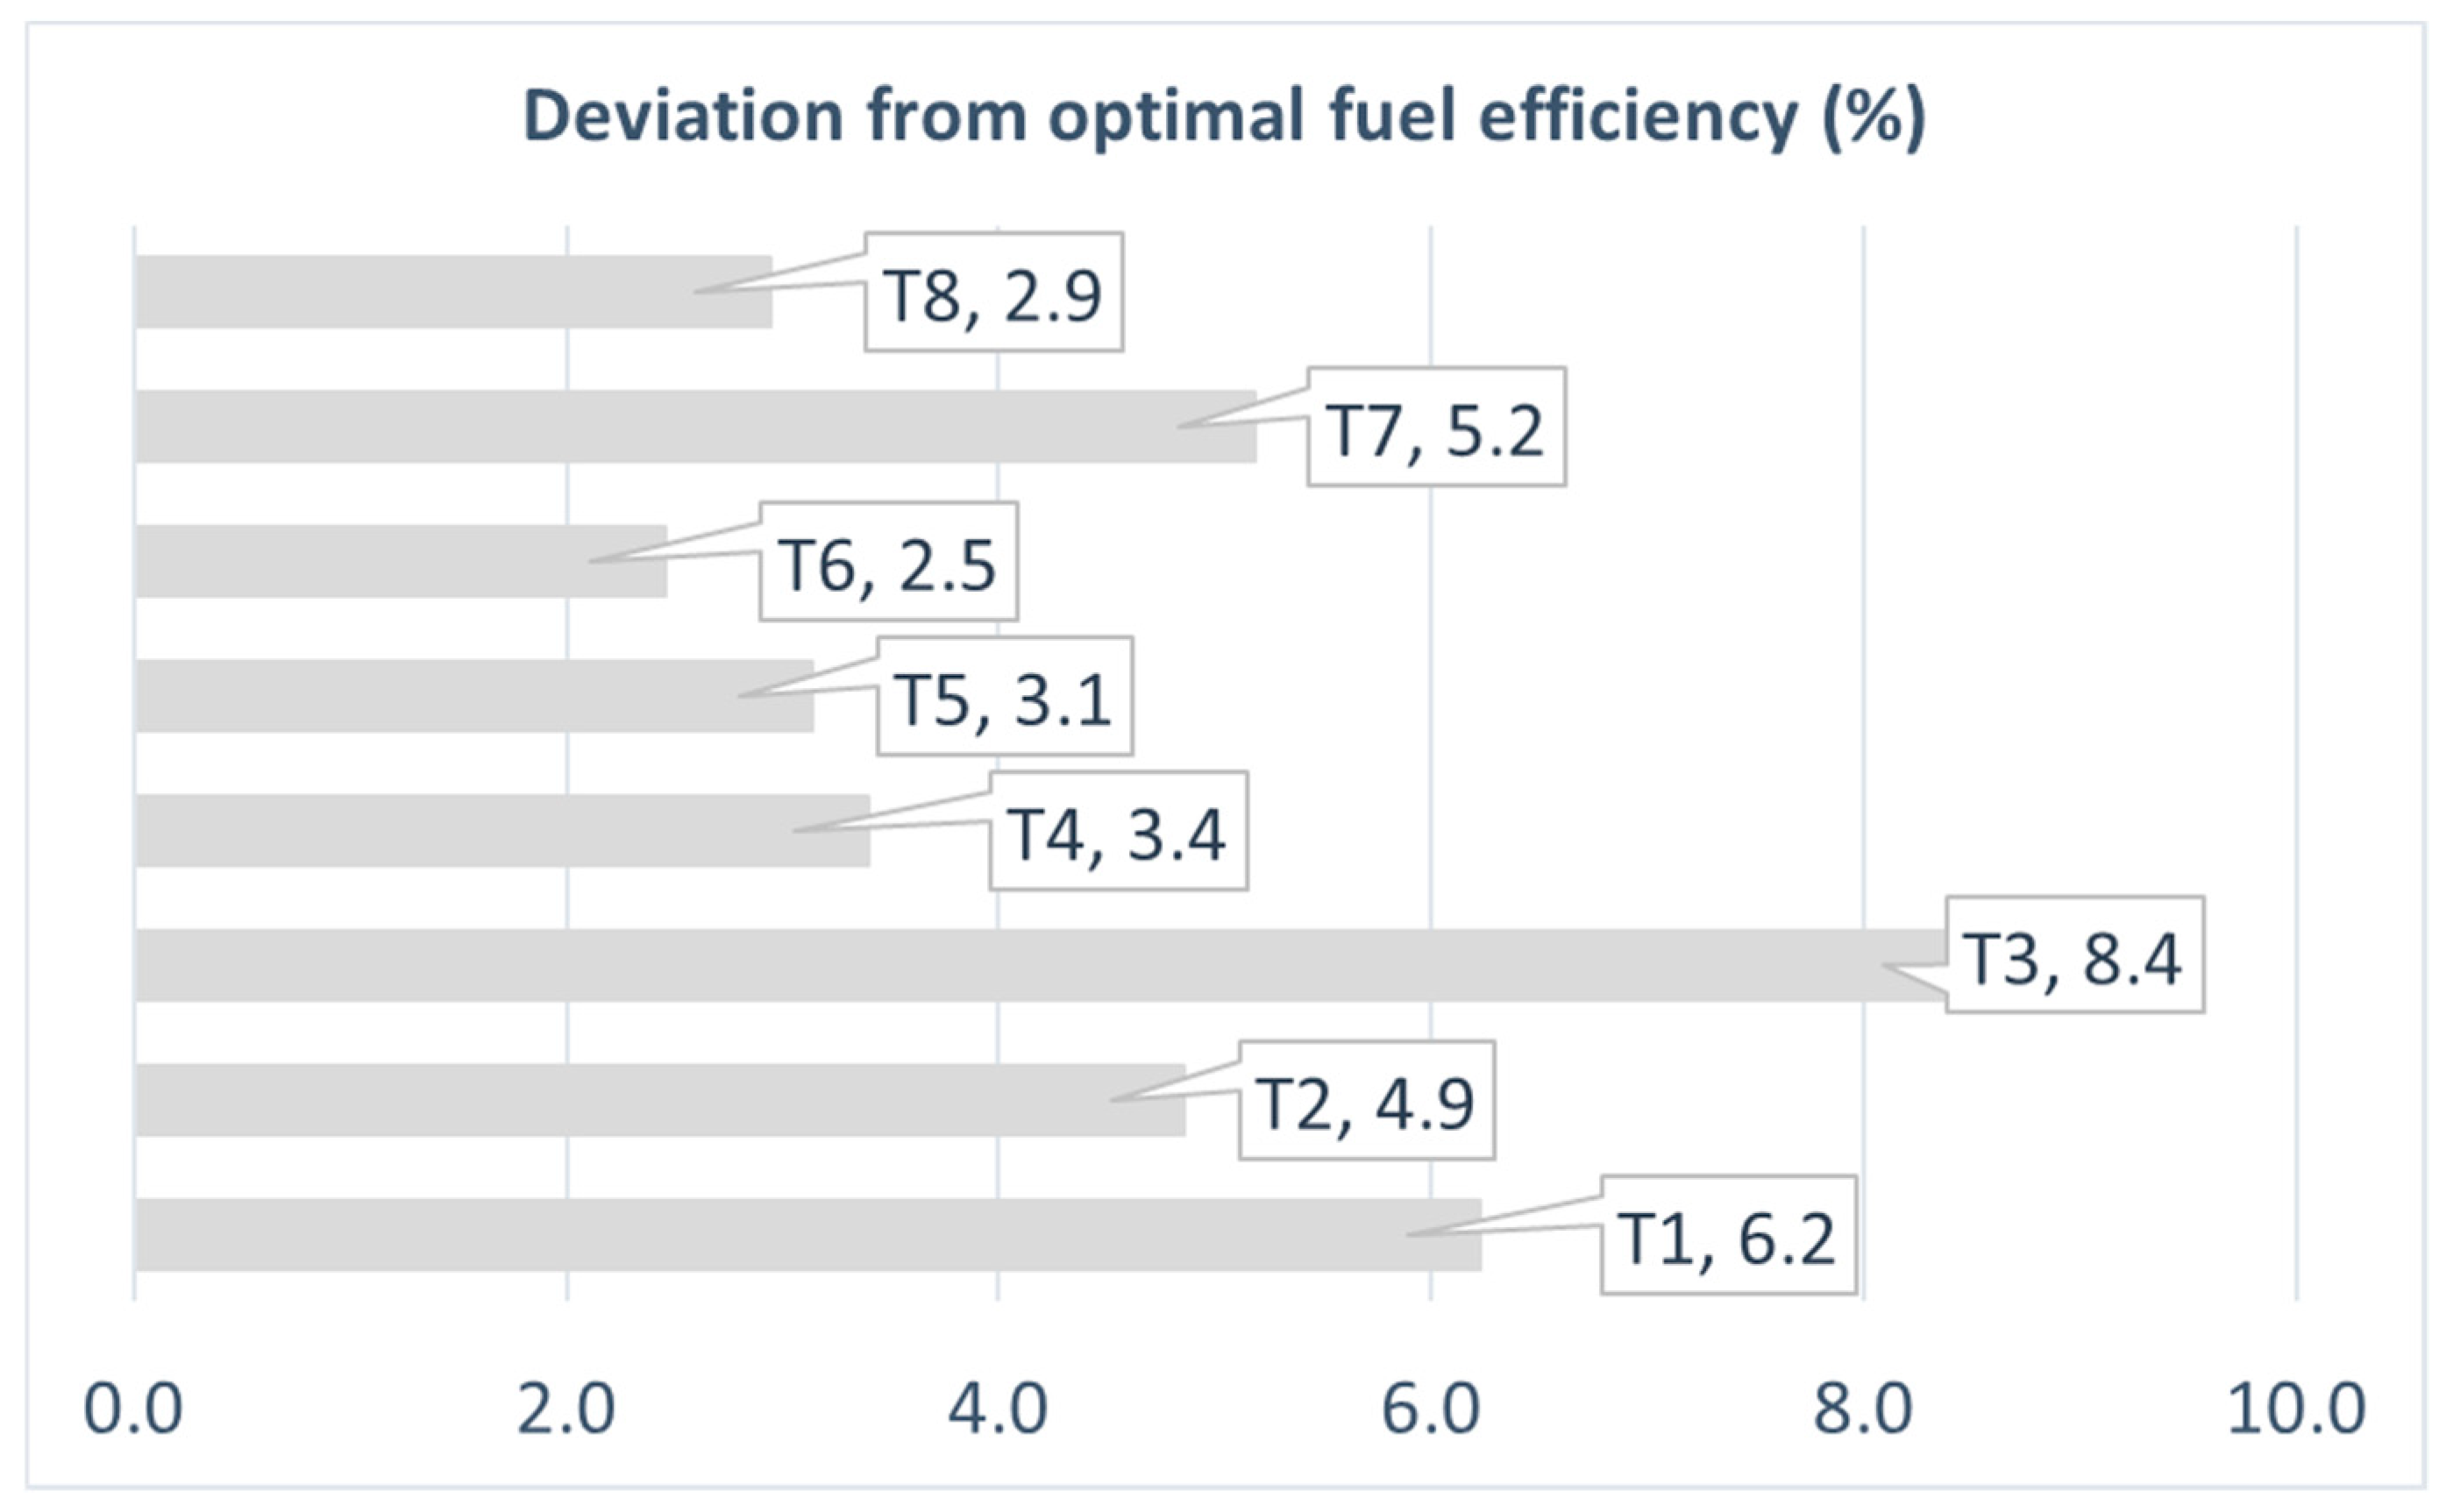
Applsci 09 04121 g012
Figure 13. Technology sensitivity analysis: deviation from optimal fuel efficiency target value.
Applsci 09 04121 g013
Figure 14. K-factor sensitivity analysis: deviation of design variables 1 for 10% decrease of the k factor.
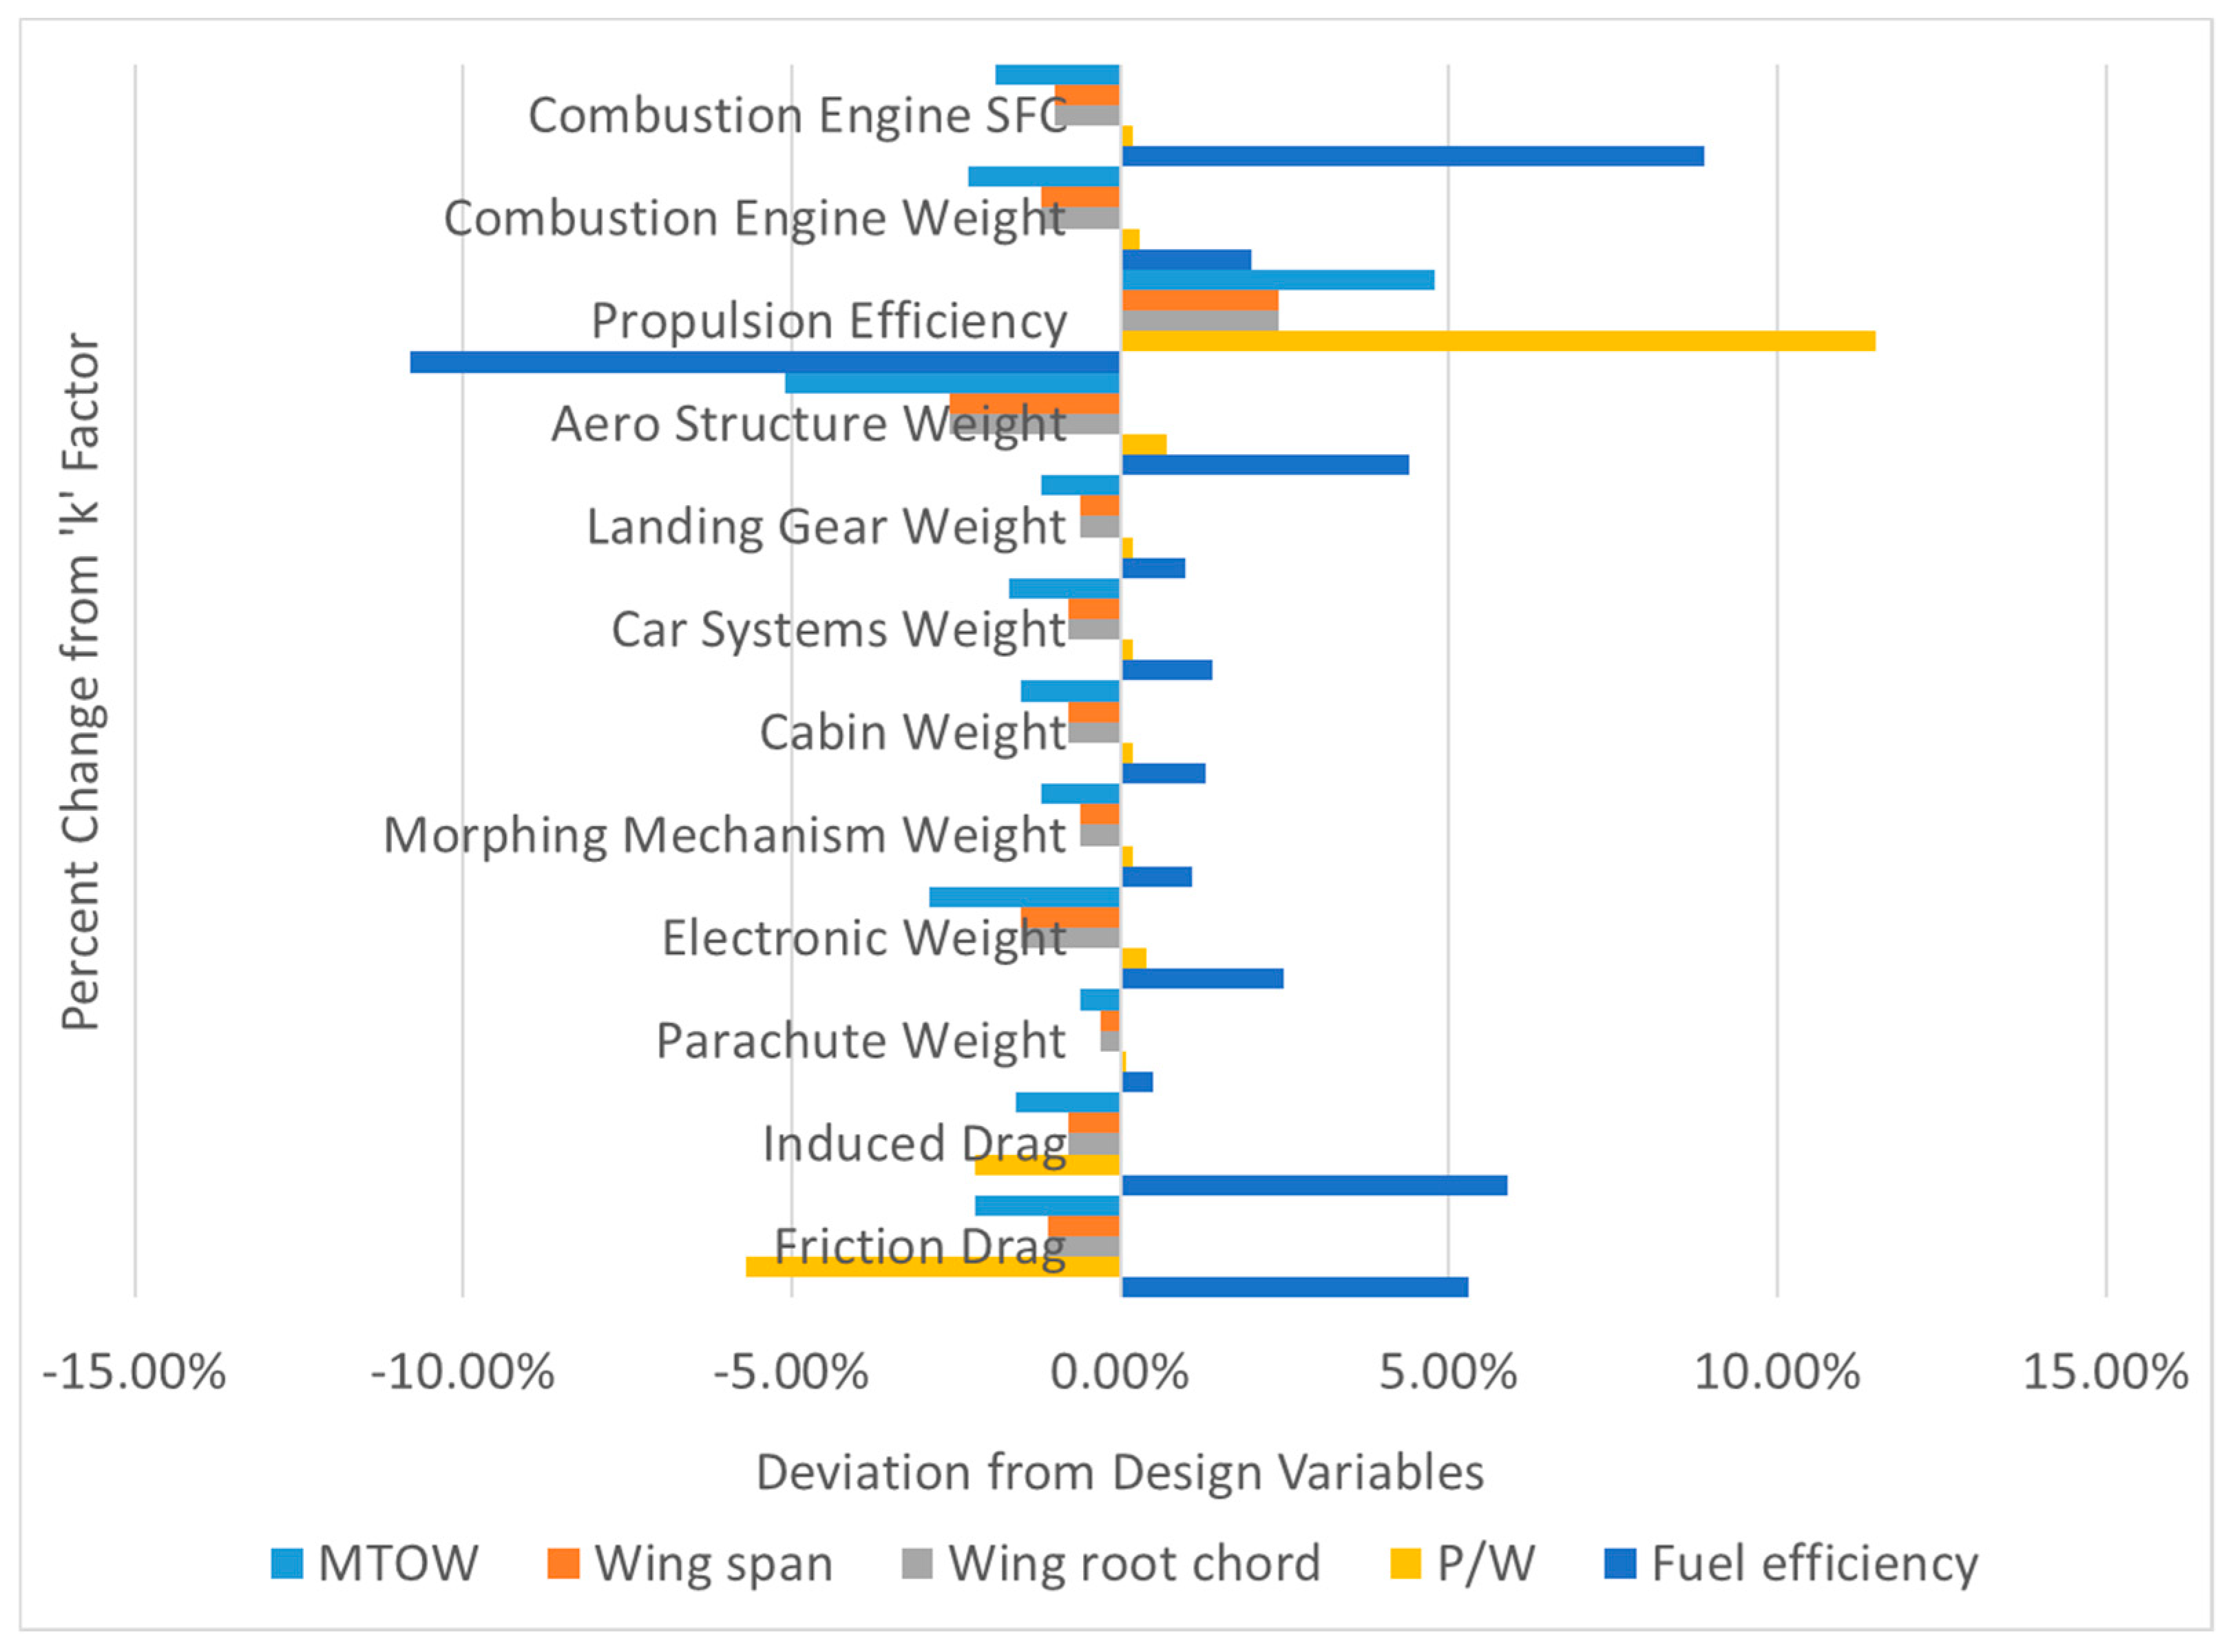
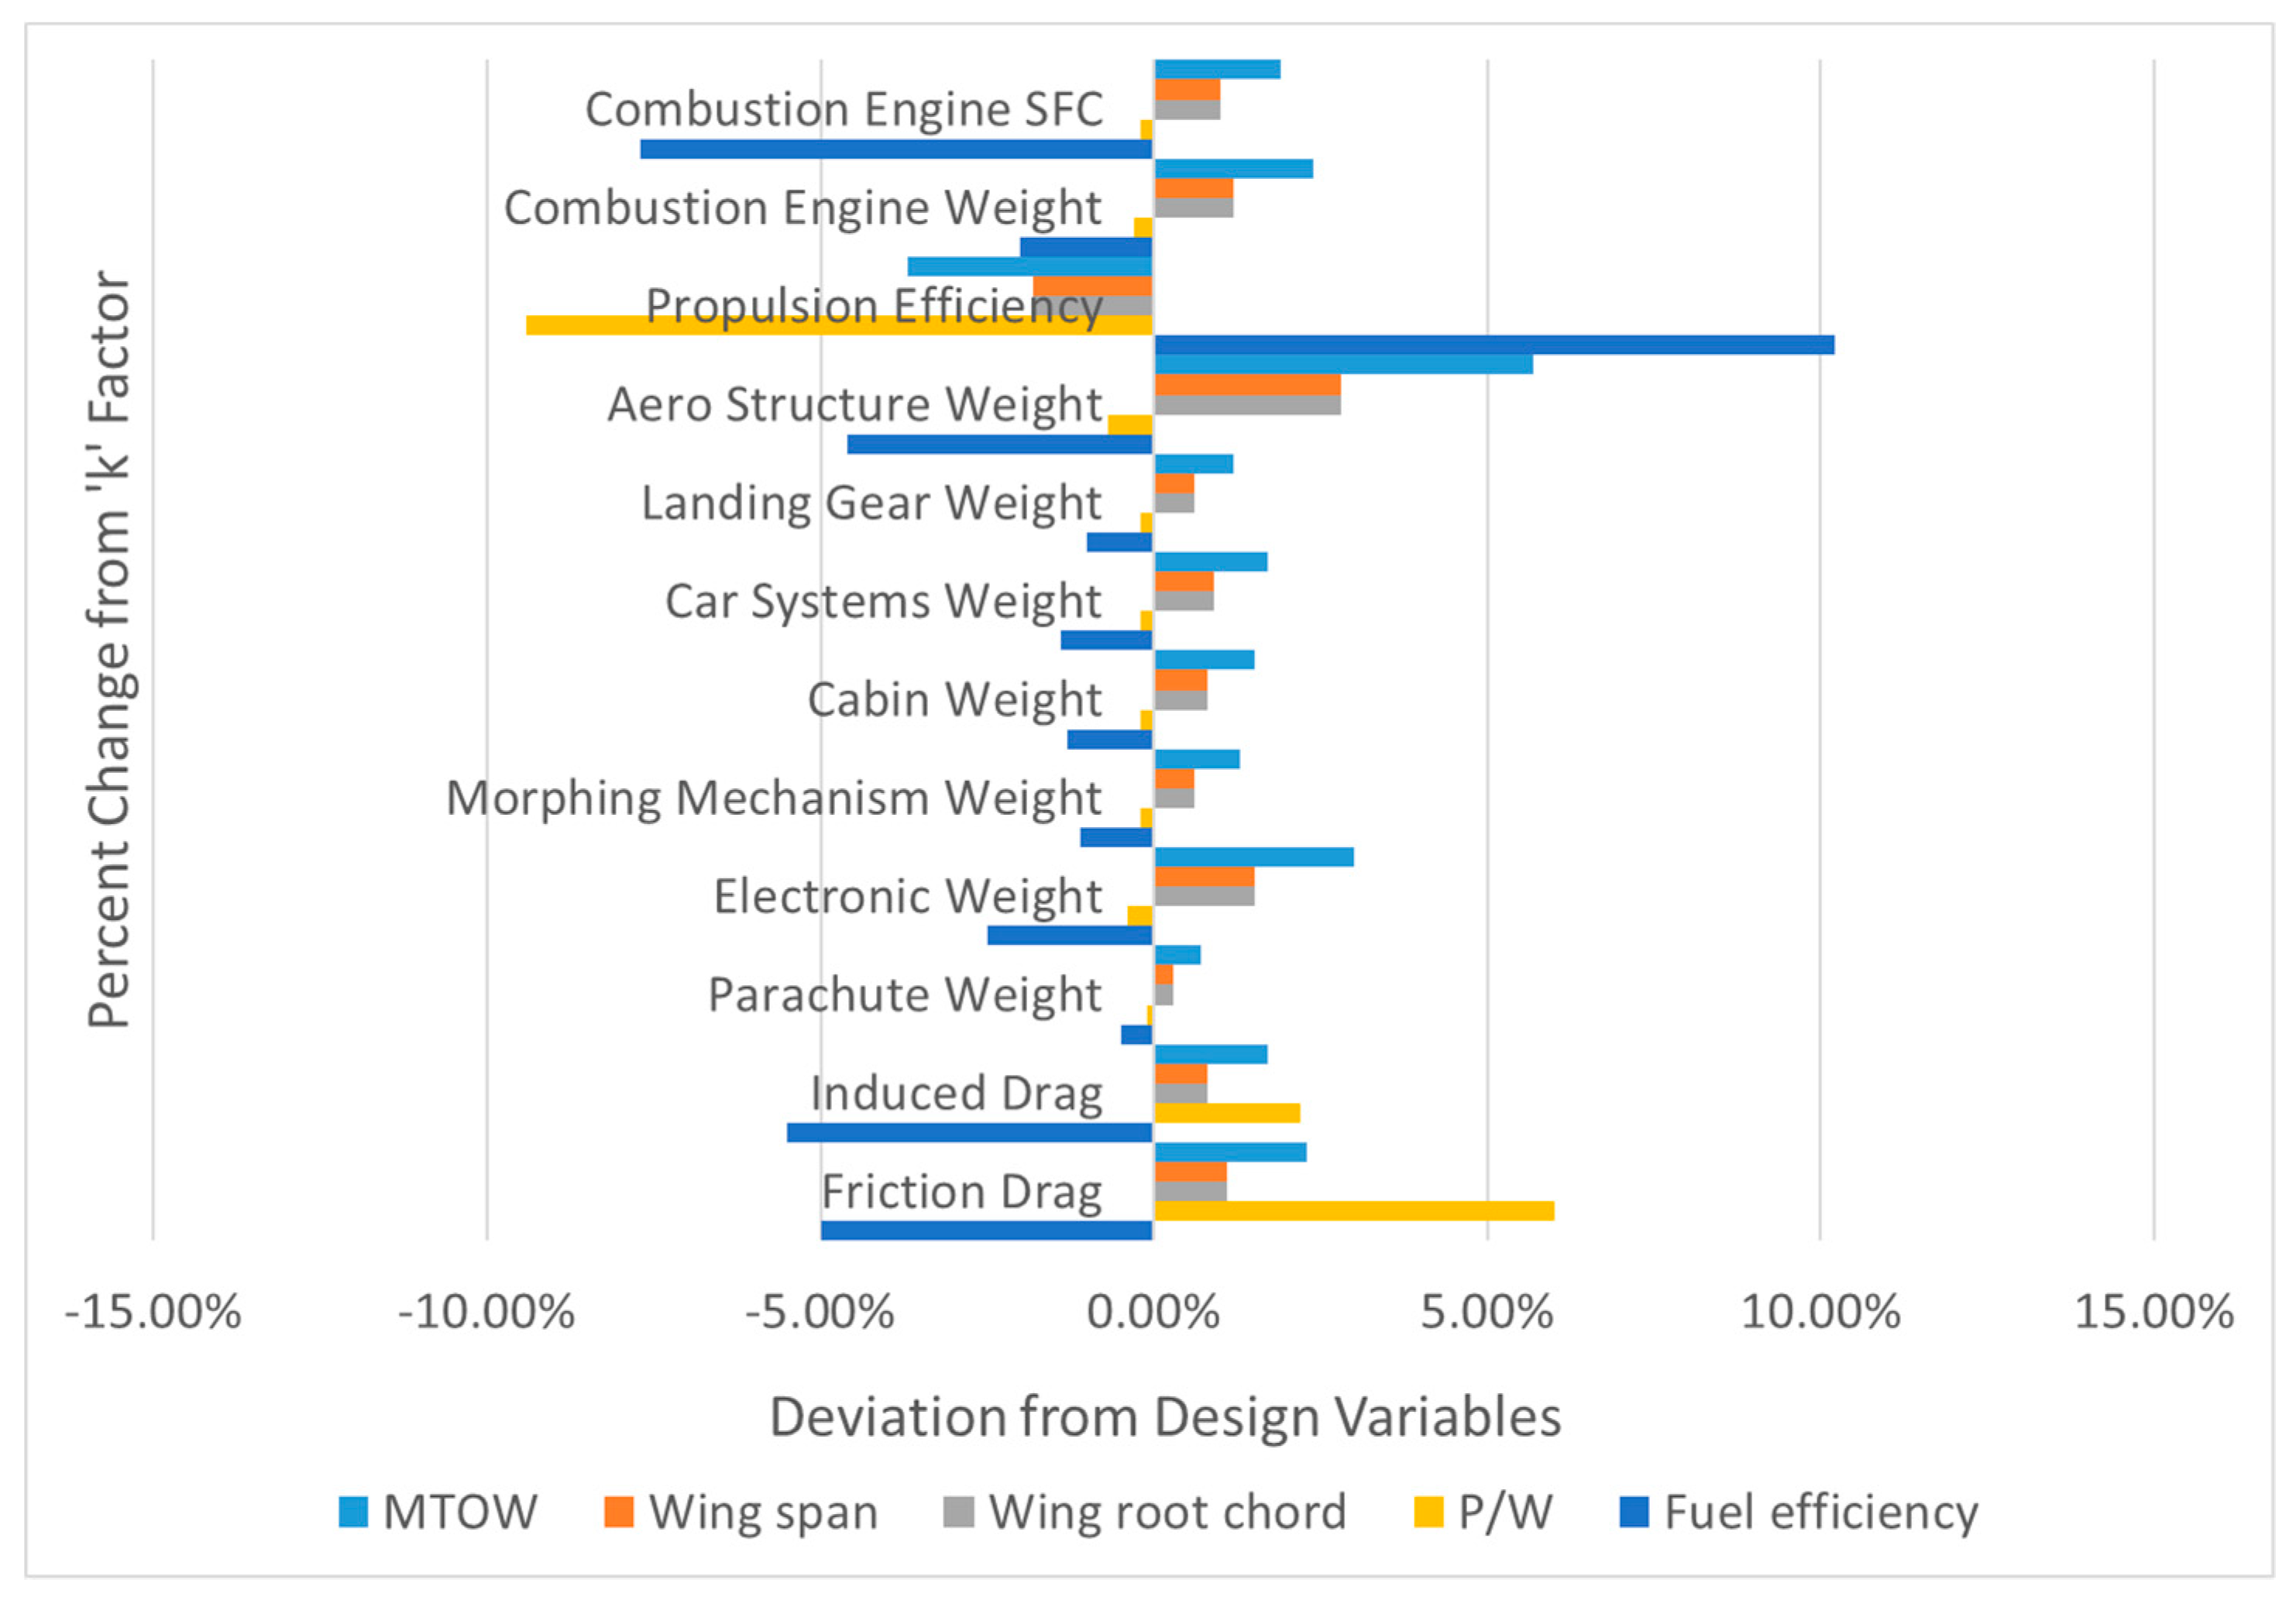
Applsci 09 04121 g014
Figure 15. K-factor sensitivity analysis: deviation of design variables 2 for 10% increase of the k factor.
Applsci 09 04121 g015
Table 1. Design objective parameter target values.
Design Objective ParametersValuesUnits
Maximum takeoff weight 2500lbs
Wing span 40ft
Wing root chord 5.3ft
Wing loading (W/S) 17 lb / f t 2
Power-to-weight (P/W) 0.07hp/lb
Fuel efficiency maximum mpg
Table 2. Selected independent design parameters.
Independent Design ParameterMinimumMaximumBaselineUnits
Range400500450nm
Maximum speed100150125knot
Cruising speed80120100knot
Cruising altitude700012,0009500ft
Passengers122person
Takeoff ground roll150020001750ft
Stall speed455047.5knot
Table 3. Coefficient of determination and adjusted R-squared of response surface equation (RSE).
Design Target Variables R 2 A R 2
MTOW0.990.99
Wing span0.990.99
Wing root chord0.990.99
Wing loading (W/S)11
Power-to-weight (P/W)0.920.90
Table 4. Regression coefficients of a response surface model.
Regression Coefficient of Design VariablesMTOWWing SpanWing Root ChordWing Loading (W/S)Power-to-Weight (P/W)Fuel Efficiency
Intercept2562.333.8435.820517.00.070513.544
Range51.2600.32900.05720.0−0.00020.2355
Maximum speed67.9070.45680.07860.00.0055−0.4008
Cruising speed101.580.65950.11400.00.0002−0.7820
Cruising altitude−31.397−0.2044−0.03520.0−0.00140.1483
Passengers223.241.43550.24670.0−0.0026−0.7854
Takeoff ground roll−0.0724−0.0005−0.00020.00.00000.0001
Stall speed−104.99−2.7368−0.47122.00.00080.1836
Passengers × Passengers41.6410.24360.04440.0−0.0005−0.0983
Takeoff ground roll × Takeoff ground roll1.66140.0086−0.00060.0−0.00050.0067
Stall speed × Stall speed22.20140.34860.05940.0−0.0005−0.1433
Table 5. Target design variable values 1 for a roadable PAV.
PercentagePredicted Values (lbs)Target Values (lbs)PercentagePredicted Values (ft)Target Values (ft)
MTOW 100%3219 2500Wing root chord100%6.9 5.3
75%273475%6.1
50%260850%5.9
26.7%250025%5.6
25%24912.5%5.3
0%22380%5.1
Table 6. Target design variable values 2 for a roadable PAV.
PercentagePredicted Values (ft)Target Values (ft)Percentage Predicted   Values   ( lb / f t 2 ) Target   Values   ( lb / f t 2 )
Wing span100%40≤40Wing loading (W/S)100%19 17
75%3675%18
50%3450%17
25%3325%16
0%290%15
Table 7. Target design variable values 3 for a roadable PAV.
PercentagePredicted Values (hp/lb)Target Values (hp/lb)PercentagePredicted Values (mpg)Target Values (mpg)
Power-to-weight (P/W)100%0.089≤0.07Fuel efficiency100%14.84maximum
75%0.07375%13.62
50%0.07050%13.09
25%0.06825%12.51
0 0.0610%9.36
Table 8. Optimized independent design variables.
Independent Design VariablesOptimized Values
Range400 (nm)
Maximum speed100 (kt)
Cruising speed82 (kt)
Cruising altitude12,000 (ft)
Passengers1 (PAX)
Takeoff ground roll1500 (ft)
Table 9. Optimized dependent design variables.
Dependent Design VariablesTarget ValueOptimized ValueUnit
MTOW 25002291(lb)
Wing span 4033(ft)
Wing root chord 5.35.7(ft)
Wing loading (W/S) 1716( lb / f t 2 )
Power-to-weight (P/W) 0.070.06(hp/lb)
Fuel efficiencymaximum14.18(mpg)
Table 10. Technology impact matrix for identified applicable technologies.
K FactorT1T2T3T4T5T6T7T8
Flow
Circulation
Flap
Leading Edge BlowingNano-CoatingPiezo-Electric Active SkinAdvanced Ducted FanLiquid MetalAdvanced PropellerAdvanced Composite Material
Friction drag−0.15−0.1−0.1−0.050000
Induced drag00−0.05−0.050000
Aero structure weight0.010.0100.02000−0.05
Car system weight00000−0.10−0.05
Morphing mechanism weight00000−0.100
Propulsion efficiency00000.0300.050
Lift0.1000.10000
Electronic weight0.05000.050000
Table 11. Factorial design for applicable technologies.
CaseT1T2T3T4T5T6T7T8
1−1−1−1−1−1−1−1−1
2−1−1−1−1−1−1−11
3−1−1−1−1−1−11−1
4−1−1−1−1−1−111
1301−1−1−1−1−1−11
253111111−1−1
254111111−11
2551111111−1
25611111111
Table 12. Factorial design result for applicable technologies.
CaseMTOW (lb)Wing Span (ft)Wing Root Chord (ft) Wing   Loading   ( W / S )   ( lb / f t 2 ) Power-to-Weight (P/W) (hp/lb)Fuel Efficiency (mpg)
1229133.05.7160.06
2221332.45.6160.0614
3224732.75.6160.0615
4217132.15.5160.0615
130218732.25.5160.0616
253211031.75.4160.0519
254204331.15.4160.0519
255208231.45.4160.0519
256201630.95.3160.0520
Table 13. Technology combinations satisfying root chord length requirements.
CaseTechnology Combinations
48Combination 1: T3, T5, T6, T7, T8
108Combination 2: T2, T3, T6, T7, T8
176Combination 3: T1, T3, T5, T6, T7, T8
22Combination 4: T1, T2, T3, T6, T7, T8
238Combination 5: T1, T2, T3, T5, T6, T8
240Combination 6: T1, T2, T3, T5, T6, T7, T8
248Combination 7: T1, T2, T3, T4, T6, T7, T8
256Combination 8: T1, T2, T3, T4, T5, T6, T7, T8
Table 14. Alternative design parameters satisfying all requirements.
Design ParametersMTOW (lb)Wing Span (ft)Wing Root Chord (ft) Wing   Loading   ( W / S )   ( lb / f t 2 ) Power-to-Weight (P/W) (hp/lb)Fuel Efficiency (mpg)
Target 2500 40 5.3 17 0.07Maximization
Optimal baseline229133.05.7160.0614.18
Combination 1203631.15.3160.0617.44
Combination 2202631.05.3160.0517.81
Combination 3202131.05.3160.0518.51
Combination 4201330.95.3160.0518.91
Combination 5202431.05.3160.0518.59
Combination 6199630.85.3160.0519.39
Combination 7203231.15.3160.0519.57
Combination 8201630.95.3160.0520.05

