Abstract
Complex Information Systems and infrastructures, like Smart Cities, must be efficiently operated, minimizing inefficiencies and maximizing productivity. Traditional approaches are focused on improving the systems, automating processes and services, leaving aside human and emotions considerations. To achieve this efficient operation, we attempted to cover both sides. We found new ways to capture the information coming from the workforce, in our case, the operations management team, and, merged this information with the data from the IoT sensors from the systems, enabling a holistic view of the entire operations occurring in real-time. In a Data Center environment, we have developed a set of tools for capturing the emotional data in order to detect potential biases caused by the specific mood of the person inside the operations team. We used Artificial Intelligence algorithms for finding the patterns that will help us to manage the system in the future. We compared and verified our findings with the existing references from other disciplines, e.g., Psychology. In this article, we expose some methods to be developed in future studies for supervising and increasing productivity in Data Centers, as a useful example for Smart Cities. Our research focuses on monitoring the mood and the emotional status of the personnel responsible for operating the system. We use this emotional data as an input for measurement.
1. Introduction
We live in a world characterized by a constant population increase and limited resources. There is nothing left but to reinvent the way we live, and there is nothing better than do it with Smart Cities, capable of using information and communication technology with the aim of creating better infrastructure for citizens. This is the objective of this study, to be able to create an intelligent system inside a complex infrastructure. We are going to focus on the specific case of data centers, and we are going to provide them with intelligence, not only rational but also emotional.
If we talk about managing infrastructures, like Smart Cities, our main concern is how the general mood of a system, including machines and humans, could be affecting the performance of the whole production environment. We are looking for procedures to extract all the information that may be negatively affecting the general behavior of complex systems. Efficient management requires more powerful tools, that can be aware of processes and tasks, capable of analyzing every corner of the production activity and establishing the relationships between all of them. Therefore, in a future final stage, the system should be totally or partially capable to automate the decision-making process order to prevent the wrong decisions that can affect to the system. The different variables of a Complex Infrastructure are usually optimized independently. In fact, in many data centers, the management of the infrastructure and the servers could be supported by different companies with scarce communication. However, the different variables are often related to each other with hidden relationships that may change over time. Therefore, a holistic approach for resource management is essential. Our management systems should be capable of aggregating information from all the different elements, and be also aware of:
- The activities: what is happening in the data center, the services demand, the appropriated resources, energy consumption, thermal evolution, possible cyber-attacks, and many other things;
- The context: the circumstances of the real status in the operations management team, establishing the context, state of mind, objectives, and many other uncertainties that may occur.
- The personnel: we must take into account the computational infrastructure system managed by human operators who supervise and manage all the activities following business guidelines.
1.1. Human Error
Included in the Data Center Cyber-Physical System we find the personnel operating the system. Since the dawn of humanity, error is an inherent sign of its human condition, so it is important to know what error is and how it could affect the whole situation. The definition of human error, as well as its nature, is complex, but it could be defined as an unfavorable event strongly conditioned by people activity who participate, directly or indirectly, in the realization and control of a process. Or, in other words, it could be defined as the failure to reach an intended goal, the divergence of a fact from a standard. While some authors opinion like Jaques Leplat [], who blame human factor for all the errors, the fact is that is the main cause of accidents. Human error figures prominently in most of the well-known calamities in the world, such as Bhopal, the Exxon Valdez, and Chernobyl []. It appears in most other complex technical activities, human error is implicated in the majority of aviation-maintenance-related quality lapses, incidents, and accidents [,]. To get an idea, in medicine, the error rate attributed to human factor is nearly 50% []. In fact, a study from the U.S Institute of Medicine [] considered that the number of deaths caused by medical errors exceeded the eighth cause of general death: more people died as result of medical errors than for motor vehicle accidents, breast cancer or AIDS []. In the case of aviation, a 2006 Federal Aviation Administration study found that from 1990 to 2002, 45% of major airline accidents in the United States and 75 percent of commuter carrier crashes were associated with human error. And, at working locations, human error is considered the cause of more than 80 percent of all workplace accidents [], rating the impact of U.S. injury-related workplace accidents (according to the National Safety Council []) at an average cost of $125 million per day (approximately $123 billion per year).
Some studies [] attempted to improve and reduce human error in processes of production operation. The International Human Factors Engineering Society presented the definition of human factors engineering, like anatomical, physiological and psychological aspects in certain circumstances, the study of mankind and machine and the environment, human health, safety and comfort and other issues. In other words, human factors engineering is the application of scientific knowledge about the physiology, psychology and medicine. It studies the relationship between humans and the environment, as a whole system, to improve overall efficiency.
One of the interesting contributions of human factors engineering, is the research about fatigue. Ergonomics intends to maximize human capabilities and may contribute to decrease mistakes made by the personnel in operations tasks. Ergonomic studies were originated in the industrial revolution of the nineteenth century, in the early twentieth century, when Frank Gilbrerth [] proposed a study about sports and store management. The study includes fatigue, working positions and design between other factors. Gilbreth improved operating room procedures, some of them are still in use. At the same period, the American scholar, F.W. Taylor, studied the new management methods and theories, considering the standardization of machinery, tools, etc., for example, his shovel shape, size, weight, and studied how to reduce the fatigue caused by unreasonable actions []. We can find some other studies in Ergonomy talking about the working atmosphere and air temperature at work environments and how this environmental conditions may affect the task execution [,].
Harvard University psychology professor Munster Berg [] proposed a method to improve efficiency in “Psychology and industrial efficiency”. Although, there are present studies in the field of Psychology, as shown in the analysis from McKinsey Global Institute in 2012 [], the level of development of the literature about social and emotional capabilities is below the average.
1.2. Emotions
As we can see, human error is conditioned by different stimuli. Environmental conditions and mood aspects are relevant to determine the probability of error occurrence. In this study we focused our attention on emotions and their impact on task execution at the workplace. In our research line, the reference of emotions is becoming more and more important. It is especially relevant when we are able to compare similar situations. We can learn from the personnel and how they behave under those situations, the relationship between emotions, mood and climate to enhance the work environment performance. For representing the level of activation and valence of specific emotions, we used the two-dimensions circumflex model. This model comes from psychology literature back from 70s and 80s. We can find the general representation system in Figure 1 [].
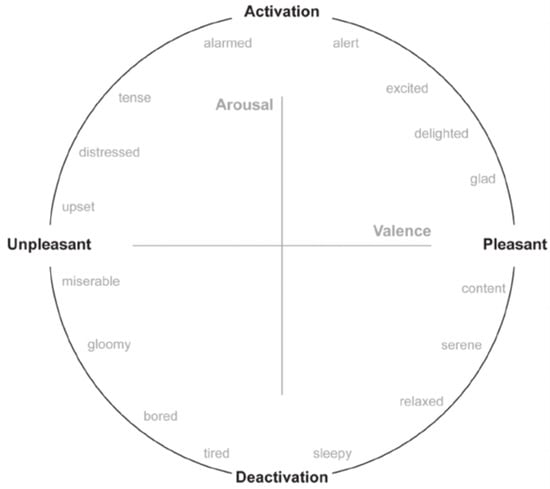
Figure 1.
James Russell Arousal-Valence model from 1980.
As we are going to present, in the next section, we used this model for positioning and defining emotions considering these two dimensions, Valence and Arousal. Emotions precede, in most of the cases, to the decision-making process. With the appearance of a new prospective in the emotion’s evaluation process, a new paradigm emerges with the inclusion of new approach in Judgment and Decision-Making theories. During these last years, the science of emotion and affective computing created a huge potential and a strong research field to apply in the future of industrialization. Different studies point at the future of emotion awareness as a strong player in the business intelligence of management systems [,]. This research field reveals that the study of emotions should be presented in different moments at work or in our personal life. Any small or big decision we make in our life is intended to be an avoidance of negative situation or feelings, such as regret, fear or guilt. On the other hand, we treat to maximize the positive situations of feeling like love, happiness or pride. But the main outcome of these situations we may get unexpected reactions or emotions (anger or regret). The main point is, that taking in account the studies in Psychology [] about these matters and the main patterns of human behavior, we may be able to predict some of the reactions and may influence or distort final decision making.
We took the valence-based approach because in the last twenty years the new mainstream in this area points at a multi-dimensional model for evaluating those influences. Evaluating just the valence does not seems to be enough, because emotions with the same valence may differ, like sadness and anger. Those emotions will have different brain activation, physiological reactions, facial expressions or nervous system activity. Using two dimensions couldn’t be enough either to describe emotions. Disgust, sadness and anger are negative affect forms, but their associated arousal does not give us the difference between them. We need to go one step further to define the relationship between emotions, decisions and the associated process of decision-making. For decision forecasting or predicting reactions on certain situations, we use the schema of the proposed model by those studies [,]. Those works examined emotions using the Appraisal-Tendency Framework which connected the process of Appraisal with emotions associated to choices and outcomes that would come after the moment of reflection or judgment. The general approach predicts that emotions with opposite valence (happiness and anger) may trigger similar reactions and emotions with similar valence (anger and fear) may exert different judgments, reactions or choices.
1.3. Management Console
We developed a prototype for supervision, an intelligent management console, as shown in Figure 2, that includes the information needed for this decision-making action, monitoring the major variables from the employees and from the system as well.
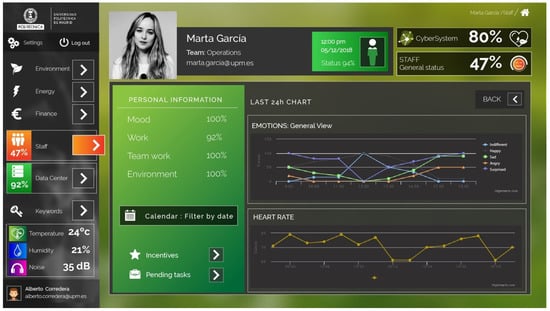
Figure 2.
Employee record with historical data view.
This article contributes to enhance Smart Management Systems using emotional data as one of the inputs of the IoT sensors. In this research we produce a data model and data capturing techniques for populating the cyber-system information data store. We will use this data as a decision-making driver in major issues, i.e., scheduling, prioritizing, managing and assigning operations tasks, based on the overall system mood, increasing the efficiency of the whole system. Unlike in previous proposals, the behavior and management of machine and human should be aligned and optimized using emotional awareness as a productivity tool.
We represented the work environment with its main elements, and we built a model to exemplify the command control environment. In this environment, we find the main dashboards representing the systems we are managing and the workers that are supervising the whole infrastructure. Every worker has his own sensored workplace. In Figure 3, you can find one of its graphical representation.
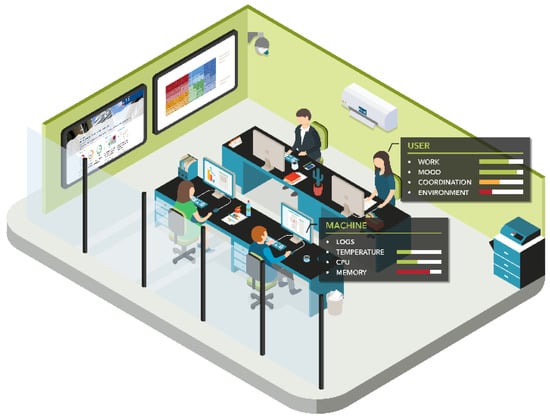
Figure 3.
Operations Management Sensored-Workplace general view.
In the Section 2, Materials and Methods, we will expose the different experiments, tests and analysis that were made in this research. In Discussion, the main outcomes of our work are commented. Finally, Conclusions will point to future directions of this research area and future possible commercial applications.
2. Material and Methods
This section we expose the method, the IoT sensors and the tools used to capture human, environmental and machines information in our workplace: a Data Center.
The analysis of emotions and productivity involves two parts: an emotion recognition section and a task performance measurement. The first one consists in identifying a final emotion from the Employee Information Extraction Point. Sensors will catch different values with which define a final emotion (formed by two axis punctuation: valence and arousal). Final emotion will be expressed by one of the 4 basic emotions defined by Ekman (sadness, happiness, surprise and anger) and a neutral emotion defined by us (that express the central point of Russell’s emotion model). The second part of the analysis consists in measuring the time that the worker spends performing the basic task (defined as a System Integrity Check).
With the emotion recognized and the time measured, we developed an analysis of relationship between emotion and productivity, defining productivity as the deviation of time performance from the referenced base time.
2.1. Data Centers
Data Centers constitute a special case where the management of human errors is key. This is why this study pretends to provide added value to the development and management of complex infrastructures from an emotional point of view. A Data Processing Center (DPC) or Data Center is the physical location where there are gathered the necessary computing resources of an organization or a service provider. They constitute a large space, where all the electronic equipment, part of the system, is placed.
As we mentioned, all organizations have errors and control barriers. However, some articles from Psychology [,], suggest that emotions will guide the decision-making process. The strategy followed in this article for the optimization of complex infrastructures management is based on the analysis and control of emotions into the system itself. According to the Ponemon Institute’s study from 2016 [], the third cause of system outages, just after cyberattacks and power supply system failures, is human error, with 22%. This is translated to a $489,000 cost per failure, according to this reference.
Therefore, the system proposed in this article intends to reduce mistakes, monitor human personnel and the systems performance, decreasing the possible expenses caused by those human failures, improving the productivity of the whole system. For a more detailed representation of the workplace described before (Figure 3),we propose to use a custom model developed for managing this kind of environments, composed by different types of variables (environmental, biometric, state and health variables of the system) (see Table 1).

Table 1.
Variables from Employee Information Extraction Point.
2.2. Experimental Variables
Experimental Variables can be obtained from the operators’ workplace. We developed an employee information extraction point (see Figure 4) that can be implemented in every operators’ workplace.
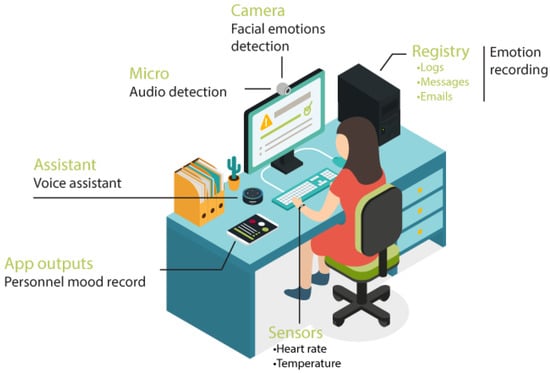
Figure 4.
Employee Information Extraction Point.
Environmental variables are determined by ambient parameters in the data center. One important variable is noise (although temperature IoT sensors could be subsequently added). The microphone connected to the room will measure the periods of time that exceed a maximum level of noise (determined, in our case according to European Union Directive on Environmental Noise (2002/49/EC), between 40–50 dBA) [], indicating an exceptional situation of the system, therefore a possible bad influence in this environment. This variable will be Boolean, so it will only take the 0/1 values. We are using biometric sensors to control heart rate and the excitement of the workers. This biometric variable, as well as environmental ones, will be of Boolean type. According to the person approach and Dejoy’s error model (1990) [,], it is necessary to monitor, not only the worker, but also the workplace. We built three status variables from three types of input sources (included in Table 1), all of them extracted from the employee information extraction point (Figure 4).
These status variables are very relevant in our study, as we intend to consider emotions as a key base in complex infrastructures and try to relate them to the infrastructure productivity.
The first status variable is a facial emotion recognition variable, which is obtained from a collection of photos through the webcam of the employee information extraction point. We developed a facial recognition algorithm and trained it with our own dataset (Figure 5), formed by a combination of different data sources: photos from Extended Cohn-Kanade [,] and Recola database, and a collection of images of our research group personnel. These last images were taken from a video data source. As a result, we obtained a model able to detect the worker emotion with 79.23% accuracy.

Figure 5.
Emotion captures example, from video Dataset samples from our experiments. Representing 5 major emotions.
For the second status variable, we created a mobile and tablet application, using a voice assistant alternatively, where we ask, every thirty minutes, different questions about workload, mood of the worker, opinions of the system, etc. The idea is not to be intrusive in the workplace applications, and get extra data, that could show us possible unexpected situations that may affect the personnel from the command control center, like bad moods or simply fatigue. These devices are also present in the employee extraction point.
The third status variable is obtained from the voice of the workers. We made a model for audio analysis, which will give us the emotional prosody of the operator, expressed in terms of valence and arousal. We built our own audio recognizer, training a CNN with audio from Recola database and from our research group personnel. This last audio was taken from the same video that the images used in facial recognition. The best model obtained was able to predict the arousal with a Concordance Correlation Coefficient (CCC) of 0.8449 and the valence with a 0.2595 CCC.
After having the results of the emotions from the three status variables (face emotion recognition, audio analysis and the app/voice assistant questionnaire answers), we made a sensibility analysis trying to find the relationships between all the features and the final emotions. We divided the study into two: valence and arousal sensibility analysis, adding and modifying the features and seeing the produced changes in the target variable. We presented Figure 6 and Figure 7 as the results of the weights of the features regarding the target variable (valence for Figure 6 and arousal for Figure 7).
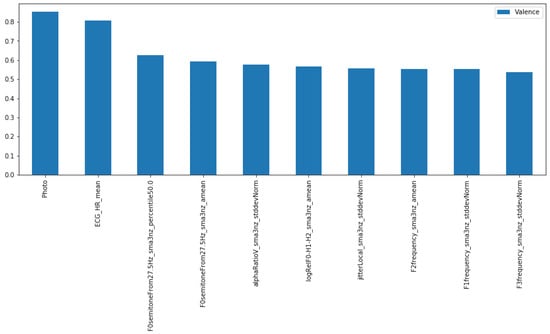
Figure 6.
Emotional Variables Weights for Valence.
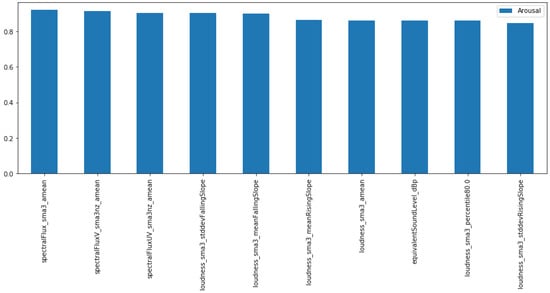
Figure 7.
Emotional Variables Weights for Arousal.
2.3. Experiment and Results
Once the Employee Information Extraction Point is implemented in the workplace and the status variables are extracted and traduced to valence, arousal and their final emotion, it is possible to relate them to productivity. We built an experiment for this purpose. We selected 12 operators, giving them the order to solve a common task in the data center. They all signed explicit consent for managing their data, and make some profiling with it. We defined a base time to execute the General System Integrity Check (10 min), this task, at the same time is subdivided into the following subtasks:
- Hardware, Operating System (OS)
- Processor utilization
- Network communications
- Disk space utilization and performance
- Main storage utilization and performance
- Error Logs
- Message and system output queues
- System Security
- Backup and Recovery
- Disaster Recovery
We measure productivity as the deviation from the time base, being negative the time reduction and positive the increment of time during the task execution. The 12 subjects are people with experience in data centers and all have similar knowledge. We made 50 different tests with the sample, detecting the dominant emotion, the arousal and valence of the subject. We used the employee information extraction module for the test. Figure 8 sums up the distribution of the emotions for the 50 analyzed cases. It is important to note that there was no failure of the system while executing the task during the test.
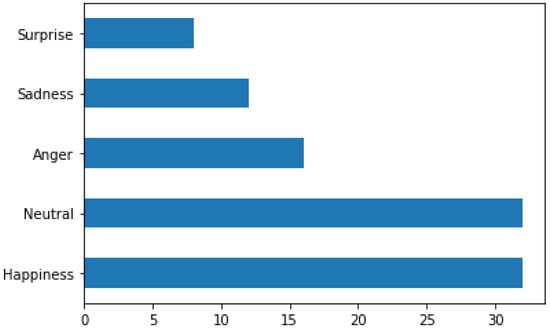
Figure 8.
Emotion Distribution (%).
The objective of this experiment is to relate emotions and productivity within a data center, measuring the execution time in a simple, common and repetitive task. The correlation matrix between variables is shown in Figure 9.
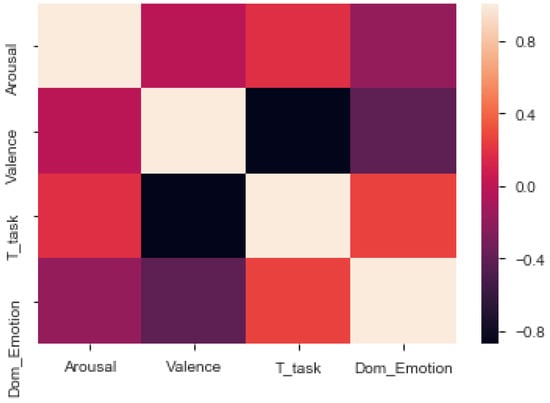
Figure 9.
Correlation Matrix.
As we can see in this figure, T_task (corresponding to the time spent by the subject executing the assigned task) is inversely proportional to the valence of the emotion.
If we evaluate the impact of the emotion in the task duration (as shown in Figure 10 and Figure 11), we can see how emotions with a negative valence, such as anger and sadness, have a negative impact in the productivity (that is, they delay task execution in an average time of 4 and 2 min, respectively). Happiness, on the contrary, tends to increase productivity, saving time during the task execution, in an average of 2.5 min. Neutral and Surprise emotions do not influence the average time duration of the task, although Neutral cases tend reduce the time spent in the task.
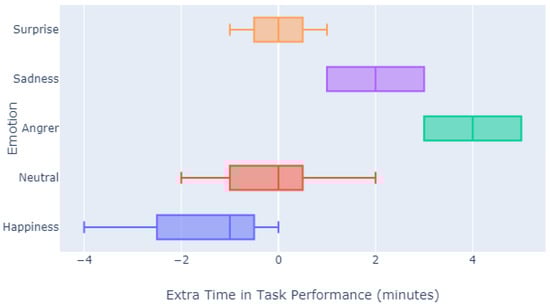
Figure 10.
Productivity Impact of Emotions.
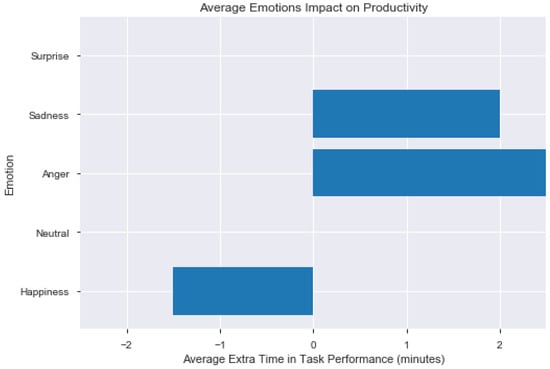
Figure 11.
Average Emotions Impact on Productivity.
Focusing our attention on the valence and arousal extracted of the subjects’ emotions, we found interesting results. As shown in Figure 12 and Figure 13, the valence of an emotion has a significant impact on productivity. The greater the valence is, the greater it is the productivity of the subject. The arousal does not have a clear tendency, but it seems to have two different tendencies. Until arousal = 0.41748, productivity increases proportionally to the arousal value. From arousal = 0.41748 onwards, productivity decreases as arousal increases, so high arousal values seem to impact negatively on productivity.
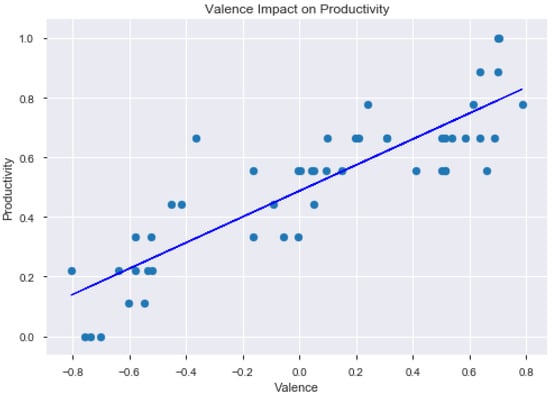
Figure 12.
Valence Impact on Productivity.
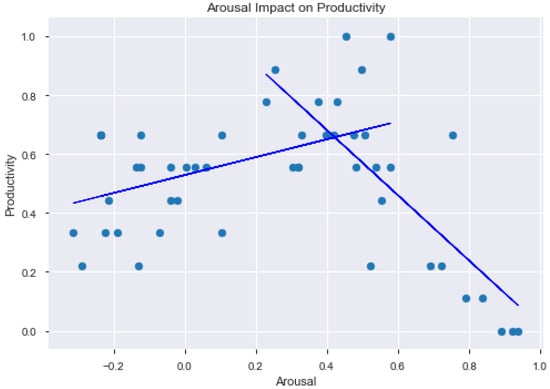
Figure 13.
Arousal Impact on Productivity.
Once emotions are being related to productivity, it makes sense to put in place a management tool to control, in terms of awareness and prediction, the emotions of the Data Centers workers, which allow the supervisor to act on them or distribute them according to their emotions, in order to obtain a better efficiency and productivity. For this reason, we created a prototype of a Management Console (Figure 14), where emotions and workers are represented, but also the general system health through the infrastructure sensors. As we have explained in this article, at the same time that personnel is controlled (based on workers emotions), we will be monitor the whole infrastructure, defining a system health variable (with data of logs, temperature, CPU, memory… of the infrastructure machines), which will be controlled and stored, predicting possible failures or system crashes as well. All elements of a complex infrastructure (like a Smart City) are contained on a simple management console.
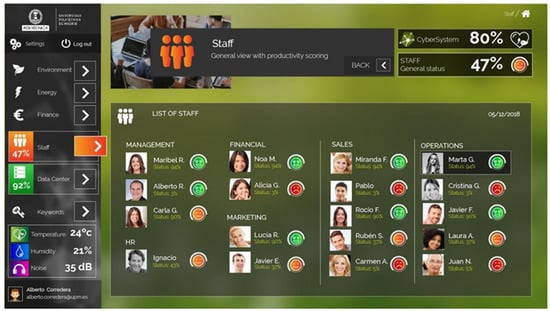
Figure 14.
Staff general view from the Management Console.
3. Discussion
All our activities produce data, in every situation. The meaning of this information may change depending on the context. At the workplace we need the specific IoT sensors to obtain the data, using the appropriate hardware architecture. We need it for protecting, accessing and using our own data.
In our scenario we used common video, audio accessories or even Natural Language Processing (NLP) in the initial testing []. We created an Employee Information Extraction Point applicable to any Smart City in order to extract emotional, environmental and machine variables. In this Infrastructures, the emotional part can be optimized, as a conscious system where machines and humans are monitored and efficiently managed. Optimization is related to workers’ emotions and their productivity is higher when they are in a positive mood (as the outcome in our study). This idea coincides with the studies’ conclusions of other authors [,,], so it is necessary to have a staff management tool where emotions are considered, and the workers are distributed according to their emotions. Using previous studies from our recent research, we studied the trends introduced by the emotional status and the external stimulus received by the workforce [].
At the same time, it is necessary to monitor the whole infrastructure and to define system health variables (with data of logs, temperature, CPU, memory, etc., of the infrastructure machines), which will be controlled and stored, predicting also possible failures or system crashes.
The main goal of the new proposed system is to capture the objective emotional data that should be easy observable. We used previous experiments to apply our knowledge from affective computing to this specific use case. We developed experiments on how to produce valuable information and represent it in a different way, like in Figure 2, where we draw the evolution of both biometric and emotional data from the employees and the general health of the Cyber-System.
In this work we introduced human error and performance monitoring as the focus for industrial productivity, considering some approaches in analysis and control. We introduced the emotions, without getting into details in the psychological studies, and the impact of decision making at the workplace. Our initial reference was a data center, as an example of infrastructure, that has to be up and running 24 × 7 with all the services available. We did some testing and experiments, treating to represent the major concerns inside the operations management process, getting data from different sources. Lastly, we made some sensitivity correlation analysis of the variables to learn from the information we obtained. From this knowledge we will be able to design future tools for extracting emotion and context information, correlating the data from the personnel with the system data.
In our case the outcome of the experiments is a set of data, categorized and ready to be exploited in different cases. We introduced human error as the major driver for improvement in the operation of different kind of infrastructures or Smart Cities. We obtained variables, that give us the context information missing in most of the scenarios. We introduced the influence of the psychological factor in the performance and productivity of the specialized personnel, the emotional status and the mood, detected through our set of tools and the model to populate the data. This data will be generated as a whole product, using our holistic approach, taking in account not only the biometric, audio, video and text data, but also the cyber-physical system information, with the overall status. We included the contrast of using different datasets to compare theoretical results with our experimental results [].
The authors of this article understand this whole system could be considered as intrusive and may appear not ethically suitable for some use cases. Data privacy principles of the GDPR, the General Data Protection Regulation (EU) 2016/679, are fairly straightforward. The law asks you to make a good faith effort to give people the means to control how their data is used and who has access to it. To facilitate this, we must behave transparently and openly provide them with the information they need to understand how their data is collected and used. In addition, we have to make it simple for our customers and users to exercise the various rights (of access, of erasure, etc.).
We learned from this process of decision making, using new ways of data capturing and a holistic view of complex systems. There is still a big effort to be made in this area, especially in fixing the context of the information and taking in account all the players involved in the productivity chain.
4. Conclusions
With this new set of tools, we have a clear idea of the issues and matters that can affect to the workforce while doing their job at their workplace. We have new assets for supervising employees or to determine root cause in several disaster scenarios. We will monitor the personnel, the systems, and both of them with the related context.
Future directions of this course of action could be any system that implies human individuals, managing infrastructures and technology, like Smart Cities, where we want to have both the psychological information and the sensor data context in a broad environment. The infrastructure is subject to infinite evolutions or improvements, such as the inclusion of better biometric data of people or the detection of anomalies. For reaching this goal we will be using supervised and unsupervised algorithms that can improve and complete our system.
One of the possible evolutions of this kind of cyber-systems is the automated or assisted cars industry. Most road accidents occurred due to human error. Advanced driver-assistance systems (ADAS) are systems developed to automate, adapt and enhance vehicle systems for safety and better driving. The automated system which is provided by ADAS to the vehicle is proven to reduce road fatalities, by minimizing human error. Safety features are designed to avoid collisions and accidents by offering technologies that alert the driver to potential problems, or to avoid collisions by implementing safeguards and taking over control of the vehicle. Adaptive features may automate lighting, provide adaptive cruise control and collision avoidance, pedestrian crash avoidance mitigation (PCAM), incorporate satnav/traffic warnings, connect to smartphones, alert driver to other cars or dangers, lane departure warning system, automatic lane centering, or show what is in blind spots. This is just an example of possible improvement. With this kind of aids, we will be able to reduce these fatalities and save the time we can use in improving the quality of life.
Author Contributions
Conceptualization, A.C.; Methodology, A.C. and J.M.M.; Software, A.C. and M.R.; validation, A.C. and J.M.M.; formal analysis, A.C. and M.R.; Investigation, A.C.; Resources, A.C. and M.R.; Data curation, A.C. and M.R.; writing—original draft preparation, A.C. and M.R.; writing—review and editing, A.C. and J.M.M.; Visualization, A.C.; Supervision, J.M.M.
Funding
This research received no external funding.
Acknowledgments
Special Thanks to ERIS INNOVATION (www.erisinnovation.com) for its administrative and technical support, and the materials used for the experiments.
Conflicts of Interest
The authors declare no conflict of interest to publish the results.
References
- Leplat, J. Human Error, Human Reliability in the Work; Armand Colin: Paris, France, 1985. [Google Scholar]
- Casey, S. Set Phasers on Stun: And Other True Tales of Design, Technology, and Human Error; Aegean: Santa Barbara, CA, USA, 1993. [Google Scholar]
- Oster, C.V.; Strong, J.S.; Zorn, C.K. Why Airplanes Crash: Aviation Safety in a Changing World; Oxford University Press: New York, NY, USA, 1992. [Google Scholar]
- Reason, J.; Maddox, M. Chapter 14: Human Error. In Human Factors Guide for Aviation Maintenance; Maddox, M., Ed.; Federal Aviation Administration: Washington, DC, USA, 1998. [Google Scholar]
- Fajardo Rodríguez, H.A. Error Humano: Medicina y Aviación. Revista de la Facultad de Medicina 2007, 55, 278–281. [Google Scholar]
- Institute of Medicine (US) Committee on Quality of Health Care in America; Kohn, L.T.; Corrigan, J.M.; Donaldson, M.S. To Err Is Human: Building a Safer Health System; National Academies Press (US): Washington, DC, USA, 2000. [Google Scholar]
- Foradori, A.C. El Error en medicina, la Tormenta Perfecta. Revista Chilena de Pediatría 2006, 77, 337–340. [Google Scholar] [CrossRef]
- Alkhaldi, M.; Pathirage, C.; Kulatunga, U. The role of human error in accidents within oil and gas industry in Bahrain. In Proceedings of the 13th International Postgraduate Research Conference, University of Salford, Manchester, UK, 14–15 September 2017. [Google Scholar]
- National Safety Council. The Cost of Human Errors. Impact of U.S. Injury-Related Workplace Accidents, 1999. 2000. Available online: http://www.pmifit.com/costofhuman.htm (accessed on 1 August 2019).
- Liu, L.; Guo, C. Research on the Improvement of Human Error in the Process of Production Operation. 2016. Available online: https://ieeexplore.ieee.org/stamp/stamp.jsp?tp=&arnumber=7854481 (accessed on 5 August 2019).
- Gilbreth, F. Scientific Management in the operating room. Qual. Saf. Health Care 2009, 18, 413–415. [Google Scholar]
- Pham, H. Reliability Modeling, Analysis and Optimization; World Scientific: Singapore, 2011. [Google Scholar]
- Lan, L.; Lian, Z.; Pan, L. The effects of air temperature on office workers’ well-being, workload and productivity-evaluated with subjective ratings. Appl. Ergon. 2010, 42, 29–36. [Google Scholar] [CrossRef] [PubMed]
- Wang, X.; Li, D.; Menassa, C.C.; Kamat, V.R. Investigating the effect of indoor thermal environment on occupants’ mentalworkload and task performance using electroencephalogram. Build. Environ. 2019, 158, 120–132. [Google Scholar] [CrossRef]
- Münsterberg, H. Psychology and Industrial Efficiency; Houghton, Mifflin and Company: Boston, MA, USA, 1913. [Google Scholar]
- McKinsey Global Institute. A Future That Works: Automation, Employment, and Productivity; McKinsey & Company: New York, NY, USA, 2017. [Google Scholar]
- Rusell, J. A description of the Affective Quality Attributed to Environment. J. Person. Soc. Psychol. 1980, 38, 311–322. [Google Scholar] [CrossRef]
- Lerner, J.S. Emotion and Decision Making. Annu. Rev. Psychol. 2015, 66, 799–823. [Google Scholar] [CrossRef] [PubMed]
- Damasio, A.R. Descartes’ Error: Emotion, Reason, and the Human Brain; Putnam: New York, NY, USA, 1994. [Google Scholar]
- Lerner, J.S.; Keltner, D. Beyond valence: Toward a model of emotion-specific influences on juggement and choice. Cogn. Emot. 2000, 14, 473–493. [Google Scholar] [CrossRef]
- Lerner, J.S.; Keltner, D. Fear, Anger and Risk. J. Person. Soc. Psycol. 2001, 81, 146–159. [Google Scholar] [CrossRef]
- Han, S. Feelings and Customer Decision Making: The Appraisal-Tendency Framework. J. Consum. Technol. 2017, 17, 158–168. [Google Scholar]
- Ponemon Institute. Cost of Data Center Outages. Ponemon Institute Research Report. 2016. Available online: https://www.ponemon.org/blog/2016-cost-of-data-center-outages (accessed on 6 August 2019).
- European Comission. NTP 503: Confort acústico: El ruido en oficinas. (2002/49/EC); Environmental Noise Directive: Brussels, Belgium, 2002. [Google Scholar]
- Dejoy, D.M. A behavioral-diagnostic model for self-protective behavior in the workplace. Prof. Saf. 1986, 31, 26–30. [Google Scholar]
- Dejoy, D.M. Toward a comprehensive human factors model of workplace accident causation. Prof. Saf. 1990, 35, 11–16. [Google Scholar]
- Kanade, T.; Cohn, J.F.; Tian, Y. Comprehensive database for facial expression analysis. In Proceedings of the Fourth IEEE International Conference on Automatic Face and Gesture Recognition (FG’00), Grenoble, France, 28–30 March 2000; pp. 46–53. [Google Scholar]
- Lucey, P.; Cohn, J.F.; Kanade, T.; Saragih, J.; Ambadar, Z.; Matthews, I. The Extended Cohn-Kanade Dataset (CK+): A complete expression dataset for action unit and emotion-specified expression. In Proceedings of the Third International Workshop on CVPR for Human Communicative Behavior Analysis (CVPR4HB 2010), San Francisco, CA, USA, 13–18 June 2010; pp. 94–101. [Google Scholar]
- Corredera, A.; Romero, M.; Moya, J.M. Affective computing for smart operation: A survey and comparative analysis of the available tools, libraries and web services. Int. J. Innov. Appl. Res. 2017, 5, 12–35. [Google Scholar]
- Hersey, R.B. Workers’ Emotions in Shop and Home: A Study of Individual Workers from the Psychological and Physiological Standpoint. Econ. J. 1933, 43, 136–139. [Google Scholar]
- Arakawa, D.; Greenberg, M. Optimistic managers and their influence on productivity and employee engagement in a technology organization: Implications for coaching psychologists. Int. Coach. Psychol. Rev. 2007, 2, 78–88. [Google Scholar]
- Wrobel, M.R. Emotions in the software development process. In Proceedings of the 2013 6th International Conference on Human System Interactions (HSI), Sopot, Poland, 6–8 June 2013. [Google Scholar]
- Corredera, A.; Romero, M.; Moya, J.M. Emotional Decision-Making Biases Prediction in Cyber-Physical Systems, Big Data and Cognitive Computing. Big Data Cogn. Comput. 2019, 3, 49. [Google Scholar] [CrossRef]
© 2019 by the authors. Licensee MDPI, Basel, Switzerland. This article is an open access article distributed under the terms and conditions of the Creative Commons Attribution (CC BY) license (http://creativecommons.org/licenses/by/4.0/).