Article

The Impact-Tensile Behavior of Cementitious Composites Reinforced with Carbon Textile and Short Polymer Fibers

Institute of Construction Materials, Technische Universität Dresden, 01187 Dresden, Germany
*
Author to whom correspondence should be addressed.
Appl. Sci. 2019, 9(19), 4048; https://doi.org/10.3390/app9194048
Submission received: 19 August 2019 / Revised: 9 September 2019 / Accepted: 24 September 2019 / Published: 27 September 2019

Abstract

:
The paper at hand focuses on the tensile behavior of ductile cementitious composites reinforced with short, randomly distributed, polymer fibers and a continuous carbon textile under quasi-static and impact loading. Strain-hardening cement-based composites (SHCCs) made of high strength fine-grained matrix with the addition of a 2% volume fraction of 6 mm-long ultra-high molecular weight polyethylene (UHMWPE) fibers and as-spun poly(p-phenylene-2,6-benzobisoxazole) (PBO-AS) fibers, respectively, were reinforced with one layer of carbon textile, which corresponds to a 0.68% volume fraction. The same fine-grained matrix reinforced with carbon textile only served as the reference material. The synergetic action of the two reinforcement types was investigated in uniaxial tension tests on composite specimens, as well as by means of single-yarn pullout tests at displacement rates of 0.05 mm/s in a hydraulic testing machine, and 8 m/s in a tensile split Hopkinson bar. The specimen’s deformations, the formation of cracks, and the fracture processes were monitored optically and subsequently evaluated using digital image correlation (DIC).

1. Introduction

Textile reinforced concrete (TRC) describes high-performance, cementitious composites containing two or three-dimensional fabrics made of carbon or alkali-resistant glass [1,2,3]. Their quasi-static tensile behavior is marked by an extensive strain-hardening phase, during which multiple controlled cracking develops in the fine-grained concrete matrix. TRC’s high tensile ductility, strength, and stiffness enable their applications as thin retrofit layers on damaged structures and for strengthening existing structures that may deal with highly dynamic loading scenarios. However, the relatively coarse mesh size of the textile reinforcement does not allow for a sufficient in-plane and out-of-plane confinement of the surrounding mortar under high-speed loading, which can lead to a pronounced spalling/scabbing of the cementitious cover and a considerable degradation of the functionality of the strengthening layer. To eliminate this drawback, one can reinforce the cementitious matrix additionally, with short fibers. In particular, the use of ductile fiber-reinforced composites as matrix material promises to be highly instrumental for this purpose.
Strain-hardening cement-based composites (SHCCs) consist of fine-grained cementitious matrices and short, randomly distributed micro-fibers in volume fractions of up to 2%. They provide a suitable solution in respect to the desired increase in impact resistance of the strengthening layers, since SHCCs are characterized by a high inelastic deformability as a result of the successive formation of multiple, fine cracks under increasing tensile loading [4,5,6]. Their deformation behavior is expected to be well compatible with that of the textile reinforcement. In strengthening and retrofitting applications against dynamic loading scenarios, such as impact or blast, the textile reinforcement should offer a secure confinement of the strengthened reinforced concrete core (substrate) and ensure a favorable stress distribution, while the ductile SHCC’s matrix should yield a better crack control, along with higher energy dissipation and damage tolerance.
The typical load-displacement behavior of carbon textile and textile reinforced cementitious composites is shown in Figure 1. The deformation span in which multiple cracking occurs is generally considerably smaller than the elongation at which the textile yarns fail. The addition of short fibers can enhance the overall composite response by increasing matrix cracking stress and possibly the tensile strength of the composite also [7,8,9]. Furthermore, an extension of the cracking deformation span is expected, maybe even to yarn failure with better stress distribution and crack control [10]. For fully exploiting the positive synergy of the short and continuous fiber reinforcements, appropriate material design principles must be followed. Silva et al. [11] and Barhum et al. [12] reported a decrease in composite strain capacity due to the restriction of crack opening by the short glass fibers, while Hinzen et al. [7] found that the strain capacity of the composite can be increased by adding a combination of short glass and Aramid fibers.
For impact tensile loading, the strain rate’s effect on the tensile behavior of hybrid reinforced composite largely depends on the material composition [11,13], which can be attributed to three mechanisms; namely, the strain rate’s effects on (1) the cracking behavior of plain matrix; (2) the performance of fiber reinforcement, thus continuous carbon yarns and short polymer fibers; and (3) the interfacial characteristics of fiber reinforcement with the surrounding matrix [14,15,16,17]. The increasing loading rates influence, not only the tensile strength of the matrix, but the crack bridging behavior of continuous short fibers. Shim et al. [18] observed an increase in the tensile strength and modulus of Aramid textile under impact tensile tests, but a decrease in the failure strain. Zhu et al. [19] found that both the tensile strength and strain capacity increased under higher loading rate in the case of Kevlar 49 single yarns. The bonding properties between the continuous carbon yarn and the surrounding matrix depend not only on the loading rate, but on the type of cementitious matrix and the presence of short fibers. Yang and Li [20] and Ranade et al. [17] emphasized the rate sensitivities of the chemical bond properties of short fibers, and the corresponding negative effect on the strain capacity of an SHCC at higher strain rates. Curosu et al. [21] found that the increasing strain rate leads to an increase in both the tensile strength and stiffness of short ultra-high molecular weight polyethylene (UHMWPE) fibers but a decrease in their elongation at failure. Furthermore, a pronounced increase in the frictional bond between short polymer fibers and matrix was observed at higher displacement rates [22].
The results reported in the paper at hand are part of a more extensive study, in which material design concepts for hybrid fiber-reinforced composites are developed based on multi-scale experimental and analytical investigations at low and high loading rates. In this paper, only the influence of loading rate on the composite tensile behavior was analyzed, focusing on the effect of short-fiber reinforcement and short-fiber type. The reference materials in the current work are two types of strain-hardening cementitious composites, reinforced with ultra-high molecular weight polyethylene (UHMWPE) and as-spun poly(p-phenylene-2,6-benzobisoxazole) (PBO-AS) fibers, respectively [22,23]. Given the different crack-bridging properties of the reinforcing fibers, these two SHCCs yield different pre-peak strain capacities, which is interesting concerning the cracking behavior and deformation compatibility short fiber-reinforced matrix with the carbon textile. Both types of SHCC, as well as their constitutive cementitious matrix, were reinforced with one layer of carbon textile with a longitudinal reinforcing ratio of 0.68%. Besides the experiments at the composite level, single-yarn pullout tests from plain and fiber-reinforced matrices were performed with the same materials. The composite and pullout specimens were tested by means of a universal testing machine at a displacement rate of 0.05 mm/s and in a gravitational split-Hopkinson tension bar at displacement rates of up to 8 m/s. Besides the quantitative evaluation of the material tensile behavior in terms of stress–strain curves, the digital image correlation (DIC) facilitated a detailed description of the cracking processes under loading and a better interpretation of the material response measured.

2. Materials under Investigation

2.1. Cementitious Matrix

The fine-grained cementitious matrix was specifically designed for high-strength SHCC, being made with short UHMWPE fibers (hereafter called PE in this paper) produced by DSM, the Netherlands, under the brand name Dyneema®. This SHCC was previously investigated by the authors under quasi-static and impact tensile loading, in combination with Aramid and PBO fibers [22,23]. The matrix has a high content of cement, and has silica fume as the additional binder; see Table 1.
The low water-to-binder ratio of 0.18 contributes to the high strength and density of the matrix, which was necessary for ensuring the proper anchorage of the hydrophobic PE micro-fibers. Only a small portion of very fine sand was used, with the maximum aggregate size of 0.2 mm, since the nature and geometry of the polymer micro-fibers and the necessity for a uniform fiber distribution in the matrix imposed limitations regarding the content and size of aggregates. Furthermore, this choice was dictated by the micromechanical conditions for tensile strain-hardening and multiple cracking in SHCC, which required a low fracture toughness of the matrix [24].

2.2. Short Micro-Fibers

Two types of short micro-fibers were investigated in this research, including the PE fibers and as-spun poly (p-phenylene-2,6-benzobisoxazole) (PBO-AS) fibers. The fibers possess high tensile strength and high moduli of elasticity. Table 2 presents their physical, geometrical, and mechanical properties. The short polymer fibers had a length of 6 mm and nominal diameters were 20 μm for PE and 13 µm for PBO-AS, respectively. The choice of relatively small length of fibers was based on the consideration of fresh SHCC workability and the dimensions of the textile mesh, as presented in the next section. Comparing them to the highly hydrophobic nature of PE fibers, PBO fibers exhibit a weak hydrophilic behavior and a subsequently higher bonding strength with the surrounding matrix. These two types of fibers present different levels of tensile strength, elasticity moduli, and bonding properties, which contribute to a better comparison of composite behaviors based on the additions of different short fibers.

2.3. Carbon Textile Reinforcement

TUDALIT-BZT2 produced by V.FRAAS, Germany, was used as textile reinforcement. The spacings between warp yarns (parallel to loading direction) and weft yarns were 12.7 mm and 16.0 mm, respectively; see Figure 2. Knitted filaments connected the warp and weft yarns to form a stable structure without a rigid connection. The physical and mechanical properties of the textile yarns are given in Table 3.
In the current paper, the combination between TUDALIT-BZT2-V.FRAAS textile and the high-strength matrix presented in Section 2.1, but without short fiber, will be named TRC-M. This composite was additionally tested in order to better understand the role of short fiber reinforcement in the case of hybrid reinforcement. The combinations of textile and two SHCC compositions will be named TRC-PE and TRC-PBO, respectively.

3. Experimental Program

3.1. Specimens

Plates with dimensions of 260 mm × 90 mm × 20 mm were cast in a specially fabricated mold, which enabled us to fix the position of the textile in the middle of the plate’s thickness, as shown in Figure 3a. The plates were produced using the lamination technique. The first layer of plain matrix or SHCC was cast in the mold before the placement of textile reinforcement. Subsequently, the textile mesh was gently pressed into the matrix/SHCC so that the latter could penetrate through the textile mesh. The ends of the textile yarns were clamped by the mold to ensure a fixed position in the middle. The second layer of the matrix was then cast on top, followed by leveling and smoothening. Note that under consideration of the typical anchorage issues related to carbon textiles, the ends of the textile yarns were protruding outside of the mold in order to enable their stronger anchorage by gluing them at the specimens’ ends in the adapters; see Figure 3a. The specimens were demolded at the age of 24 hours, sealed in plastic sheets and subsequently cured for 27 days in a climatic chamber with a constant temperature of 20 °C and relative humidity of 65%.
Prior to testing, the plates were cut into smaller specimens with dimensions of 90 mm × 40 mm × 20 mm, containing three warp yarns in the loading, i.e., longitudinal direction. The length of the middle gauge was 50 mm, and it covered four weft yarns. All specimens were reinforced with only one layer of textile, hence a longitudinal reinforcement ratio of 0.68% calculated based on the effective cross-sectional area of 1.8 mm2 for one warp yarn. It should be noted that usually the TRC tensile specimens have a relatively large length in order to ensure a proper textile anchorage at the specimen ends and attain yarn rupture instead of yarn pullout. However, in dynamic tension experiments, such as in the split Hopkinson bars, the length of the specimens is limited by the condition of dynamic stress equilibrium. For this reason, a length of 90 mm was adopted for the composite specimens in this investigation. To avoid premature yarn pullout after the initial cracking, the longitudinal textile yarns had protruding ends at both ends of the specimens, which were bent over the specimens’ ends and glued within the adapters by bi-component epoxy resin; see Figure 3b. The adapters were made of steel for quasi-static tension tests and aluminum for impact tension tests. In the last step, the middle, gauge portions of the specimens were sprayed to create a random black and white pattern needed for digital image correlation (DIC). All the tests were performed on the 28th day after casting.
As for single-yarn pullout tests, the initial plates were cut into smaller specimens, as shown in Figure 4. The 30 mm-long specimens contained two transversal weft yarns and one longitudinal warp yarn. The 30 mm-long protruding ends of the warp yarns were glued inside aluminum cylinders with a bi-component epoxy resin. Identical specimens were tested quasi-statically and dynamically.

3.2. Setups for Quasi-Static Tension and Single-Yarn Pullout Tests

The specimens were first glued to steel adapters and subsequently clamped rigidly in the machine with the help of steel rods; see Figure 5a. The quasi-static uniaxial tension tests were performed in an Instron 8501 hydraulic testing machine under a controlled displacement rate of 0.05 mm/s. The deformations of the gauge portion were measured by two linear variable differential transducers (LVDTs) connected to the adapters on both sides of the specimens. Additionally, the deformations, formation of cracks, and fracture processes were monitored optically, and subsequently evaluated using digital image correlation (DIC). Images with a resolution of 3456 × 5184 pixels were taken with a Canon E05 700D camera at intervals of 5 seconds. The DIC evaluation was performed using the Aramis software by GOM GmbH.
The quasi-static single-yarn pullout tests were performed in a Zwick Roell 1445 testing machine at a displacement rate of 0.05 mm/s. The specimens were glued at their ends inside two aluminum rings, which were fixed in the machine, as shown in Figure 5b. LVDTs were fixed at both sides of the rings to capture the slip of yarns.

3.3. Setups for the Impact Tension Test and Single-Yarn Pullout Test

As shown in Figure 6, a gravitational split Hopkinson tension bar (SHTB) was used for both impact tension tests and single-yarn pullout tests [28]. The peak displacement rate in the tests was 8 m/s, which was reached by dropping a 30 kg striker from a height of 1 m. Both the input and output bars were made of brass in the case of impact tension tests and were aluminum for single-yarn pullout tests. The reason for these choices was to match the impedance of bars with adapters used in the two types of test to minimize the wave distortion by adapters.
In the impact tension experiments, the dimensions of the specimens are imposed by the requirement of uniform stress along the sample; i.e., dynamic stress equilibrium. In this study, the length of the specimens was adopted based on preliminary tests on 50 mm-long SHCC specimens of cylindrical geometry, which were directly glued to the input and transmitter bars. However, the composites reinforced with fabric impose a plate-like geometry. The rectangular cross-section had a width larger than the diameter of the input and output bars, making necessary the usage of adapters between specimen and bars. The shape of the adapters was designed to target the reduction of any adverse effects on wave propagation due to impedance mismatch. After a series of calibration tests, it was found that the transmitted wave represents, reliably, the stress history in the sample. Therefore, the reaction forces were calculated based on the waves measured on the transmitter bar using three strain gauges glued axis-symmetrically around the bar. To ensure a higher accuracy of the results, the deformation of the samples was measured by an optical extensometer. A high-speed stereo camera system was used to monitor the crack formation in the loaded samples with a sampling rate of 50,000 frames per second.
In the single-yarn pullout tests, the pullout force was calculated based on the measurements on the transmitter bar. The slip was calculated based on the relative displacement of the two bars according to one-dimensional wave analysis and optically with the help of DIC. An aluminum cylinder was used to connect the carbon yarn with the aluminum input bar to ensure identical impedance with the bar. In this way, the speed at the endpoint of the input bar could be regarded as the real pullout speed of the carbon yarn. SIRIUS® HS-STG+ systems produced by DEWEsoft® were used for data acquisition with a sampling rate of 1 million per second, and a filter of 40 kHz was adopted to reduce the electrical noise while avoiding possible phase shift in the signal.

4. Results and Discussion

4.1. Results of Quasi-Static Tests

4.1.1. Uniaxial Tension Tests on Plate-Like Composite Specimens

The small specimen length and the insufficient yarn anchorage resulted in undesirable failure modes of the plate-like composite specimens. As mentioned in the previous sections, the carbon yarns were longer than the specimens and the protruding ends were bent over the specimens’ edges and glued between the specimens and the adapters. Due to the relatively weak bond strength between the carbon yarns and the surrounding matrix, and because of the small specimen length, the failure of the yarns occurred in the bent-over segments in the adapters. Such a failure was mostly facilitated by the poor transversal properties of the carbon fibers and the resulting damage induced during bending. Thus, in this configuration, the strength of the carbon textile reinforcement cannot be fully exploited and the specimens fail under considerably lower loads compared to long specimens with a proper textile anchorage [2,8,11]. Nevertheless, despite these limitations, the comparative study offers an insight into the influence of the short fiber reinforcement on the composite behavior and addresses further improvements in terms of composite design and testing configuration.
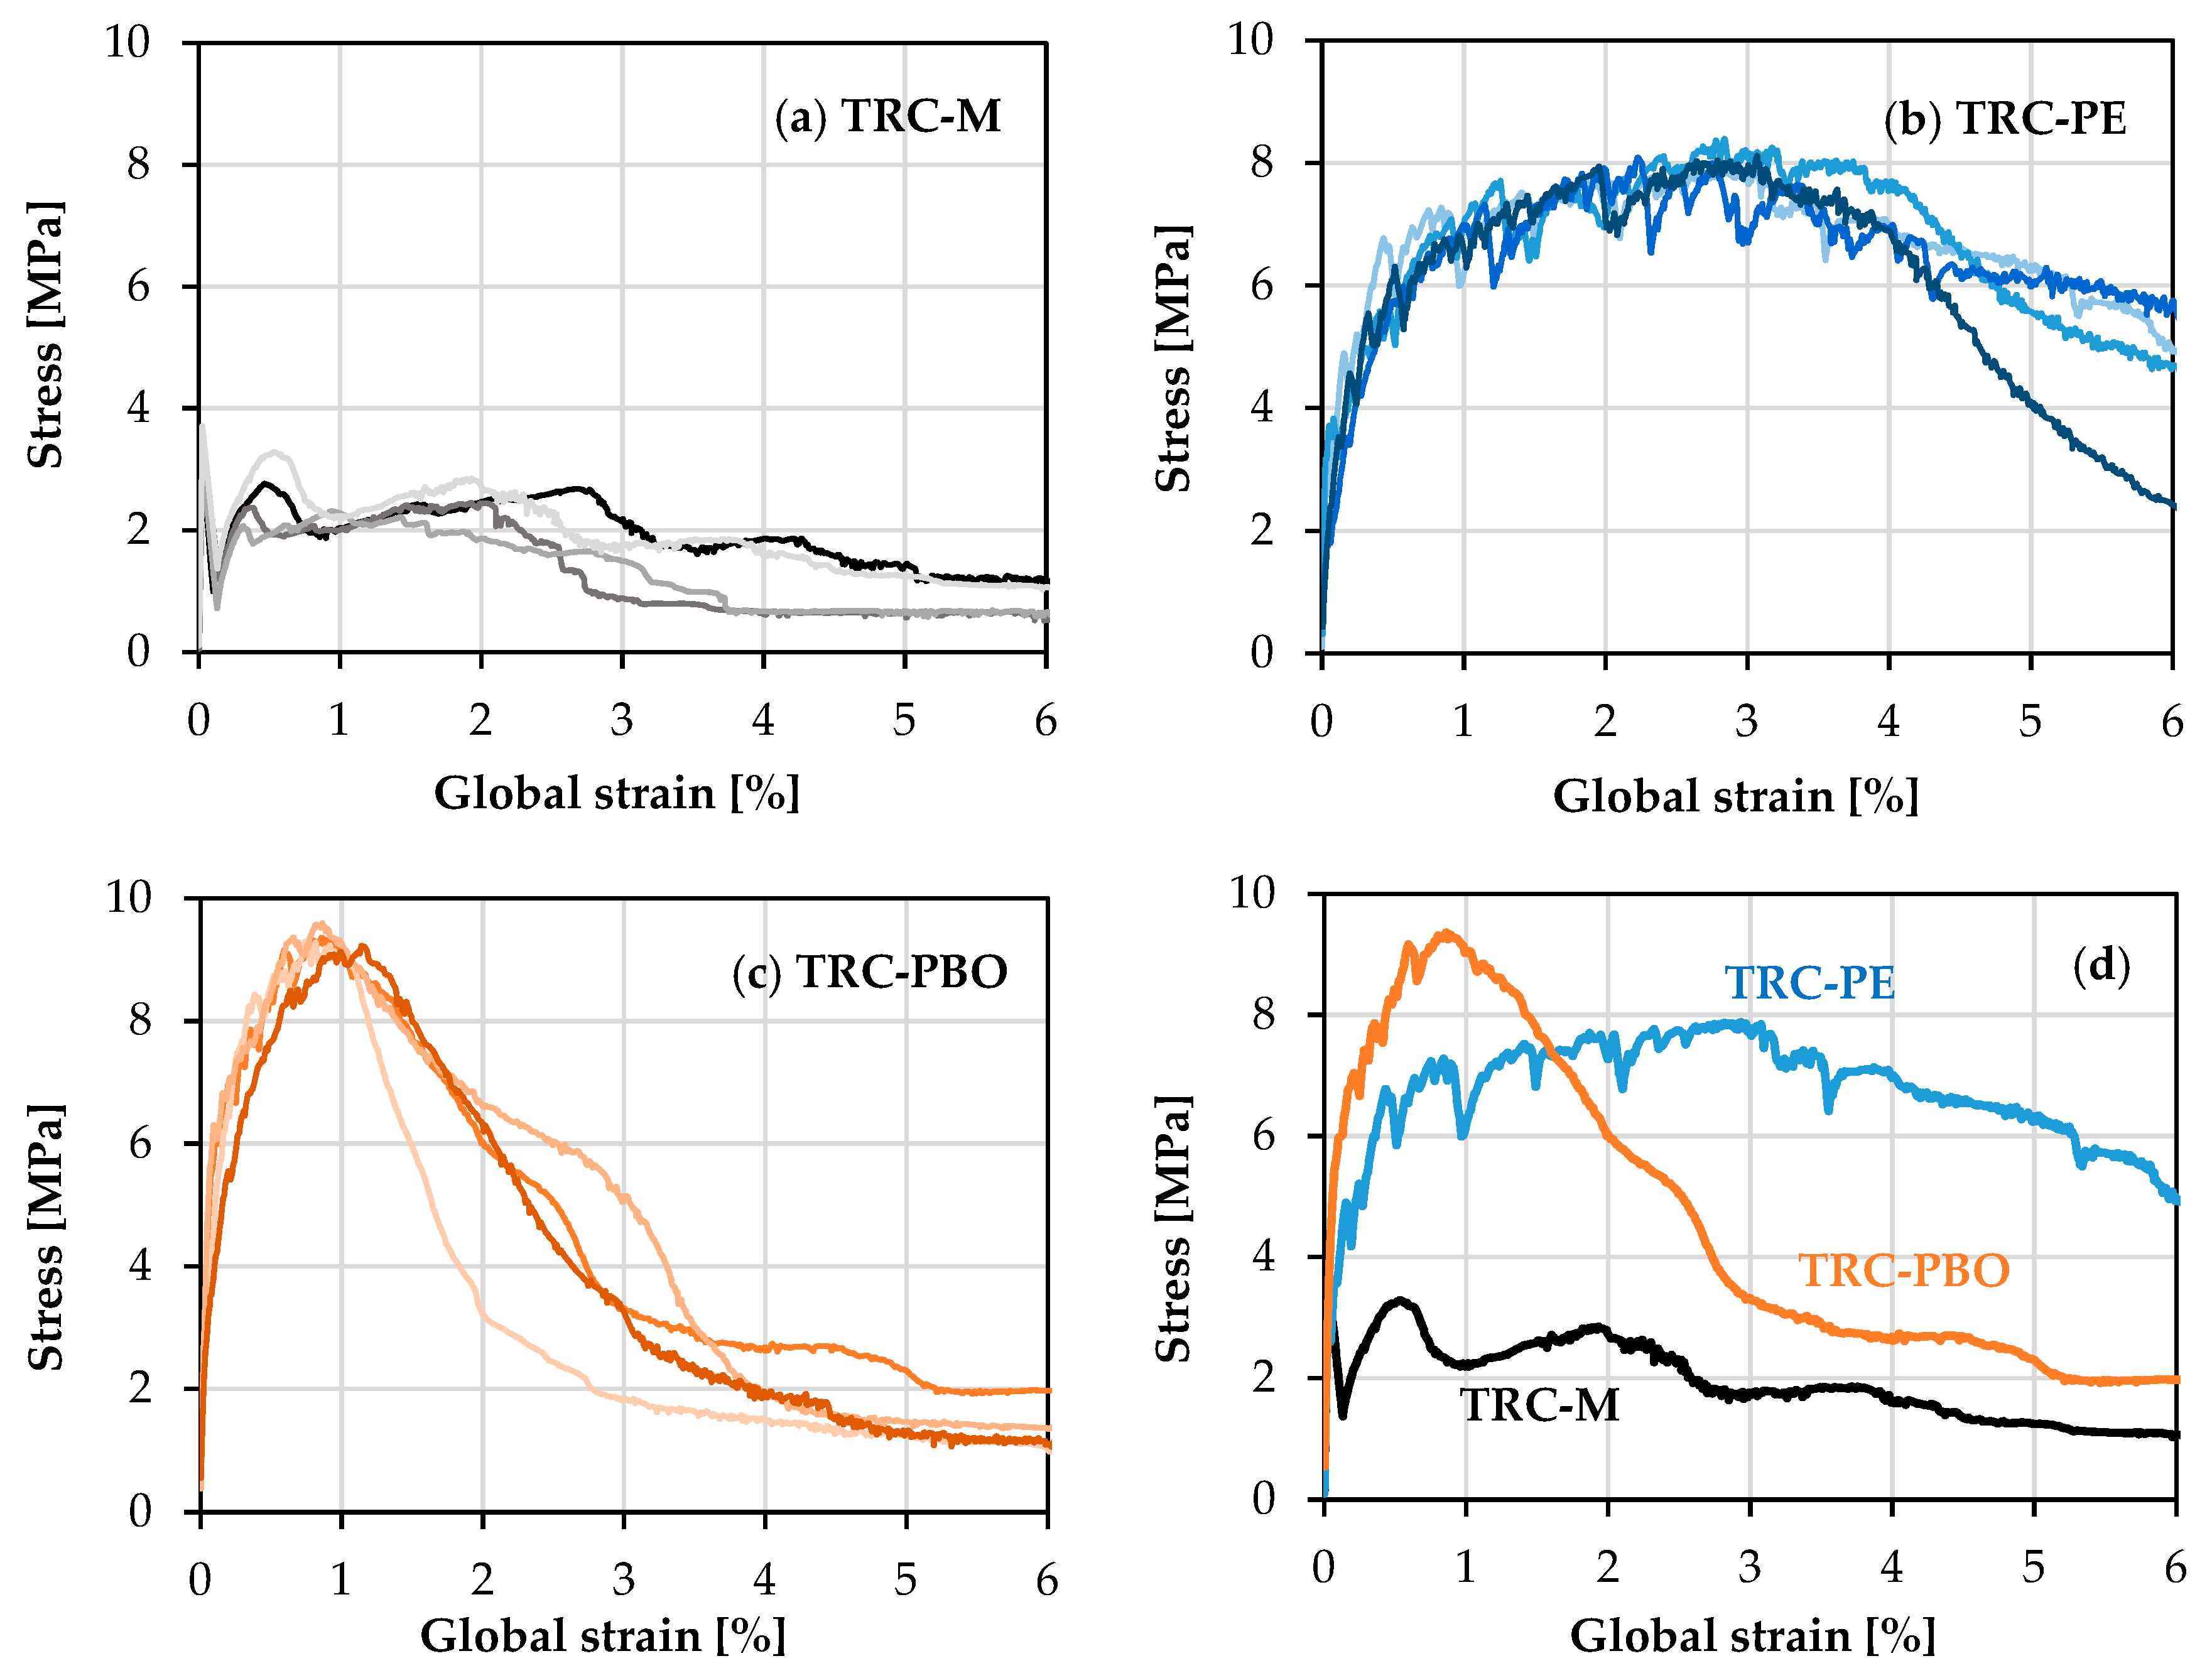
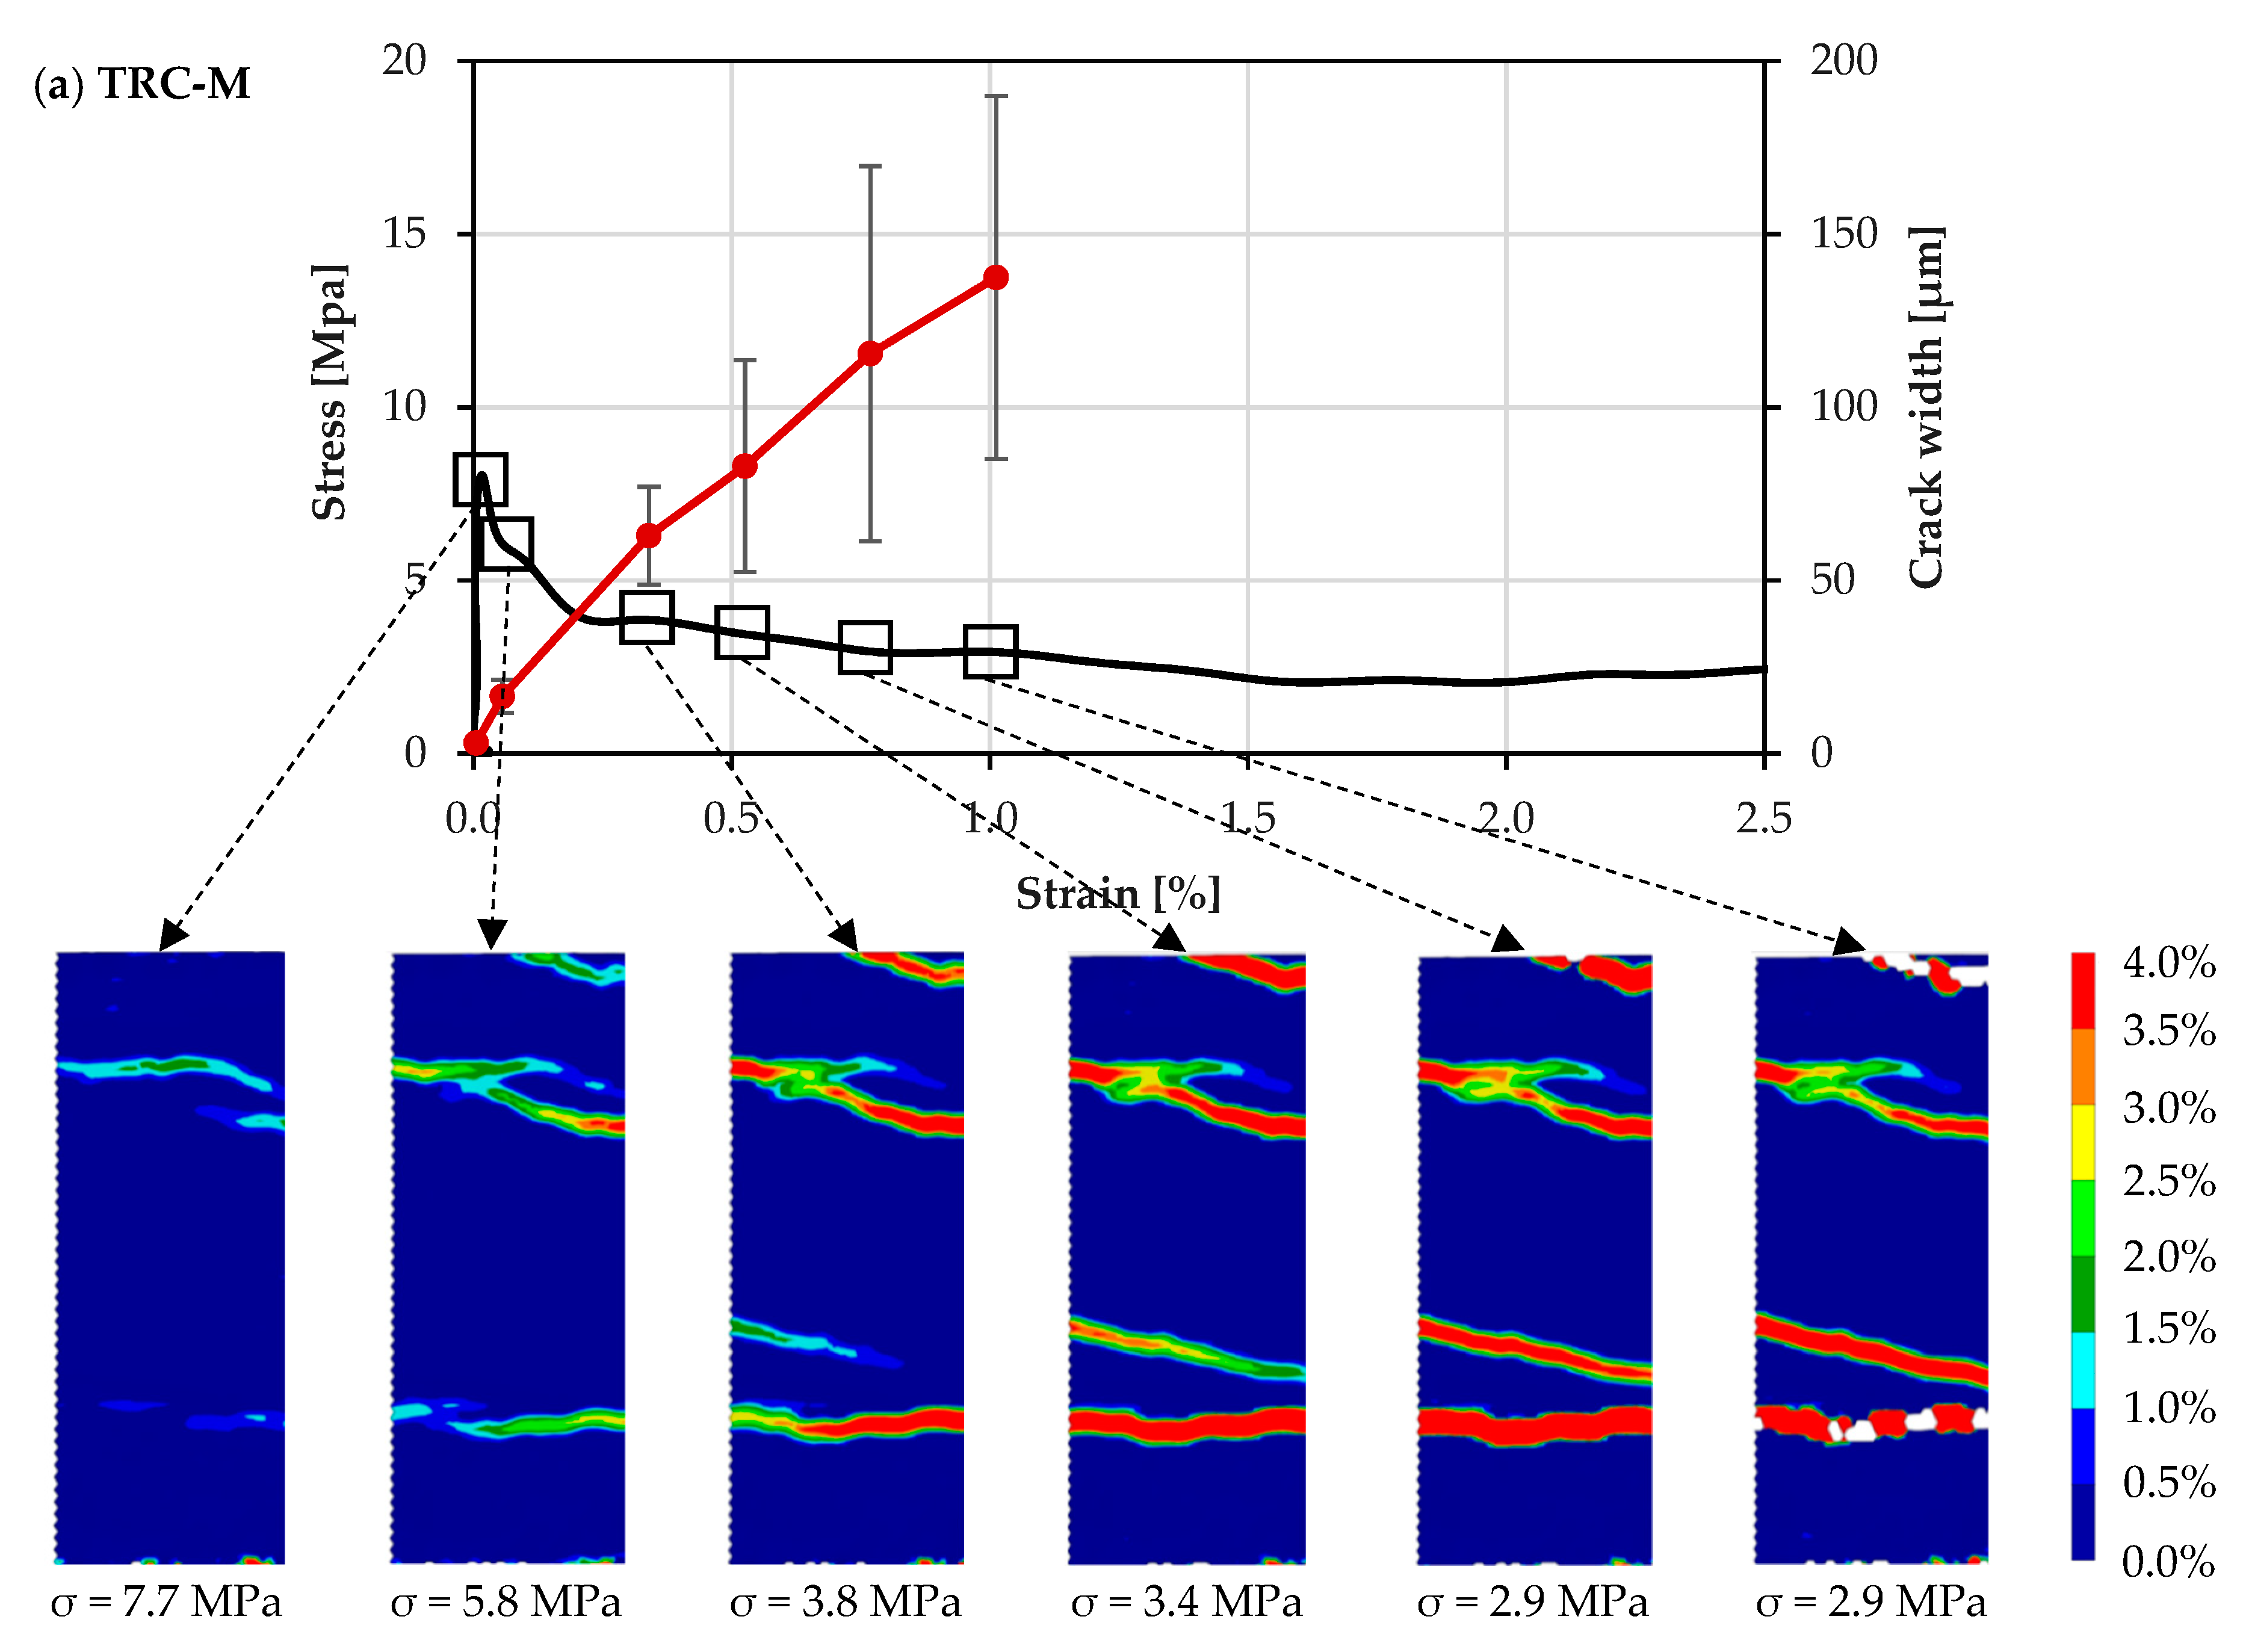
The uniaxial quasi-static tensile stress–strain curves are plotted in Figure 7. The comparison of the representative curves indicates the contributions of SHCCs to the total response of the composite in the yarn pullout stage.
It should be noted that the specimens had already exhibited a few minor cracks prior to loading due to the forced mechanical clamping, which makes it challenging to define the accurate value of the first crack stress. However, the results of different materials are still comparable under the same testing conditions. Hence the results of the first crack stress, peak tensile stress, ultimate global strain, and the work-to-fracture of the tested specimens under uniaxial quasi-static tension tests are given in Table 4. The tensile strength of the composites was obtained by dividing the peak load by the composite cross-section. The global strains were calculated as specimen deformation over their gauge length; the ultimate value (strain capacity) corresponds to the peak load. Note that the global strain is a measure of the material deformability, and it is not associated with a uniform strain field in the specimens. It is rather representative of the extent of multiple cracking in the samples before peak loading. The post-peak behavior is associated with crack localization and widening accompanied by yarn pullout.
In the case of TRC-M without any discrete fiber reinforcement, the yarn failure and subsequent pullout are accompanied by the widening of the localization crack with no multiple cracking, yielding an average composite tensile strength of only 3.4 MPa, which is also the first crack stress; see 
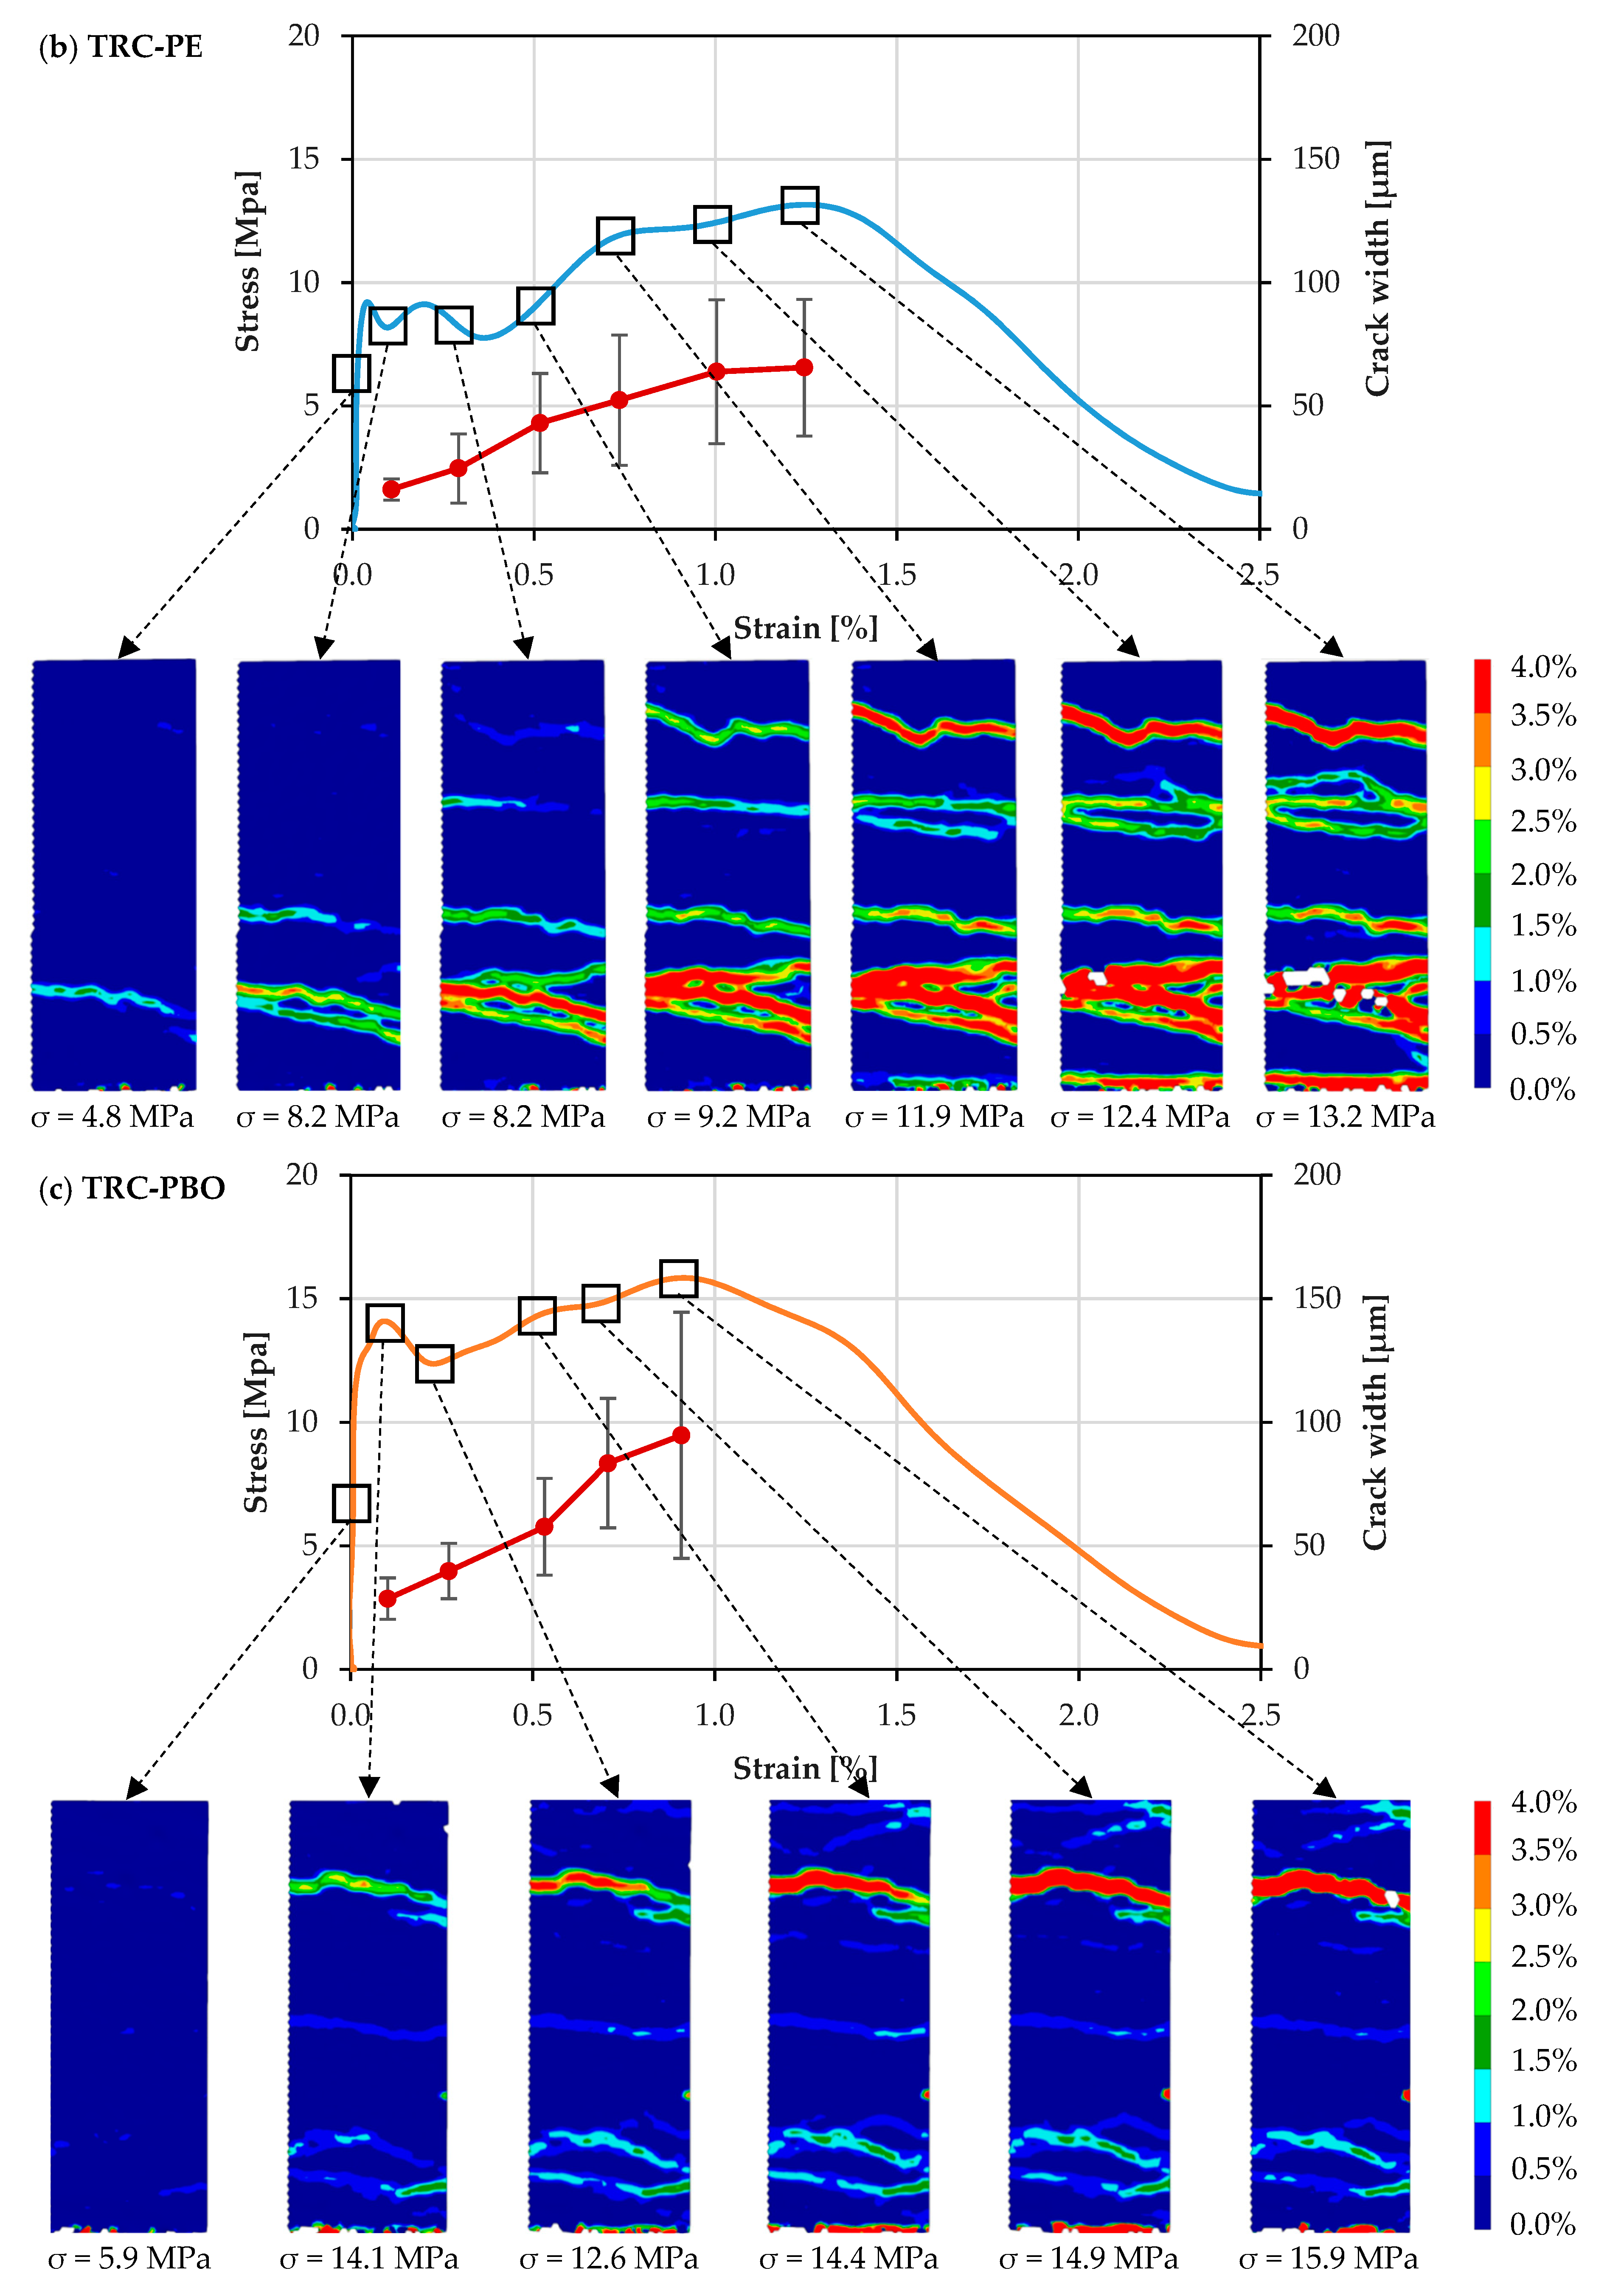
Figure 7a. On the contrary, the materials reinforced additionally with short micro-fibers, i.e., the ones with SHCC matrix TRC-PE or TRC-PBO, exhibit strain-hardening behavior. The tensile stress increases after the first crack accompanied by the formation of multiple cracks; see Figure 7b,c.
The relatively low first crack stress of TRC-PE (2.5 MPa) can be traced back to the relatively high porosity of the matrix, as well as to the highly hydrophobic nature of short PE fibers. Due to the purely frictional bond, the fibers are only activated after crack formation, while prior to that they act as micro-defects [23], leading to even lower first crack stress than that measured for TRC-M (3.4 MPa). The short PBO-AS fibers, in contrast, possess a weak hydrophilic character. The smaller diameter results in higher aspect ratio and larger amount of fibers in the case of the same volume fraction of 2%. The lower diameter, higher stiffness, and strength of the PBO-AS fibers, as well as their adequate bonding to cementitious matrix ensures efficient confinement of the matrix already, prior to cracking [23]. Furthermore, PBO-AS fibers enable better control of micro-cracks, hence enhancing the first crack stress of the composite. In addition to their weak hydrophilicity, the high Young’s modulus of PBO-AS fiber ensures narrow crack widths in TRC-PBO in comparison to those in TRC-PE. This influences both the strain at peak stress and the work-to-fracture of the corresponding composites. Work-to-fracture is the area under the stress–strain curves up to the peak load.
The potential of the material to develop multiple cracks and exhibit strain-hardening behavior can be characterized by the strain-hardening modulus; i.e., the ratio of tensile strength to first crack stress [17]. It can be observed that while TRC-PBO prevails in both first crack stress (4.6 MPa) and tensile strength (9.4 MPa), TRC-PE exhibits a higher strain-hardening modulus, with a first crack stress of 2.5 MPa and tensile strength of 8.1 MPa. Taking into consideration the strain capacity of 2.8% in the case of TRC-PE and 0.9% for TRC-PBO, it is not surprising that the TRC-PE yields a considerably higher work-to-fracture of 185.7 kJ/m3 when compared to 67.4 kJ/m3 in the case of TRC-PBO.
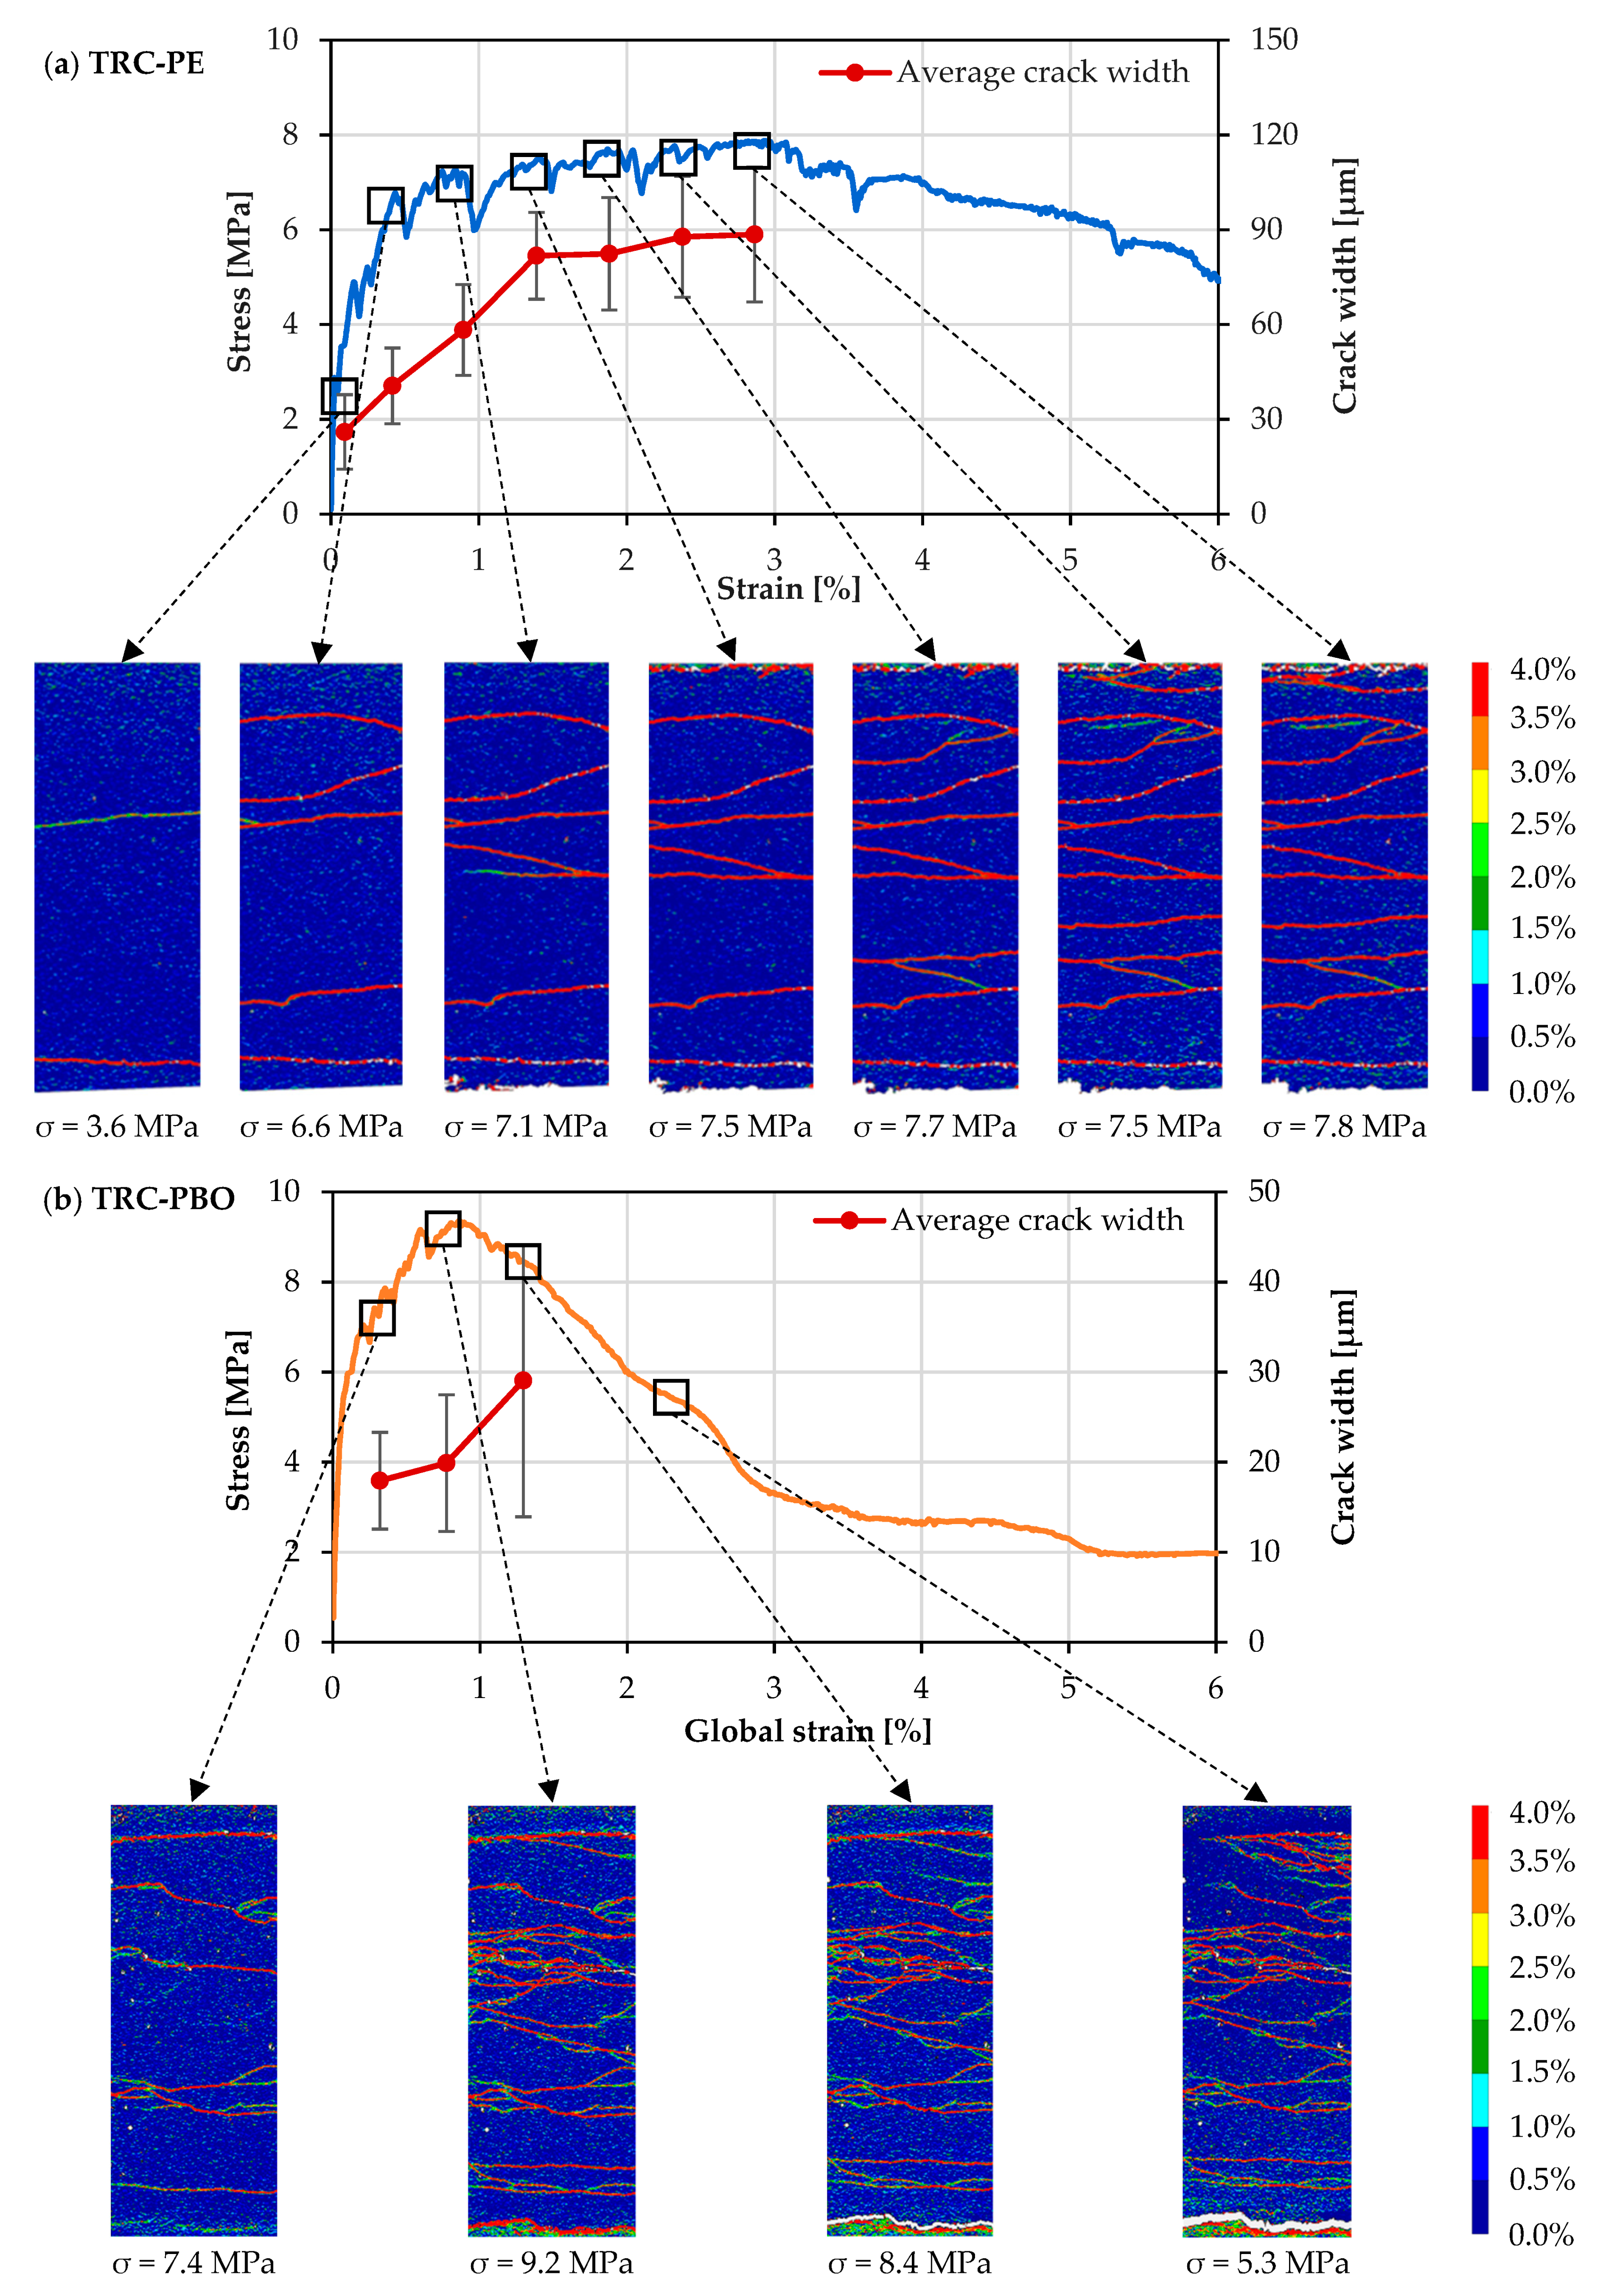
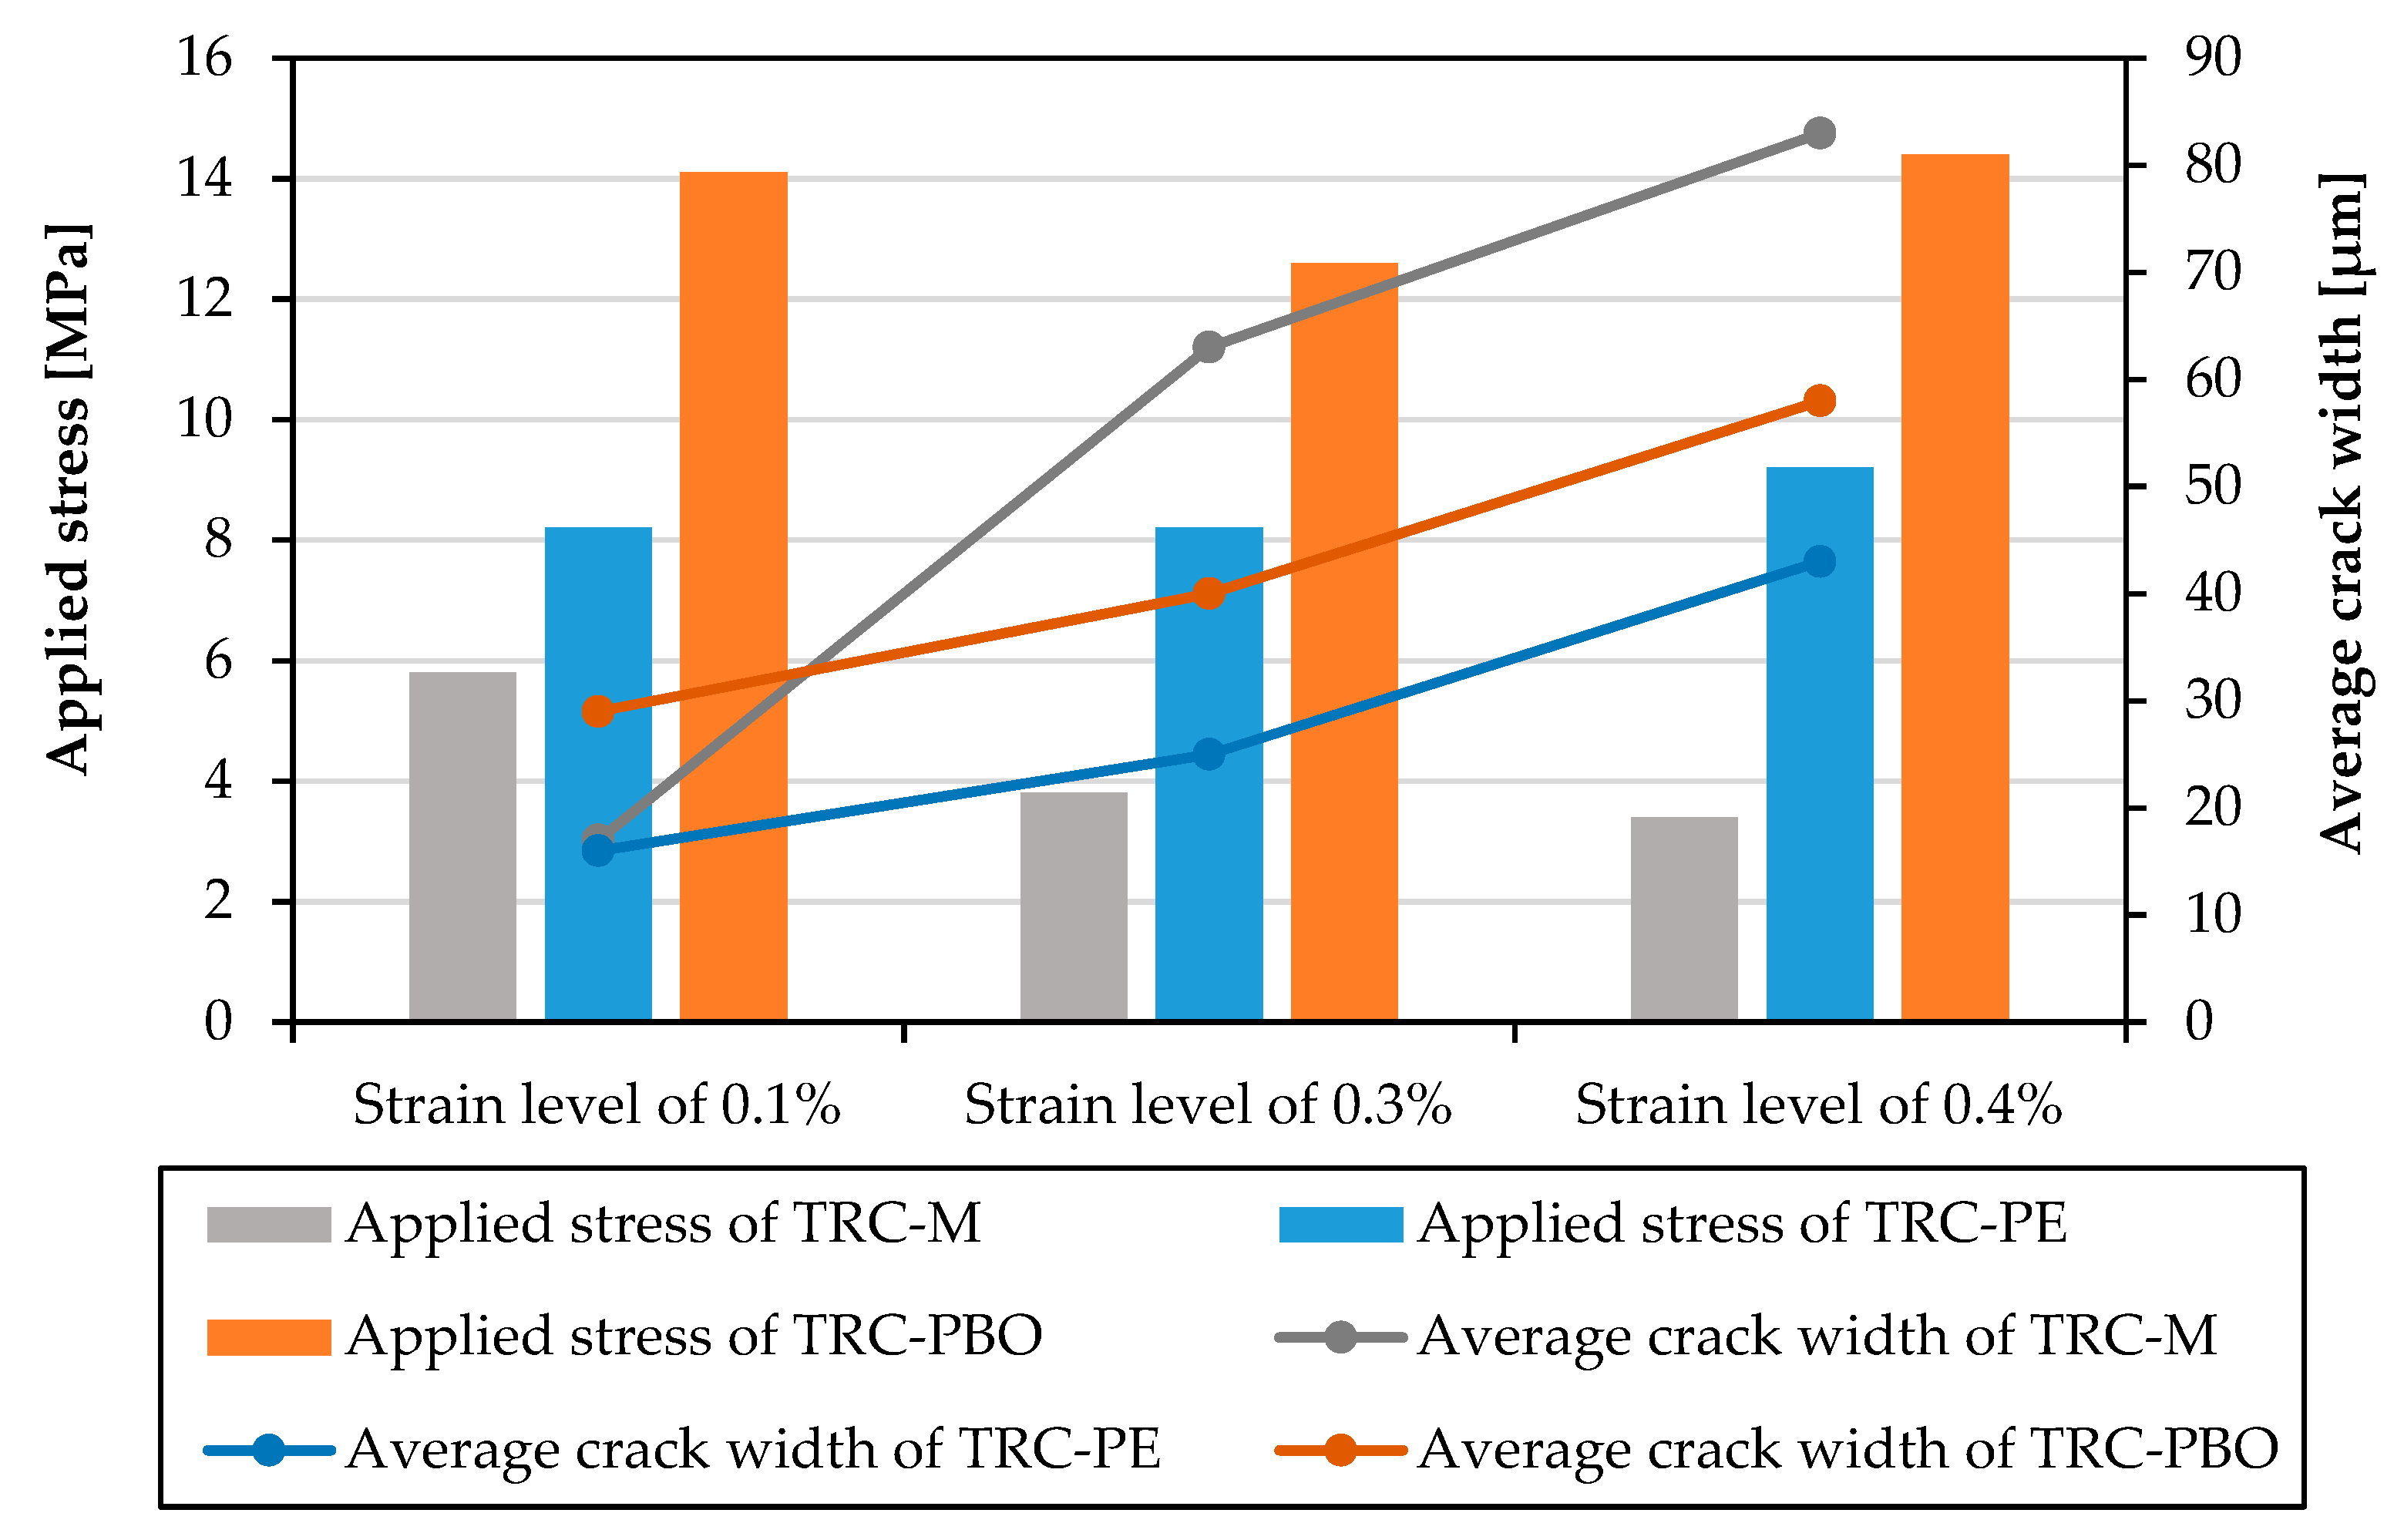
The ultimate strain capacity of the investigated composites is decided by both the average crack width and the average crack spacing, which is defined as the ratio of gauge length to the average number of cracks within the gauge length of the specimen. Figure 8 shows tensile stress–strain curves and corresponding average crack widths for representative specimens of TRC-PE and TRC-PBO. Due to the 5 second interval between individual image recordings, only a limited number of photos were taken during the tests. This explains the relatively low number of crack width measurement points in the case of TRC-PBO, as shown in Figure 8b.
Despite both materials showing multiple cracking, the crack patterns are very different. At the same strain level, TRC-PBO exhibits finer and denser cracks along the specimen. The average number of cracks of TRC-PE and TRC-PBO at peak stress are 12 and 16, resulting in the average crack spacings of 4 mm and 3 mm, respectively; see Table 5. Though TRC-PBO exhibits more cracks, the low average crack width of 29 μm at peak load leads to an overall smaller strain capacity when compared to TRC-PE, for which the average crack width is 88 μm. The relationships between crack density, crack width, and applied stress have been investigated in order to achieve a better understanding of the crack pattern [13,14,16,29]. It can be observed that, at a similar stress level, TRC-PBO shows better crack control.
Note that SHCC specimens were also investigated without textile reinforcement. The reference SHCC matrices show inferior mechanical properties compared to the hybrid fiber-reinforced composites presented in this section. Thus, despite the undesirable failure mode of the textile yarns, their contribution is still significant. At the material level, the proper composite tensile behavior of SHCC and textile can be only highlighted with the help of large specimens loaded quasi-statically. This is, however, the matter of a different study by the authors [10].
For a more comprehensive analysis of the textile contribution in the pre-peak and failure localization phases presented above, single-yarn pullout tests were performed, using the same plain matrix and SHCCs, both under quasi-static and impact loading. The results presented in the next section demonstrate the effects of the addition of short polymer fibers on the anchorages of the carbon yarns coated with styrene-butadiene.

4.1.2. Single-Yarn Pullout Tests

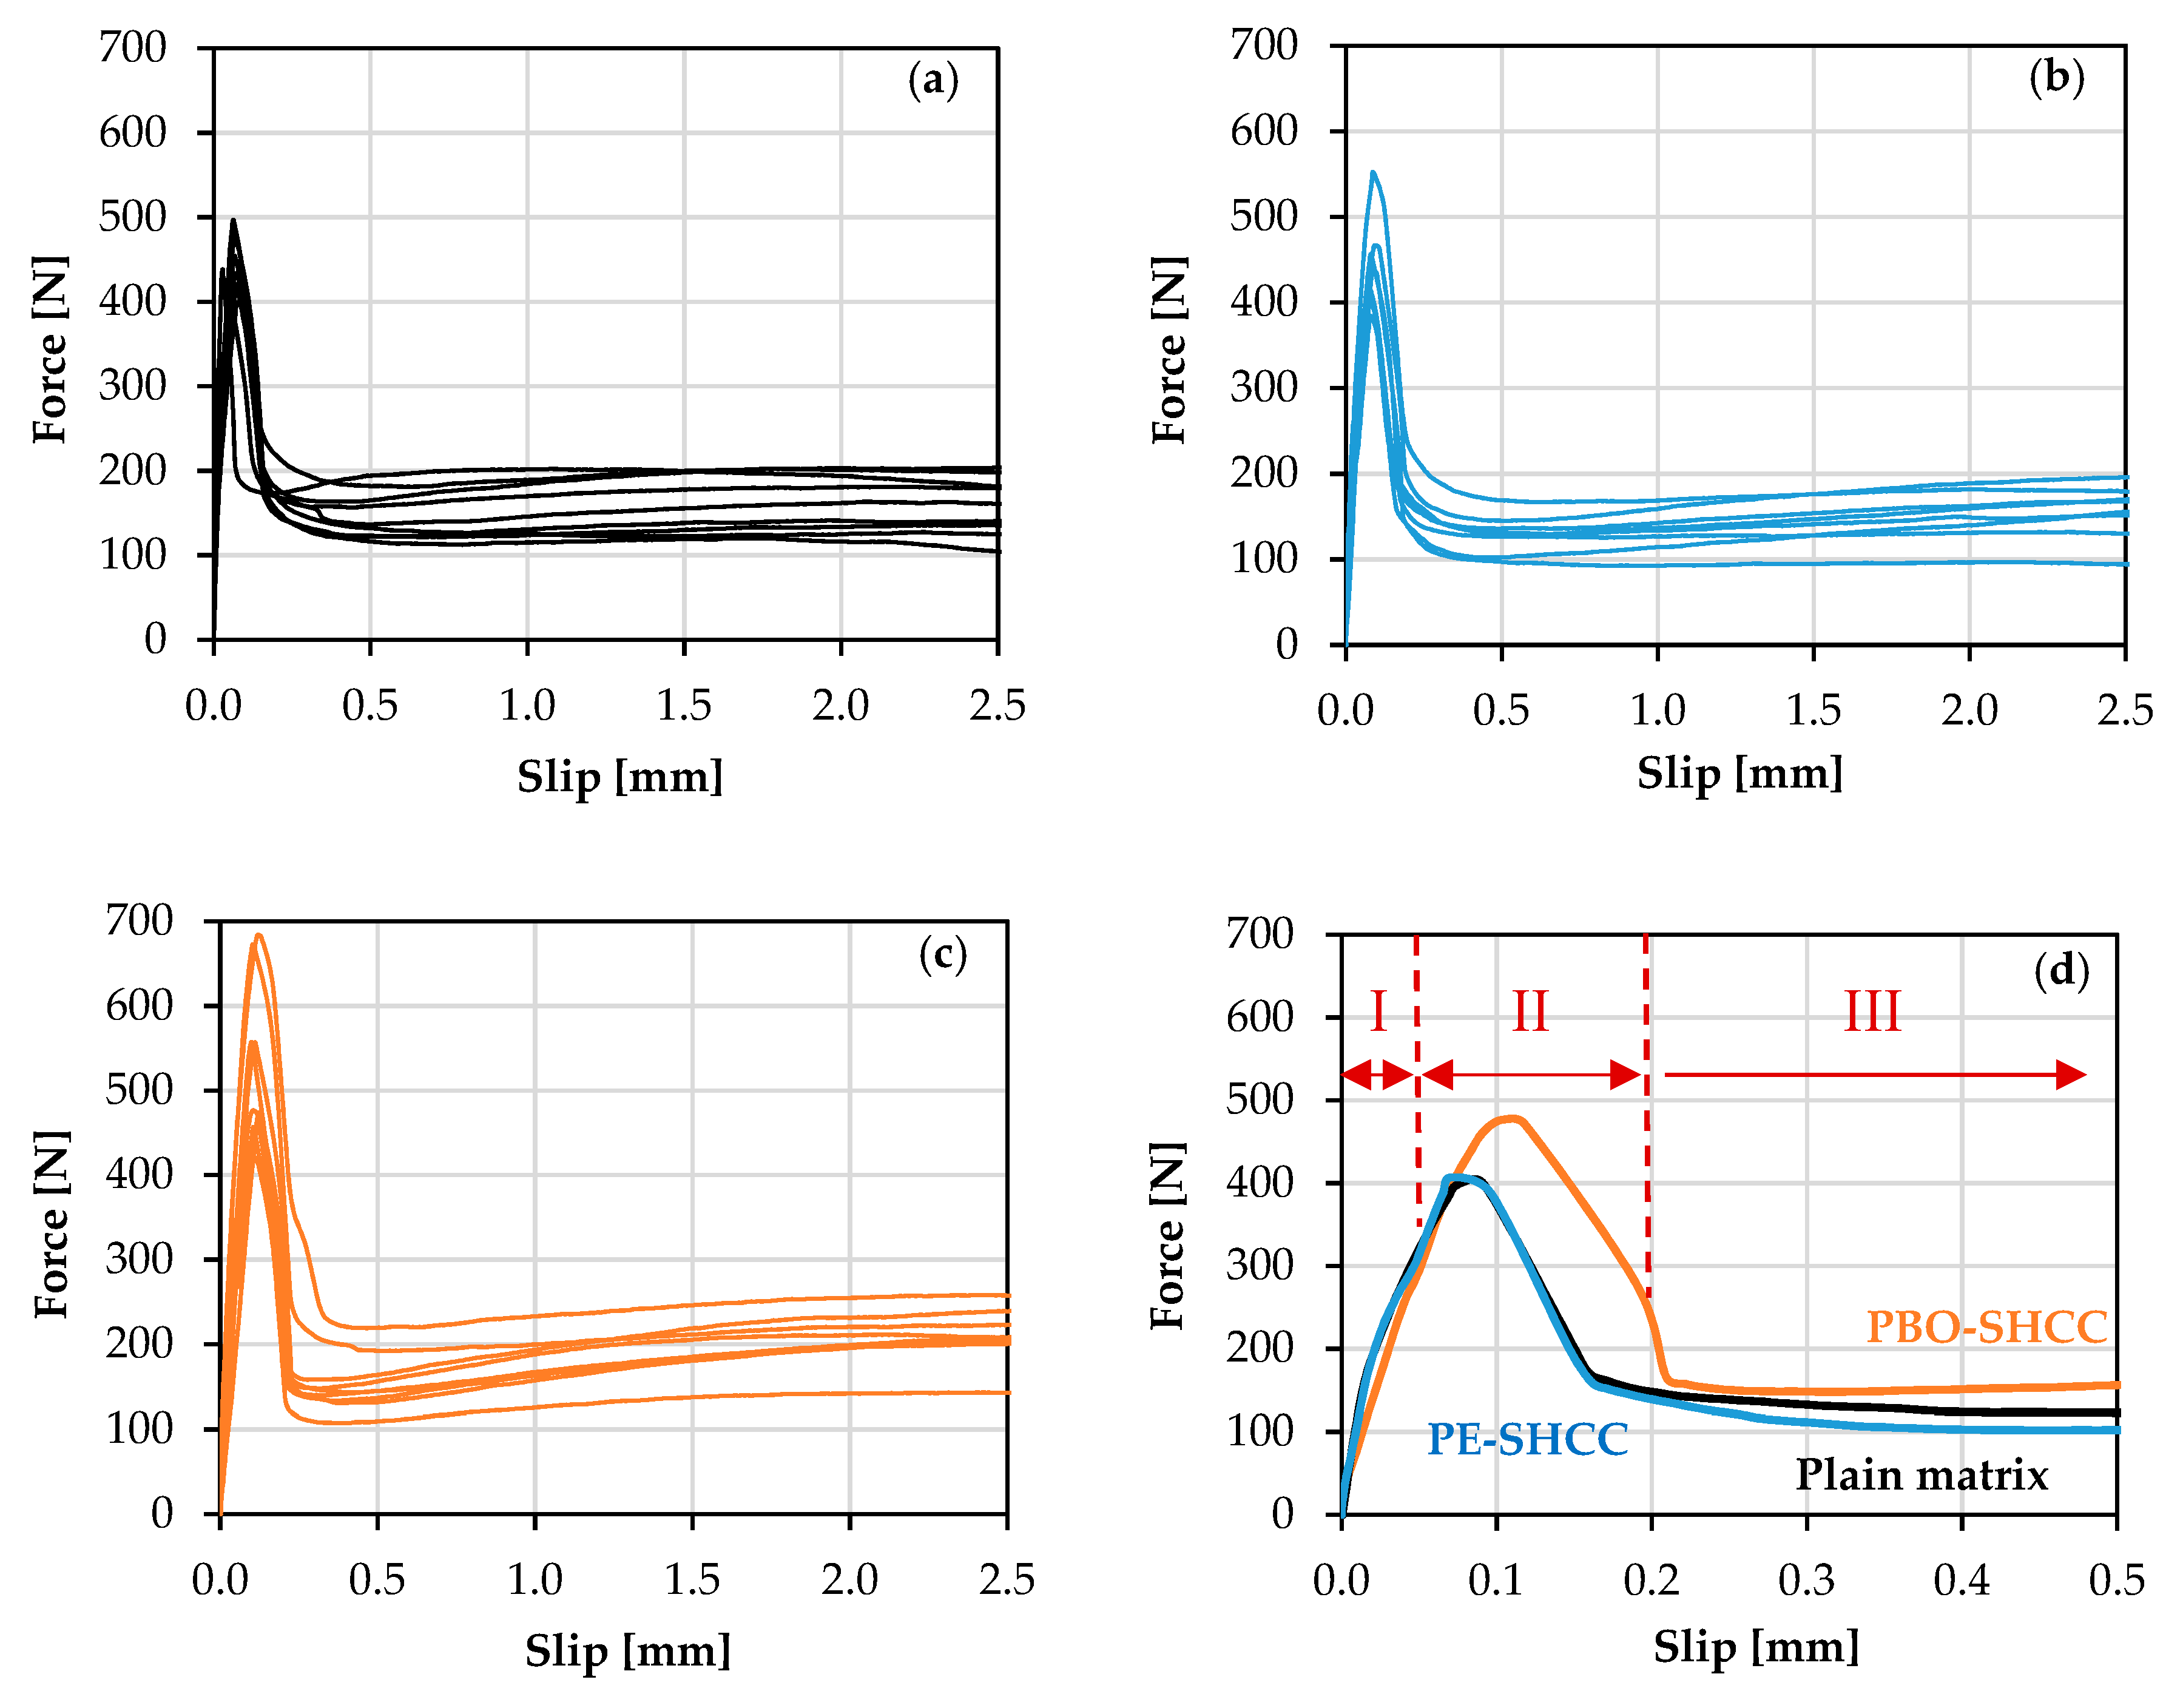
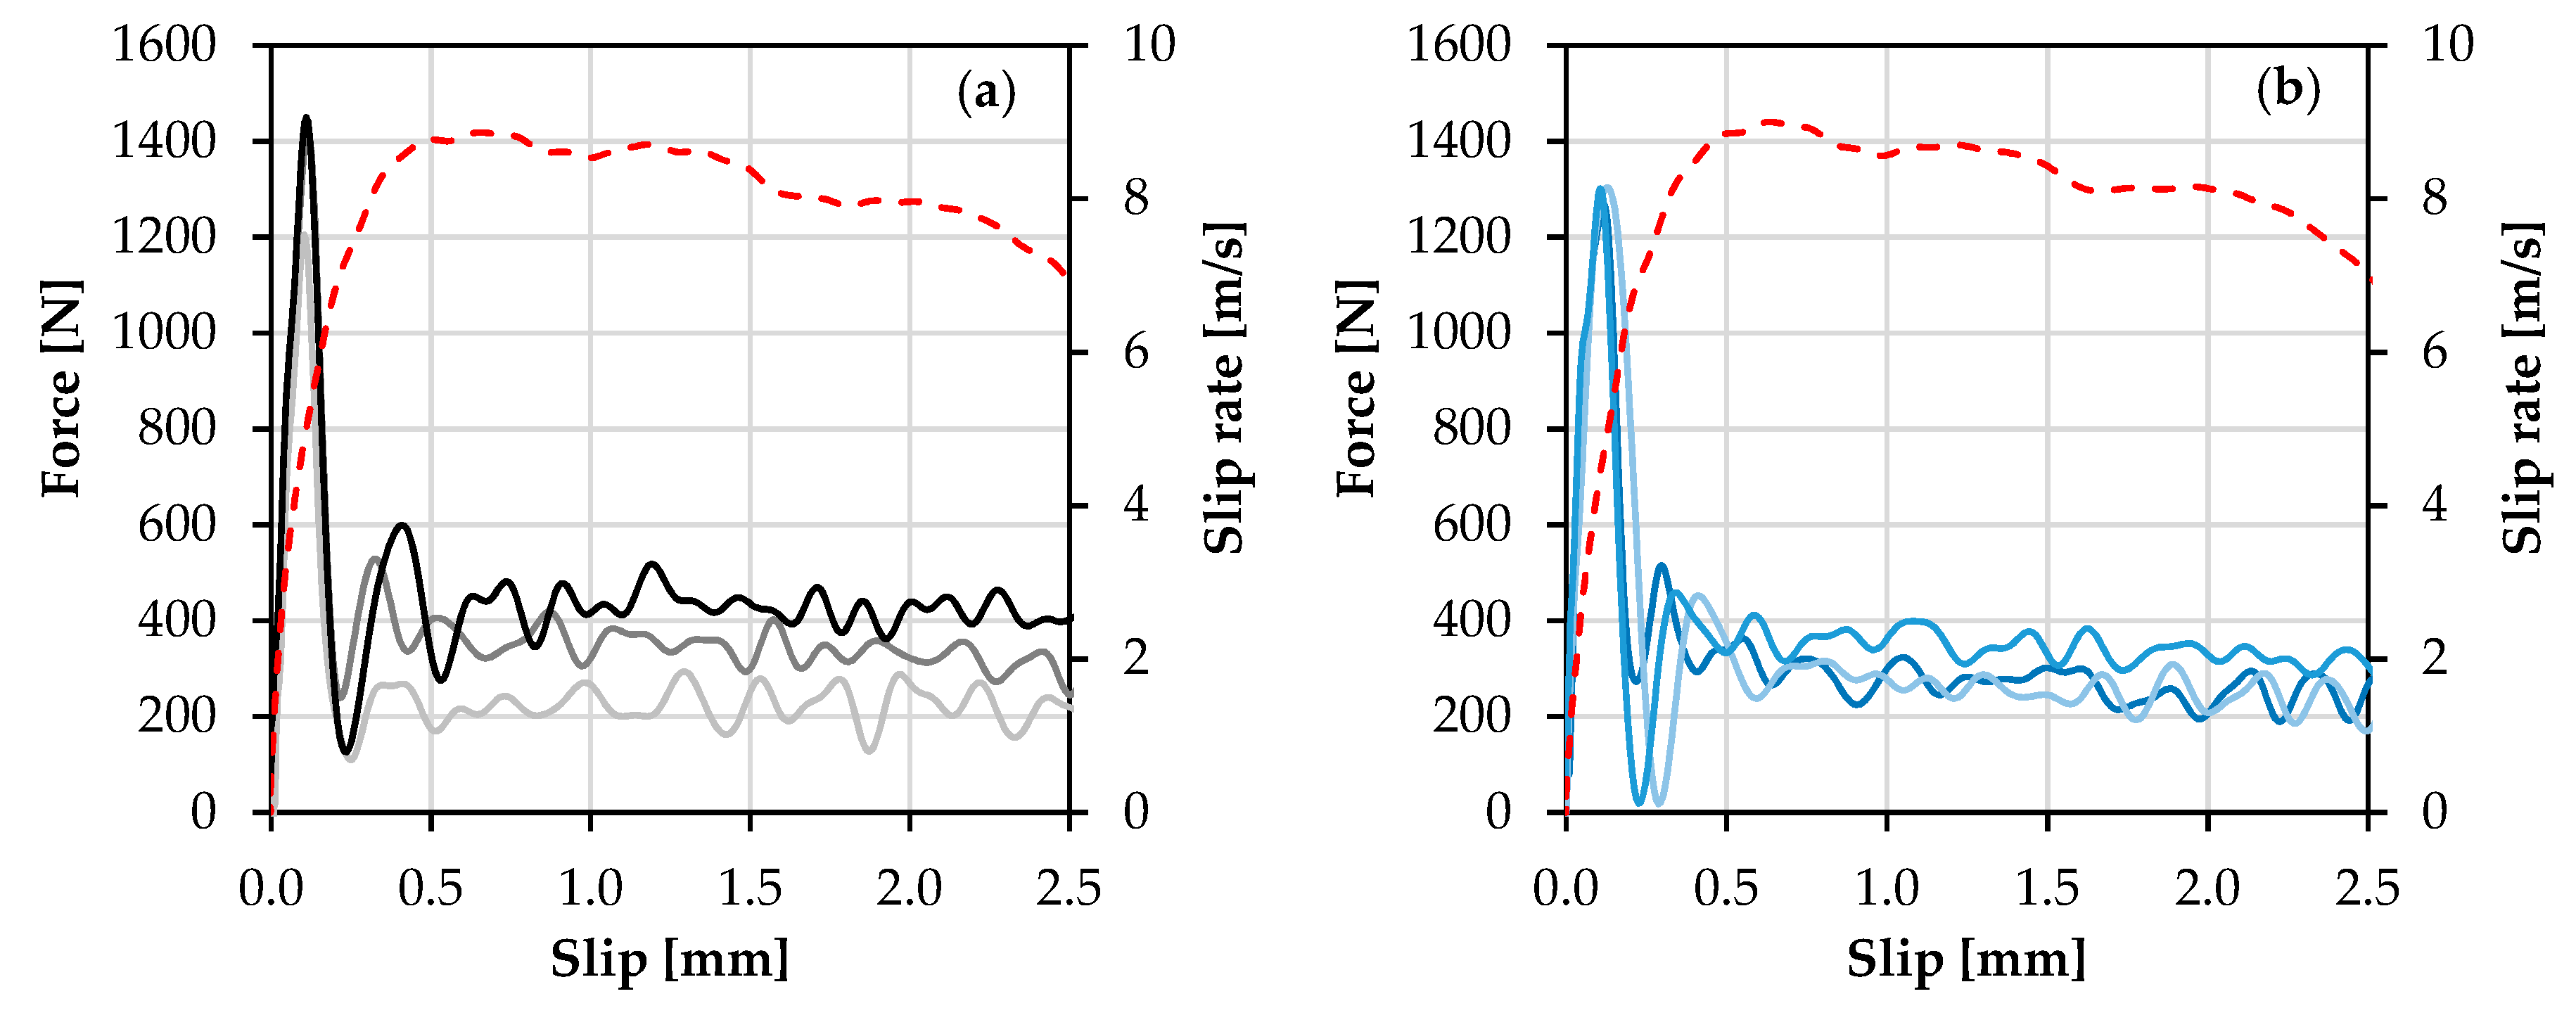
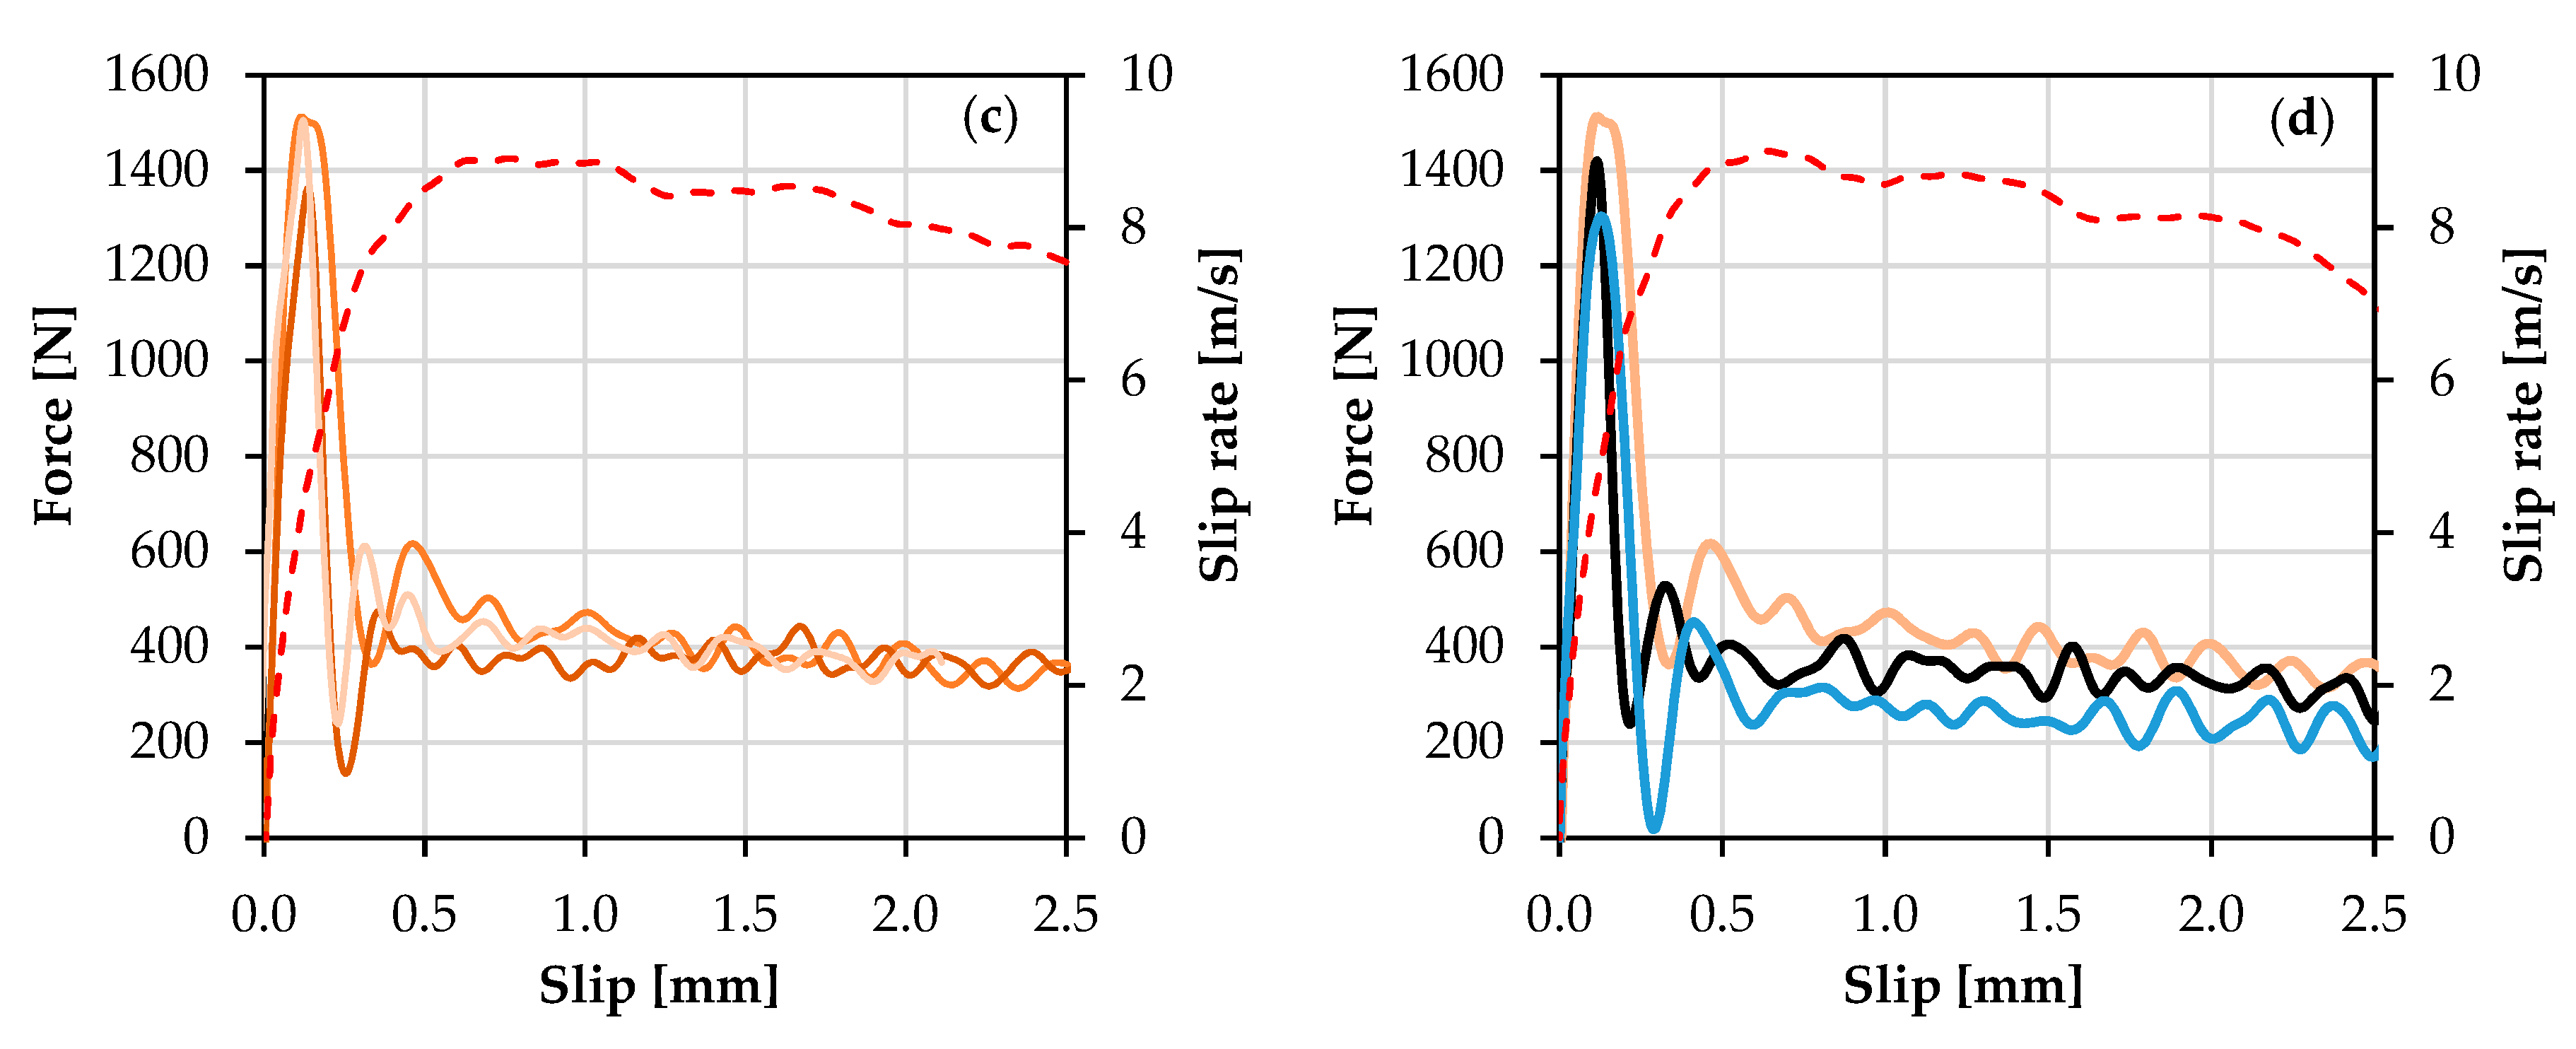
The force-slip curves of quasi-static single-yarn pullout from plain and SHCC matrices are plotted in 
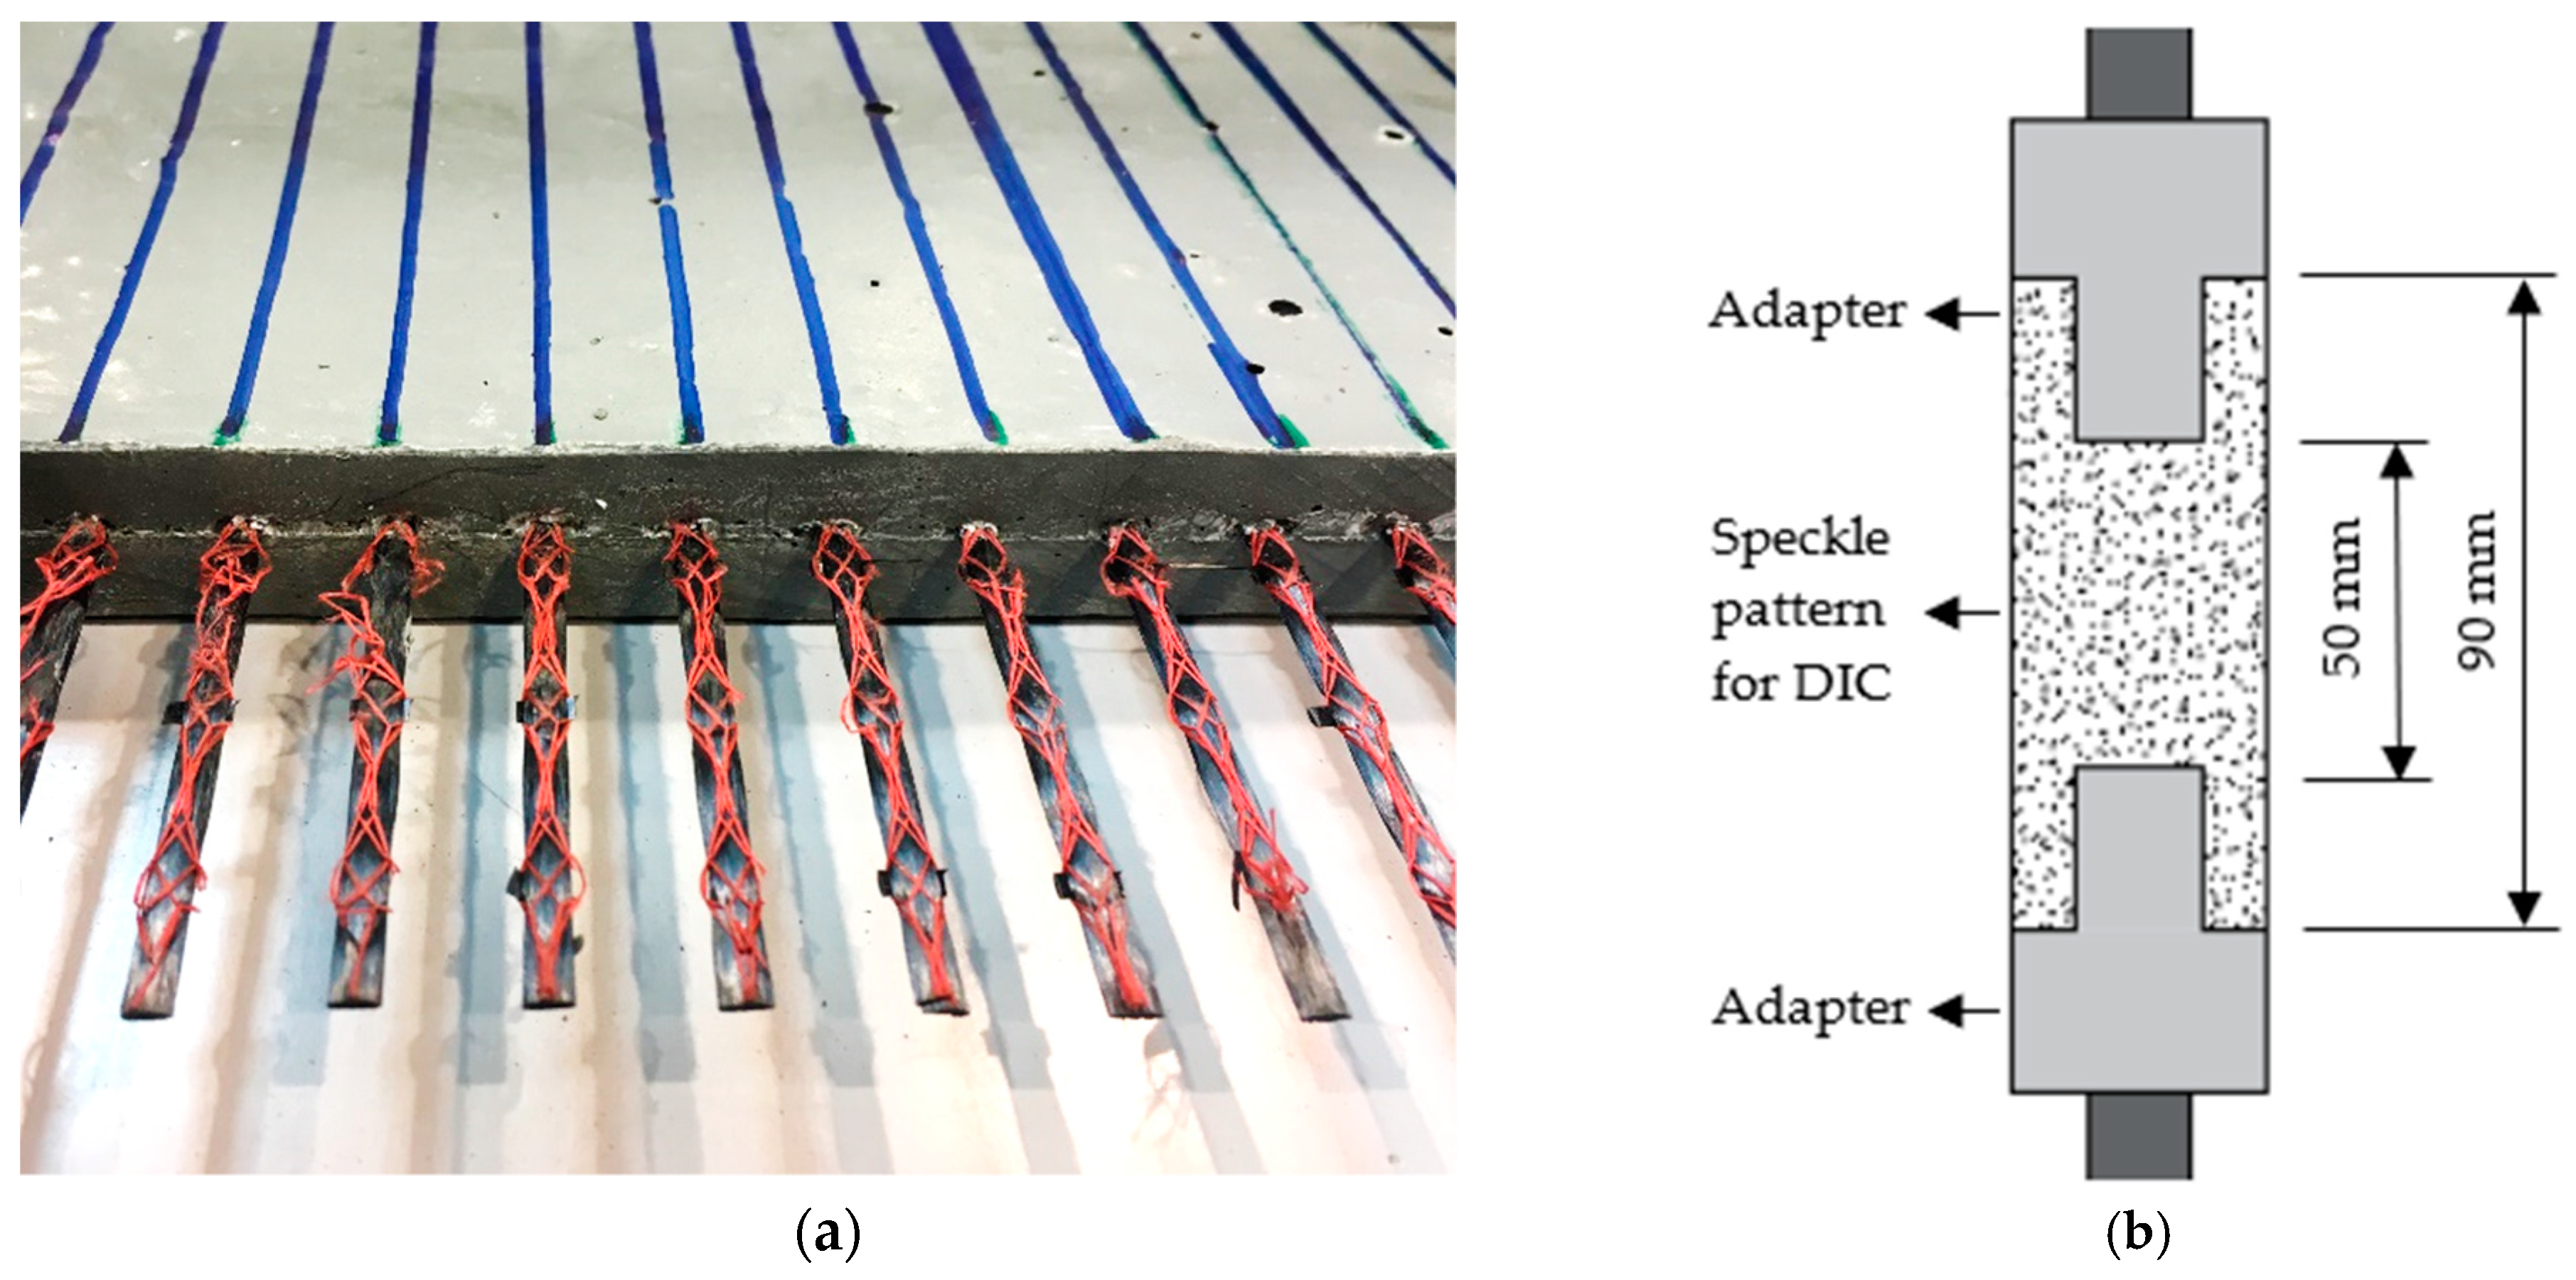
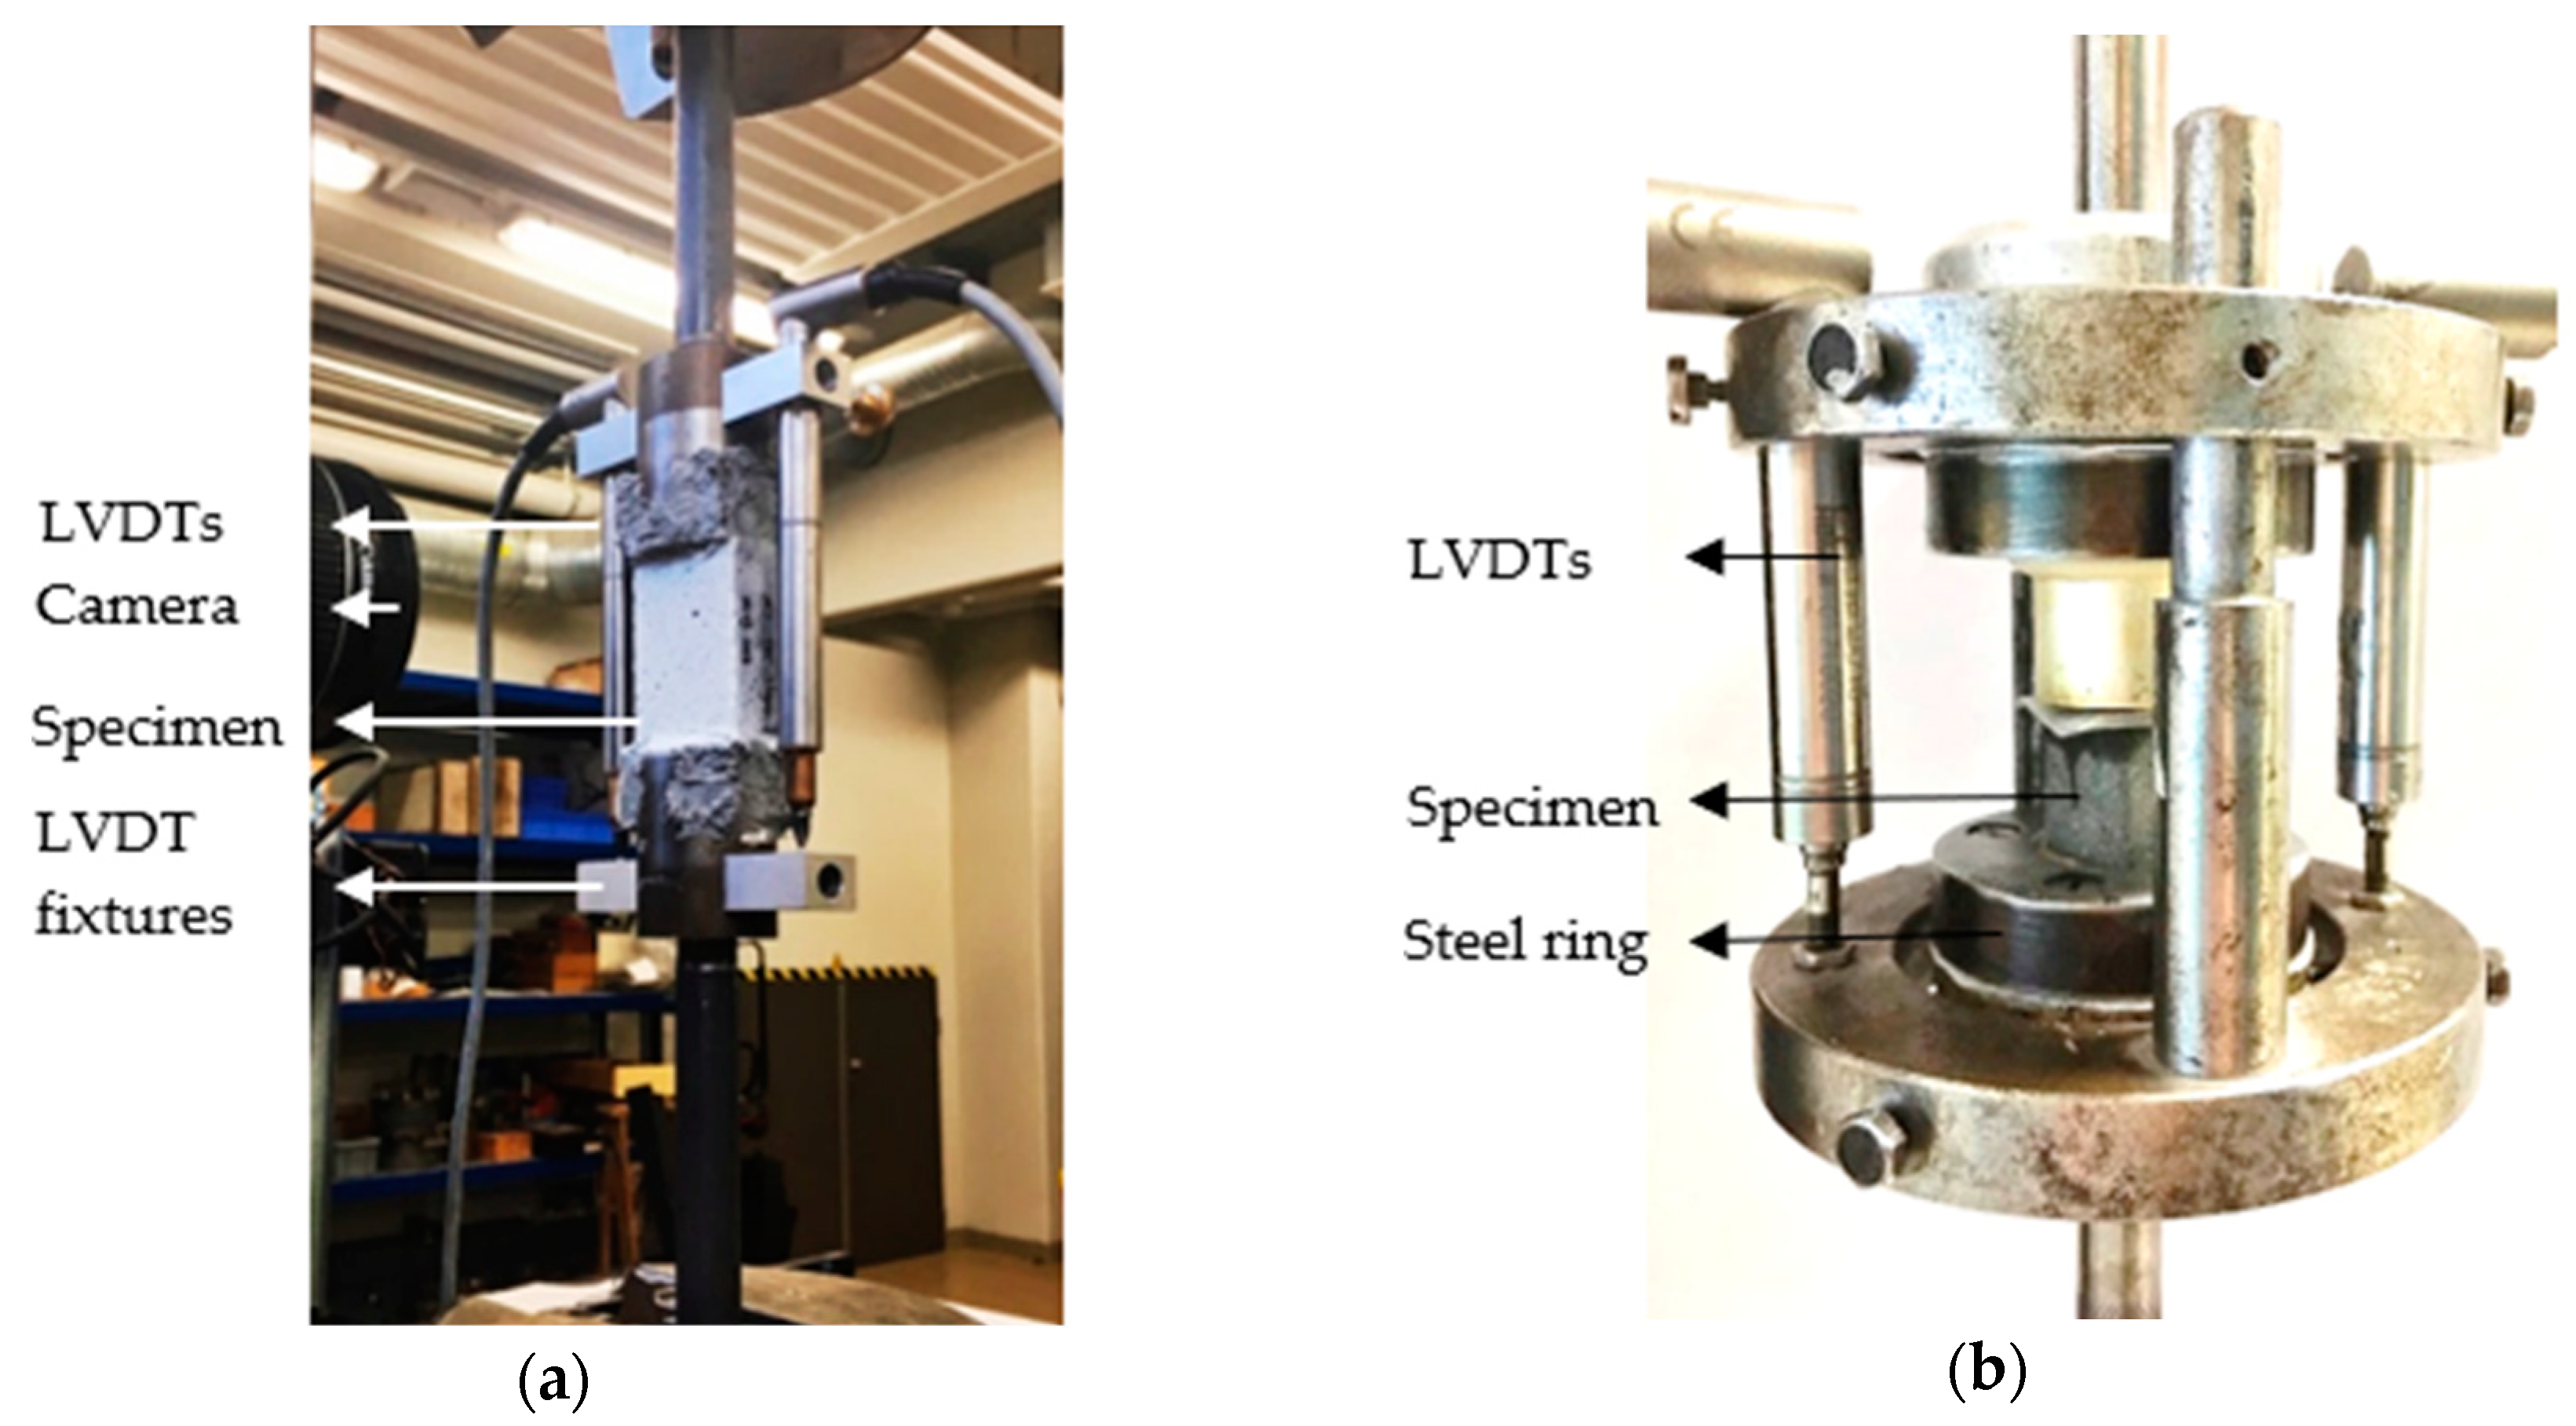
Figure 9. The slip of the carbon yarns was recorded by LVDTs attached directly to the specimens. The force-slip curve can be divided into three stages, as shown in Figure 9d. According to the pullout load-slip model presented in [30,31], stage I corresponds to the linear elastic stage, and is followed by the gradual debonding stage II, which terminates at the end of the debonding process. Stage III represents the pullout process influenced mainly by the yarn–matrix interfacial friction.
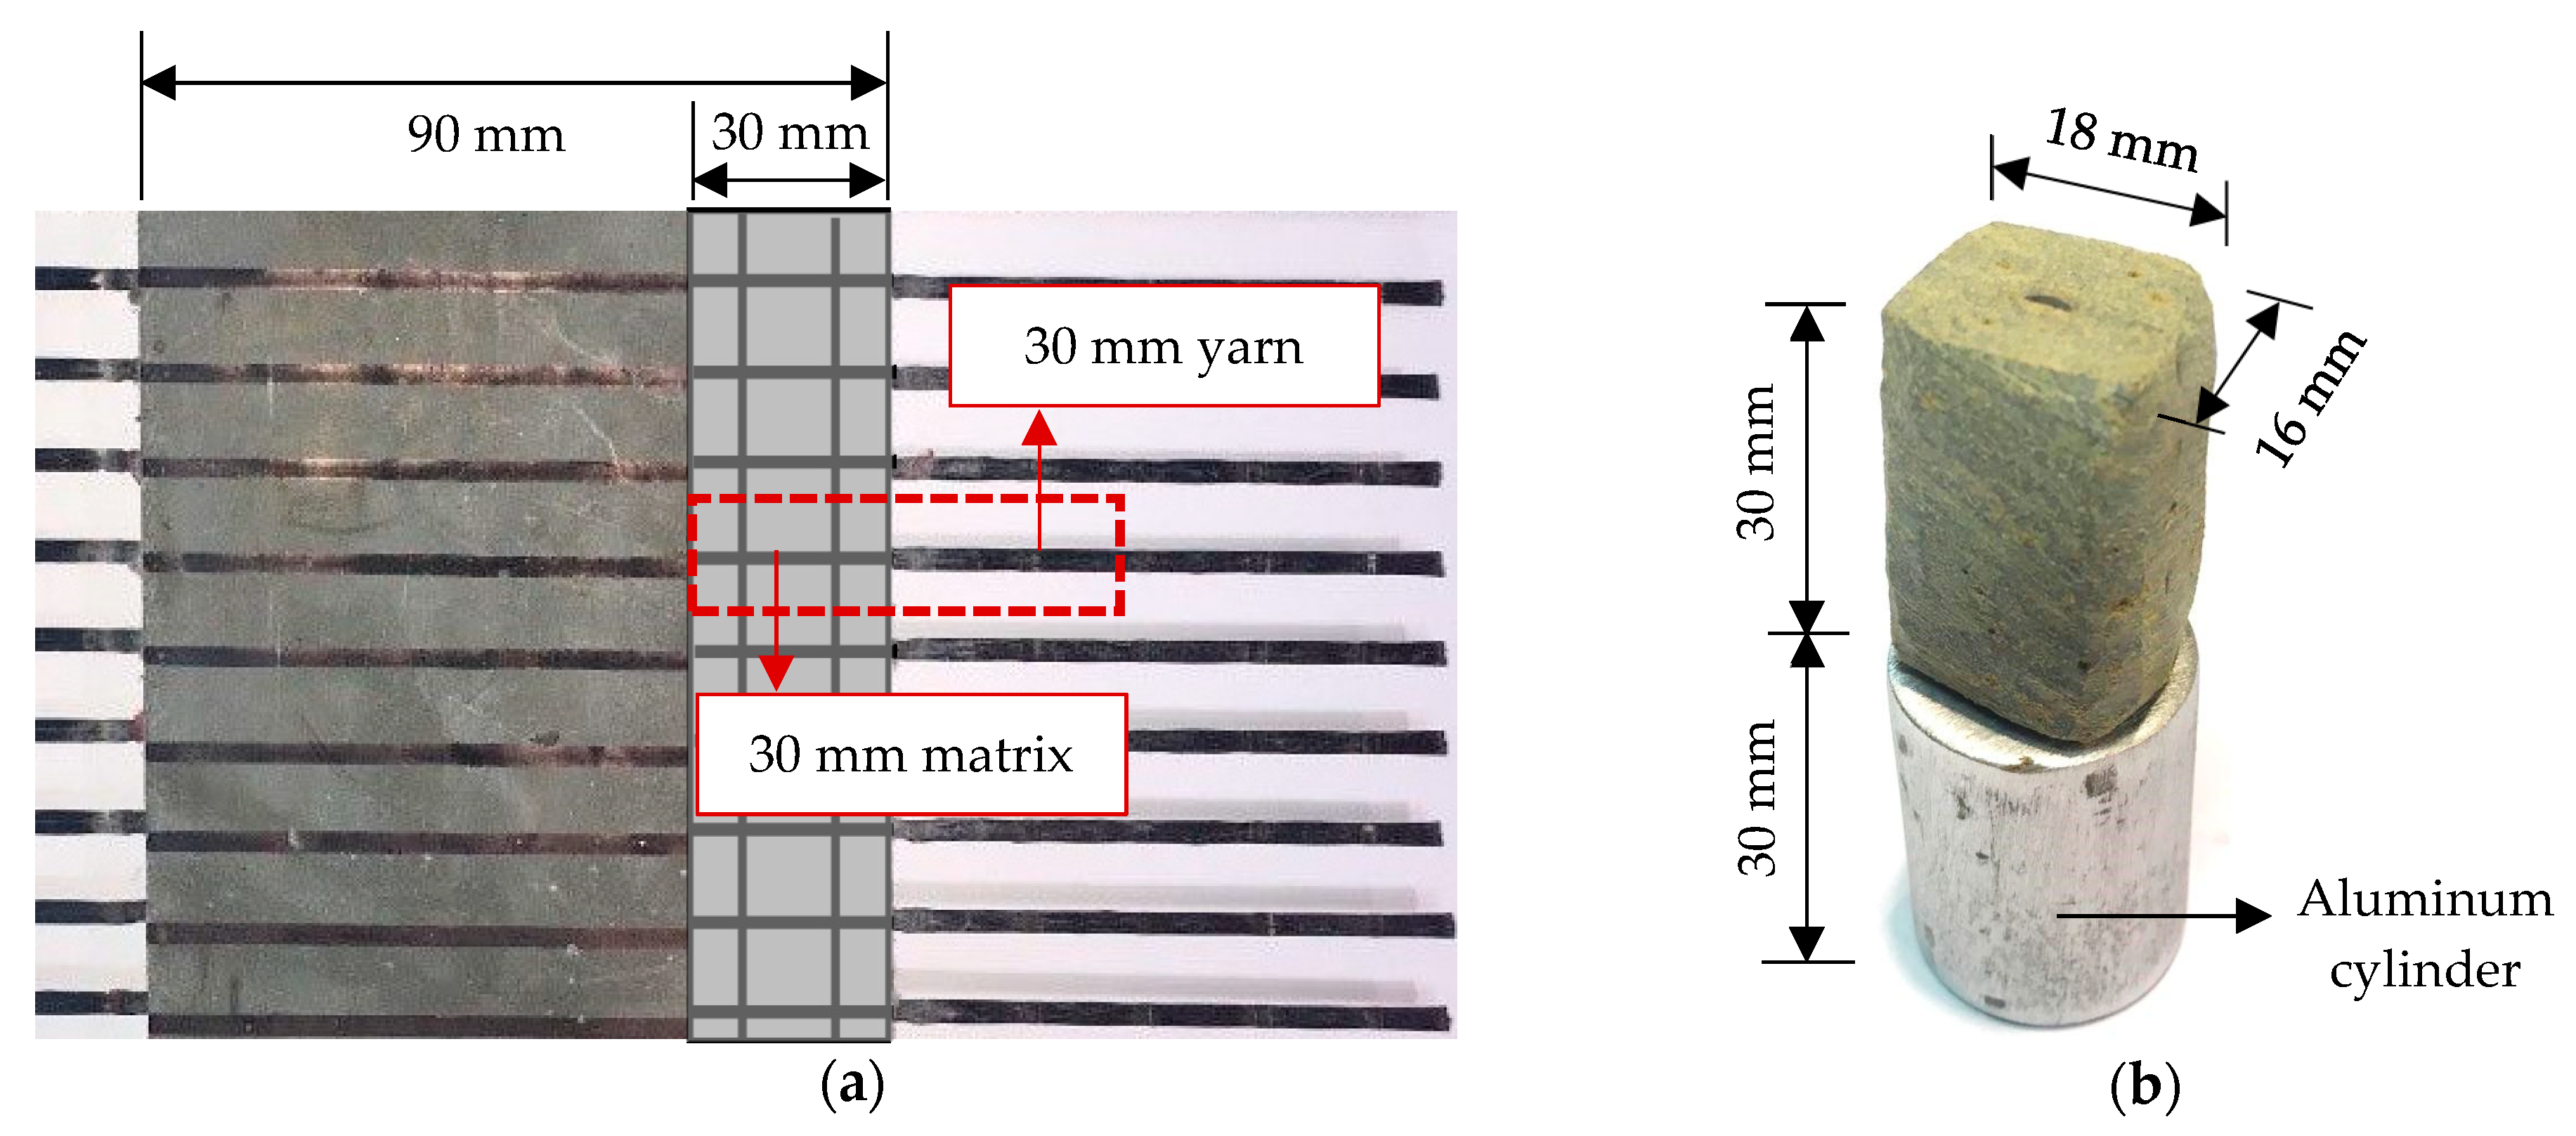
The relatively small embedment length of the yarns in combination with the weak affinity of both the carbon filaments and the styrene-butadiene coating to the cementitious matrix led to a complete pullout of the yarns. The peak forces for carbon yarn pulled out from plain matrix and PE-SHCC are nearly identical, with average forces of 441 N and 440 N, respectively. In contrast, the addition of PBO fibers led to a considerably higher bond strength, with an average peak pullout force of 530 N; see Table 6. This could be traced back to the mitigation of shrinkage-induced micro-cracking as ensured by PBO fibers [32]. However, a more detailed analytical investigation of the yarn-matrix interface should bring more clarity to this phenomenon. Note that in previous studies, such as [12], the addition of short alkali-resistant glass fibers and carbon fibers had a positive effect on the yarn-matrix bond strength. It could be that the poor wettability of the PE fibers, as well as their lower stiffness could be the reason for a lower bond strength in comparison to PBO-SHCC.

4.2. Results of the Impact Tension Tests

4.2.1. Dynamic Uniaxial Tension Tests

All three types of composites were tested under impact tensile loading with a peak displacement rate of 8 m/s, corresponding to an average strain rate of 160 s-1; see dashed curves in Figure 10. The first crack stress of the composites is defined here as the first peak of the stress–strain curve, also detected with the help of DIC. The tensile strength is defined as the stress value at the peak of the ascending branch of the curve, while the ultimate global strain corresponds to the strain value at the peak stress prior to failure localization. The results of tensile strength, ultimate strain, and the work-to-fracture of the tested specimens are given in Table 7. The dynamic increase factor (DIF) of each parameter was calculated to demonstrate the rate effect on the tensile behavior of the composites.
It is noteworthy that all the composites exhibit multiple cracks under impact tensile loading. TRC-PBO bears the highest average maximum tensile stress of 16 MPa, followed by TRC-PE, with an average tensile strength of 13 MPa. Both the first crack stress and the tensile strength of the composites are increased pronouncedly in comparison to the corresponding values measured in the quasi-static regime. Despite the multiple cracking occurring in TRC-M, the material exhibited a strain-softening behavior with a very short plateau immediately after the initial stress peak between 0.2% and 0.3% strain. This plateau can be attributed to the pullout behavior of the textile yarns, as demonstrated in the next section. Tensile stress–strain curves and corresponding average crack widths for representative specimens of TRC-M, TRC-PE, and TRC-PBO are plotted in Figure 11. The crack formation and fracture processes were captured by high-speed cameras and then evaluated with DIC. It can be observed that micro-cracking already occurred before the formation of the first crack. The first peak of the curve corresponds to the formation of the first macro-crack, which propagates through the entire specimen’s cross-section, leading to a large decrease of the composite stiffness. The momentary loss of the load-carrying capacity is revealed by the drop in the stress–strain curves after the first peak, as shown in Figure 10d. The strain-hardening behavior lasted until the composite with SHCC matrices reached their tensile strength, and afterwards, no new cracks developed while only the localization crack continued to open.
It can be observed that for all types of composites, the DIF of the first crack stress is considerably higher than that of the tensile strength. The first crack of material occurs during the initial loading stage associated with increasing displacement rates; i.e., acceleration. Due to this, the structural inertia has a significant contribution to the apparent first crack stress; see also, [33]. The first crack occurrence attenuates the effect of strain rates in the rate sensitive matrix considerably.
Average crack widths and crack spacings at critical strain levels of 0.1%, 0.3%, and 0.4% for representative specimens subjected to uniaxial impact tension (except localization crack) are given in Table 8, according to the nearest frame recorded. Though the average crack widths keep increasing, along with the deformation for all three materials, TRC-PE and TRC-PBO possess superior crack control behavior with a steady and moderate growth in average crack width.
Compared to the quasi-static tension tests, at the same strain level, the average crack width of TRC-PBO is higher than that of TRC-PE, which is the smallest among the three composites. Furthermore, the ultimate average crack spacing of TRC-PBO is larger. Even though TRC-PE still possesses a higher ultimate strain capacity of 1.2% comparing to 0.9% of TRC-PBO, its corresponding DIF of 0.4 reveals a pronounced loss in pre-peak strain capacity, leading to a slight decrease in the work-to-fracture; see Table 7. TRC-PBO, on the contrary, maintained strain capacity at the same level as under quasi-static loading, which led, along with the considerably higher tensile strength, to a significant increase in work-to-fracture, with the DIF being 1.8. The average crack-width–strain curve of TRC-M exhibits a considerably steeper slope after the formation of the first crack, indicating a more rapid degradation in the composite stiffness, as there is no contribution by short fibers. However, the improvement in the strain capacity (multiple cracking) indicates a better energy absorption behavior of this material under impact loading in comparison to its performance under quasi-static loading. The reason behind this improvement is the enhancement of the yarn-matrix bond under dynamic loading, which will be discussed in the next section.
The stresses applied and the average crack width growth at the critical strain levels are plotted in Figure 12. Taking into consideration both the load-carrying capacity and the average crack width developed, TRC-PBO exhibits the highest stress levels and a favorable crack control behavior at each strain level. When comparing to TRC-M, a sudden loss in composite stiffness is avoided, which means that TRC-PBO is able to carry a higher impact load with a more steady development of cracks.

4.2.2. Dynamic Single-Yarn Pullout Tests

The dynamic pullout curves are plotted in Figure 13. They show the same pattern as those obtained from the quasi-static tests. Note that the curves exhibit oscillations in the pullout stage, which are due to the intrinsic digital noise of the strain gauges, significant for such low pullout forces. Similar to the quasi-static tests, the peak bond strength between carbon yarn and the matrix with the addition of short PBO fibers, is the highest among the three composites, with an average of 1455 N; see Table 9. Note that the SHTB could ensure only a limited displacement during one wave passage, which was 2.5 mm.
It is obvious that the increasing displacement rate led to an increase in the peak pullout force with a dynamic increase factor (DIF) of around three for all three parameter combinations. The increased bonding between carbon yarn and matrix contributes to a higher tensile strength of the composites. Moreover, taking into consideration the increased tensile strength of the uncracked regions under a higher strain rate, higher stresses are needed to generate new cracks. In the previous section, it was shown that the number of cracks in TRC-M increased in impact tests, but it decreased in TRC-PE and TRC-PBO. In a future study, tension tests of single carbon yarn and short PE and PBO-AS fibers, and the pullout tests of the above-mentioned short fibers, need to be performed in order to attain a comprehensive understanding of the strain rate sensitivities of tensile properties and the bonding properties of the reinforcements to various matrices. What is more, as presented in [34], the bond strength could be enhanced by decreasing the spacing between weft yarns, upon the premise of a sufficient mesh spacing for short fibers to penetrate, which indicates the approach to further improve the bond properties of textiles by optimizing the mesh to an extent.

5. Conclusions

The tensile behavior of three composites reinforced by a carbon textile was investigated under quasi-static and impact tensile loading. Two of them contained additional short polymer fibers (SHCC matrices). The crack distributions were correlated to the strain of composites by means of digital image correlation. In this study, due to specific specimen geometry, only composites with SHCC matrices exhibited strain hardening behavior and multiple cracking in the quasi-static tension regime. Partly, this is related to material properties, and partly to the testing configuration, which did not allow for a sufficient anchorage of the textile reinforcement.
The dynamic loading leads to a pronounced increase in the tensile strength for all three materials, but the effects on the strain capacity are different. For composites containing both carbon textile and short PE fibers (TRC-PE), strain capacity decreases, accompanied by a smaller average crack width and larger average crack spacing. The average crack spacing in the composite containing carbon textile and short PBO fibers (TRC-PBO) is also considerably larger under impact tensile loading. However, in combination with the wider openings of the cracks, an ultimate strain similar to that in the quasi-static tests is obtained.
Additionally, the results of quasi-static and dynamic single-yarn pullout tests were presented. The high loading rate leads to a considerable increase in the yarn-matrix bonding strength for all three matrices under investigation. The bond is influenced by the type of short fiber reinforcement in the SHCC matrices; the addition of PBO fibers results in the highest bonding strength with the carbon yarn in both quasi-static and dynamic pullout tests.
Finally, it should be stressed that in the presented investigation, the premature rupturing of the textile reinforcements due to the specifics of the setup used, was observed, followed by the yarn’s pullout. This phenomenon surely had an effect on the behavior of the composites that was recorded. This effect, which likely depends on the loading rate, needs further investigation. A corresponding experimental program is being planned by the authors. New ideas for preventing premature textile failure will be implemented. This program will involve other types of textile reinforcement as well, such as one made of UHMWPE fiber.

Author Contributions

Methodology, T.G., A.A.H. and I.C.; formal analysis, T.G.; investigation, T.G. and A.A.H.; data curation, T.G., A.A.H. and G.A.; writing—original draft preparation, T.G.; writing—review and editing, A.A.H., I.C. and V.M.; supervision, V.M. and I.C.; project administration, V.M.; funding acquisition, V.M.

Funding

This research was funded by German Research Foundation (Deutsche Forschungsgemeinschaft-DFG) within the framework of the Research Training Group GRK 2250.

Acknowledgments

The authors express their great gratitude to the German Research Foundation (Deutsche Forschungsgemeinschaft-DFG) for the financial support provided within the framework of the Research Training Group GRK 2250. Credit is also given to Mr. Kai Uwe Mehlisch for his valuable contribution in performing the experiments. The authors also express their great gratitude to Open Access Funding by the Publication Fund of the TU Dresden.

Conflicts of Interest

The authors declare no conflict of interest. The funders had no role in the design of the study; in the collection, analyses, or interpretation of data; in the writing of the manuscript, or in the decision to publish the results.

References

  1. Mechtcherine, V. Novel cement-based composites for the strengthening and repair of concrete structures. Constr. Build. Mater. 2013, 41, 365–373. [Google Scholar] [CrossRef]
  2. Butler, M.; Mechtcherine, V.; Hempel, S. Experimental investigations on the durability of fibre-matrix interfaces in textile-reinforced concrete. Cem. Concr. Compos. 2009, 31, 221–231. [Google Scholar] [CrossRef]
  3. Sasi, E.A.; Peled, A. Three dimensional (3D) fabrics as reinforcements for cement-based composites. Appl. Sci. Manuf. 2015, 74, 153–165. [Google Scholar] [CrossRef]
  4. Li, V.C. From michromechanics to structural engineering—The design of cementitious composites for civil engineering applications. Jpn. Soc. Civ. Eng. 1993, 10, 37–48. [Google Scholar]
  5. Li, V.C. On engineered cementitious composites (ECC). J. Adv. Concr. Technol. 2003, 1, 215–230. [Google Scholar] [CrossRef]
  6. Mechtcherine, V.; Millon, O.; Butler, M.; Thoma, K. Mechanical behaviour of strain hardening cement-based composites under impact loading. Cem. Concr. Compos. 2011, 33, 1–11. [Google Scholar] [CrossRef]
  7. Hinzen, M.; Brameshuber, W. Improvement of Serviceability and Strength of Textile Reinforced Concrete by Using Short Fibres. In Proceedings of the 4th Colloquium on Textile Reinforced Structures, Dresden, Germany, 3–5 June 2009; pp. 261–272. [Google Scholar]
  8. Butler, M.; Hempel, R.; Schiekel, M. The influence of short glass fibres on the working capacity of textile reinforced concrete. In Proceedings of the 1st International RILEM Symposium Textile Reinforced Concrete, Aachen, Germany, 6–7 September 2006; pp. 45–54. [Google Scholar]
  9. Brameshuber, W.; Hinzen, M. Improving the first crack behaviour of textile reinforced concrete. In Proceedings of the 7th RILEM Workshop on High Performance Fiber Reinforced Cement Composites, Stuttgart, Germany, 1–3 June 2015; pp. 13–20. [Google Scholar]
  10. Gong, T.; Hamza, A.A.; Curosu, I. On the synergetic action between strain-hardening cement-based composites (SHCC) and carbon textile reinforcement. In Proceedings of the 10 th International Conference on Fracture Mechanics of Concrete and Concrete Structures FraMCoS-X, Bayonne, France, 23–26 June 2019. [Google Scholar] [CrossRef]
  11. De Andrade Silva, F.; Butler, M.; Mechtcherine, V.; Zhu, D.; Mobasher, B. Strain rate effect on the tensile behaviour of textile-reinforced concrete under static and dynamic loading. Mater. Sci. Eng. A 2011, 528, 1727–1734. [Google Scholar] [CrossRef]
  12. Barhum, R.; Mechtcherine, V. Effect of short, dispersed glass and carbon fibres on the behaviour of textile-reinforced concrete under tensile loading. Eng. Fract. Mech. 2012, 92, 56–71. [Google Scholar] [CrossRef]
  13. Yao, Y.; Silva, F.A.; Butler, M.; Mechtcherine, V.; Mobasher, B. Tension stiffening in textile-reinforced concrete under high speed tensile loads. Cem. Concr. Compos. 2015, 64, 49–61. [Google Scholar] [CrossRef]
  14. Yao, Y.; Bonakdar, A.; Faber, J.; Gries, T.; Mobasher, B. Distributed cracking mechanisms in textile-reinforced concrete under high speed tensile tests. Mater. Struct. Constr. 2016, 49, 2781–2798. [Google Scholar] [CrossRef]
  15. Soranakom, C.; Mobasher, B. Modeling of tension stiffening in reinforced cement composites: Part I. Theoretical modeling. Mater. Struct. Constr. 2010, 43, 1217–1230. [Google Scholar] [CrossRef]
  16. Shi, T.; Leung, C.K.Y. An effective discrete model for strain hardening cementitious composites: Model and concept. Comput. Struct. 2017, 85, 27–46. [Google Scholar] [CrossRef]
  17. Ranade, R.; Li, V.C.; Heard, W.F. Tensile rate effects in high strength-high ductility concrete. Cem. Concr. Res. 2015, 68, 94–104. [Google Scholar] [CrossRef]
  18. Shim, V.P.W.; Lim, C.T.; Foo, K.J. Dynamic mechanical properties of fabric armour. Int. J. Impact Eng. 2001, 25, 1–15. [Google Scholar] [CrossRef]
  19. Zhu, D.; Mobasher, B.; Erni, J.; Bansal, S.; Rajan, S.D. Strain rate and gage length effects on tensile behavior of Kevlar 49 single yarn. Compos. Part A Appl. Sci. Manuf. 2012, 43, 2021–2029. [Google Scholar] [CrossRef]
  20. Yang, E.-H.; Li, V.C. Tailoring engineered cementitious composites for impact resistance. Cem. Concr. Res. 2012, 42, 1066–1071. [Google Scholar] [CrossRef]
  21. Curosu, I. Influence of Fiber Type and Matrix Composition on the Tensile Behavior of Strain-Hardening Cement-Based Composites (SHCC) under Impact Loading. Ph.D. Thesis, Technische Universität Dresden, Dresden, Germany, 20 July 2017. [Google Scholar]
  22. Curosu, I.; Mechtcherine, V.; Millon, O. Effect of fiber properties and matrix composition on the tensile behavior of strain-hardening cement-based composites (SHCCs) subject to impact loading. Cem. Concr. Res. 2016, 82, 23–35. [Google Scholar] [CrossRef]
  23. Curosu, I.; Liebscher, M.; Mechtcherine, V.; Bellmann, C.; Michel, S. Tensile behavior of high-strength strain-hardening cement-based composites (HS-SHCC) made with high-performance polyethylene, aramid and PBO fibers. Cem. Concr. Res. 2017, 98, 71–81. [Google Scholar] [CrossRef]
  24. Li, V.C.; Leung, C.K.Y. Steady-state and multiple cracking of short random fiber composites. J. Eng. Mech. 1992, 118, 2246–2264. [Google Scholar] [CrossRef]
  25. Fact Sheet, Ultra High Molecular Weight Polyethylene Fiber Form Dyneema, Eurofibers. Available online: https://issuu.com/eurofibers/docs/name8f0d44, 15-11-2010 (accessed on 1 July 2019).
  26. Technical Information, PBO Fiber Zylon, Toyobo CO., LTD. Available online: http://www.toyobo- global.com/seihin/kc/pbo/zylon-p/bussei-p/technical.pdf (accessed on 1 July 2019).
  27. Allgemeine bauaufsichtliche Zulassung, Verfahren zur Verstärkung von Stahlbeton mit TUDALIT (Textilbewehrter Beton). Available online: http://www.textilbetonzentrum.de/app/download/5806918971/AbZ_Z-31.10-182.pdf (accessed on 30 November 2016).
  28. Heravi, A.A.; Mechtcherine, V. Mechanical characterization of strain-hardening cement-based composite (SHCC) under dynamic tensile load. In Proceedings of the 10th International Conference Fracture Mechanics for Concrete and Concrete Structures, Bayonne, France, 24–26 June 2019. [Google Scholar] [CrossRef]
  29. Mobasher, B.; Peled, A.; Pahilajani, J. Distributed cracking and stiffness degradation in fabric-cement composites. Mater. Struct. Constr. 2006, 39, 317–331. [Google Scholar] [CrossRef]
  30. Peled, A.; Bentur, A. Quantitative description of the pull-out behavior of crimped yarns from cement matrix. J. Mater. Civ. Eng. 2003, 15, 537–544. [Google Scholar] [CrossRef]
  31. Sueki, S.; Soranakom, C.; Mobasher, B.; Peled, A. Pullout-slip response of fabrics embedded in a cement paste matrix. J. Mater. Civ. Eng. 2005, 19, 718–727. [Google Scholar] [CrossRef]
  32. Al Ghazali, A.; Schröfl, C.; Mechtcherine, V. Plastic shrinkage of high-performance strain-hardening cement-based composites (HP-SHCC). In Proceedings of the 1st International Conference on Cement & Concrete Technology, Muscat, Oman, 20–22 November 2017; pp. 396–408. [Google Scholar]
  33. Curosu, I.; Mechtcherine, V.; Forni, D.; Cadoni, E. Performance of various strain-hardening cement-based composites (SHCC) subject to uniaxial impact tensile loading. Cem. Concr. Res. 2017, 102, 16–28. [Google Scholar] [CrossRef]
  34. Jiang, J.; Jiang, C.; Li, B.; Feng, P. Bond behavior of basalt textile meshes in ultra-high ductility cementitious composites. Compos. Part B Eng. 2019, 174, 107022. [Google Scholar] [CrossRef]
Figure 1. Schematic presentation of tensile load-deformation behavior of textile reinforcement, textile reinforced concrete, and hybrid reinforced composite.
Applsci 09 04048 g001
Figure 2. Geometry of the textile reinforcement under investigation.
Applsci 09 04048 g002
Figure 3. Specimen production for tension tests: (a) plate after demolding; (b) final specimen dimensions and fixities.
Applsci 09 04048 g003
Figure 4. Specimen production for single-yarn pullout tests: (a) cutting configuration; (b) final specimen dimensions and fixities.
Applsci 09 04048 g004
Figure 5. Test setups for: (a) quasi-static tension tests and (b) quasi-static single-yarn pullout tests.
Applsci 09 04048 g005
Figure 6. Testing configuration of the gravitational split Hopkinson tension bar (SHTB) for impact tension and single-yarn pullout test.
Applsci 09 04048 g006
Figure 7. (ac) Tensile stress–strain curves of the composites under quasi-static loading and (d) representative stress–strain relationships for the composites under investigation.
Applsci 09 04048 g007
Figure 8. Tensile stress–strain curve and corresponding average crack widths of a representative specimen of both (a) TRC-PE and (b) TRC-PBO with corresponding composite stresses and crack patterns under quasi-static loading.
Applsci 09 04048 g008
Figure 9. Quasi-static force-slip relationships of single carbon yarns pulled out from: (a) plain matrix; (b) PE-SHCC; (c) PBO-SHCC; and (d) representative force-slip relationships for different composites up to a slip extent of 0.5 mm.
Applsci 09 04048 g009
Figure 10. (ac) Tensile stress–strain curves of the composites under impact loading (the global strain rate curves are represented by dashed lines) and (d) representative stress–strain relationships for the composites under investigation.
Applsci 09 04048 g010
Figure 11. Tensile stress–strain curve and corresponding average crack widths of a representative specimens of (a) TRC-M, (b) TRC-PE, and (c) TRC-PBO, with corresponding composite stresses and crack patterns under impact loading.
Applsci 09 04048 g011aApplsci 09 04048 g011b
Figure 12. Average crack width and applied stress for representative specimens under impact tensile loading.
Applsci 09 04048 g012
Figure 13. Dynamic force-slip relationships of single carbon yarns pulled out from: (a) plain matrix; (b) PE-SHCC; (c) PBO-SHCC; and (d) representative force-slip relationships for different composites up to a slip extent of 2.5 mm (the global strain rate curves are represented by dashed lines).
Applsci 09 04048 g013aApplsci 09 04048 g013b
Table 1. Mixture composition of the high-strength, fine-grained cementitious matrix.
Componentskg/m3
CEM I 52.5R-SR3/NA1460
Silica fume292
Quartz sand 0.06-0.2 mm145
Superplasticizer45
Water315
Table 2. Properties of polymer fibers as provided by the producers [25,26].
Fiber TypeUHMWPEPBO-AS
ProducerDSMToyobo
BrandDyneema®Zylon®
Nominal diameter [μm]2013
Length [mm]66
Density [kg/m3]9701540
Tensile strength [MPa]25005800
Modulus of elasticity [GPa]80180
Elongation at break [%]3.53.5
Table 3. Properties of carbon textile TUDALIT-BZT2-V.FRAAS [27].
Warp YarnWeft Yarn
Average yarn count [tex]3300800
Effective yarn cross-section [mm2]1.8000.451
Average tensile strength [MPa]17001700
Average modulus of elasticity [GPa]170152
Table 4. Results of the uniaxial quasi-static tests on the investigated composites (average values; standard deviations are given in parentheses).
First Crack Stress [MPa]Peak Tensile Stress [MPa]Ultimate Strain [%]Work-to-Fracture [kJ/m3]
TRC-M3.4 (0.3)3.4 (0.3)
TRC-PE2.5 (0.5)8.1 (0.2)2.8 (0.4)185.7 (31.3)
TRC-PBO4.6 (1.1)9.4 (0.2)0.9 (0.2)67.4 (12.1)
Table 5. Average crack width and spacing at the ultimate strain level for the representative specimens subjected to uniaxial quasi-static tension tests (localization crack excluded).
TRC-MTRC-HDPETRC-PBO
Average crack width at the ultimate strain level [μm]8829
Average crack spacing at the ultimate strain level [mm]43
Table 6. Peak debonding forces in quasi-static pullout tests with three different matrices (average values; standard deviations are given in parentheses).
Single-Yarn Pullout from Plain Matrix Single-Yarn Pullout from PE-SHCCSingle-Yarn Pullout from PBO-SHCC
Peak debonding force [N]441 (34)440 (53)530 (94)
Table 7. Results of the uniaxial impact tension tests on the composites under investigation (average values; standard deviations are given in parentheses).
First Crack Stress [MPa]Peak Tensile Stress [MPa]Ultimate Strain [%]Work-to-Fracture [kJ/m3]
TRC-M8.6 (0.7)4.5 (0.6)0.3 (0.1)14.7 (4.2)
DIF2.51.3
TRC-PE10.6 (1.6)13.0 (0.6)1.2 (0.2)122.4 (21.9)
DIF4.21.60.40.7
TRC-PBO13.9 (0.5)16.0 (0.4)0.9 (0.1)122.2 (22.6)
DIF3.01.71.01.8
Table 8. Average crack width and crack spacing at the strain levels of 0.1%, 0.3%, and 0.4% for the representative specimens subjected to uniaxial impact tension tests (localization crack excluded).
TRC-MTRC-PETRC-PBO
Average crack width at 0.1% strain level [μm]171629
Average crack spacing at 0.1% strain level [mm]251725
Applied stress at 0.1% strain level [MPa]5.88.214.1
Average crack width at 0.3% strain level [μm]632540
Average crack spacing at 0.3% strain level [mm]171013
Applied stress at 0.3% strain level [MPa]3.88.212.6
Average crack width at 0.4% strain level [μm]834358
Average crack spacing at 0.4% strain level [mm]131013
Applied stress at 0.4% strain level [MPa]3.49.214.4
Average crack width at the ultimate strain level [μm]13872107
Average crack spacing at the ultimate strain level [mm]13713
Table 9. Peak debonding force obtained from high-speed pullout tests with three different matrices (average values; standard deviations are given in parentheses).
Single-Yarn Pullout from Plain Matrix Single-Yarn Pullout from PE-SHCCSingle-Yarn Pullout from PBO-SHCC
Peak debonding force [N]1355 (131)1289 (22)1455 (82)
DIF3.12.92.7

