Article

A Finite Element Investigation into the Effect of Slope of Grain on Wood Baseball Bat Durability

1
Baseball Research Center, Mechanical Engineering Department, University of Massachusetts Lowell, 1 University Avenue, Lowell, MA 01854, USA
2
U.S. Forest Products Laboratory, US Forest Service, 1 Gifford Pinchot Drive, Madison, WI 53726, USA
*
Author to whom correspondence should be addressed.
Retired.
Appl. Sci. 2019, 9(18), 3733; https://doi.org/10.3390/app9183733
Submission received: 30 July 2019 / Revised: 28 August 2019 / Accepted: 30 August 2019 / Published: 7 September 2019
(This article belongs to the Special Issue Sports Materials)

Abstract

:
Bat durability is defined as the relative bat/ball speed that results in bat breakage, i.e., the higher the speed required to initiate bat cracking, the better the durability. In 2008, Major League Baseball added a regulation to the Wooden Baseball Bat Standards concerning Slope-of-Grain (SoG), defined to be the angle of the grain of the wood in the bat with respect to a line parallel to the longitudinal axis of the bat, as part of an overall strategy to reverse what was perceived to be an increasing rate of wood bats breaking into multiple pieces during games. The combination of a set of regulations concerning wood density, prescribed hitting surface, and SoG led to a 30% reduction in the rate of multi-piece failures. In an effort to develop a fundamental understanding of how changes in the SoG impact the resulting bat durability, a popular professional bat profile was examined using the finite element method in a parametric study to quantify the relationship between SoG and bat durability. The parametric study was completed for a span of combinations of wood SoGs, wood species (ash, maple, and yellow birch), inside-pitch and outside-pitch impact locations, and bat/ball impact speeds ranging from 90 to 180 mph (145 to 290 kph). The *MAT_WOOD (MAT_143) material model in LS-DYNA was used for implementing the wood material behavior in the finite element models. A strain-to-failure criterion was also used in the *MAT_ADD_EROSION option to capture the initiation point and subsequent crack propagation as the wood breaks. Differences among the durability responses of the three wood species are presented and discussed. Maple is concluded to be the most likely of the three wood species to result in a Multi-Piece Failure. The finite element models show that while a 0°-SoG bat is not necessarily the most durable configuration, it is the most versatile with respect to bat durability. This study is the first comprehensive numerical investigation as to the relationship between SoG and bat durability. Before this numerical study, only limited empirical data from bats broken during games were available to imply a qualitative relationship between SoG and bat durability. This novel study can serve as the basis for developing future parametric studies using finite element modeling to explore a large set of bat profiles and thereby to develop a deeper fundamental understanding of the relationship among bat profile, wood species, wood SoG, wood density, and on-field durability.

Graphical Abstract

1. Introduction

In the early years of baseball, bats were made from a wide variety of wood species as players explored various woods in their quest to find the perfect wood. Eventually, northern white ash became the wood of choice as it had the best combination of density, stiffness, and impact resistance properties. For example, hickory has better impact resistance than the northern white ash, but it is denser than ash, thereby making for a relatively heavy bat. In the late 19th century, the Hillerich family in Louisville, Kentucky cemented the central role of ash bats in baseball when it began manufacturing northern white ash bats for a number of professional teams [1].
Ash remained the wood of choice until the late 1990s when maple bats were introduced to players by Sam Bat, and a small number of players transitioned from ash to maple [2]. As the popularity of maple bats increased, the rate at which bats were breaking into multiple pieces during games was perceived to be increasing as well. However, there were no data to support whether this phenomenon was real or perceived. To obtain concrete data on the phenomenon, Major League Baseball (MLB) in cooperation with the Major League Baseball Players Association (MLBPA) authorized the collection of all bats that broke in games during a 2½-month portion of the 2008 MLB regular-season. Visual inspection of these broken bats concluded that the slope-of-grain (SoG) of the wood in each of the bats played a major role in the likelihood of a bat breaking into multiple fragments [3]. Slope-of-grain is defined to be the angle of the grain of the wood in the bat with respect to a line parallel to the longitudinal axis of the bat.
As a result of the SoG observations from the field-collection bats and the understanding of the mechanical behavior of maple from a wood-science perspective, the wood-science experts on the team recommended new regulations be implemented after the 2008 season with respect to (1) setting the allowable range of SoG to be ±3° and (2) changing the hitting surface for maple bats from edge grain to face grain. Before limiting the allowable range of SoG to be ±3°, many bat manufacturers were not closely monitoring SoG, and therefore, allowing wood with SoGs of up to ±10° to be used in bats.
After the 2009 season, additional regulations were implemented to restrict the minimum allowable wood density to 0.0245 lb/in3 (678 Kg/m3) for maple wood species that could be used to manufacture baseball bats. Before this limitation was implemented, any species of maple was allowed to be used to make a wood bat. Without a list of specific maple species, maple species with poor impact properties were sometimes being used. After the introduction of the strict limitation to a single species of maple and greater awareness and compliance with the new regulations, the MPF rate dropped an additional 15–20% between the 2009 and 2010 seasons [4]. Each of the new regulations had the benefit that the improvements in bat durability came with changes that were fairly transparent to the players, i.e., there were no bat geometries or popular wood species that were prohibited from use.
The combination of (1) setting the allowable range for SoG to be ±3°, (2) changing the impact surface from the edge to face grain for maple, and (3) the restriction on the minimum allowable wood density of 0.0245 lb/in3 (678 kg/m3) for the wood species of maple resulted in a measurable decrease of ~65% in the MPF rate per game [5]. Of these three changes, the only one that has an option to offer any additional drop in the MPF rate without any increase in bat weight is a further tightening of the allowable SoG from ±3°. To explore if and how a further tightening of the allowable SoG could improve upon the MPF rate, the durability of sets of bats sorted by SoG, e.g., sorted into four SoG groupings, specifically (1) |SoG| ≤ 1°, (2) 1° < |SoG| ≤ 2°, (3) 2° < |SoG| ≤ 3°, and (4) |SoG| > 3°, could be tested in the lab. However, such an approach would be difficult due to the inherent variability of wood and the lack of control over the factors unrelated to SoG, such as density or the ultimate strength of the wood, thereby making it challenging to draw conclusive trends. In addition, it would also be expensive with respect to the large number of bats that would need to be explored for such a study, as well as the time required to characterize the durability of all bats in the study and subsequent examination of all bat failures. An alternative and cost-effective approach is to use the finite element method to investigate how the failure mode changes as a function of SoG for a range of representative on-field relative bat/ball speeds and impact locations [6,7,8].
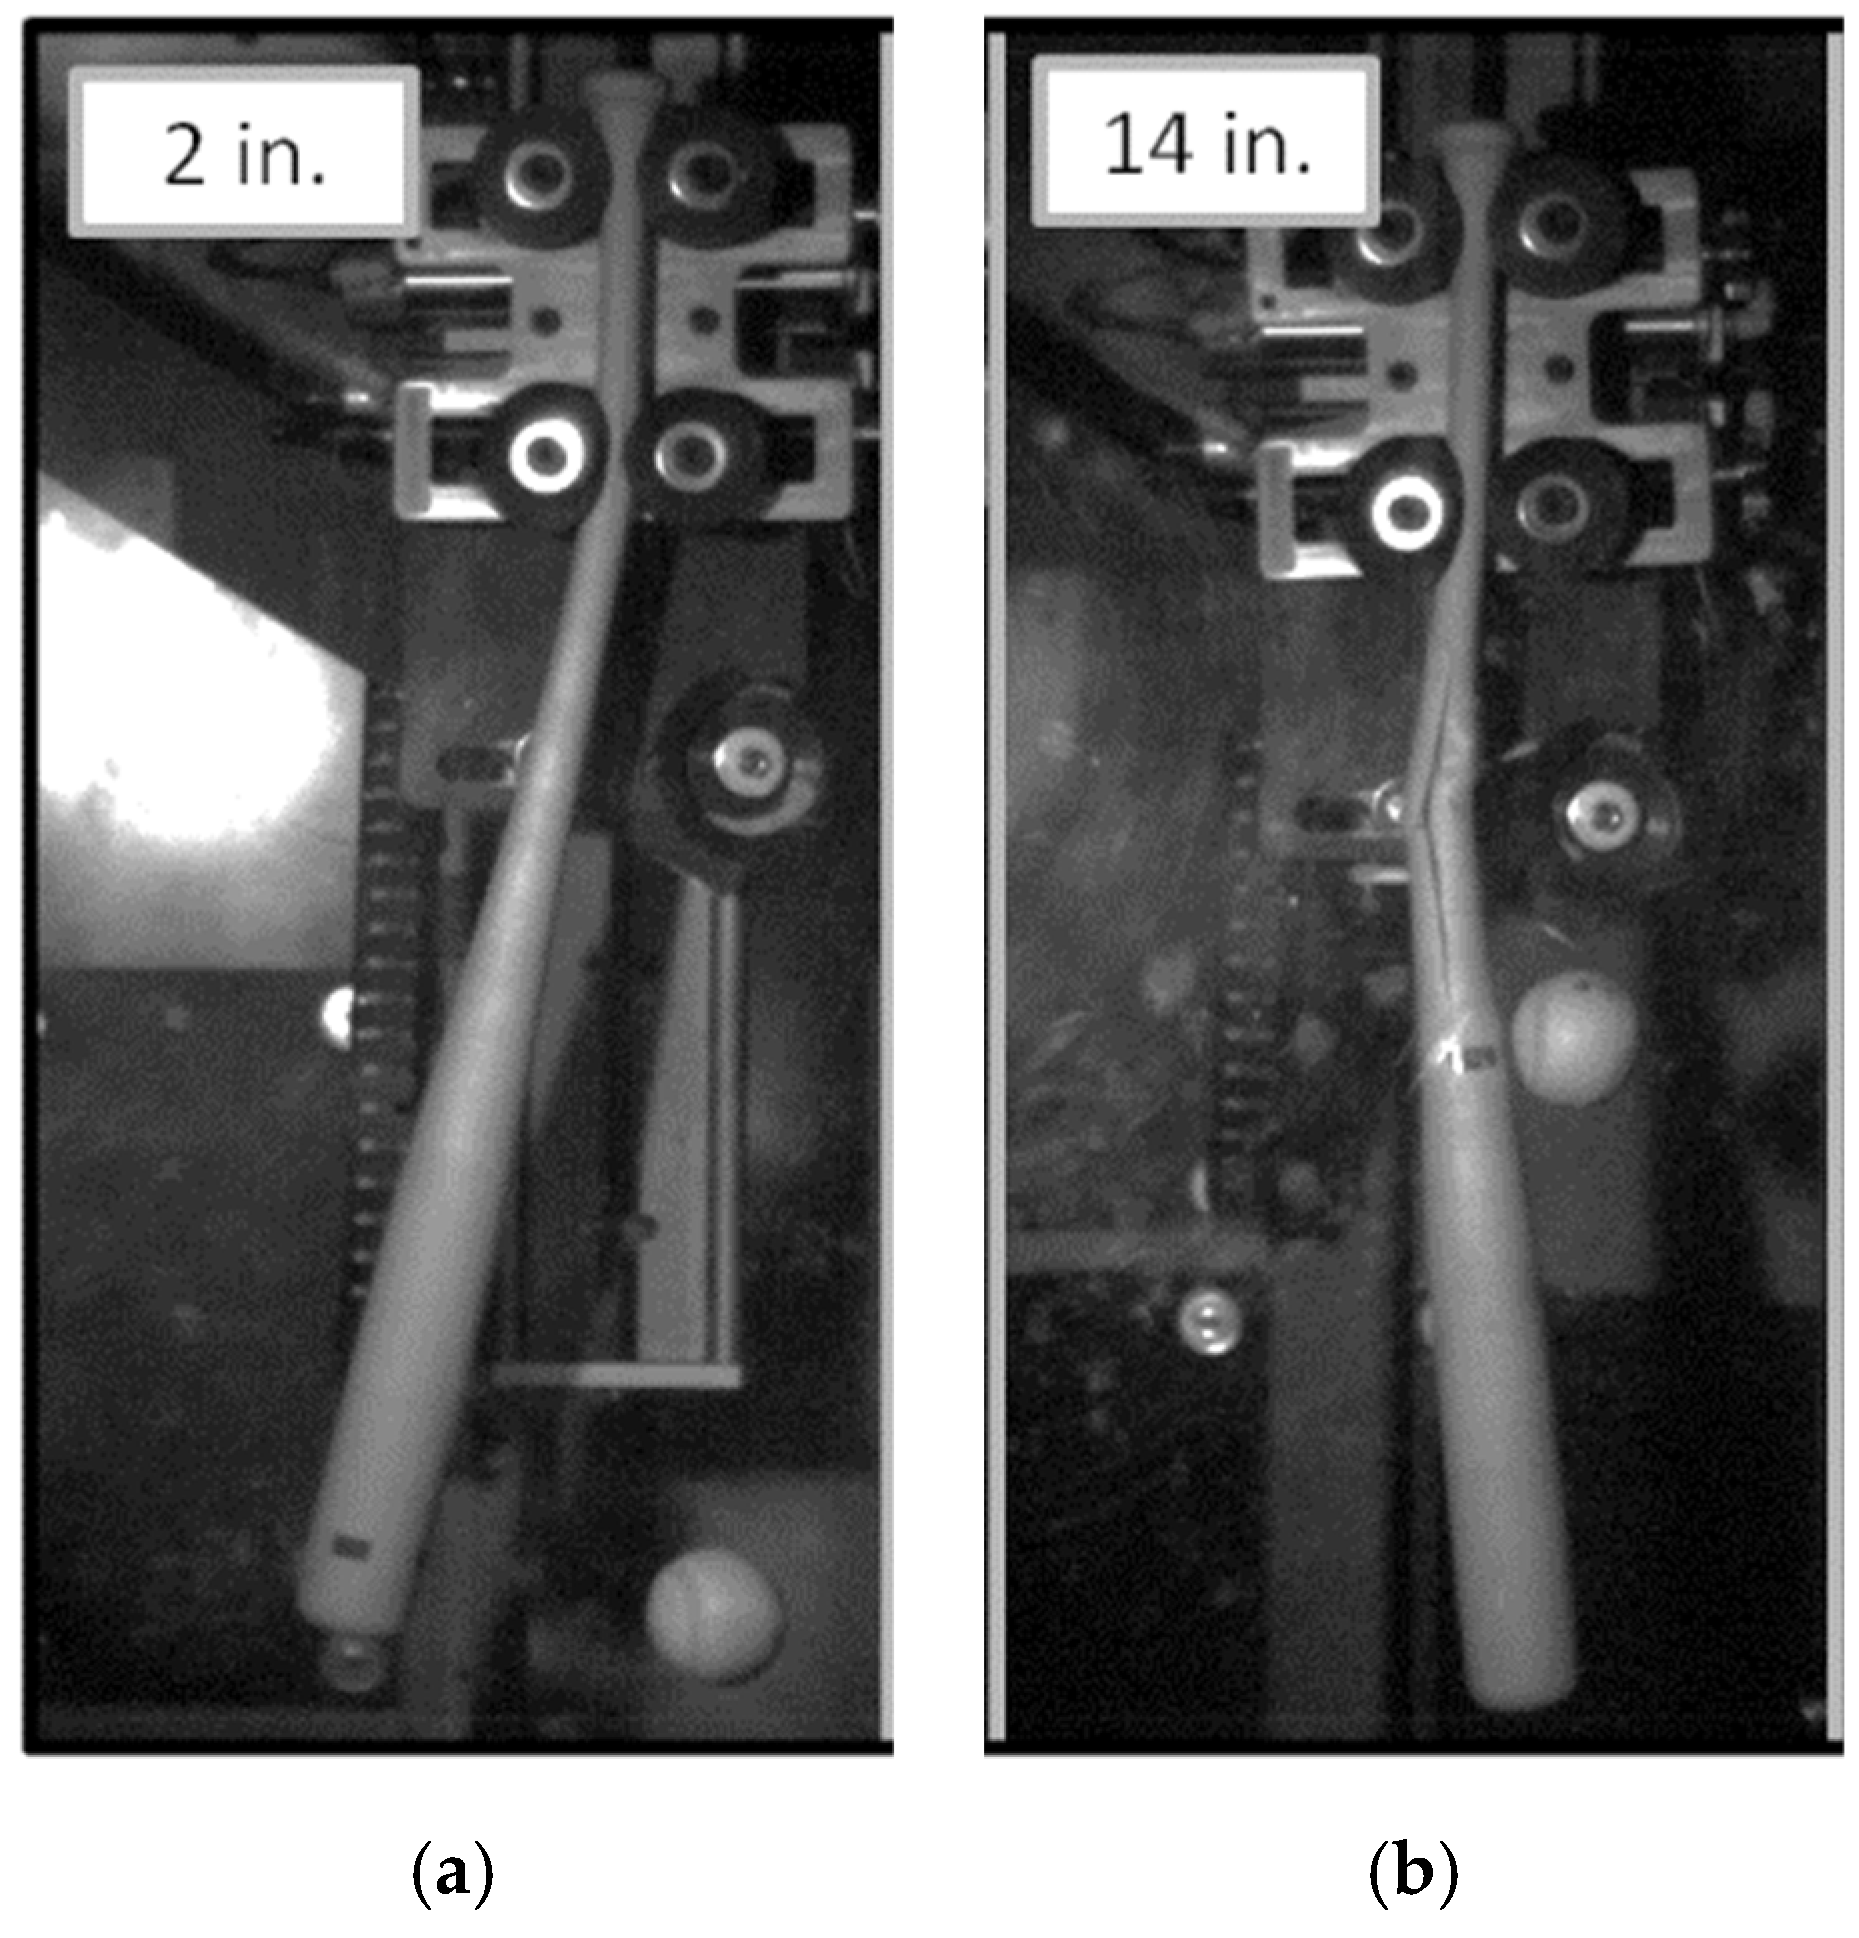
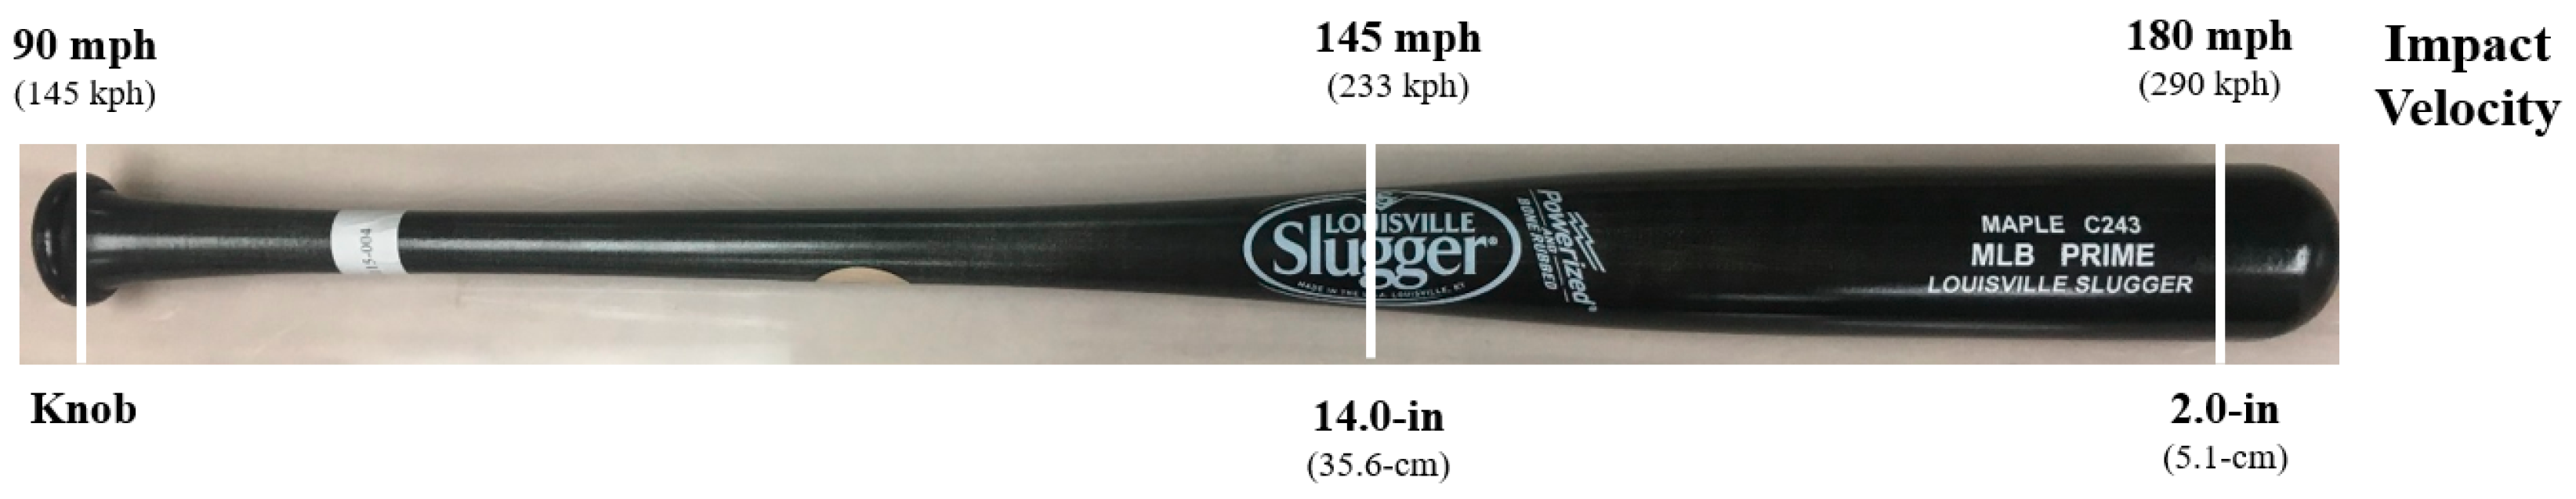
In the current paper, a popular bat profile is used in a parametric study to investigate the relationship between SoG and bat durability. During a game, the relative bat/ball impact velocity can range from 90–180 mph (145–290 kph) and is a consequence of the combination of the pitch speed, swing speed, and impact location along the length of the bat. For the purposes of this paper, bat durability is defined as the relative bat/ball speed that results in bat breakage, i.e., the higher the speed required to initiate bat cracking, the better the durability. The finite element models of this bat profile are analyzed using LS-DYNA where the variables in the parametric study include (1) SoG—ranging between ±10°, (2) Wood species—Ash, Maple, and Yellow Birch, (3) two impact locations—2.0 in. (5.1 cm) and 14.0 in. (35.6 cm) as measured from the tip of the barrel, and (4) relative bat/ball impact speeds between 90 and 180 mph (145–290 kph). This paper presents the first comprehensive numerical investigation into the relationship between SoG and bat durability. Prior to this numerical study, limited empirical data from bats broken during games and in-laboratory studies where SoG was not a controlled variable were available to imply a qualitative relationship between SoG and bat durability. The results of this study can serve as the basis for developing future parametric studies using finite element modeling to explore a large set of bat profiles and thereby to develop a deep fundamental understanding of the relationship among bat profile, wood species, wood SoG, wood density, and on-field durability.

2. Background

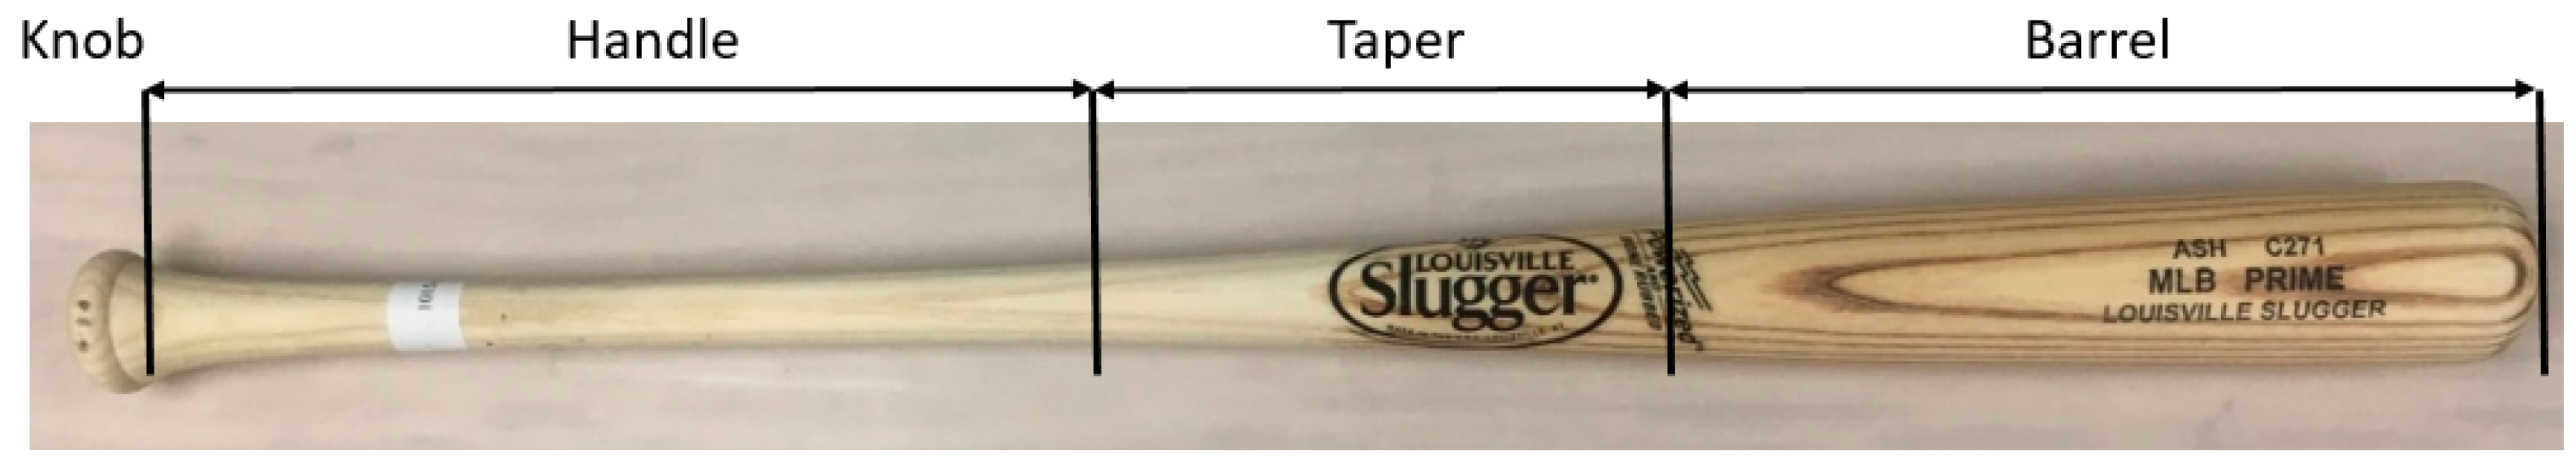
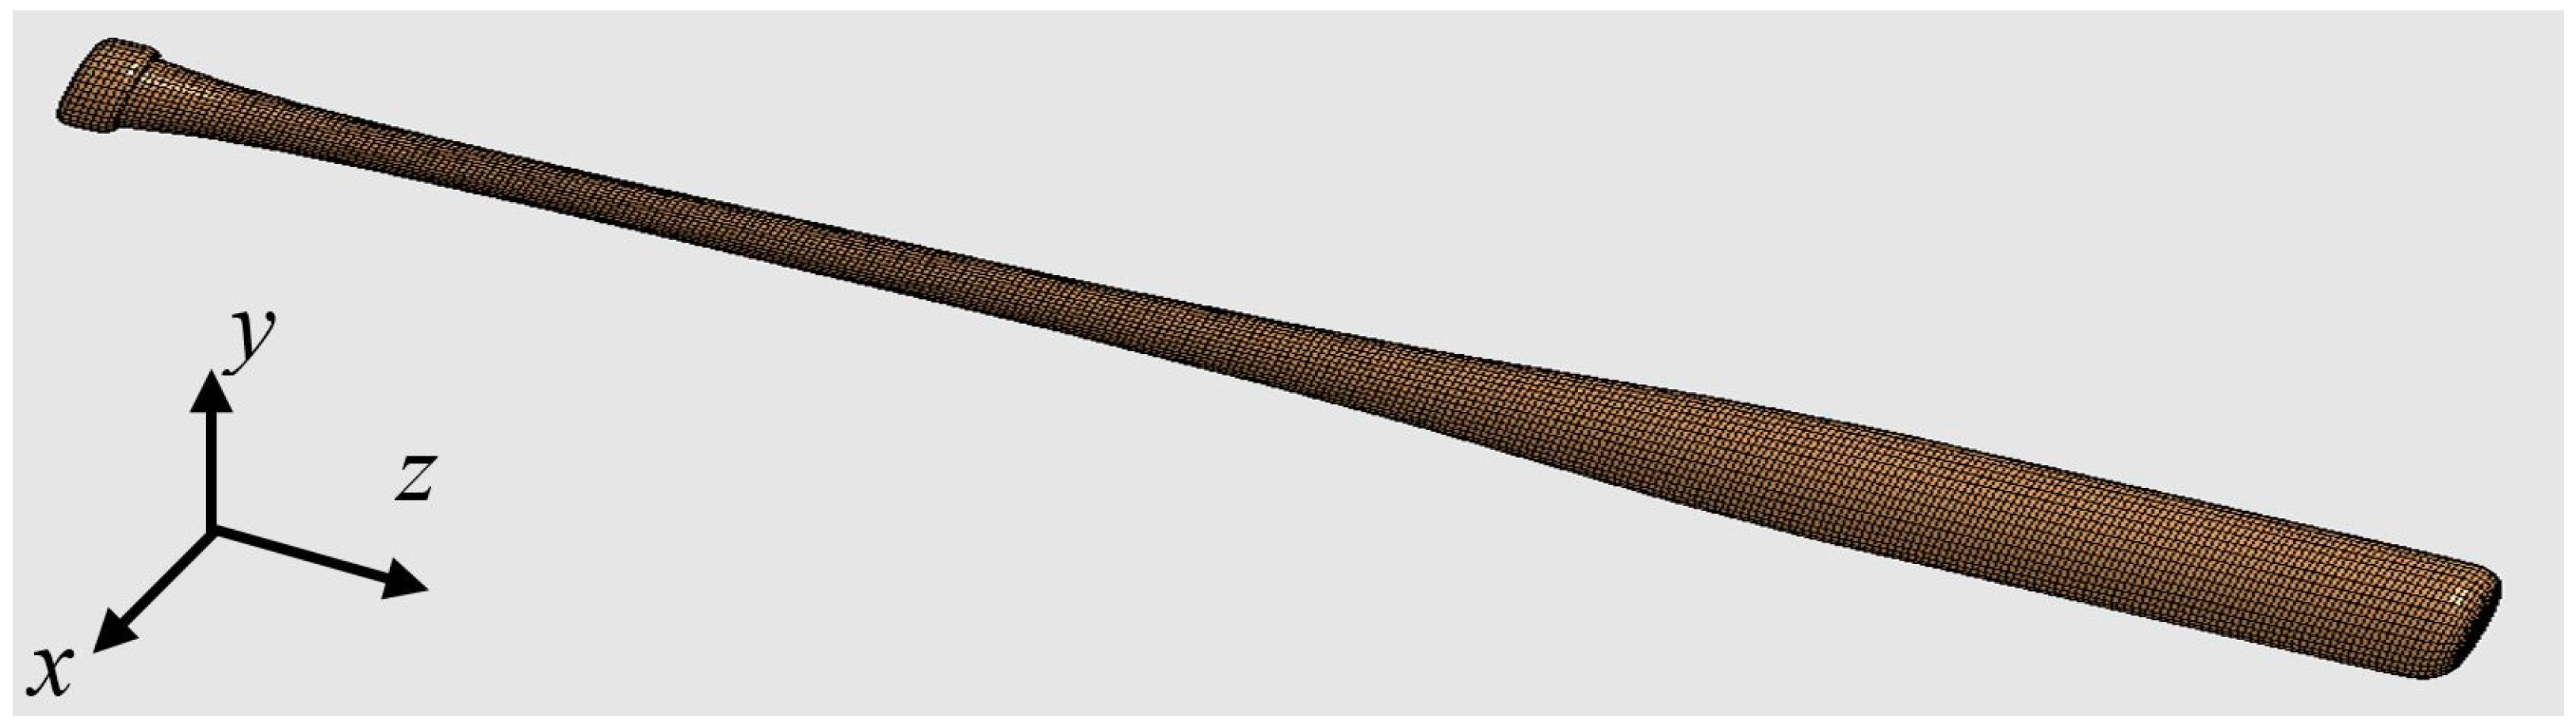
Baseball bats are comprised of four major regions, as shown in Figure 1. The barrel is the intended ball impact region. The barrel of a typical 34.0 in. (86.4 cm) long baseball bat extends from the tip of the barrel to 10.0–12.0 in. (25.4–30.5 cm) down the length of the bat. The taper region is where the diameter of the bat transitions from the large diameter of the barrel to the small diameter of the handle. The taper region of a 34.0-in. (86.4 cm) bat runs from the end of the barrel section to about 20.0 in. (50.8 cm) from the tip of the barrel. Manufacturers are required to place their company label on this region of the bat, and the location of the label should be located 90° away from the intended hitting surface of the bat such that a batter can follow the protocol of hitting with the label up or label down. The handle of a baseball bat is the section that a player grips when swinging. The handle of a 34.0 in. (86.4 cm) bat extends from the end of the taper region to about 33 in. (84 cm) from the tip of the barrel. The final ~1 in. (~2.5 cm) of a wood baseball bat is the knob, which has a diameter a bit larger than that of the grip area so as to help the player maintain his hold on the bat during the swing.
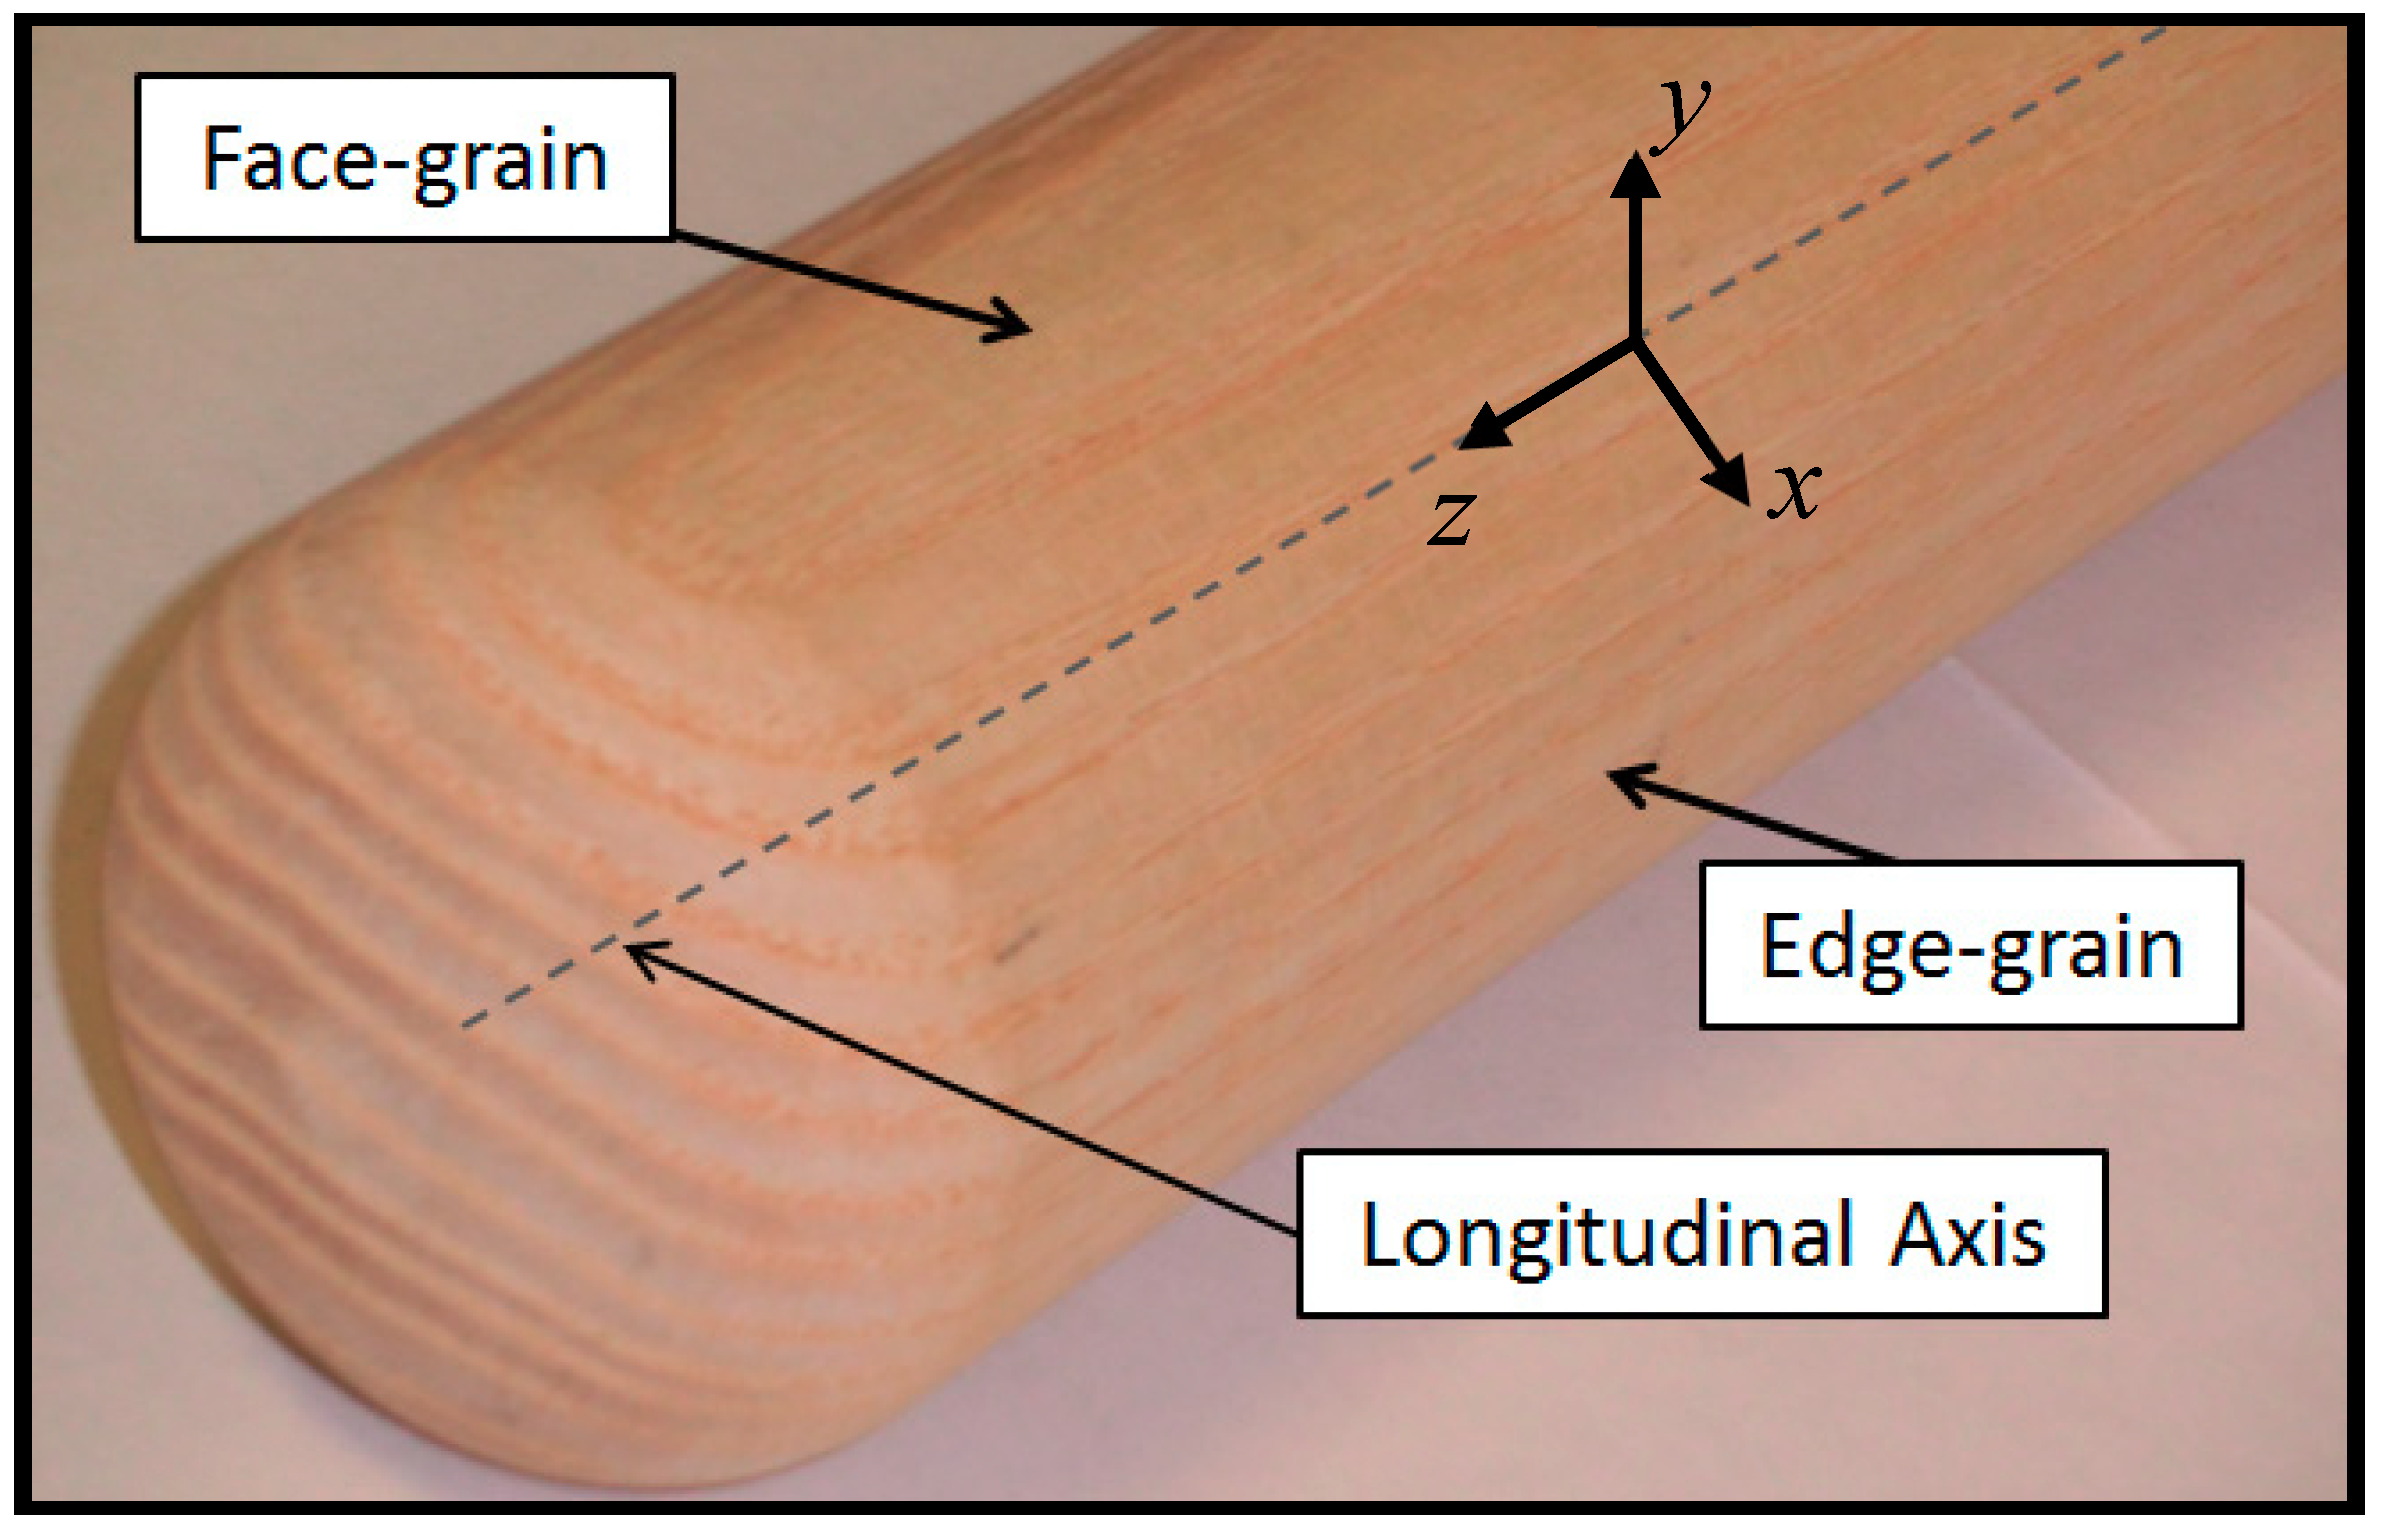
Upon the wide acceptance of northern white ash as the wood of choice, the players also settled on holding the bat such that the ball would impact the edge grain of the wood as opposed to the face grain (Figure 2). As a result, bat manufacturers located their logo on the face grain of the bat, i.e., 90° away from the edge grain. Thus, players would commonly hit with the logo up or logo down. Figure 1 shows an example of the location of the Louisville Slugger logo on the face-grain surface of an ash bat.
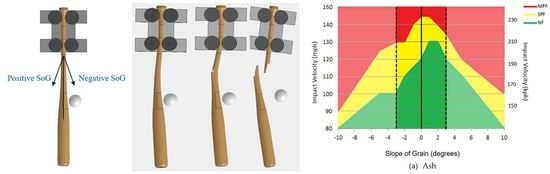
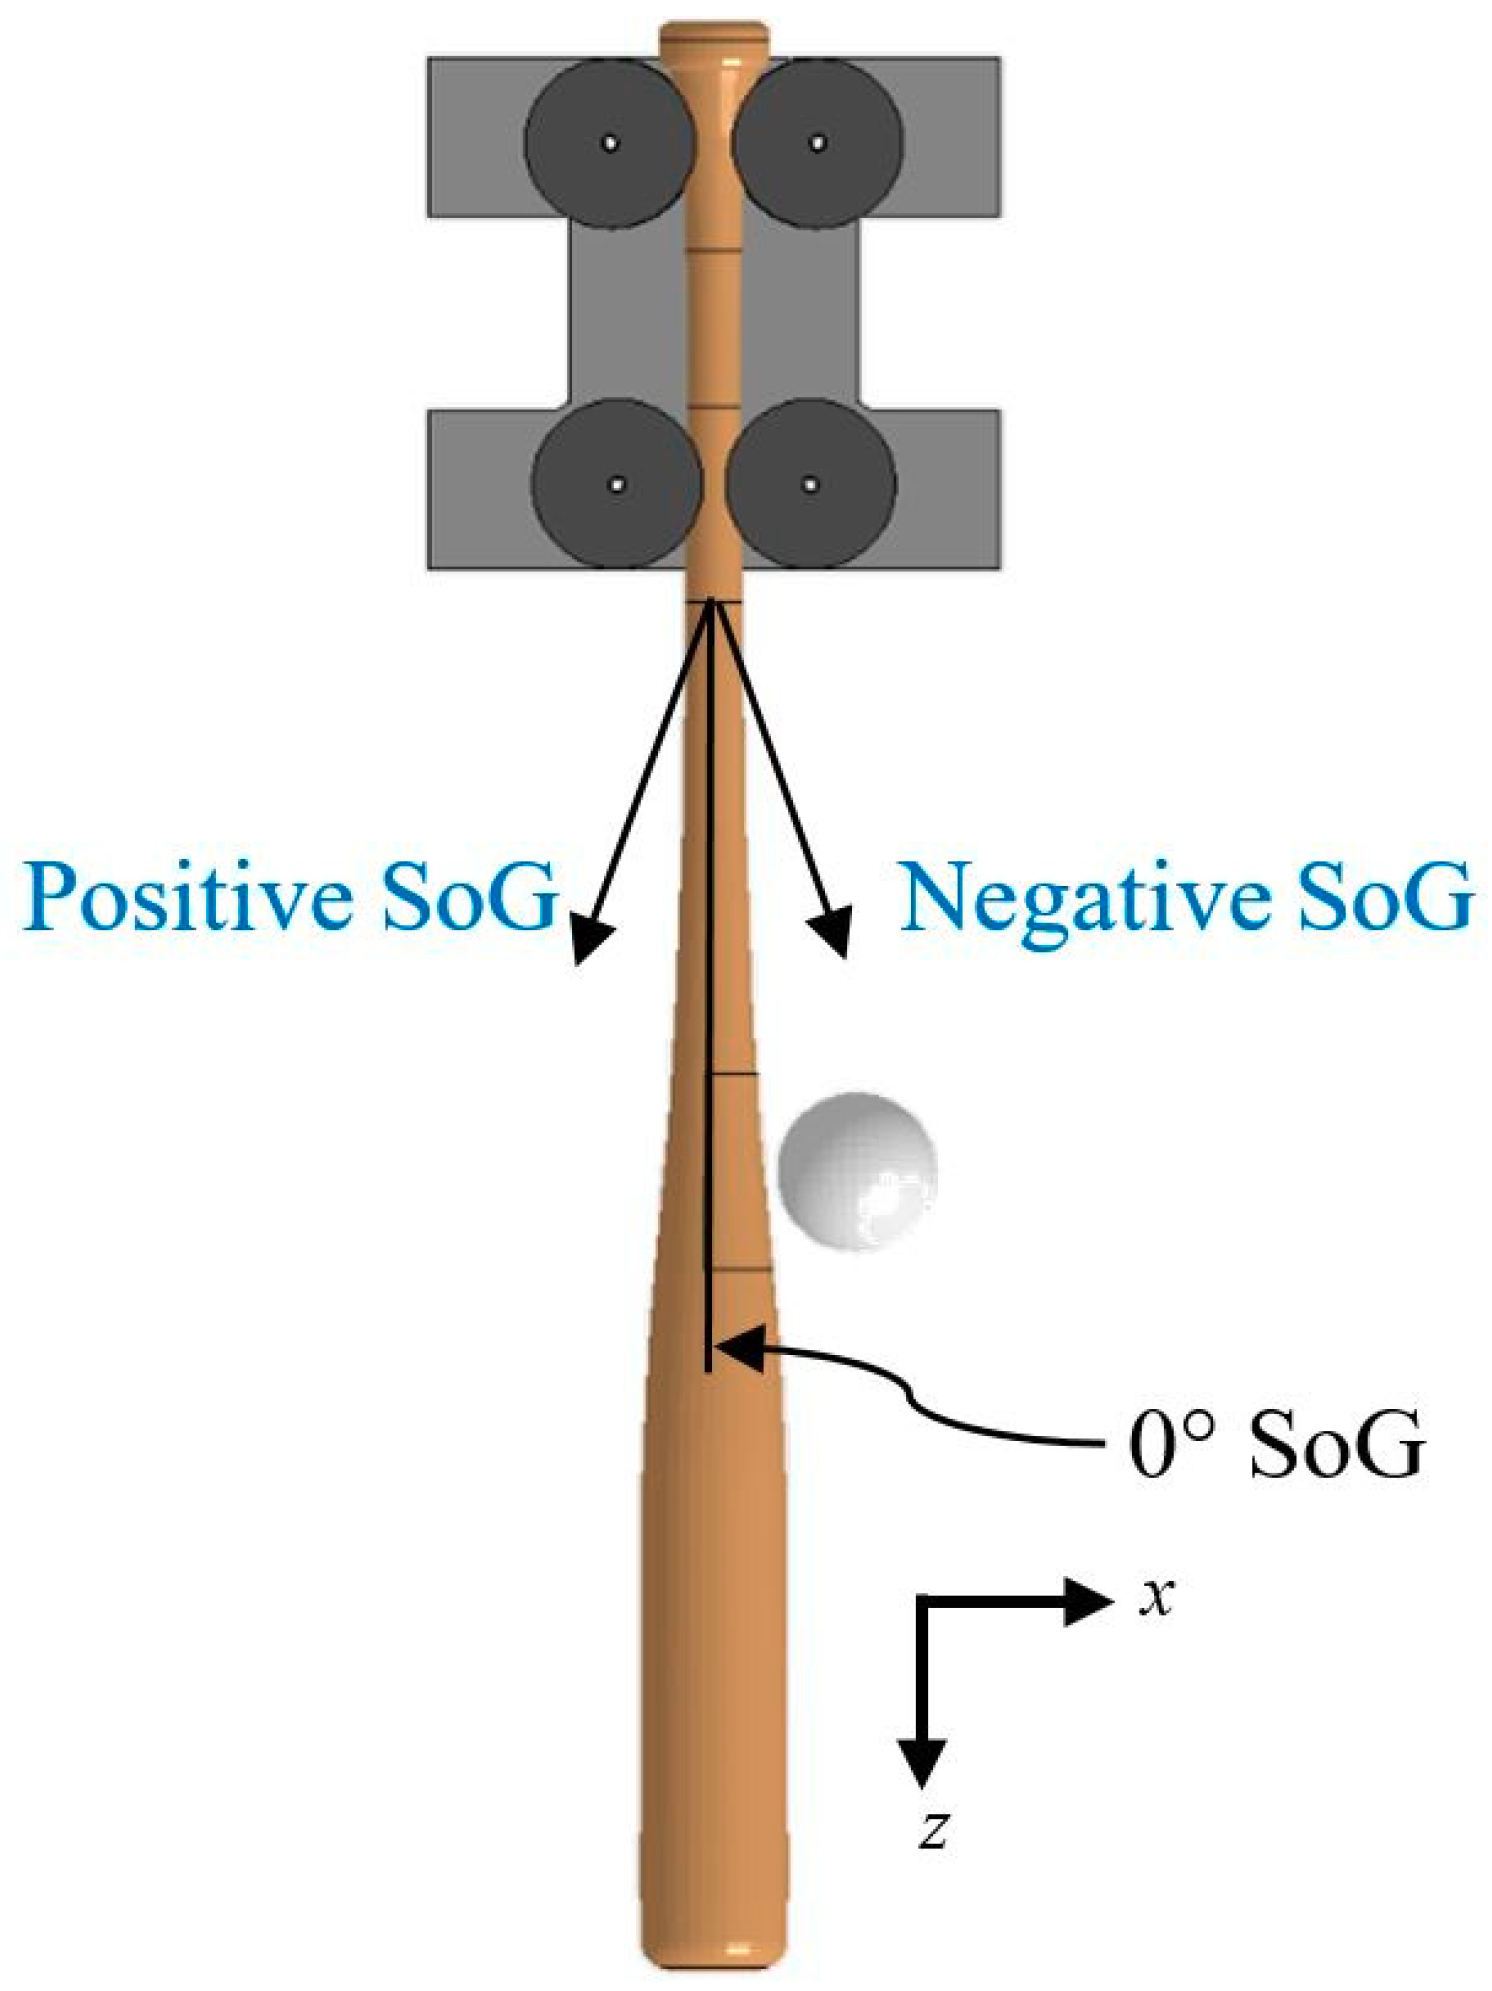
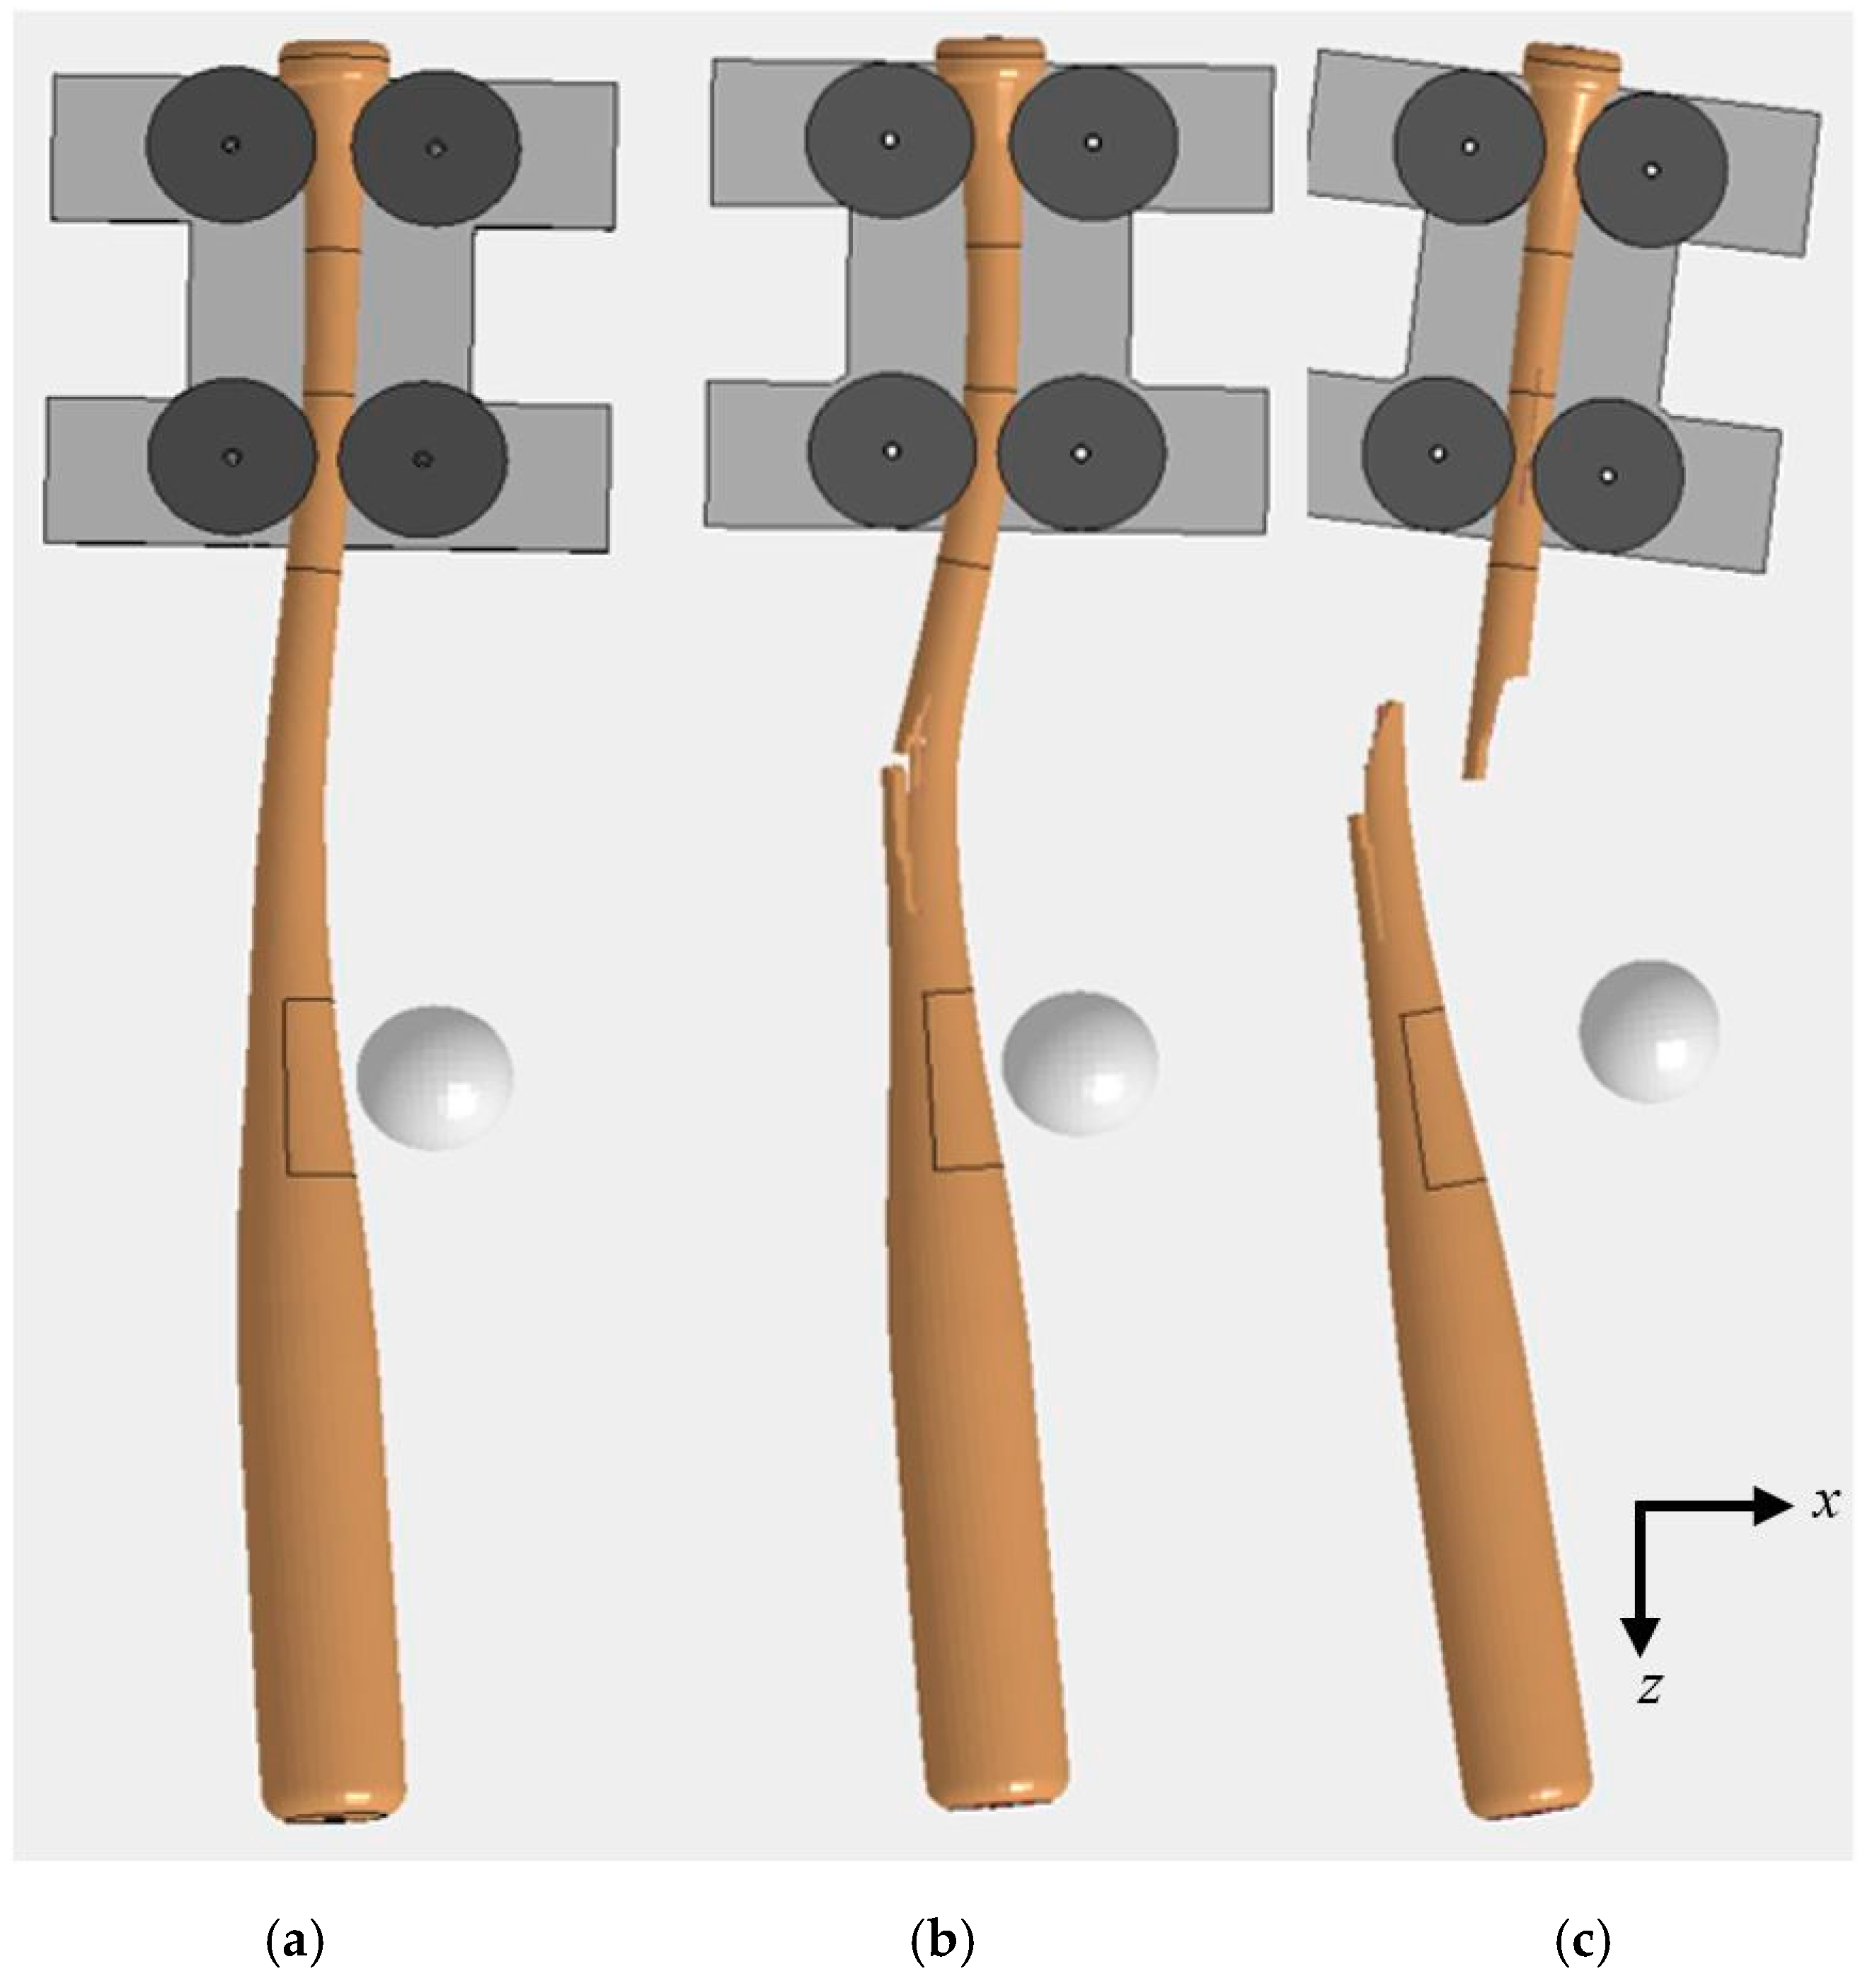
Figure 3 shows the respective directions of positive and negative SoGs for a label-up orientation of the bat and the ball traveling from the pitcher to home plate. In 
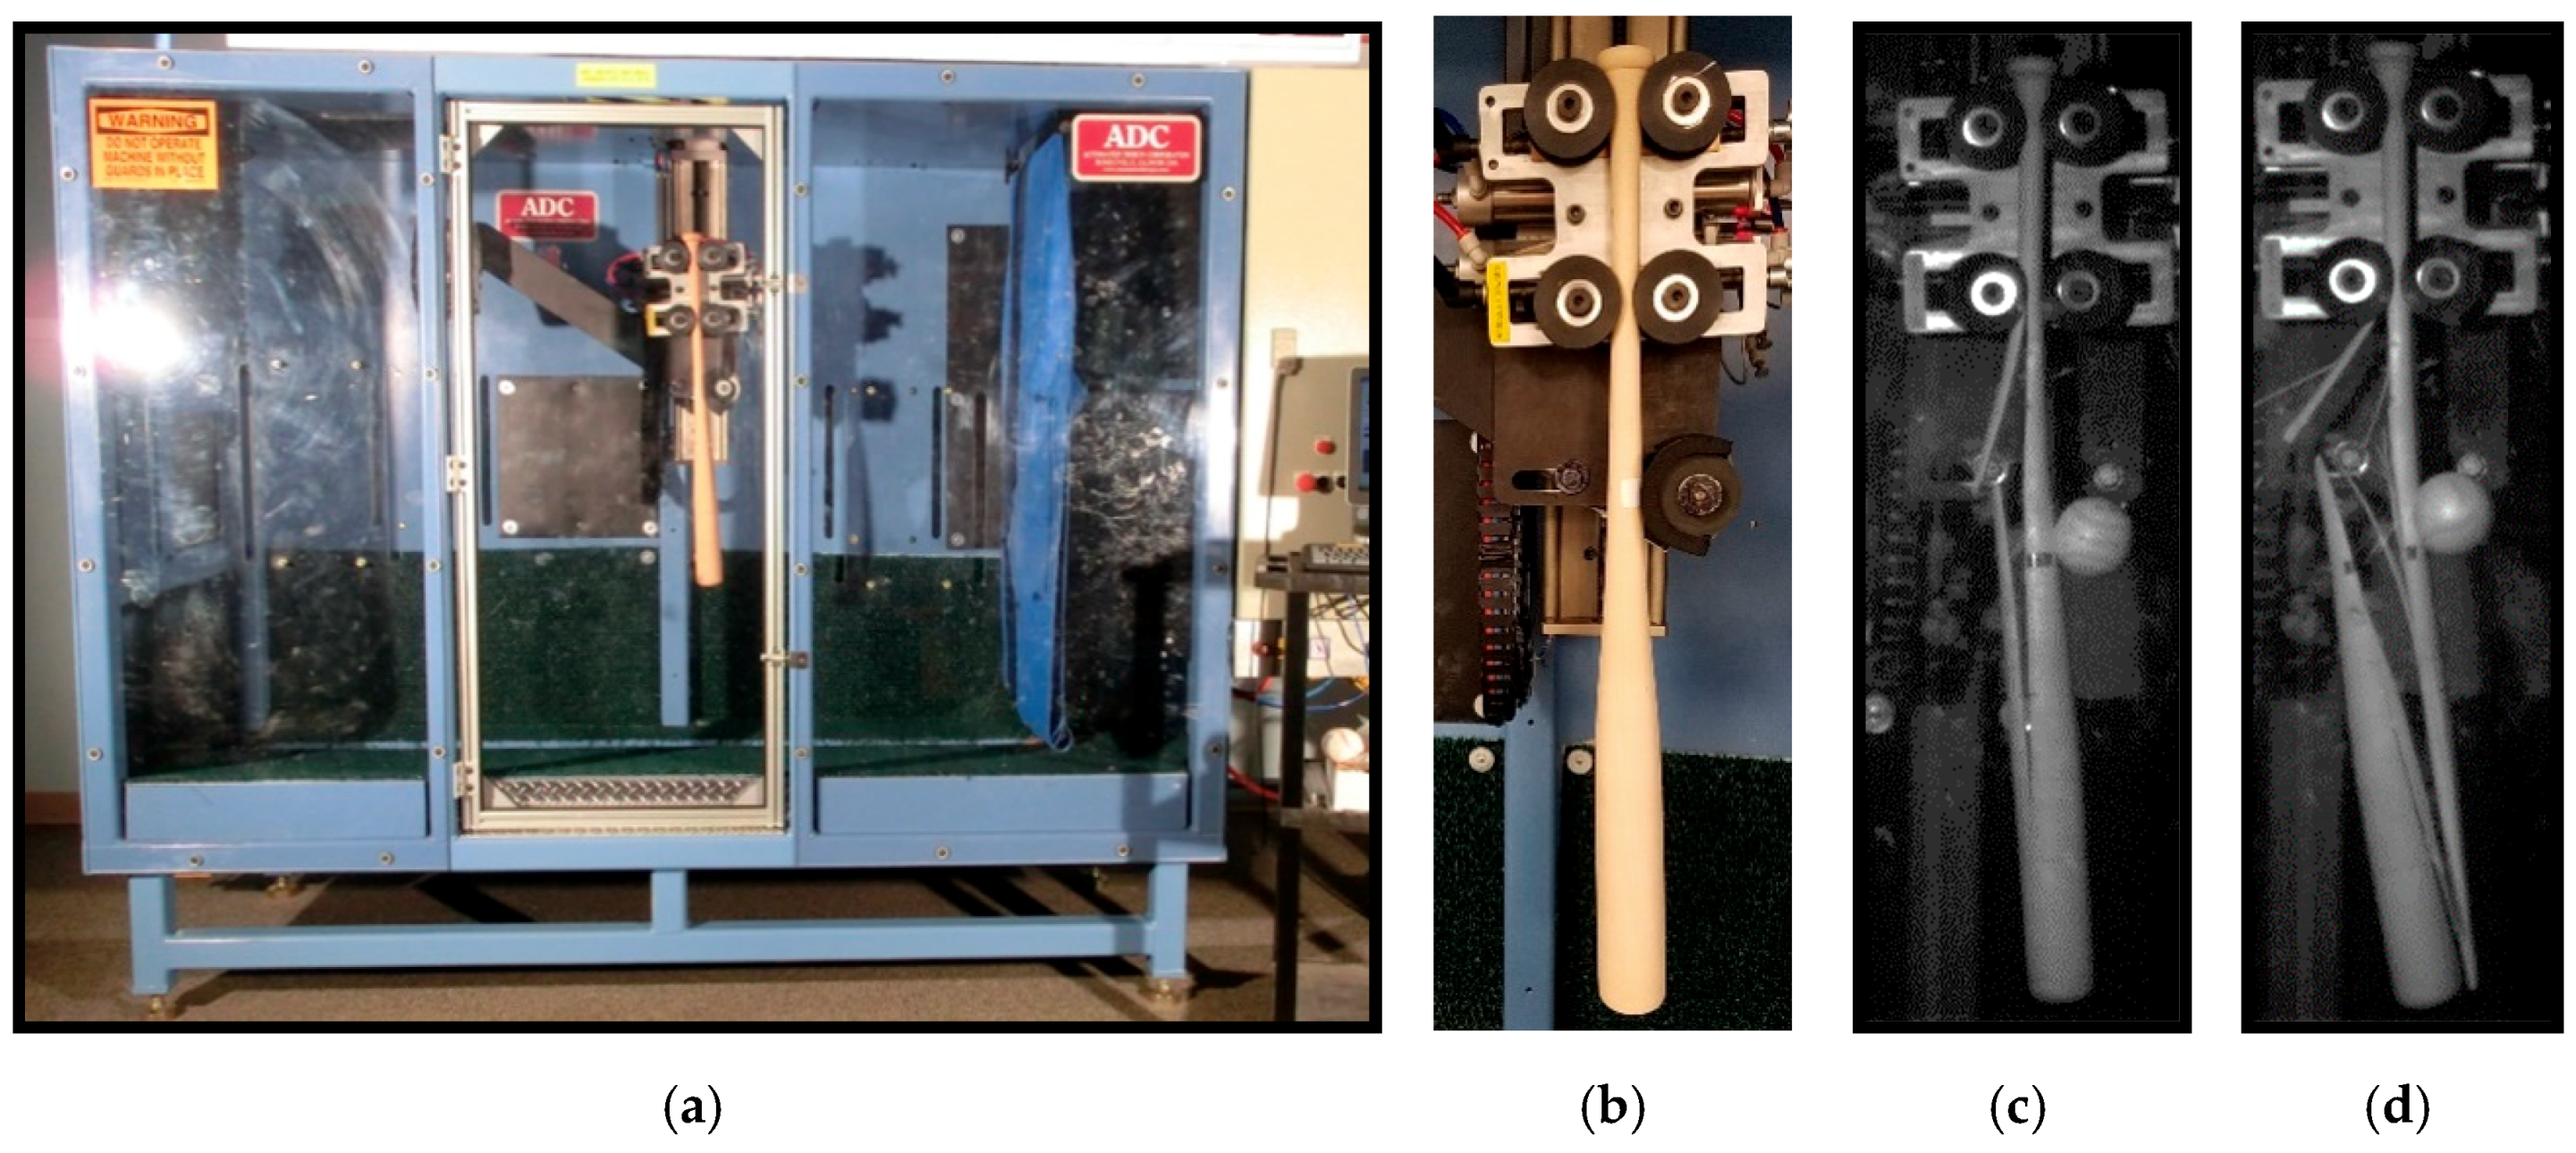
Figure 3, the bat is shown situated in a finite element model of the bat durability testing system at the University of Massachusetts Lowell Baseball Research Center (UMLBRC).
An SoG of 0°, i.e., the grain of the wood is aligned with the long axis of the bat, is alleged to be the optimal condition for bat durability. As the SoG deviates from 0°, the effective break strength, i.e., the modulus of rupture, of the wood decreases [6,9,10,
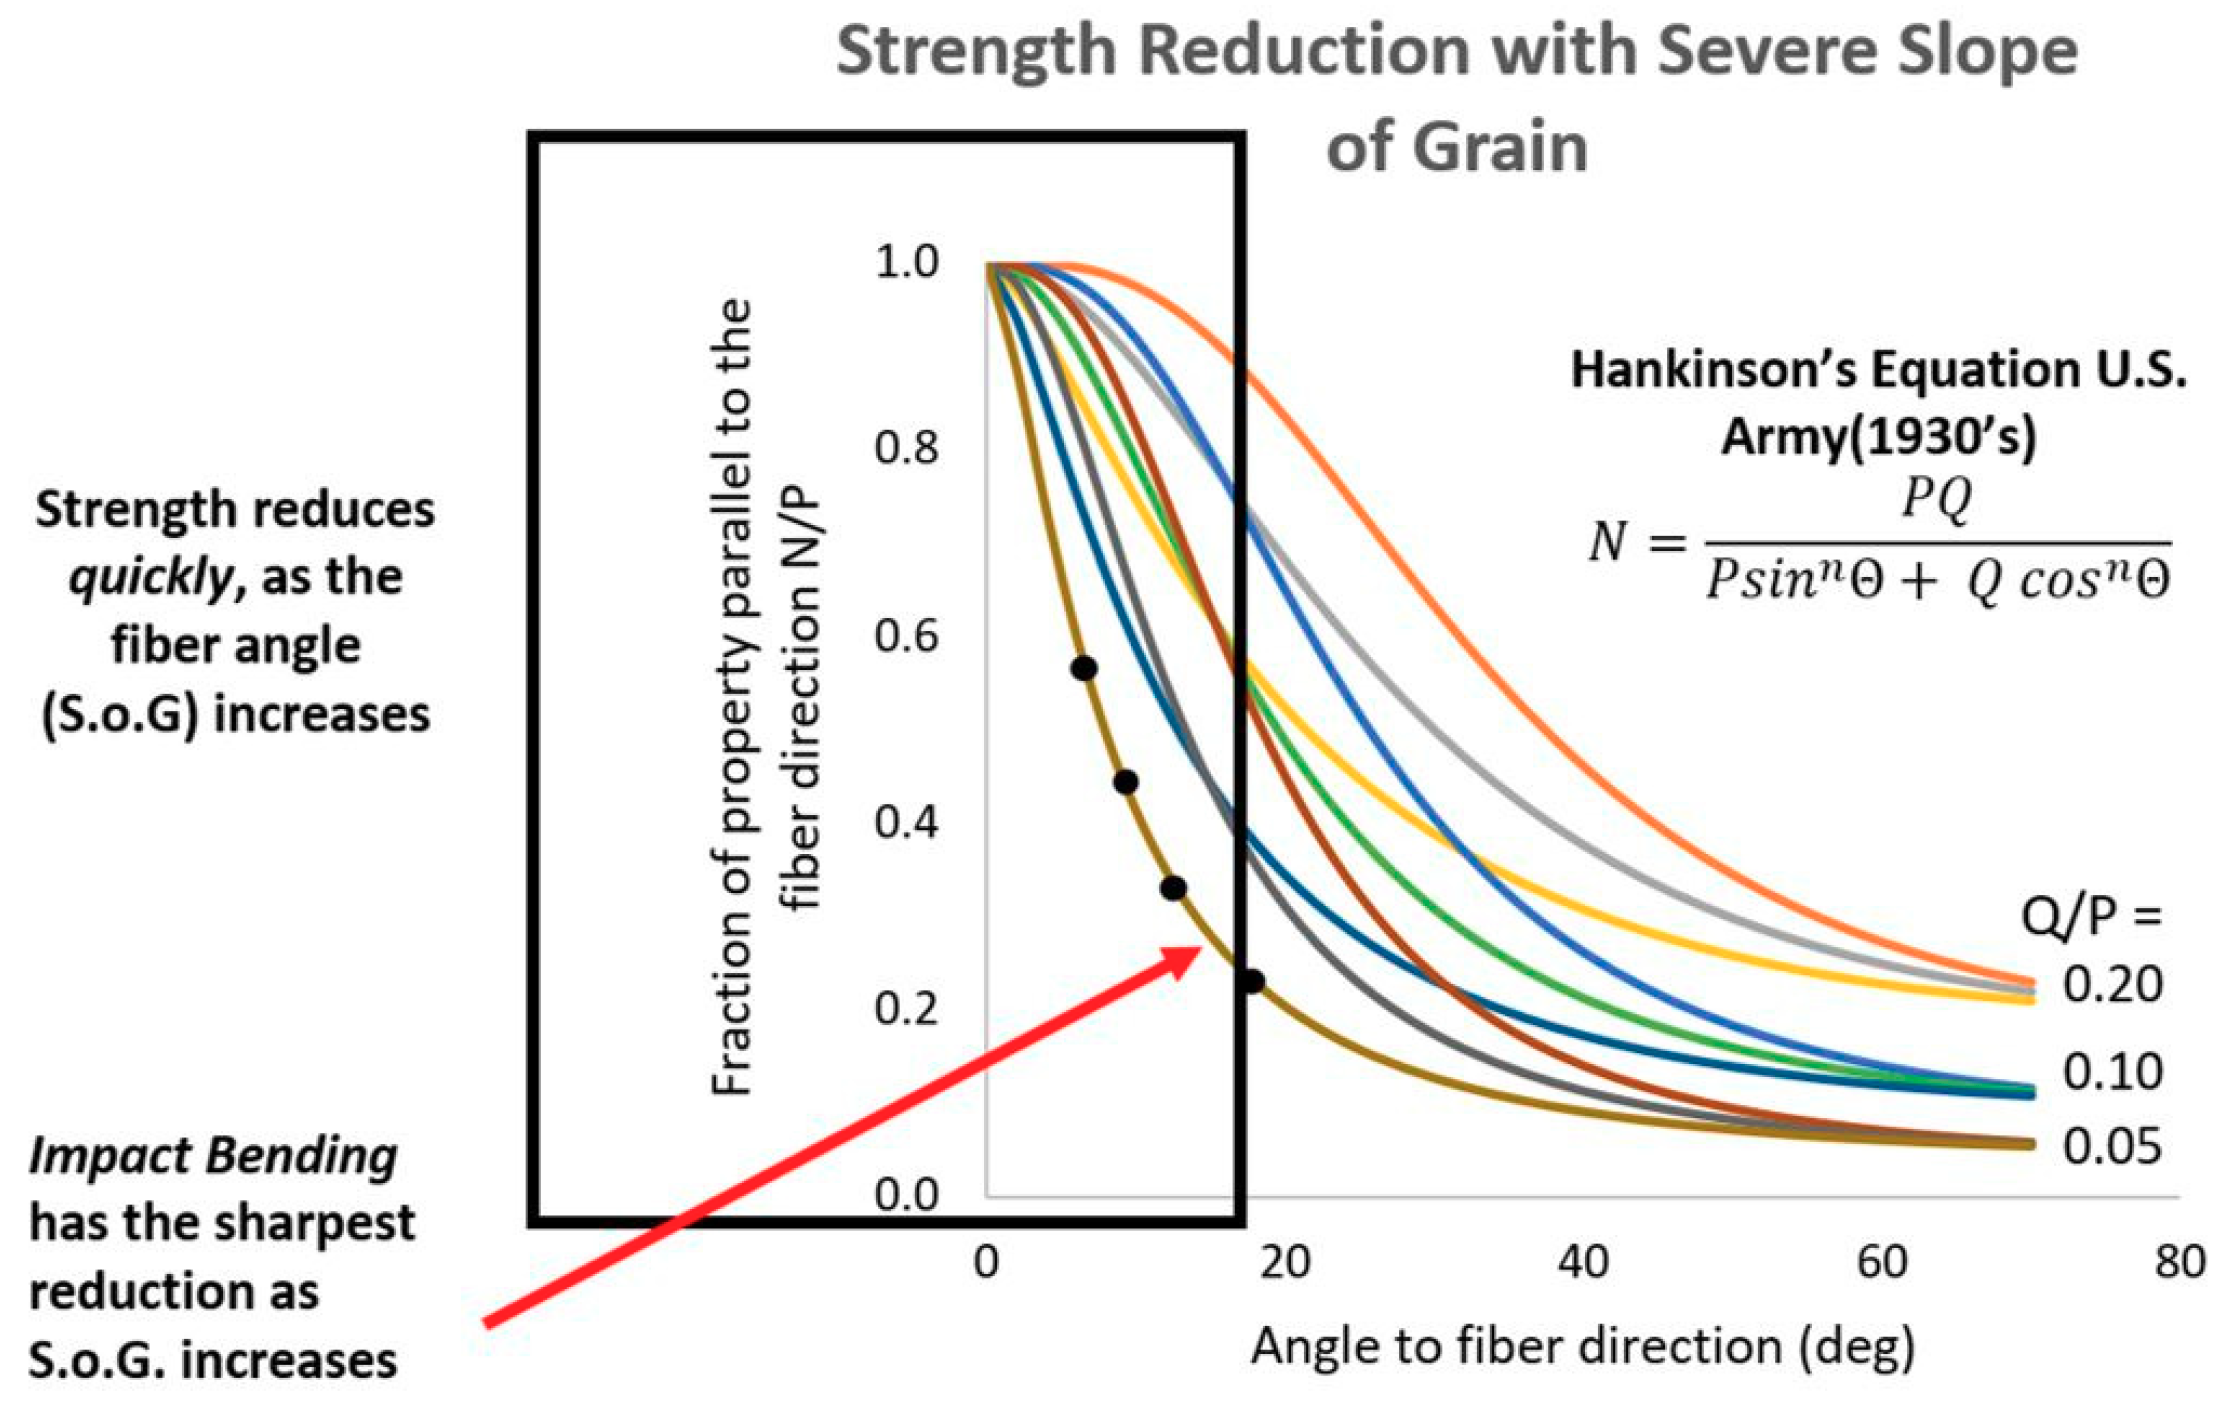
11]. Hankinson’s equation can be used to quantify the effect of SoG on wood mechanical properties,
N = PQ P sin n θ + Q cos n θ   ,
where N is the strength at an angle θ to the fiber direction, P is the strength perpendicular to the fiber, Q is the strength parallel to the fiber, and n is an empirically determined constant [10]. Different properties follow different curves (Figure 4), and these curves are average relationships developed across many species. The Wood Handbook states that the modulus of rupture (MOR) falls very close to the curve Q/P = 0.1 and n = 1.5. Using these values, the Hankinson Equation for a 3° SoG results in N = 0.895, meaning that the strength of a 3° SoG specimen is 89.5% of a specimen with a 0° SoG.
The MOR curve in Figure 4 shows that an SoG of ±10° will result in a 60% drop in MOR—thus, the motivation to tighten the allowable SoG range to be ±3°. The motivation for the change in hitting surface was based on the knowledge that the impact resistance of maple, a diffuse porous wood, is better on the face grain than on the edge grain. This behavior is opposite to the impact durability of northern white ash, a ring porous wood species, which demonstrates superior durability when impacted on the edge grain face [12]. Recent Charpy testing of wood corroborated these differences in the hitting surfaces for ash and maple [6]. The tighter tolerance on the allowable SoG and the change in the hitting surface for maple from the edge to face grain for the 2009 season contributed to the rate of MPFs decreasing by 30% from what was observed in 2008 [13].

3. Materials and Methods

In this section, the basic topics which are relevant to the current finite element modeling studies are presented. These topics include a discussion on the lab testing for wood-bat durability, the single-piece failure (SPF) and a multi-piece failure (MPF) modes, and basic material properties for the ash, maple and yellow birch wood species.

3.1. Wood Bat Durability Testing

The UMLBRC uses a Bat Durability System (Automated Design Corporation, Romeoville, IL, USA) (Figure 5a,b) to investigate bat durability. Two pairs of compliant rollers hold a stationary bat and simulate the grip of the batter. At the knob end, the top set of rollers are firm to hold the bat in place while the bottom roller set is soft rubber and is loosely touching the bat handle. Previous work concluded that this setup in the Bat Durability System was representative of a player’s grip of the baseball bat in the field [14]. A burp air cannon shoots baseballs toward the bat at speeds up to 200 mph (322 kph). The position of the bat can be raised or lowered such that the bat/ball impact can be programmed to occur anywhere along the length of the bat. A typical bat durability test commences with a speed known to be below the bat breaking speed for the axial position of interest, e.g., a hit on the taper that is 14.0 in. (35.6 cm) from the tip of the barrel (inside-pitch condition). The speed is then increased in increments of ~5 mph (~8 kph) on each subsequent hit. The test ends after the bat breaks, and the speed that induced either the MPF or SPF is used to quantify the bat durability. For this investigation, fatigue effects do not need to be considered because the bat breaking occurs within a range of 1 to 15 impacts. A detailed description of the bat durability testing process is given in Ruggiero et al. [15,16].

3.2. Modes of Wood Bat Failure

Bat breaks are classified as either a single-piece failure (SPF) or multi-piece failure (MPF). An SPF of a wood baseball bat occurs when the bat cracks but does not break into multiple large pieces. A large piece is defined to weigh 1.00 oz. (28.4 g) or more. An SPF type of failure is preferred over an MPF because the bat remains intact, and no fragments of the bat leave the batter’s hands. Figure 5c shows an example of an SPF, for which a crack initiated but did not propagate either fully across the diameter of the bat or fully down the length of the bat. An MPF of a wood baseball bat occurs when the bat breaks into two or more large pieces. This type of failure is undesirable, as large and potentially sharp fragments can split from the bat and fly into the field or into spectator areas. Figure 5d shows an example of an MPF where a crack propagated down the length of the bat and almost entirely across the width of the bat along a diagonal line.

3.3. Finite Element Models

All finite element analyses were completed using LS-DYNA (Livermore Software Technology Corporation, Livermore, CA, USA), and all finite element models used for this research were constructed using HyperMesh (Altair Engineering, Inc. Troy, MI, USA) and post-processed in LS‑Prepost (Livermore Software Technology Corporation. Livermore, CA, USA). The finite element models of (1) a popular bat profile used by professional players (C243), (2) a baseball, and (3) the bat fixture of the Bat Durability System were constructed individually and then combined into a full model of a bat being tested at the UMLBRC for durability (Figure 6) [6]. Models were analyzed for a range of impact velocities that spanned from 90 mph to 180 mph (145 kph to 290 kph) in 5 mph (8 kph) increments, three wood species (ash, maple, and yellow birch) and wood SoGs between ±10° to investigate and to quantify how the SoG influences bat durability for variations in wood species and bat/ball impact speeds. The SoG’s used in the models were −10°, −5°, −3°, −2°, −1°, 0°, 1°, 2°, 3°, 5°, and 10°. To validate the finite element models, a series of mechanical tests were performed. Four-point bending tests of the maple and ash wood were done to obtain elastic moduli and strength properties. Charpy testing was conducted to determine the strain-to-failure as a function of wood density [6,7].
The bat model was constructed to the geometry of an uncupped C243 baseball bat profile. The finite element model was constructed using 8-noded brick elements with single Gauss-point integration. The LS-DYNA *MAT_WOOD (material model #143) definition has previously been demonstrated to be an effective material model for the simulation of wood structures under dynamic loading [17] and is used in this study for modeling the material behaviors of ash, maple, and yellow birch. The geometry of the C243 finite element model is shown in Figure 6. This model of a C243 bat profile is comprised of 179533 nodes and 159984 elements, with a mean mesh size of 0.2 in (0.4920 cm). This element size was concluded by completing a convergence study.
For this study, the wood density and specific wood-species material properties of the bat models were held constant throughout all of the models. The material properties for each wood species as they are provided in the LS-DYNA Keyword input file came from empirical testing and are summarized in Table 1. All models were prescribed a density of 0.0245 lb/in3 (678 Kg/m3), thereby resulting in a 33.0-oz (936‑g) bat. The 0.0245 lb/in3 (678 Kg/m3) density was chosen because it is currently the lowest density that is permitted by MLB for maple bats.
The SoG of the wood was varied between −10° and +10°. One of the required inputs for the *MAT_WOOD material model in LS-DYNA is the specification of the direction cosines (AOPT values) for the orientation of the wood [18]. These direction cosines allow for easily prescribing the SoG of the wood and have been shown to reliably predict impact velocity of bat failure, location of bat failure, and a mode of bat failure [18]. Both positive and negative wood SoG cases were modeled to see if there were any differences due to a plus or minus direction of the SoG (Figure 3) on the failure mode and/or durability of the bat.

3.4. Wood Failure Criteria

The three outcomes that are evaluated in the post-processing of the finite element models are (1) no failure, (2) single-piece failure, and (3) multi-piece failure (Figure 7). For each of these modes to be accurately captured by the finite element model, the failure criterion must work in combination with the wood material model to integrate the failure mechanism(s) that initiate and propagate bat breakage with the wood mechanical behavior. The two wood failure options that have been previously explored by the authors are (1) using the failure stress feature in *MAT_WOOD and (2) the *MAT_ADD_EROSION option in LS-DYNA with the strain-to-failure varied as a function of density [6,8,12,19]. The second option was found to correlate well with bat durability testing results and thus is the better choice for the breaking of the bats in the simulations [8,19]. The respective strain-to-failure for the wood density of 0.0245 lb/in3 (678 Kg/m3) for each of the wood species in this study is 0.0258 for ash, 0.0236 for maple, and 0.0231 for yellow birch.

3.5. Impact Locations

For this study, two impact locations were analyzed, specifically the 2.0 in. (5.1 cm) and 14.0 in. (35.6 cm) locations as measured from the tip of the barrel of the bat (Figure 8). These two impact locations have been observed to be critical locations for bats breaking in MLB games. Impacts at the 2.0 in. (5.1 cm) and 14.0 in. (35.6 cm) locations are away from the nodes associated with the first and second bending modes of vibration, and as a result, induce large amplitudes of vibration along the length of the bat. These high amplitudes translate to large strains, and hence, the potential for bat breakage.

3.6. Impact Velocity

The range of velocities used for this study spanned 90–180 mph (145–290 kph) depending on the impact location of the ball. For the 14.0 in. (35.6 cm) impact model, the velocity range was 90–145 mph (145–233 kph) which corresponds to a 60–100% maximum velocity impact assuming a 90 mph (145 kph) pitch and 90-mph (145 kph) swing speed as measured 2.0 in (5.1 cm) from the tip of the bat rotating about an axis 6.0 in. from the knob to represent the pivot point of the bat in a player’s hands during a swing. Using the same methodology, the 2.0 in. (5.1 cm) impact model set had an expanded velocity range up to 180 mph (290 kph) as this velocity corresponds to a maximum 100% velocity impact at the 2.0 in. (5.1 cm) location assuming a 90 mph (145 kph) pitch and 90 mph (145 kph) swing speed. Figure 9 provides a visualization of the impact locations and the respective maximum impact speed.

4. Results

The results of the finite element simulations for a range of wood SoGs were analyzed to investigate the mode of failure and durability as a function of the combination of SoG, impact velocity, wood species, and impact location. For each of the three wood species, 275 simulations were run, i.e., 176 simulations for 2.0 in. (5.1 cm) impact and 99 simulations for 14.0 in. (35.6 cm) impact. In total, 825 bat/ball impact simulations were run for this study.
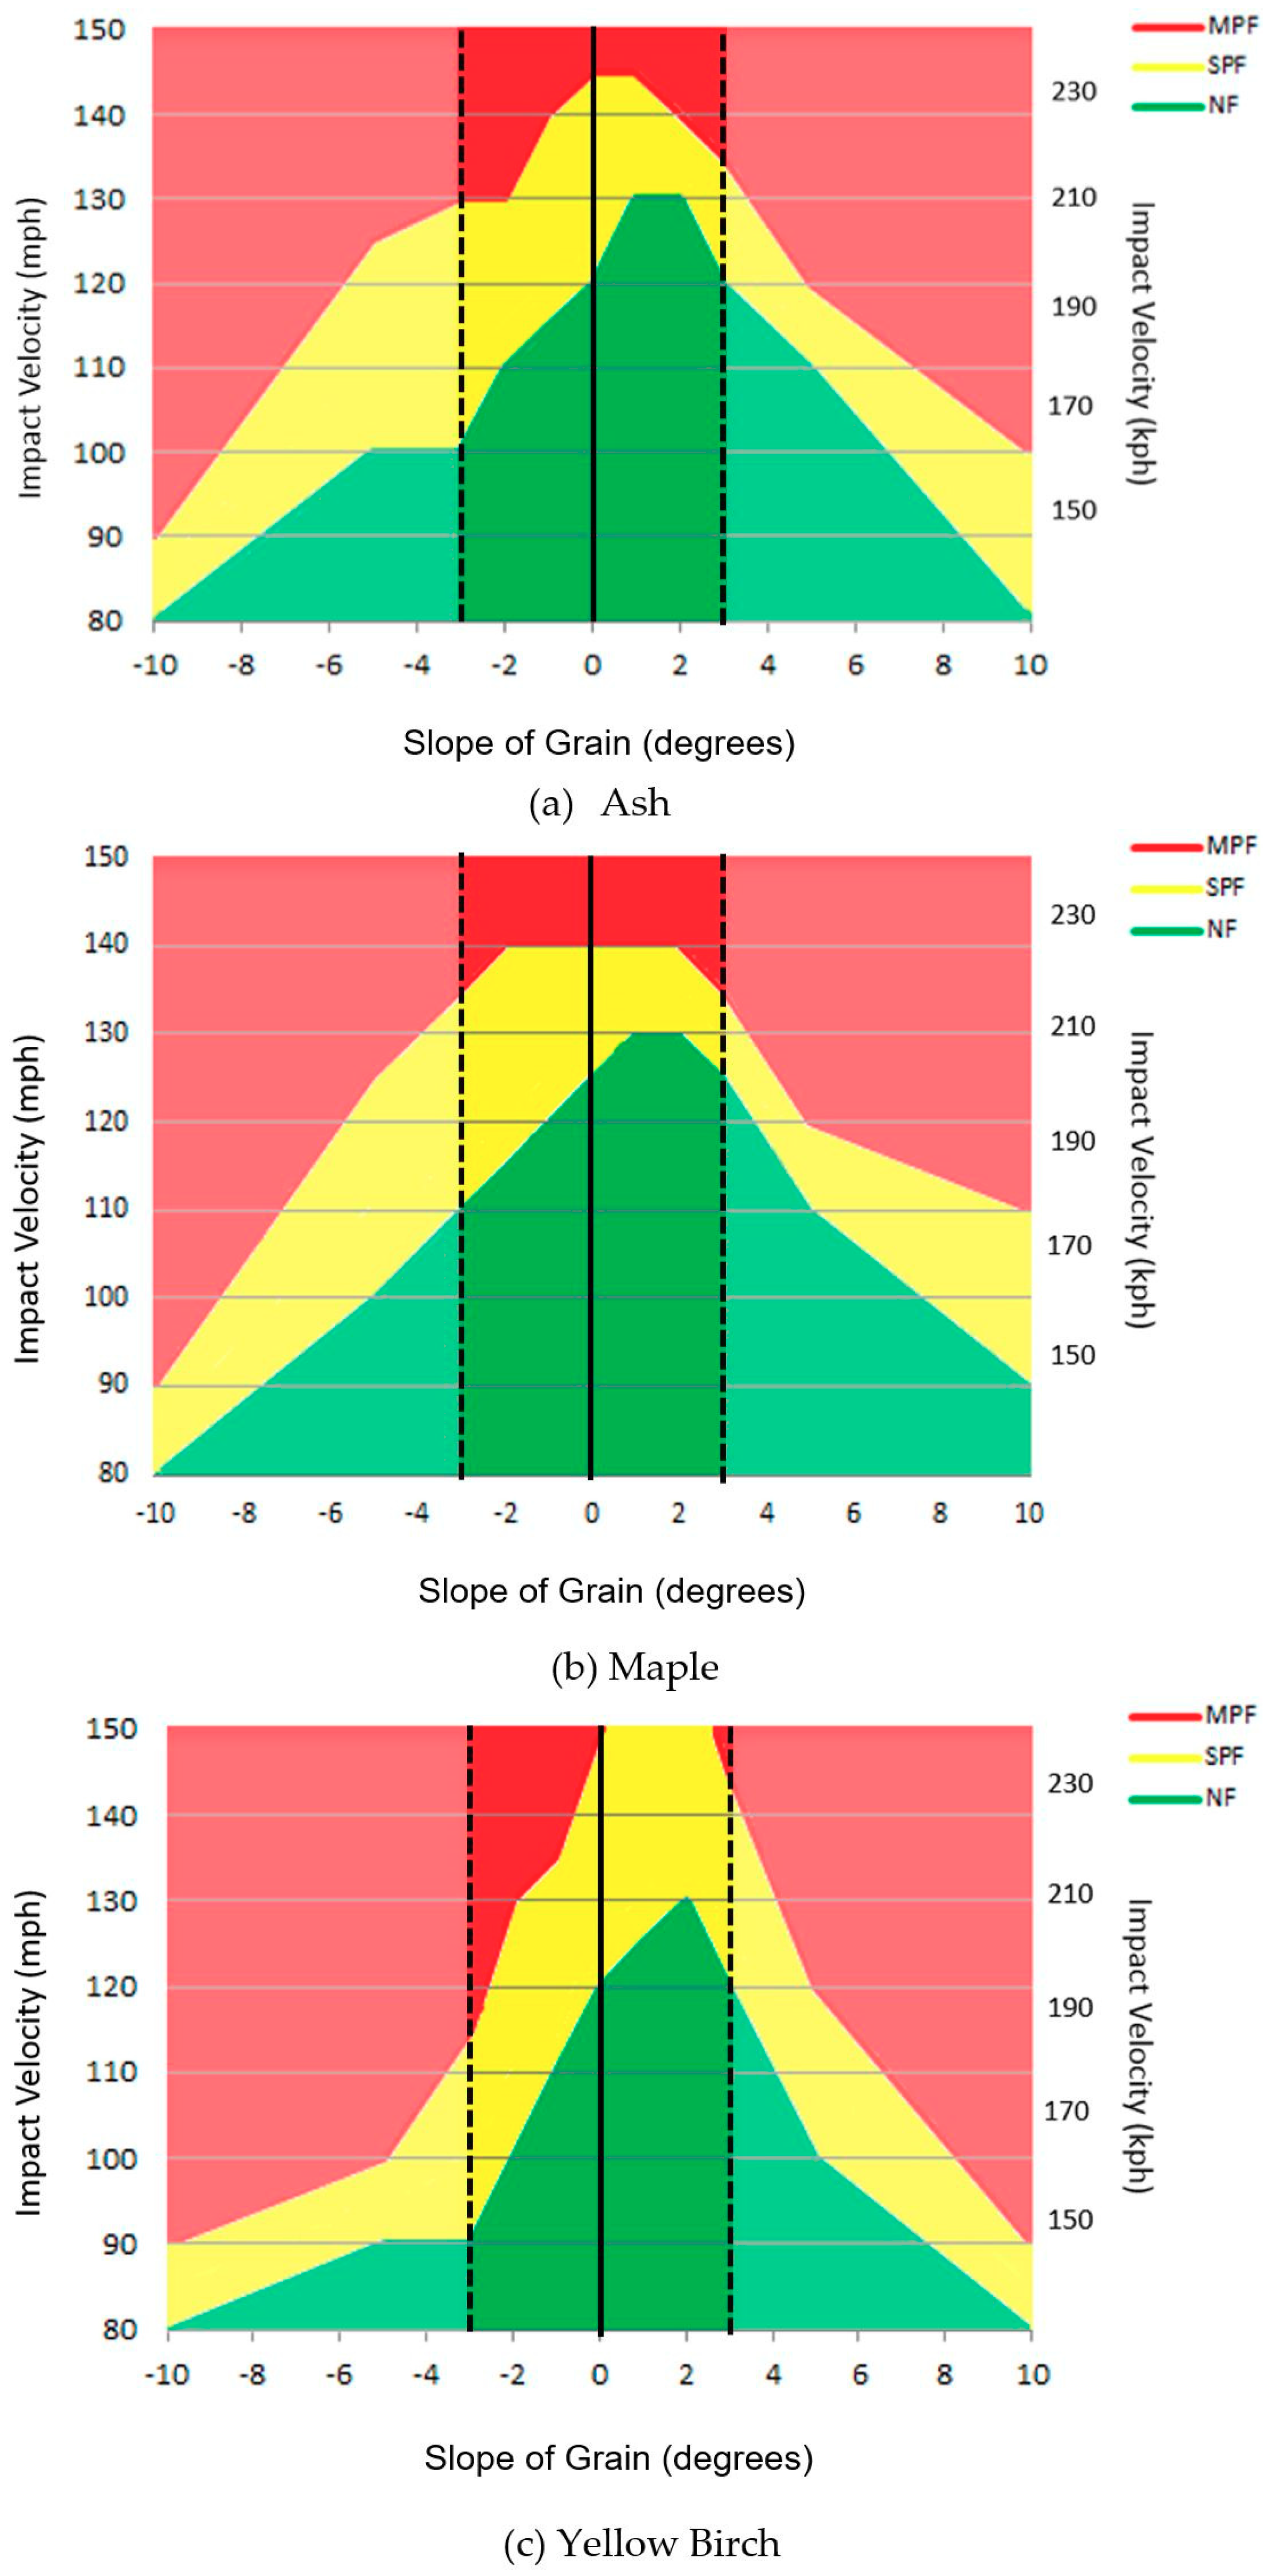
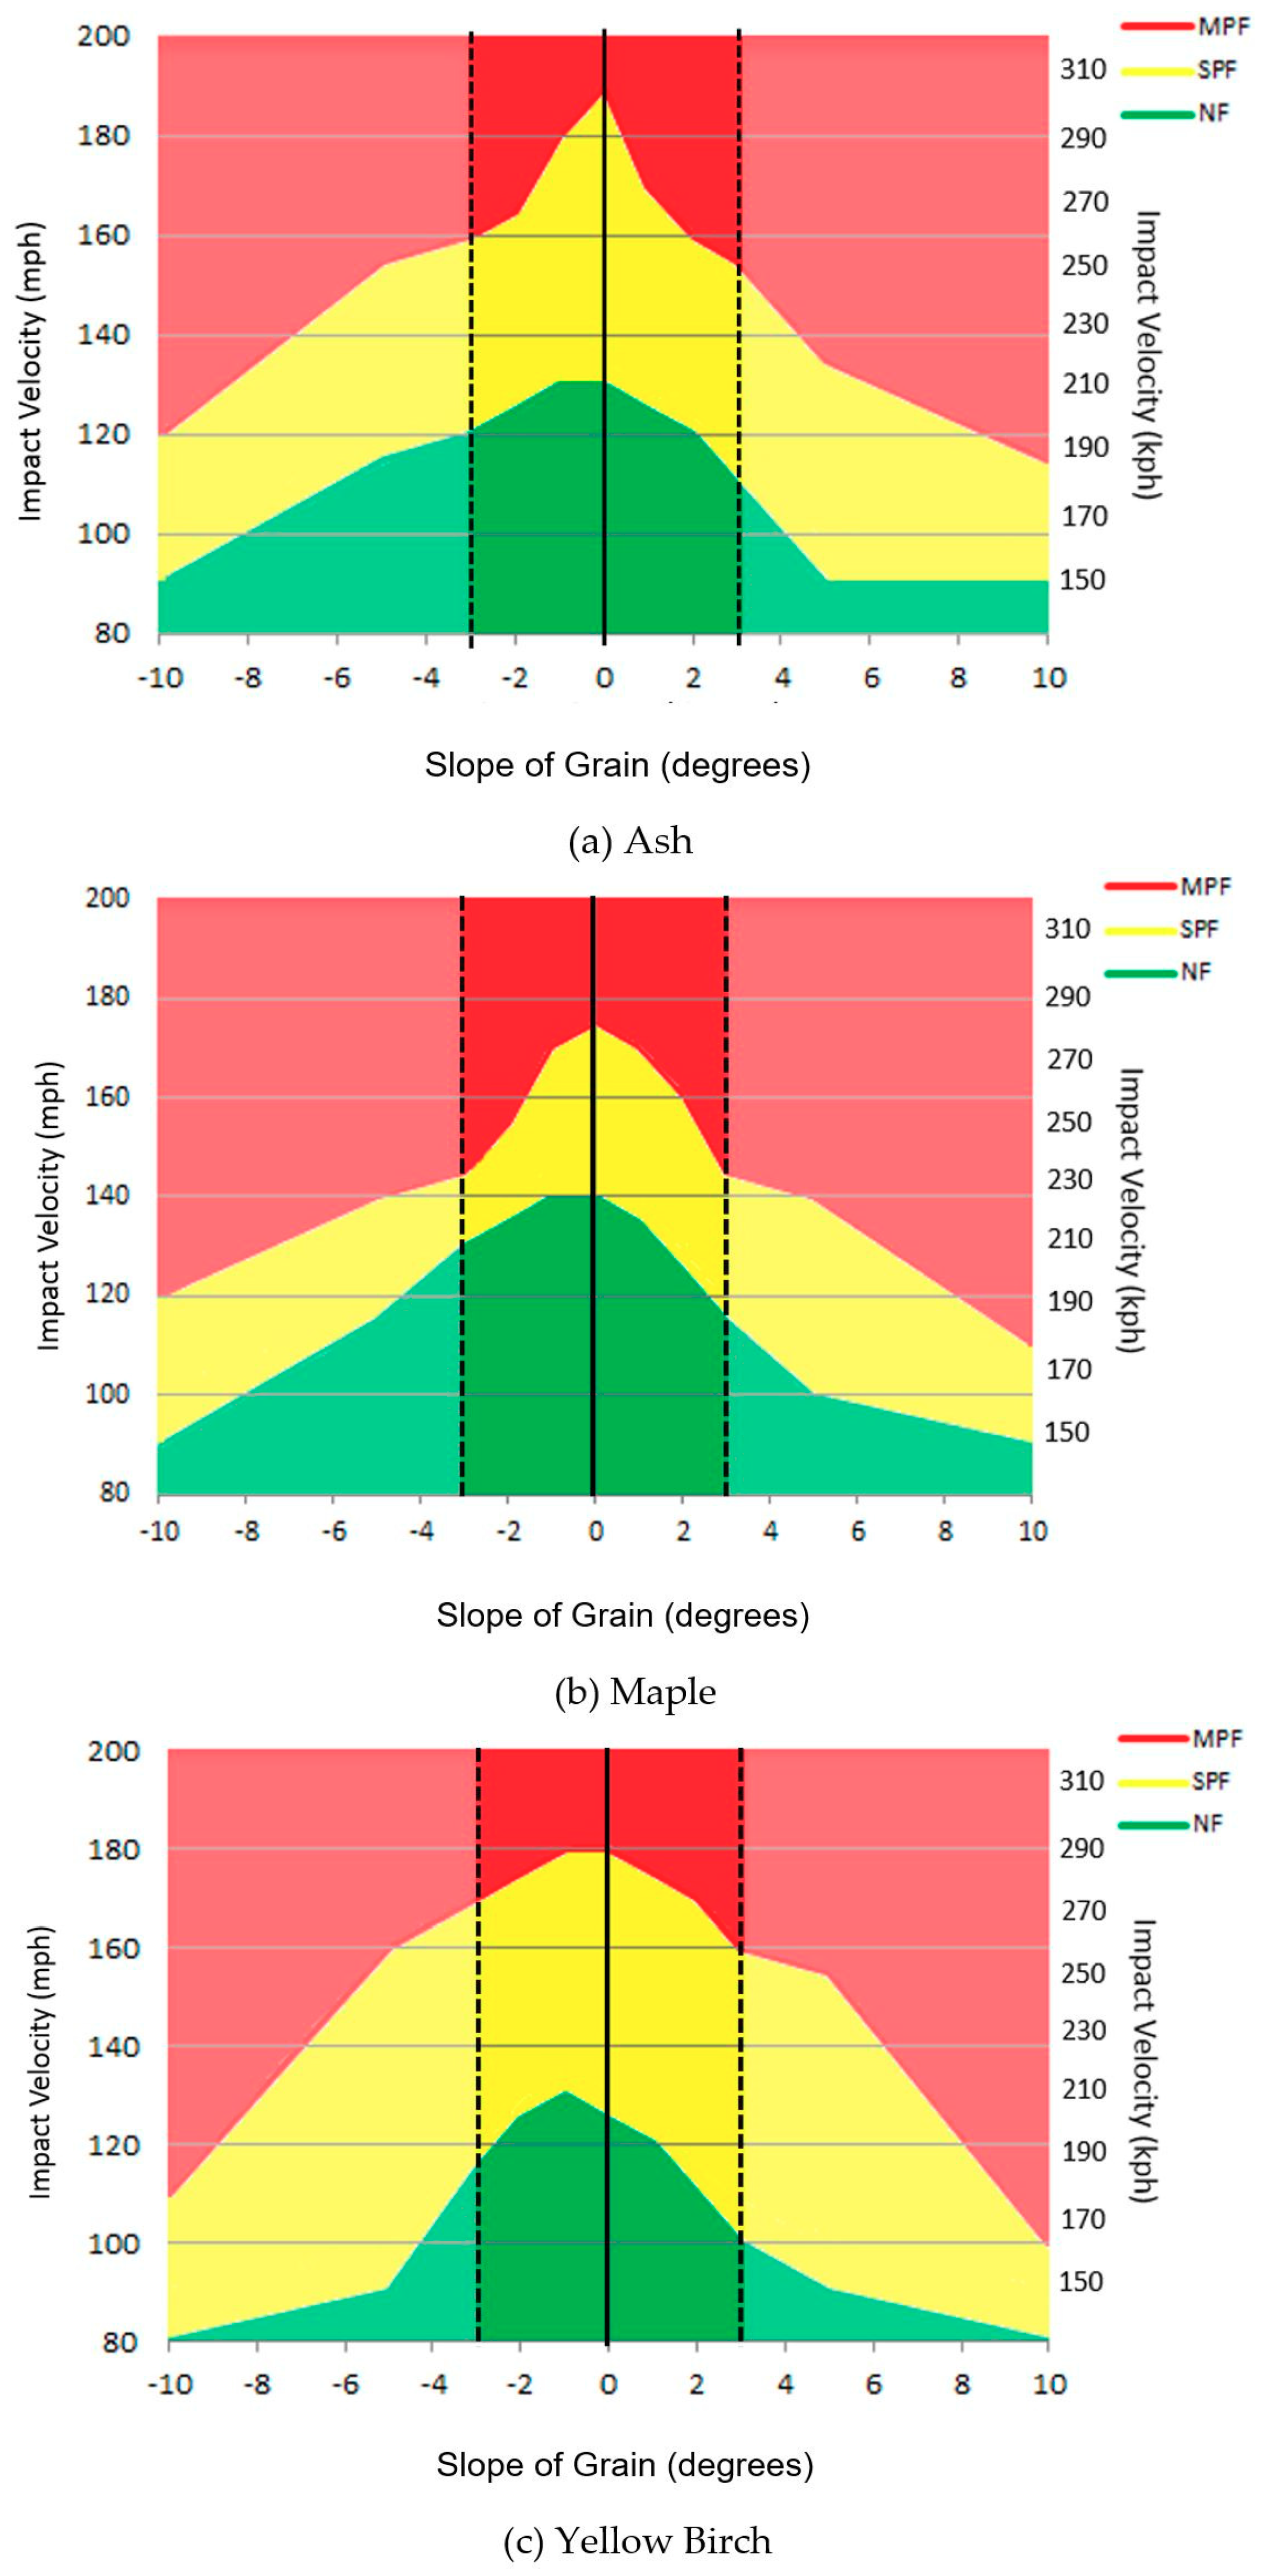
Contour plots depicting the three outcomes as a function of SoG and impact speed were developed for each combination of wood species and impact location, and the contour plots of the 14.0 in. (35.6 cm) and 2.0 in. (5.1 cm) models are presented in Figure 10 and Figure 11, respectively. The impact-velocity range for each of the possible outcomes of the bats is denoted by color– see the legend in plots. The vertical dark black line in each of these plots denotes the 0° SoG, and the two-vertical dashed black lines bound the range of compliant SoGs as defined by MLB standards for use in baseball bats, i.e., ±3°. In Figure 12 and Figure 13, the results of the three wood species are overlaid for each of the different outcomes. These figures show a direct comparison of the speeds and SoG associated with the respective boundaries between NF to SPF and with the respective boundaries between SPF to MPF.

5. Discussion

Figure 10 and Figure 11 are contour plots to show how the response of the bat transitions to each of the three outcomes as a function of impact velocity and SoG for impacts at the 2.0 in. (5.1 cm) and 14.0 in. (35.6 cm) locations, respectively. There is one contour plot for each combination of wood species and impact location that was considered in the parametric study. The NF regions are denoted in green, the SPF regions in yellow, and the MPF regions in red.
Figure 10 shows that the maximum speed for the NF region for all three wood species when impacted at the 2.0 in. (5.1 cm) location is in the range of SoGs progressing from 0° to −1°, and the breaking speed drops for SOGs on either side of this 1° spread. These results of the outside-pitch 2.0 in. (5.1 cm) impact models imply that the negative-SoG wood for values between 0° and −1° can withstand higher impact velocities before failure than the 0°-SoG wood. The relatively narrow bands of SPF for the maple and ash in comparison to the height of the SPF band for yellow birch imply that ash and maple bats quickly transition from SPF to MPF with less increase in speed than for yellow birch bats. It can also be concluded from the contour areas shown in Figure 10 that using wood with an SoG outside of the range of ±3° for any one of the wood species results in a sharp decrease in bat durability. Thus, the 2.0 in. (5.1 cm) modeling provides virtual scientific data to support the 2008 recommendation that the SoG range be set to ±3°.
Figure 11 shows that the maximum speed for the NF region for all three wood species is in the range of SoGs progressing from +1° to +2°. The maximum NF speed then trails off as the SoG increases to +3° and higher and as the SoG goes from +1° and lower. These results of the 14.0 in. (35.6 cm) inside-pitch impact models show that the positive-SoG wood for values between 0° and 3° can withstand higher impact velocities before transitioning to an SPF than the negative-SoG wood. It can also be concluded from the data shown in Figure 11 (as it was from Figure 10) that using wood with a SoG outside of the range of ±3° for any one of the wood species results in a sharp decrease in bat durability, which also supports the recommendation that the SoG range be set to ±3°.
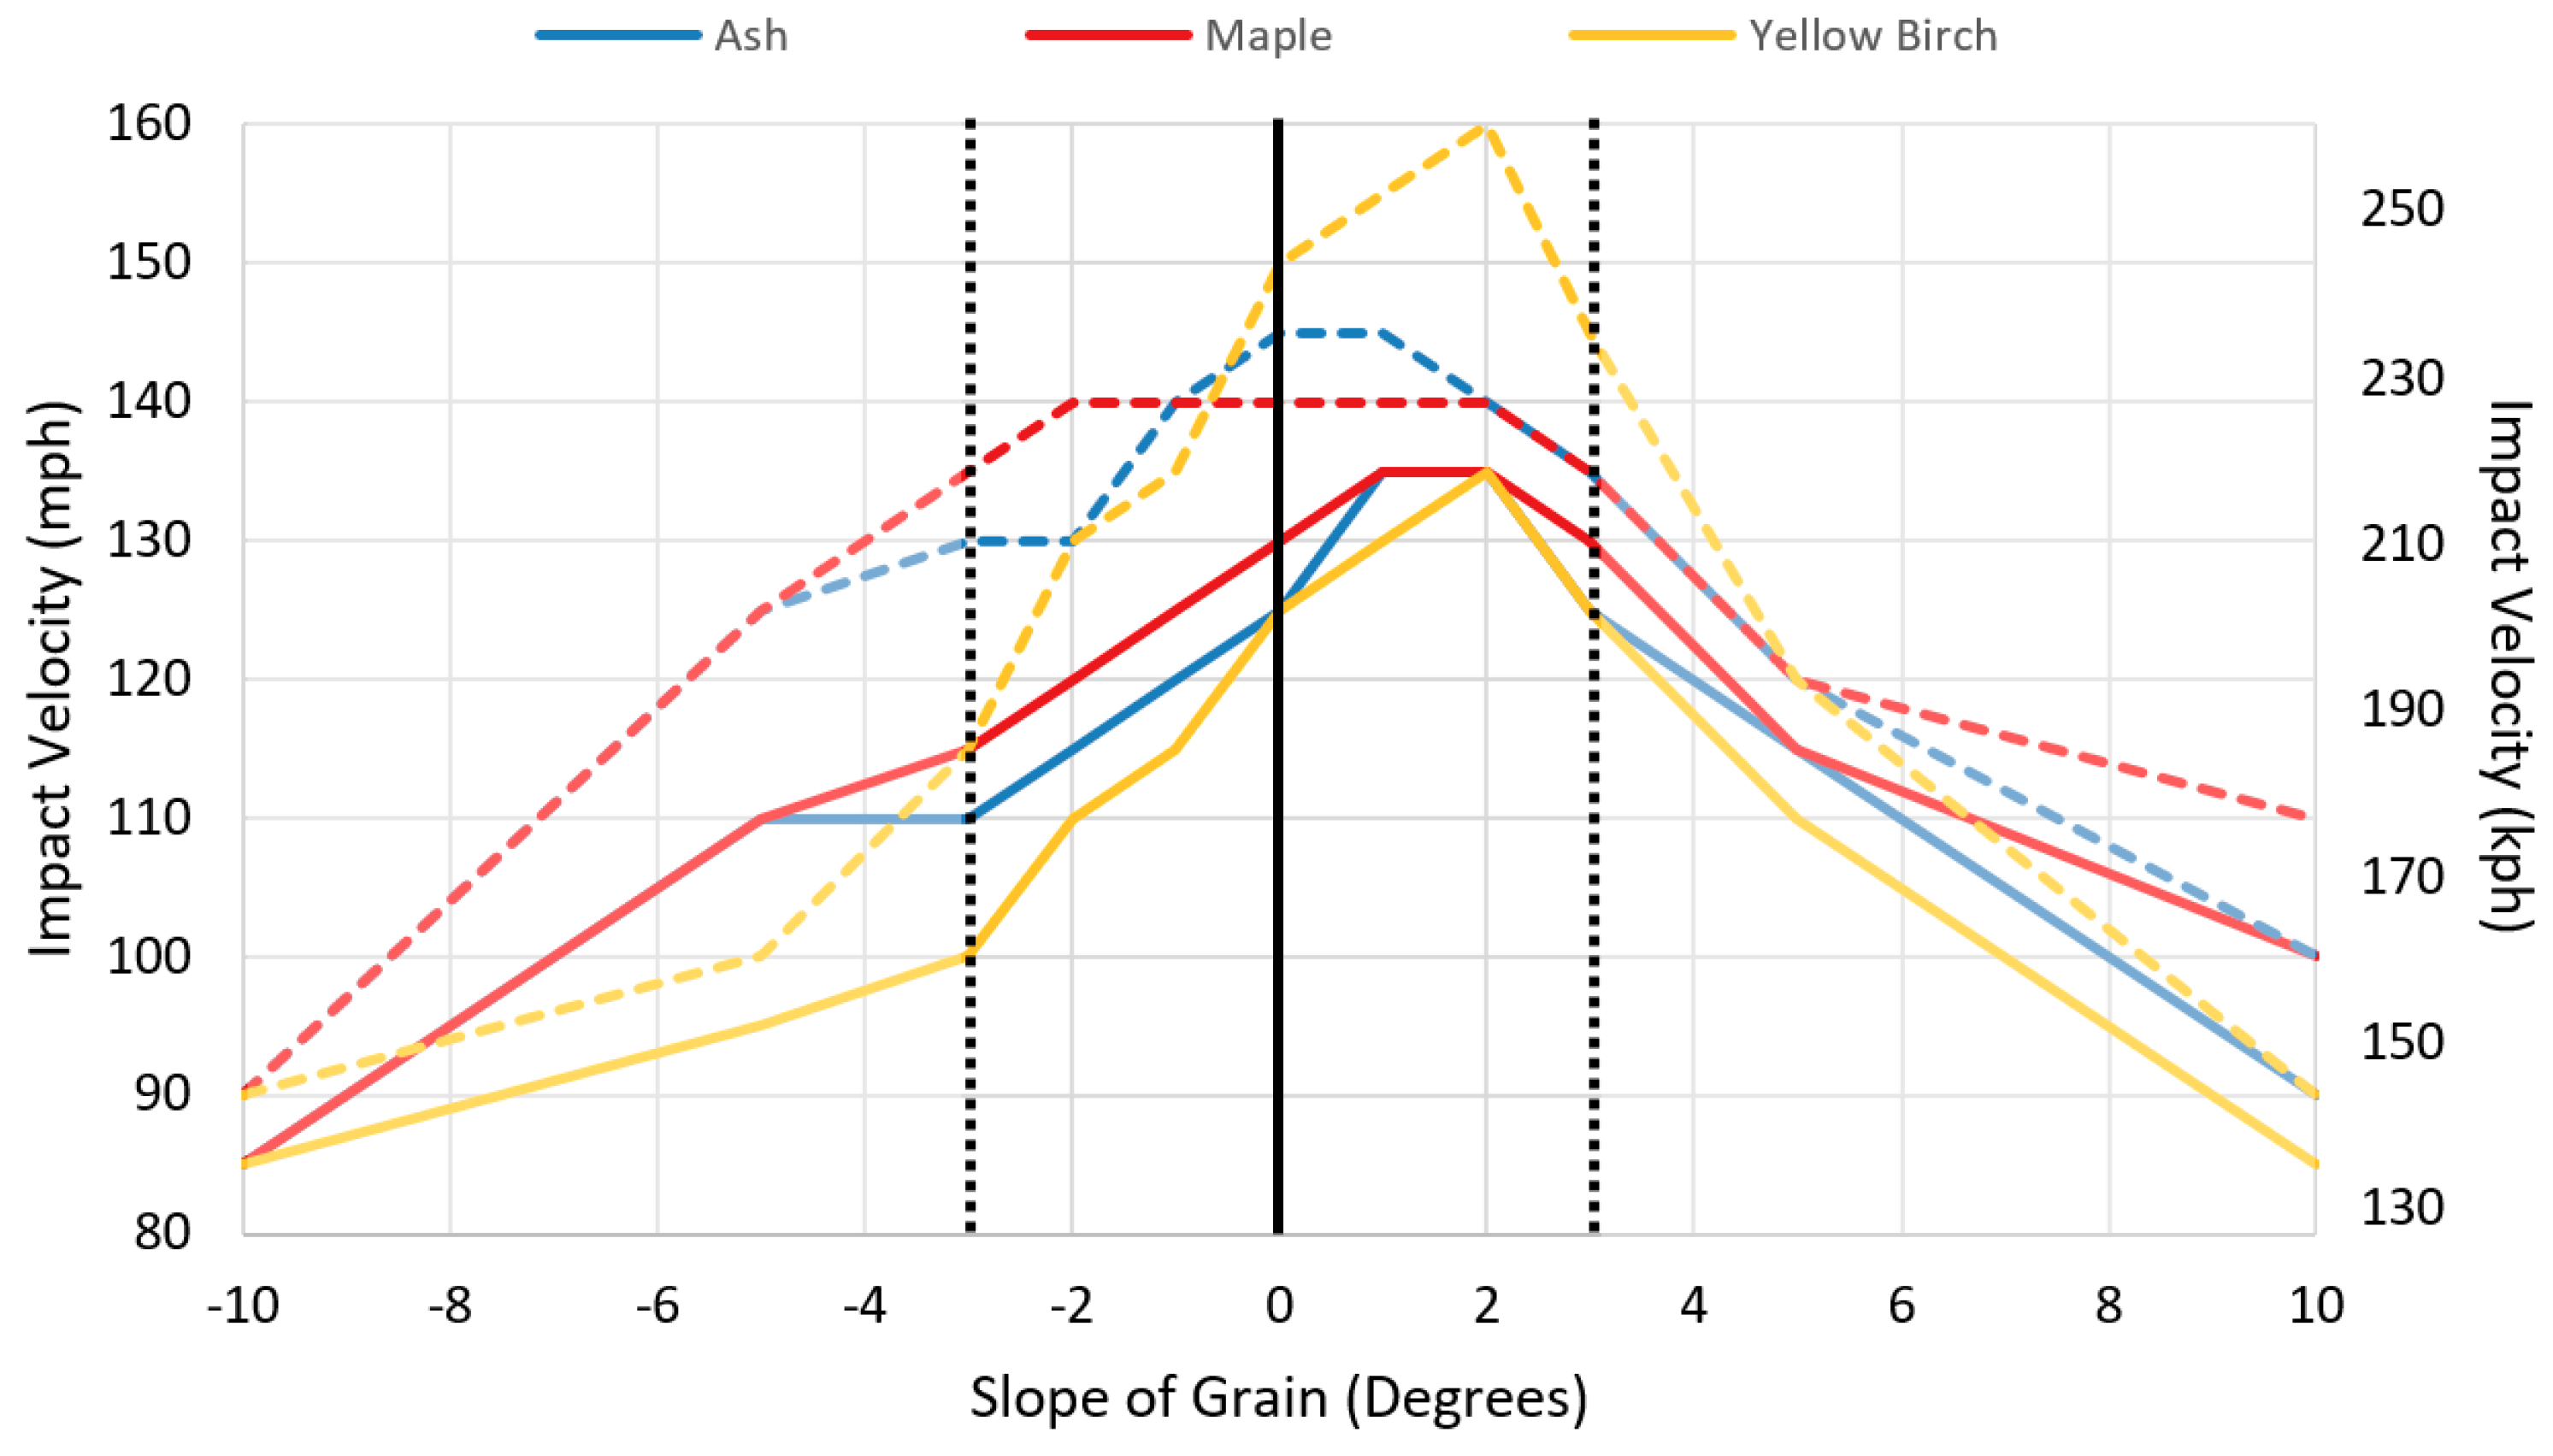
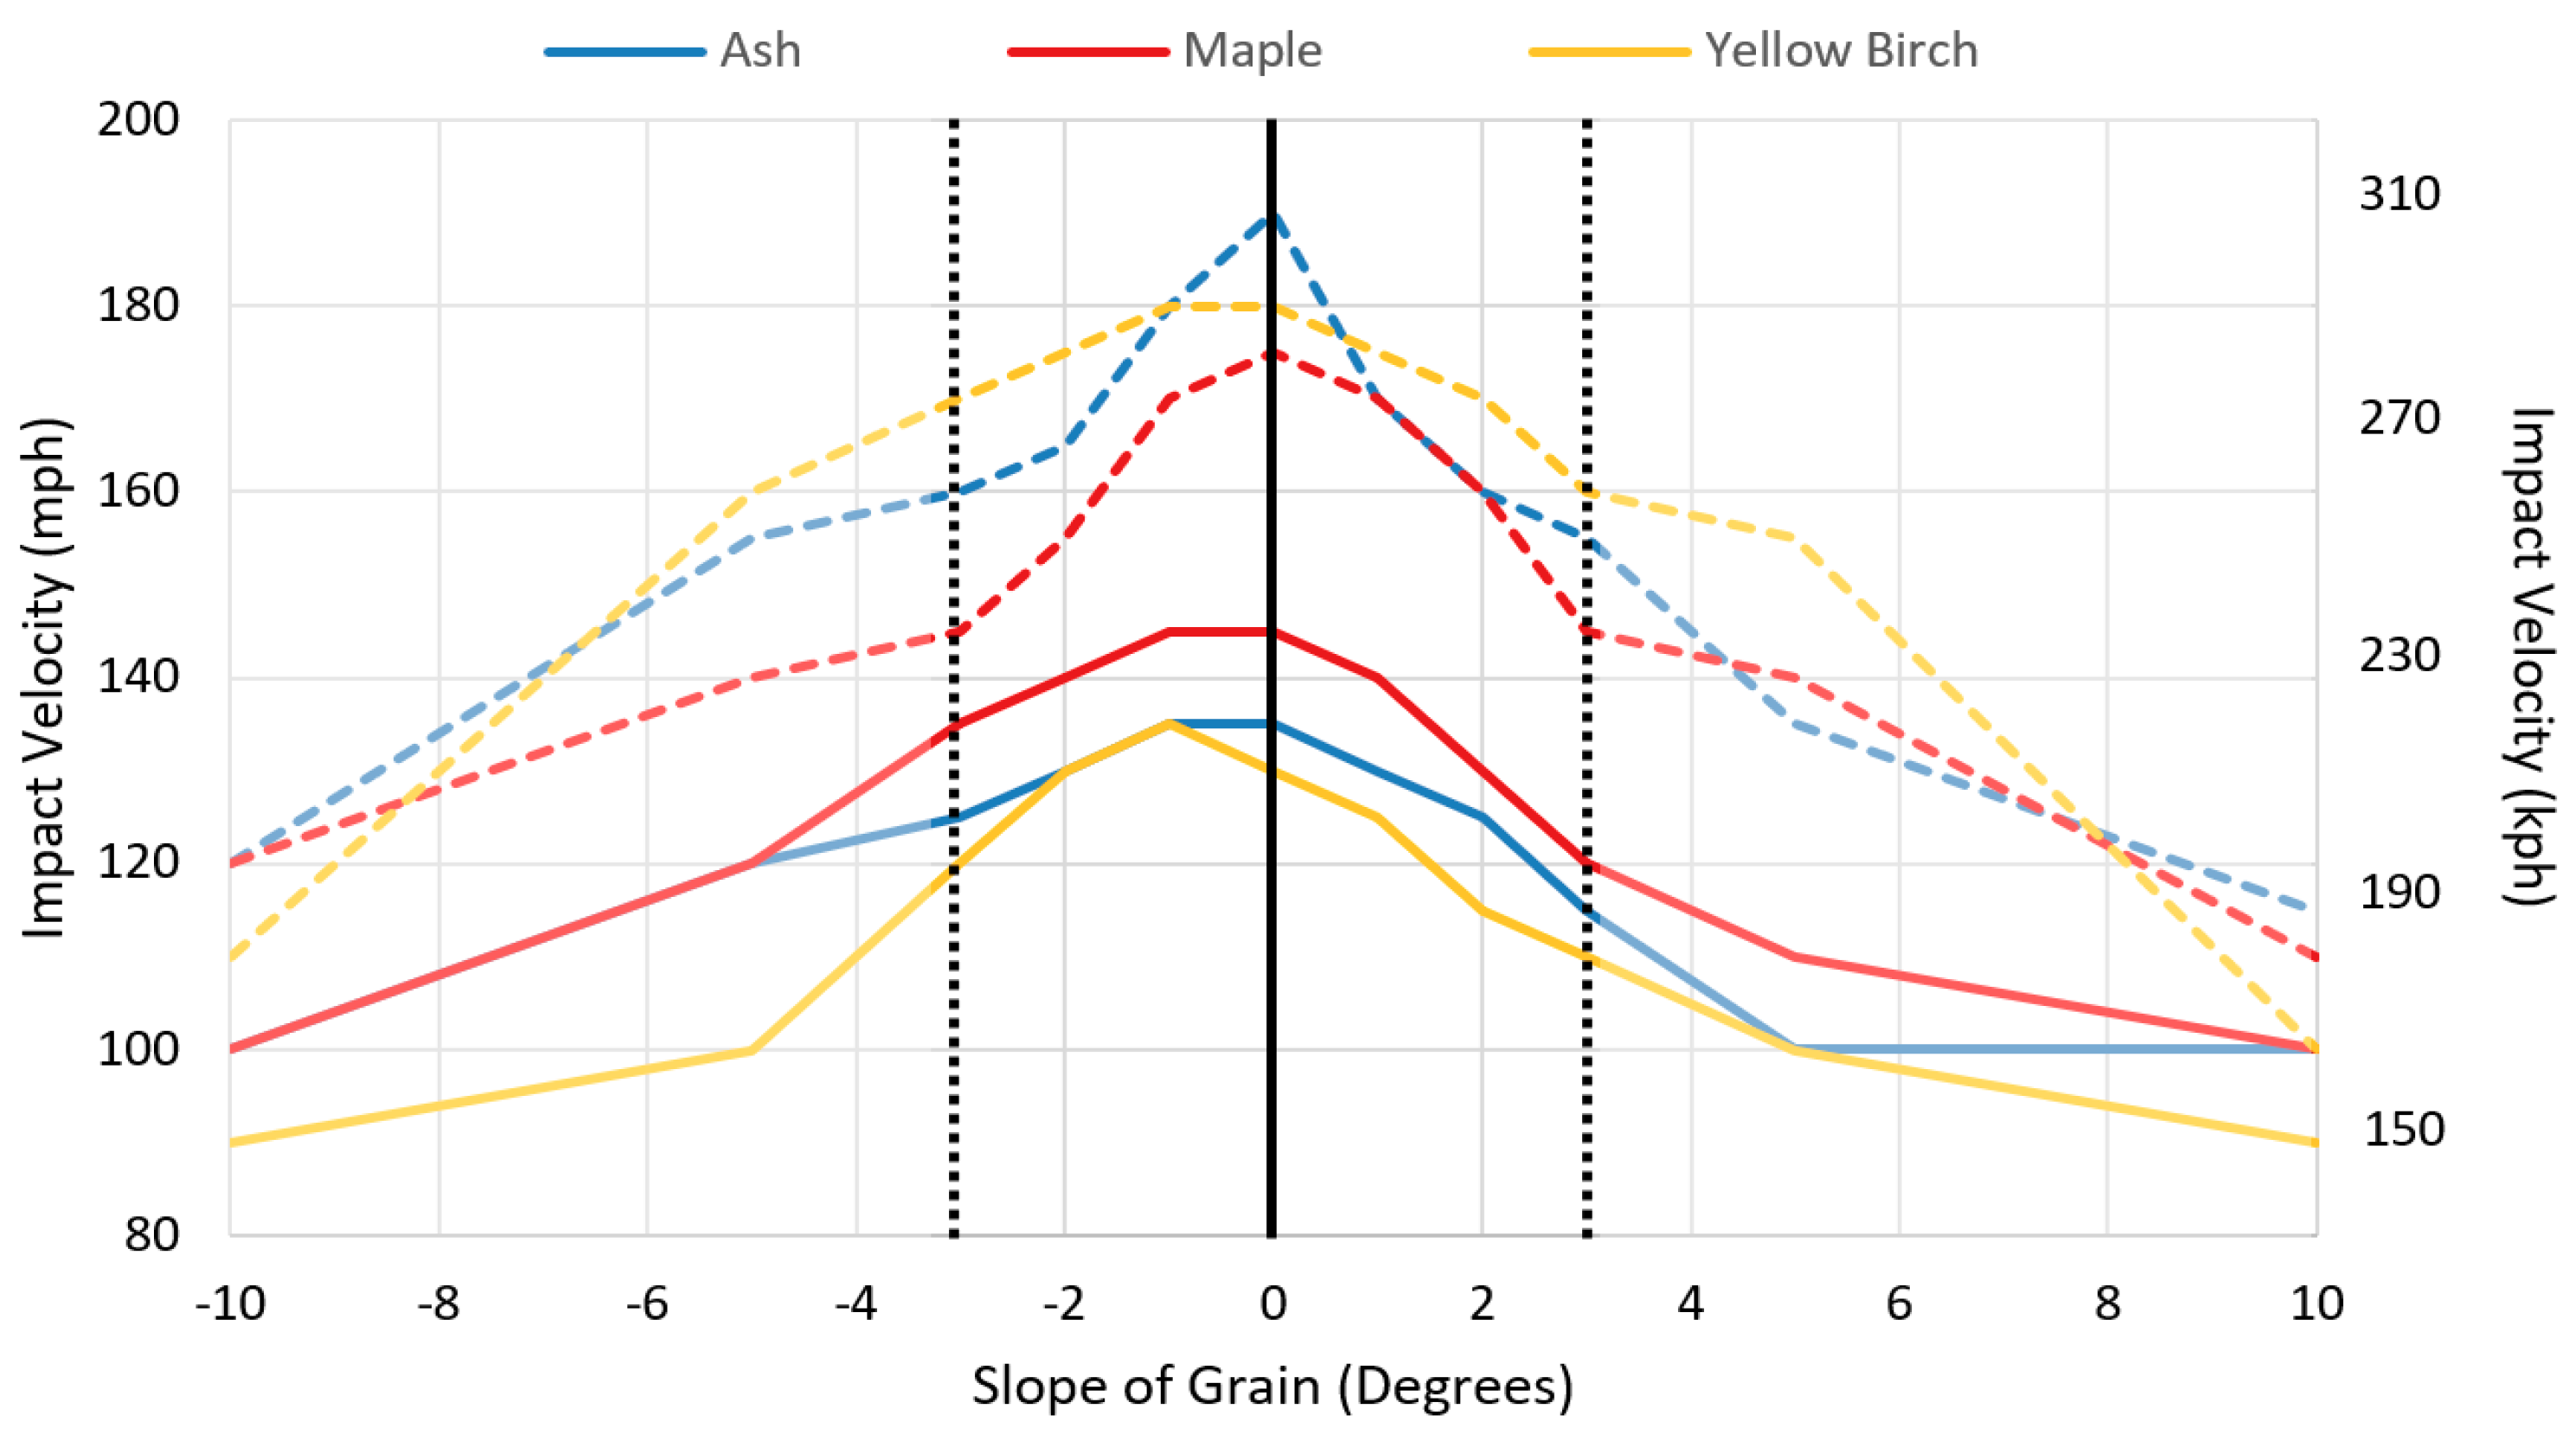
Figure 12 is an overlay plot of the boundaries denoting the transition from NF to SPF (solid lines) and for the transition from SPF to MPF (dashed lines), respectively, for all three wood species when impacted at the 2.0-in. (5.1-cm) location. Figure 12 shows that the yellow birch bats transition from NF to SPF at lower velocities for the entire range of ±10° SoGs in comparison to the maple bats and for most of the range of ±10° SoGs relative to the ash bats. However, Figure 12 also shows that the yellow birch bats had a much higher durability for the transition from SPF to MPF than maple and slightly better than ash. Thus, maple is the most likely of the three wood species to result in an MPF at the high end of the bat/ball impact speeds when viewing the results in the SoG range of ±3°, and this probability of maple breaking in an MPF manner relative to ash and yellow birch increases for SoGs outside the ±2° range. Thus, the modeling implies that the rate of maple bat MPFs due to inside pitches could be measurably reduced if the SoG range for maple were decreased from ±3° to ±2°.
Figure 13 is an overlay plot of the boundaries denoting the transition from NF to SPF (solid lines) and for the transition from SPF to MPF (dashed lines), respectively, for all three wood species when impacted at the 14.0 in. (35.6 cm) location. The yellow birch bats transition from NF to SPF at much lower velocities in comparison to the maple bats and slightly lower than the ash bats. For example, the transition velocities from NF to SPF for a bat with a −3° SoG for maple and ash are 115 and 110 mph, respectively, while the yellow birch is 100 mph. However, the yellow birch bats once again had a much better durability window (for both velocity and SoG span) in their transition from SPF to MPF than the other two species. This 14.0-in. (35.6‑cm) modeling implies that the rate of MPFs due to outside pitches could be reduced if the SoG range for all three kinds of wood were decreased from ±3° to ±2°.
There are several general observations that can be made from the analysis of the models. Negative-SoG bats in the range of 0° to −1° exhibit a higher SPF durability than positive-SoG bats for all three wood species for a 2.0 in. (5.1 cm) impact. As the impact speed increases to the MPF boundary, the best durability is at a 0° SoG. Positive-SoG bats in the range of +1° to +2° exhibit a higher SPF durability than negative-SoG bats for all three wood species for a 14.0 in. (35.6 cm) impact. This phenomenon continues for yellow birch bats as they transition from an SPF to an MPF. As the impact speed increases to the MPF boundary, the best durability is at a 0° SoG for ash and maple bats. The bias of the peak durabilities to be for negative-SoGs for outside-pitch (2.0 in., 5.1 cm) impacts and to be for positive SoGs for the inside-pitch (14.0 in. 35.6 cm) impacts supports that a 0°-SoG bat is the most versatile with respect to bat durability.
Based on the Hankinson equations as plotted in Figure 4, it was expected that bat durability would decrease as the magnitude of SoG increases. Thus, it is unexpected to see the results of increased bat durability for small nonzero SoGs, i.e., increase in bat durability for small negative SoGs for the 2.0 in. (5.1 cm) outside-pitch impact and the increase in bat durability for small positive SoGs for the 14.0 in (35.6 cm) inside-pitch impact. The respective increases with opposite SoGs may be a consequence of the respective deformation mode and location of the maximum strain for each of the two impact conditions. For the outside-pitch condition, the bat exhibits a diving board mode shape, i.e., like that of a beam clamped at one end with a backward tip deflection—see Figure 8a. For the inside-pitch condition, the bat bends in the reverse direction of that described for the outside-pitch situation with the zero-slope near the middle of the length of the bat—see Figure 8b. Thus, for the outside pitch, the front side of the bat is in tension with the maximum strain in the handle section near the knob. For the inside pitch, the back side of the bat is in tension with the maximum strain developing in the taper section of the bat. This bat response was visually confirmed during high-speed video recordings of impacts and could be validated experimentally through digital image correlation (DIC) or by placing strain gauges along the length of the bat. The difference in the sensitivity of the range of SoG may be a consequence of the respective bat section that is experiencing the maximum strain for the respective impact location. With respect to how the material behavior contributes to this increase in bat durability for small non-zero SoGs, a plausible explanation may be at what magnitude of bending do the wood fibers become fully engaged in the deformation process. Future studies will look at extreme changes in bat profiles to see if the trends found for this bat profile are also seen in those other profiles. Simple parametric studies of beam bending for the range of SoGs used in this parametric study may give insight into the specifics of the mechanical behavior of the material that may explain the results.
There are several minor limitations with the model used in this paper. The SoG is modeled as the same throughout the length of the bat. In reality, there will be some variation of the SoG along the length of the bat. However, this limitation is minor because the SoG in the handle dominates over the SoG elsewhere on the bat. There are only a few lab experimental results to use for comparison to the model. The wood properties are taken as nominal.

6. Conclusions

Finite element models of the popular C243 bat profile, baseball, and a bat durability system were constructed and used to study the effect of SoG on the outcomes of ash, maple, and yellow birch bats for inside and outside pitches. For an inside-pitch impact, bats with a positive SoG exhibited better durability than negative-SoG bats—with the best durability for bats with SoGs in the range of +1° to +2°. Conversely, negative-SoGs performed best for outside-pitch impacts when compared to results of positive-SoG bats of the same profile and material properties. For both impact locations, sharp drop-offs in performance were observed as the SoG went outside the range of ±3°. When comparing the three wood species, the yellow birch bats failed at the lowest velocity thresholds but exhibited the highest velocity range of the single-piece failure. The maple bats exhibited the highest velocity threshold before a single-piece failure occurred but were the most likely to fail multi-piece. The ash bats exhibited a balance of moderate velocity threshold before failure with a smaller range of multi-piece failure.

Author Contributions

J.F.-S.’s contributions to the research were formal analysis of the finite element modeling studies presented in the article, investigation of the effect slope of grain has on the durability of baseball bats comprised of three different wood species, development of a methodology to study the effect of slope of grain on wood baseball bat durability through finite element modeling, validation and visualization of the finite element results, writing the original draft and reviewing and editing the paper. J.S.’s author contributions to this work were conceptualization of the project goals, funding acquisition for the project, aiding in the development of the methodology used accomplish the finite element study, acting as a project administrator and supervisor to the project, and reviewing and editing the writing of the article. P.D.’s author contributions to the article are conceptualization of the project goals, formal analysis of the finite element modeling results, project administration and supervision of the research goals and tasks to complete the project, providing resources to properly evaluate the finite element modeling results, and reviewing and editing the article. E.R.’s author contributions to the research were providing finite element modeling resources and developing the finite element model methodology that served as a guideline to the parametric studies presented in the article. B.C.’s author contributions to the article were reviewing and editing the paper. D.K.’s author contributions to the article were funding acquisition for the research, serving as a project administrator and supervisor to the project goals, and serving as a crucial resource in regard to wood science and wood behavior.

Funding

This research was funded in part by the Office of the Commissioner of Baseball and the MLB Players Association.

Acknowledgments

This material is based upon the work supported by the Office of the Commissioner of Baseball and the MLB Players Association. Any opinions, findings, and conclusions or recommendations expressed in this material are those of the authors and do not necessarily reflect the views of the Office of the Commissioner of Baseball and the MLB Players Association.

Conflicts of Interest

The authors declare no conflict of interest. The funding sponsors had no role in the design of the study; in the collection, analyses, or interpretation of data; in the writing of the manuscript, and in the decision to publish the results.

References

  1. Jensen, D. The Timeline History of Baseball; Thunder Bay Press: San Diego, CA, USA, 2009. [Google Scholar]
  2. Cannella, S. Against The Grain Carving a New Niche in Maple, A Canadian Woodworker Gave Hitters an Alternative to Ash and Unleashed the Boutique Bat Business; Sports Illustrated: New York, NY, USA, 2002. [Google Scholar]
  3. MLB/MLBPA MLB. MLBPA Adopt Recommendations of Safety and Health Advisory Committee December; Major League Baseball: New York, NY, USA, 2008. [Google Scholar]
  4. Dvorchak, R. Bat Maker a big hit with the pros, SPORTS P. A-1. Pittsburgh Post-Gazette, 4 July 2010. [Google Scholar]
  5. Saraceno, J. Taking swing at safer bats, man says his creation curbs exploding effect. USA TODAY, FA CHASE EDITION P.1C. 15 August 2016. [Google Scholar]
  6. Fortin-Smith, J.; Sherwood, J.; Drane, P.; Kretschmann, D. Characterization of Maple and Ash Material Properties for the Finite Element Modeling of Wood Baseball Bats. Appl. Sci. 2018, 8, 2256. [Google Scholar] [CrossRef]
  7. Ruggiero, E.; Sherwood, J.; Drane, P.; Kretschmann, D. An Investigation of bat durability by wood species. In Proceedings of the ISEA 2012, 9th Conference of the International Sports Engineering Association, Lowell, MA, USA, 9–13 July 2012. [Google Scholar]
  8. Ruggiero, E.; Sherwood, J.; Drane, P. Breaking Bad(ly)—Investigation of the Durability of Wood Bats in Major League Baseball using LS-DYNA®. In Proceedings of the 13th LS-DYNA International Users Conference, Dearborn, MI, USA, 8–10 June 2014. [Google Scholar]
  9. Carrasco, E.V.M.; Mantilla, J.N.R. Applying Failure Criteria to Shear Strength Evaluation of Bonded Joints According to Grain Slope under Compressive Load. Int. J. Eng. Technol. 2013, 13, 19–25. [Google Scholar]
  10. Hankinson, R.L. Investigation of Crushing Strength of Spruce at Varying Angles of Grain; Air Force Information Circular No. 259; The Chief of Air Service: Washington, DC, USA, 1921. [Google Scholar]
  11. Hernandez, R. About RockBats 2012. Available online: http//:www.rockbats.com/company_aboutRockBats.html (accessed on 8 April 2018).
  12. Kretschmann, D.E.; Bridwell, J.J.; Nelson, T.C. Effect of changing slope of grain on ash, maple, and yellow birch in bending strength. In Proceedings of the WCTE 2010, World Conference on Timber Engineering, Riva del Garda, Trento, Italy, 20–24 June 2010. [Google Scholar]
  13. Glier, R. Wood experts will study bats further. USA TODAY, SPORTS P. 5C. 4 August 2009. [Google Scholar]
  14. Drane, P.; Sherwood, J.; Shaw, R. An Experimental Investigation of Baseball Bat Durability. In The Engineering of Sport 6; Moritz, E.F., Haake, S., Eds.; Springer: New York, NY, USA, 2006. [Google Scholar]
  15. Ruggiero, E.; Fortin-Smith, J.; Sherwood, J.; Drane, P.; Kretschmann, D. Development of a Protocol for Certification of New Wood Species for Making Baseball Bats. J. Sports Eng. Technol. 2017. submitted for review. [Google Scholar]
  16. Ruggiero, E. Investigating Baseball Bat Durability Using Experimental and LS-DYNA Finite Element Modeling Methods. Master’s Thesis, University of Massachusetts Lowell, Lowell, MA, USA, 2011. [Google Scholar]
  17. Murray, D.; Reid, J.D.; Faller, R.K.; Bielenberg, B.W.; Paulsen, T.J. Evaluation of LS-DYNA Wood Material Model 143; PUBLICATION NO. FHWA-HRT-04-096; Federal Highway Administration: McLean, VA, USA, 2005. [Google Scholar]
  18. Manual for LS-DYNA Wood Material Model 143; U.S. Department of Transportation Federal Highway Administration: Washington, DC, USA, 2007.
  19. Drane, P.; Sherwood, J.; Colosimo, R.; Kretschmann, D. A study of wood baseball bat breakage. In Proceedings of the ISEA 2012, 9th Conference of the International Sports Engineering Association, Lowell, MA, USA, 9–13 July 2012. [Google Scholar]
Figure 1. Ash baseball bat with logo on the face-grain surface of the bat. The knob, handle, taper and barrel sections of the bat are identified.
Applsci 09 03733 g001
Figure 2. Face-grain and edge-grain surfaces of an ash wood baseball bat.
Applsci 09 03733 g002
Figure 3. Finite element model of a baseball and the bat in the test fixture. The annotations denote the directions of positive, negative and 0° SoGs.
Applsci 09 03733 g003
Figure 4. Illustration of Hankinson’s equation [10].
Applsci 09 03733 g004
Figure 5. The testing system is shown with a wood bat hanging in machine and ready for impact: (a) the Bat Durability System, (b) Close-up view of bat in Bat Durability System, and examples of (c) SPF and (d) MPF.
Applsci 09 03733 g005
Figure 6. Finite element model of a C243 bat.
Applsci 09 03733 g006
Figure 7. Bat failure modes (a) No Failure (NF), (b) Single-Piece Failure (SPF), and (c) Multi-Piece Failure (MPF).
Applsci 09 03733 g007
Figure 8. Two common impact locations examined for durability (a) Outside pitch—2.0 in (5.1 cm) and (b) Inside Pitch—14.0 in. (35.6 cm).
Applsci 09 03733 g008
Figure 9. Impact speed variation by impact location.
Applsci 09 03733 g009
Figure 10. 2 in. (5.1 cm) impact model set results for (a) Ash, (b) Maple, and (c) Yellow Birch.
Applsci 09 03733 g010
Figure 11. 14 in. (35.6 cm) impact model set results for (a) Ash, (b) Maple, and (c) Yellow Birch.
Applsci 09 03733 g011
Figure 12. Single-piece (solid lines)/multi-piece failure (dashed lines) threshold for 2 in. (5.1 cm) impact models.
Applsci 09 03733 g012
Figure 13. Single-piece (solid lines)/multi-piece failure (dashed lines) threshold for 14 in. (35.6 cm) impact models.
Applsci 09 03733 g013
Table 1. Summary of wood species material properties.
Material PropertyLS-DYNA Material VariableAshMapleYellow Birch
Parallel Normal ModulusEL lb/in3 (GPa)2,130,000 (14.7)2,260,000 (15.6)2,340,000 (16.1)
Perpendicular Normal ModulusET lb/in3 (GPa)170,100.0 (1.17)146,771.0 (1.01)117,000.0 (0.81)
Parallel Shear ModulusGLT lb/in3 (GPa)231,761.0 (1.60)250,640.0 (1.73)159,120.0 (1.10)
Perpendicular Shear ModulusGTR lb/in3 (GPa)81,515.00 (0.56)75,691.00 (0.52)53,493.55 (0.37)
Poisson’s RatioPR0.4400.4760.451
Parallel Tensile StrengthXT lb/in3 (MPa)23,782.00 (164)22,011.00 (152)23,677.00 (163)
Parallel Compressive StrengthXC lb/in3 (MPa)11,748.00 (81.0)10,977.00 (75.7)11,638.30 (80.2)
Perpendicular Tensile StrengthYT lb/in3 (MPa)1888.000 (13.0)2115.700 (14.6)1310.600 (9.04)
Perpendicular Compressive StrengthYC lb/in3 (MPa)1839.100 (12.7)2060.900 (14.2)1381.800 (9.53)
Parallel Shear StrengthSXY lb/in3 (MPa)3028.200 (20.9)3266.600 (22.5)2678.100 (18.5)
Perpendicular Shear StrengthSYZ lb/in3 (MPa)4239.500 (29.2)4573.300 (31.5)3749.300 (25.9)

