Spatiotemporal Dynamics and Obstacles of the Multi-Functionality of Land Use in Xiangxi, China


Abstract
1. Introduction
- (1).
- What changes have taken place with the land-use function of this region?
- (2).
- What are the main factors restricting the land function there?
- (3).
- What measures should be taken to mitigate the adverse effects?
2. Data and Methods
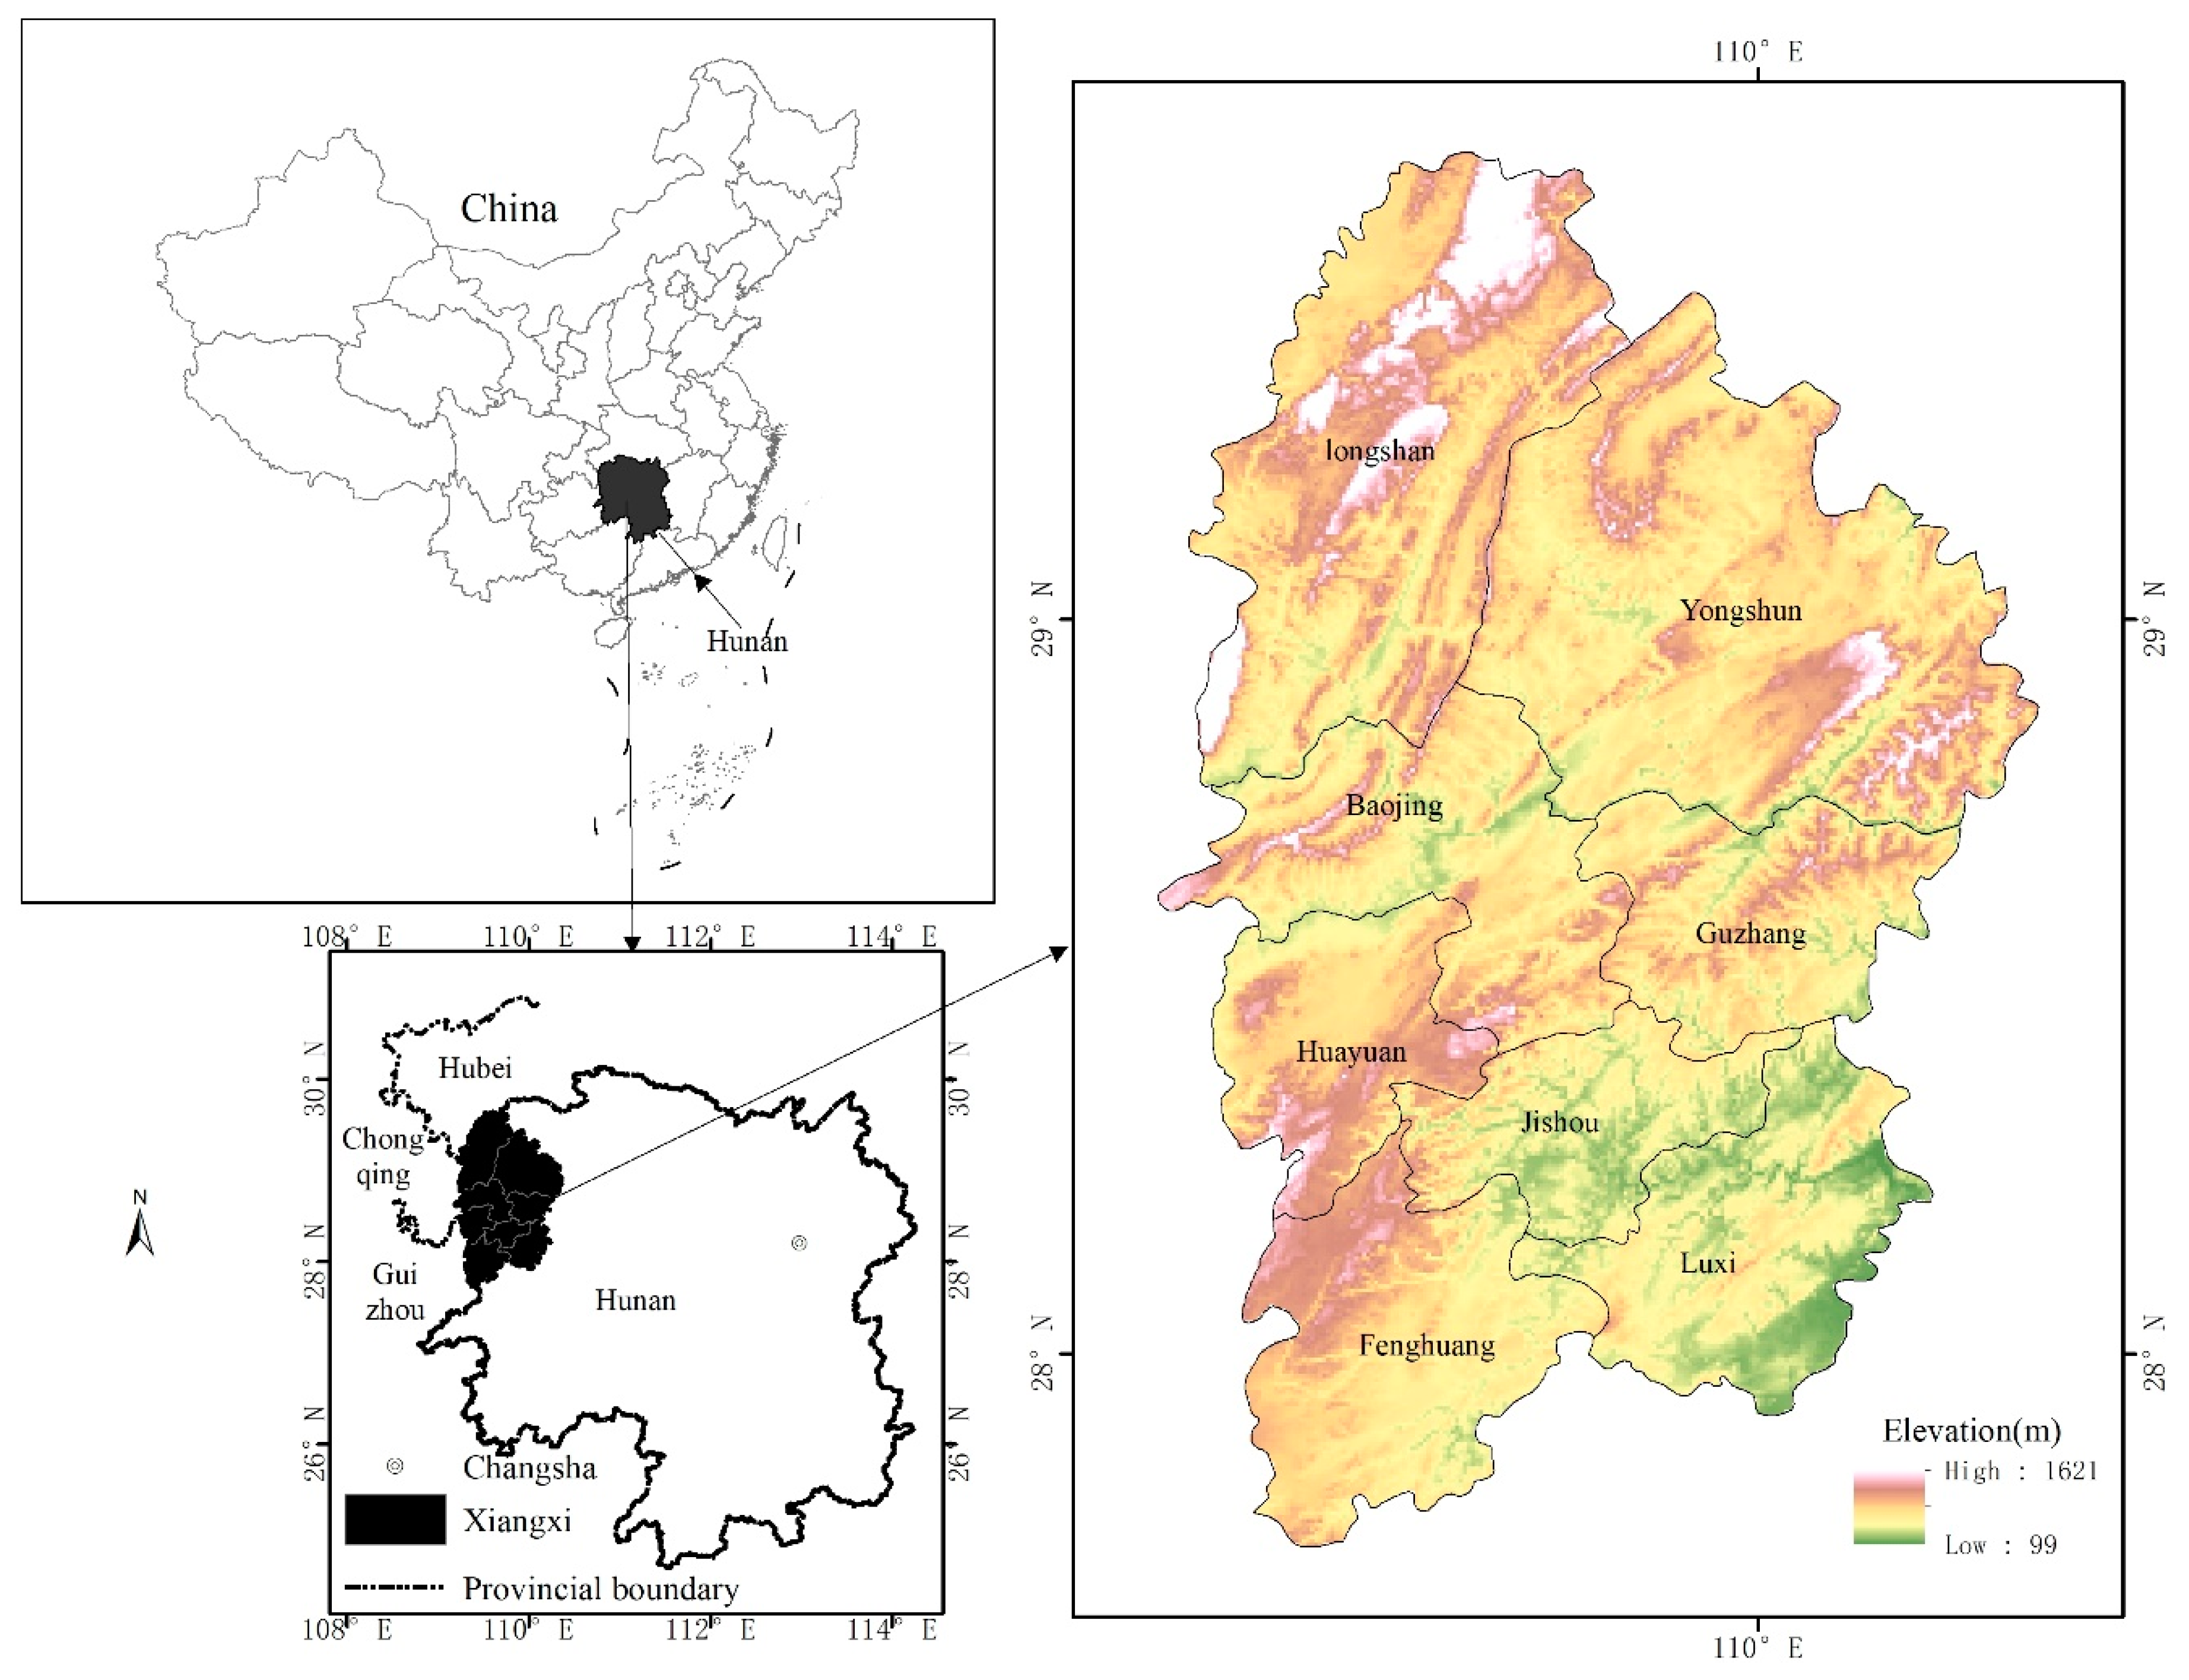
2.1. Research Area
2.2. Data Sources
2.3. Research Methods
2.3.1. Classifying the Multifunctional Types of Land Use
2.3.2. The Establishment of the Evaluation Index System
2.3.3. Determination of the Index Weight
2.3.4. Measuring the Versatility of Land Use
2.3.5. Diagnosing the Obstacles to Land Use Function
3. Results
3.1. The Spatio-Temporal Dynamic Evaluation of the Total Function of Land Use
3.2. The Spatio-Temporal Dynamic Analysis of the Sub-Function of Land Use
3.2.1. The Production Function
3.2.2. The Living Function
3.2.3. The Ecological Function
3.3. The Analysis of Obstacle Factors
3.3.1. The Living-Ecological Type of Obstacle
3.3.2. The Production-Living Type of Obstacle
3.3.3. The Production Type of Obstacle
4. Discussion
4.1. Comparison in Land Use Management
4.2. Policy Suggestions for the Land Use in Xiangxi
4.3. Limitation and Future Research
5. Conclusions
- (1).
- With the continuous optimization of the overall functional level of land use in Xiangxi, the spatial heterogeneity was increasingly clear. The coordination of land use has changed to a certain extent, and the overall situation was better in the south than in the middle or the north.
- (2).
- The production function of land use in Xiangxi was observed to be slowly increasing with more rapid growth in the southern and central regions than in the northern regions. The spatial differentiation between these areas was clear.
- (3).
- Obstacles against efficient land use in Xiangxi can be divided into three types: the living-ecological obstacle (Jishou), the production-living obstacle (Luxi, Guzhang), and the production obstacle (Fenghuang, Huayuan, Baojing, Yongshun, and Longshan).
- (4).
- To promote the multi-functional use of land, we should formulate differentiated policies for different regions. In the future, we can choose a smaller area or a longer time scale for further research.
Author Contributions
Funding
Acknowledgments
Conflicts of Interest
References
- Verburg, P.H.; Van De Steeg, J.; Veldkamp, A.; Willemen, L. From land cover change to land function dynamics: A major challengeto improve land characterization. J. Environ. Manag. 2009, 90, 1327–1335. [Google Scholar] [CrossRef] [PubMed]
- Steffen, W.; Crutzen, P.J.; McNeill, J.R. The anthropocene: Are humans now overwhelming the great forces of nature. AMBIO 2007, 36, 614–621. [Google Scholar] [CrossRef]
- Scholes, R.J.; Biggs, R. A biodiversity intactness index. Nature 2005, 434, 45–49. [Google Scholar] [CrossRef] [PubMed]
- Vörösmarty, C.J.; McIntyre, P.B.; Gessner, M.O.; Dudgeon, D.; Prusevich, A.; Green, P.; Glidden, S.; Bunn, S.E.; Sullivan, C.A.; Liermann, C.R.; et al. Global threats to human water security and river biodiversity. Nature 2010, 467, 555–561. [Google Scholar] [CrossRef] [PubMed]
- Patz, J.A.; Daszak, P.; Tabor, G.M.; Aguirre, A.A.; Pearl, M.; Epstein, J.; Wolfe, N.D.; Kilpatrick, A.M.; Foufopoulos, J.; Molyneux, D.; et al. Unhealthy Landscapes: Policy recommendations on land use change and infectious disease emergence. Environ. Health Perspect. 2004, 112, 1092–1098. [Google Scholar] [CrossRef] [PubMed]
- Ellis, E.C. Ecology in an anthropogenic biosphere. Ecol. Monogr. 2015, 85, 287–331. [Google Scholar] [CrossRef]
- Matthews, R.B.; Gilbert, N.G.; Roach, A.; Polhill, J.G.; Gotts, N.M. Agent-based land-use models: A review of applications. Landsc. Ecol. 2007, 22, 1447–1459. [Google Scholar] [CrossRef]
- Heisterman, M.; Christoph, M.; Ronneberger, K. Land in sight? Achievements, deficits and potentials of continental to global scale land-use modeling. Agric. Ecosyst. Environ. 2006, 114, 141–158. [Google Scholar] [CrossRef]
- Wiggering, H.; Dalchow, C.; Glemnitz, M.; Helming, K.; Müller, K.; Schultz, A.; Stachow, U.; Zander, P. Indicators for multifunctional land use—Linking socio-economic requirements with landscape potentials. Ecol. Indic. 2006, 6, 238–249. [Google Scholar] [CrossRef]
- Pérez-Soba, M.; Petit, S.; Jones, L.; Bertrand, N.; Briquel, V.; Omodei-Zorini, L.; Contini, C.; Helming, K.; Farrington, J.H.; Mossello, M.T.; et al. Land Use Functions—A Multifunctionality Approach to Assess the Impact of Land Use Changes on Land Use Sustainability; Springer: Berlin/Heidelberg, Germany, 2008; pp. 375–404. [Google Scholar]
- SchoBer, B.; Helming, K.; Wiggering, H. Assessing land use change impacts: A comparison of the SENSOR land use function approach with other frameworks. J. Land Use Sci. 2010, 5, 159–178. [Google Scholar]
- De, G.R. Function-analysis and valuation as a tool to assess land use conflicts in planning for sustainable, multifunctional landscapes. Landsc. Urban Plan. 2006, 75, 175–186. [Google Scholar]
- David, A. Multifunctionality, Agricultural Policy, and Environmental Policy. Agric. Resour. Econ. Rev. 2004, 33, 8–17. [Google Scholar]
- Aubry, C.; Ramamonjisoa, J.; Dabat, M.H.; Rakotoarisoa, J.; Rakotondraibe, J.; Rabeharisoa, L. Urban agriculture and land use in cities: An approach with the multi-functionality and sustainability concepts in the case of Antananarivo (Madagascar). Land Use Policy 2012, 29, 429–439. [Google Scholar] [CrossRef]
- Kiminami, L.; Kiminami, A.; Furuzawa, S. Impacts of multi-functionality of urban agriculture on the CCs in Japan. Asia Pac. J. Reg. Sci. 2018, 2, 507–527. [Google Scholar] [CrossRef]
- Tipraqsa, P.; Craswell, E.T.; Noble, A.D.; Schmidt-Vogt, D. Resource integration for multiple benefits: Multifunctionality of integrated farming systems in Northeast Thailand. Agric. Syst. 2007, 94, 694–703. [Google Scholar] [CrossRef]
- Mittenzwei, K.; Fjellstad, W.; Dramstad, W.; Flaten, O.; Gjertsen, A.K.; Loureiro, M.; Prestegard, S.S. Opportunities and limitations in assessing the multifunctionality of agriculture within the CAPRI model. Ecol. Indic. 2007, 7, 827–838. [Google Scholar] [CrossRef]
- Liu, C.; Xu, Y.; Huang, A.; Liu, Y.; Wang, H.; Lu, L.; Sun, P.; Zheng, W. Spatial identification of land use multifunctionality at grid scale in farming-pastoral area: A case study of Zhangjiakou City, China. Habitat Int. 2018, 76, 48–61. [Google Scholar] [CrossRef]
- Van Noordwijk, M.; Tata, H.L.; Xu, J.; Dewi, S.; Minang, P.A. Segregate or Integrate for Multifunctionality and Sustained Change through Rubber-Based Agroforestry in Indonesia and China; Springer: Dordrecht, The Netherlands, 2012; pp. 69–104. [Google Scholar]
- Hughes, M.; Jones, R. From productivism to multi-functionality in the Gascoyne-Murchison Rangelands of Western Australia. Rangel. J. 2010, 32, 175–185. [Google Scholar] [CrossRef]
- Barbieri, C.; Valdivia, C. Recreation and agroforestry: Examining new dimensions of multifunctionality in family farms. J. Rural Stud. 2010, 26, 465–473. [Google Scholar] [CrossRef]
- Krajewski, P. Monitoring of landscape transformations within landscape parks in Poland in the 21st century. Sustainability 2019, 11, 2410. [Google Scholar] [CrossRef]
- Krajewski, P.; Solecka, I.; Karol, M. Forest landscape change and preliminary study on its driving forces in Ślęża Landscape Park (Southwestern Poland) in 1883–2013. Sustainability 2018, 10, 4526. [Google Scholar] [CrossRef]
- Lund, J.F.; Jensen, F.S. Is recreational hunting important for landscape multi-functionality? Evidence from Denmark. Land Use Policy 2017, 61, 389–397. [Google Scholar] [CrossRef]
- Zhang, W.; Ricketts, T.H.; Kremen, C.; Carney, K.; Swinton, S.M. Ecosystem services and dis-services to agriculture. Ecol. Econ. 2007, 64, 253–260. [Google Scholar] [CrossRef]
- Hanson, J.D.; Liebig, M.A.; Merrill, S.D.; Tanaka, D.L.; Krupinsky, J.M. Dynamic cropping systems: Increasing adaptability amid an uncertain future. Agron. J. 2007, 99, 939–943. [Google Scholar] [CrossRef]
- Andersen, P.S.; Vejre, H.; Dalgaard, T.; Brandt, J. An indicator-based method for quantifying farm multifunctionality. Ecol. Indic. 2013, 25, 166–179. [Google Scholar] [CrossRef]
- Gaodi, X.; Lin, Z.; Caixia, Z.; Xiangzheng, D.; Koenig, H.J.; Tscherning, K.; Helming, K. Assessing the multi-functionalities of land use in China. J. Resour. Ecol. 2010, 1, 311–318. [Google Scholar]
- Jordan, N.; Warner, K.D. Enhancing the multifunctionality of US agriculture. Bioscience 2010, 60, 60–66. [Google Scholar] [CrossRef]
- Zhang, Y.; Yan, J.; Jiang, P.; Yang, N. Normal cloud model based evaluation of land resources ecological security in Hubei province. Trans. Chin. Soc. Agric. Eng. 2013, 29, 252–258. [Google Scholar]
- König, H.J.; Podhora, A.; Helming, K.; Zhen, L.; Wang, C.; Wübbeke, J.; Baumeister, T.; Du, B.; Yan, H. Confronting in-ternational research topics with stakeholders on multifunc-tional land use: The case of Inner Mongolia, China. iForest 2014, 7, 403–413. [Google Scholar] [CrossRef]
- Paracchini, M.L.; Pacini, C.; Jones, M.L.; Pérez-Soba, M. An aggre-gation framework to link indicators associated with multi-functional land use to the stakeholder evaluation of policyoptions. Ecol. Indic. 2011, 11, 71–80. [Google Scholar] [CrossRef]
- Tong, O.; Shao, S.; Zhang, Y.; Chen, Y.; Liu, S.L.; Zhang, S.S. An AHP-based water-conservation and waste-reduction indicator system for cleaner production of textile-printing industry in China and technique integration. Clean Technol. Environ. Policy. 2012, 14, 857–868. [Google Scholar] [CrossRef]
- Li, S.H. Research on evaluation system of new energy vehicles based on AHP. Appl. Mech. Mater. 2013, 260, 321–325. [Google Scholar] [CrossRef]
- Allan, E.; Manning, P.; Alt, F.; Binkenstein, J.; Blaser, S.; Blüthgen, N.; Böhm, S.; Grassein, F.; Hölzel, N.; Klaus, V.H.; et al. Land use intensification alters ecosystem multifunctionality via loss of biodiversity and changes to functional composition. Ecol. Lett. 2015, 18, 834–843. [Google Scholar] [CrossRef]
- Jordan, N.; Warner, K.D. Towards Multifunctional Agricultural Landscapes for the Upper Midwest Region of the USA; Wiley: New York, NY, USA, 2013; pp. 139–156. [Google Scholar]
- Wang, F.; Dong, Y.X. Dynamic evaluation of land use functions based on grey relation projection method and diagnosis of its obstacle indicators: A case study of Guangzhou city. J. Nat. Resour. 2015, 30, 1698–1713. [Google Scholar]


| Data Types | Data Names | Units | Sources |
|---|---|---|---|
| General Situation of Xiangxi | Agricultural land area, construction land area | hm2 | Land Bureau of Xiangxi |
| DEM elevation data | m | http://www.gscloud.cn | |
| Population composition, GDP, Urbanization rate, Forest Coverage Rate | % | Statistical Yearbook of Xiangxi | |
| The 23 evaluation indexes of land use function | X1, X2 | yuan/person | Statistical Yearbook of Xiangxi or Hunan |
| X3, X6, X7, X10, X11, X13, X18, X19,X20, X21 | % | ||
| X5, X12, X15 | m2/person | ||
| X4 | 104 yuan/km2 | ||
| X8, X14 | yuan | ||
| X9 | person | ||
| X16 | t/person | ||
| X17 | km2/104 yuan | ||
| X22, X23 | t/hm2 |
| Total Function | Sub-Function and Weight | Single Function and Weight | Index Layer and Weight | Indicator Description and Attributes |
|---|---|---|---|---|
| Land function | Production functions (PF), 0.3451 | Agricultural and animal husbandry production function (PF1), 0.1149 | Per capita agricultural output (X1), 0.0856 | Output value of agriculture/Regional population + |
| Per capita output value of animal husbandry (X2), 0.0293 | Animal husbandry output value/Regional population+ | |||
| Economic growth function (PF2), 0.1382 | Proportion of secondary and tertiary industries (X3), 0.0493 | Output value of the second and third industries/GDP + | ||
| The density of economic (X4), 0.0889 | GDP/Gross land area + | |||
| Traffic support function (PF3), 0.0920 | Per capita road area (X5), 0.0500 | Directly come from the statistical Yearbook + | ||
| The proportion of passenger transport turnover (X6), 0.0200 | Directly from the statistical Yearbook + | |||
| Freight turnover as a proportion of the state (X7), 0.0220 | Regional freight turnover/Statewide passenger turnover + | |||
| Living functions (LF), 0.3359 | Employment support function (LF1), 0.0850 | The average annual salary of urban employees (X8), 0.0425 | Directly from the statistical Yearbook + | |
| Rural agricultural personnel (X9), 0.0425 | Directly from the statistical Yearbook + | |||
| Social security function (LF2), 0.0851 | Urban-rural income balance index (X10), 0.0465 | Per capita disposable income ratio of urban and rural residents + | ||
| Incidence of poverty (X11), 0.0386 | Directly from the statistical Yearbook - | |||
| Cultural and leisure function (LF3), 0.0792 | Per capita park green space (X12), 0.0264 | Directly from the statistical Yearbook + | ||
| The proportion of residents’ expenditure on culture, education, and entertainment (X13), 0.0528 | Residents’ expenditure on culture, education, and entertainment/residents’ total expenditure + | |||
| Residential home function (LF4), 0.0866 | Rural per capita housing value (X14), 0.0288 | Directly from the statistical Yearbook + | ||
| Per capita housing area (X15), 0.0578 | Directly from the statistical Yearbook + | |||
| Ecological function (EF), 0.3190 | Resource supply function (EF1), 0.0878 | Urban water supplies per capita (X16), 0.0439 | Total urban water supply/urban population + | |
| Per capita land area (X17), 0.0439 | Land area/area population + | |||
| Ecological maintenance function (EF2), 0.1068 | Green coverage of the built-up area (X18), 0.0551 | Directly from the statistical Yearbook + | ||
| Forest coverage (X19), 0.0517 | Directly from the statistical Yearbook + | |||
| Environmental purification function (EF3), 0.1244 | Urban sewage treatment rate (X20), 0.0622 | Directly from the statistical Yearbook + | ||
| Centralized disposal rate of rural garbage (X21), 0.0388 | Directly from the statistical Yearbook + | |||
| Amount of fertilizer applied per unit cultivated land (X22), 0.0078 | Fertilizer application/cultivated area - | |||
| Pesticide application amount per unit of cultivated land (X23), 0.0156 | Pesticide application/cultivated area - |
| Year | Jishou | Luxi | Fenghuang | Huayuan | Baojing | Guzhang | Yongshun | Longshan | |
|---|---|---|---|---|---|---|---|---|---|
| The obstacles of total function | 2013 | LF | PF, LF | PF | PF | PF | PF, LF | PF | PF |
| 2014 | PF | PF, LF | PF | PF | PF | PF, LF | PF | PF | |
| 2015 | LF, EF | PF, LF | PF | PF, LF | PF | PF, LF | PF | PF, LF | |
| 2016 | LF, EF | PF | PF | PF | PF | PF | PF | PF | |
| 2017 | LF, EF | PF | PF | PF | PF | PF | PF | PF | |
| The obstacles of sub-function | 2013 | PF1, LF1, EF3 | PF1, PF2, PF3 | PF1, PF2, PF3 | PF1, PF2, PF3 | PF2, PF3, EF1 | PF2, PF3, LF1 | PF2, PF3, LF3 | PF2, PF3, EF2 |
| 2014 | PF1, PF2, EF3 | PF1, PF2, PF3 | PF1, PF2, PF3 | PF1, PF2, PF3 | PF2, PF3, LF3 | PF2, PF3, LF3 | PF2, PF3, LF3 | PF2, PF3, LF3 | |
| 2015 | PF1, LF3, EF3 | PF2, PF3, LF3 | PF2, PF3, EF3 | PF1, PF2, PF3 | PF2, PF3, LF3 | PF2, PF3, LF3 | PF2, PF3, LF3 | PF2, PF3, LF3 | |
| 2016 | PF1, LF2, EF3 | PF2, PF3, LF1 | PF2, PF3, EF3 | PF2, PF3, EF1 | PF2, PF3, EF3 | PF2, PF3, LF1 | PF2, PF3, LF3 | PF2, PF3, LF3 | |
| 2017 | PF1, LF2, EF3 | PF2, PF3, LF1 | PF2, PF3, EF3 | PF1, PF2, PF3 | PF2, PF3, LF3 | PF2, PF3, EF2 | PF2, PF3, LF2 | PF2, PF3, EF3 |
© 2019 by the authors. Licensee MDPI, Basel, Switzerland. This article is an open access article distributed under the terms and conditions of the Creative Commons Attribution (CC BY) license (http://creativecommons.org/licenses/by/4.0/).
Share and Cite
Xiang, H.; Yang, Q.-Y.; Su, K.-c.; Zhang, Z.-X. Spatiotemporal Dynamics and Obstacles of the Multi-Functionality of Land Use in Xiangxi, China. Appl. Sci. 2019, 9, 3649. https://doi.org/10.3390/app9183649
Xiang H, Yang Q-Y, Su K-c, Zhang Z-X. Spatiotemporal Dynamics and Obstacles of the Multi-Functionality of Land Use in Xiangxi, China. Applied Sciences. 2019; 9(18):3649. https://doi.org/10.3390/app9183649
Chicago/Turabian StyleXiang, Hui, Qing-Yuan Yang, Kang-chuan Su, and Zhong-Xun Zhang. 2019. "Spatiotemporal Dynamics and Obstacles of the Multi-Functionality of Land Use in Xiangxi, China" Applied Sciences 9, no. 18: 3649. https://doi.org/10.3390/app9183649
APA StyleXiang, H., Yang, Q.-Y., Su, K.-c., & Zhang, Z.-X. (2019). Spatiotemporal Dynamics and Obstacles of the Multi-Functionality of Land Use in Xiangxi, China. Applied Sciences, 9(18), 3649. https://doi.org/10.3390/app9183649