Article

An Amalgamation of Hormone Inspired Arbitration Systems for Application in Robot Swarms

1
Department of Electronic Engineering, University of York, York YO10 5DD, UK
2
Faculty of Technology, University of Sunderland, Sunderland SR1 3SD, UK
*
Author to whom correspondence should be addressed.
Appl. Sci. 2019, 9(17), 3524; https://doi.org/10.3390/app9173524
Submission received: 31 July 2019 / Revised: 19 August 2019 / Accepted: 22 August 2019 / Published: 27 August 2019
(This article belongs to the Special Issue Multi-Robot Systems: Challenges, Trends and Applications)

Abstract

:
Previous work has shown that virtual hormone systems can be engineered to arbitrate swarms of robots between sets of behaviours. These virtual hormones act similarly to their natural counterparts, providing a method of online, reactive adaptation. It is yet to be shown how virtual hormone systems could be used when a robotic swarm has a large variety of task types to execute. This paper details work that demonstrates the viability of a collection of virtual hormones that can be used to regulate and adapt a swarm over time, in response to different environments and tasks. Specifically, the paper examines a new method of hormone speed control for energy efficiency and combines it with two existing systems controlling environmental preference as well as a selection of behaviours that produce an effective foraging swarm. Experiments confirm the effectiveness of the combined system, showing that a swarm of robots equipped with multiple virtual hormones can forage efficiently to a specified item demand within an allotted period of time.

1. Introduction

In nature, hormones provide an adaptation technique that cues behavioural change through chemical processing. As stimuli reach cells or organs hormone chemicals are produced and diffused throughout the body. The build up and gradual decay of these hormones as they are metabolised gives an organism contextual information based on how frequently stimuli are received. The balance and concentration of various hormones can then influence behaviour of the organism. These hormone induced changes to behaviour have been observed in a variety of natural examples [1,2,3].
In the context of robotics, previous work has shown that virtual hormones can be engineered to control, arbitrate and adapt swarms of robots amongst a small set of behaviours in a similar manner to the examples seen in nature [4,5,6]. However, it is yet to be shown how hormone systems could be used when a large array of behaviours and task types are available to a swarm. Evidence of virtual hormones being used to control such systems in simulation would provide evidence of their viability in non-abstracted tasks and support virtual hormone implementation in physical systems. This paper identifies for the first time, the viability of combining multiple hormone systems at once, each regulating a separate function or feature of the swarm. The primary goal of this amalgamation of hormone systems will be to ensure that the benefits of each system can provide improvements to the energy efficiency of a foraging swarm when combined, without disrupting the performance of other systems.
Having already explored several applications for hormone inspired systems in previous work [5,7] in which virtual hormone systems have effectively regulated behaviours and preference, respectively selecting appropriate states in a dynamic environment and allocating robots to environments based on their performance across different terrains. The work in this paper combines these applications to create an energy efficient foraging swarm regulated by numerous, simultaneously functioning hormones.
The hormones comprising the amalgamation operate at different levels of a behavioural hierarchy (illustrated in Figure 1), controlling preference, behavioural control and actuator control. Combining systems acting at these different levels of behaviour allows for the swarm to be controlled by hormones at every stage of operation, truly testing the combined systems capabilities and compatibility. This, alongside the fact that more than three times the number of individual hormone types previously studied have been used in these experiments means that the number of hormones used in this amalgamation can be considered numerous.
Section 3 investigates virtual hormone driven motor control as a method to improve energy efficiency in the foraging swarm. This will focus on the need for adaptive motor speeds and their implementation.
Section 4 explores the compatibility between this new system and one governing sleep [5]. The potential energy efficiency benefits of combining a sleep system and a virtual hormone framework are examined.
Section 5, the swarm will be diversified, using the heterogeneous wheel types designed in [7], and a system capable of self analysis for task reallocation is combined with the previously established hormone speed and sleep regulation. Thus creating a system with 6 or more simultaneously acting virtual hormones in each member of the swarm, depending on the number of environments available to the swarm.
The implementation of this complex virtual hormone system will be effective for live adaptation and produce significant improvements to energy efficiency in foraging examples over individual hormone systems.
Finally, Section 7 gives a number of conclusions for the presented work and suggests future areas of investigation.

2. Background

Virtual hormones and hormone-inspired systems have previously been used to directly control the motor functions of a single robot. In [8] the authors presented a method that modelled a robot as two cells controlling the left and right motor of a puck robot, each motor was driven by their own hormones H r and H l with wheel speed changing proportionately with the magnitude of hormone value. The hormones for each cell were stimulated by a proximity sensor and were capable of diffusing between cells, acting as an inhibitor to the opposing hormone when present in the neighbouring cell. With the hormone values corresponding to the wheel speeds on the respective sides of the robot, this produced an effective hormone controlled method for obstacle avoidance. The study found that this system could be successfully implemented in hardware and could be well studied with an exhaustive parameter sweep for ‘reasonable computational cost’.
Similarly, work by Kernbach et al [9] produced a system which allowed hormones to regulate the movement of individual robots in a similar manner to [8]. This work added additional function to the virtual hormone, using the same hormone to regulate an additional behaviour state. In this new behaviour state the robots conjoined to produce a larger, specialised morphology. The hormone in this state was re-purposed to create a hormone gradient, regulating the size of the newly formed conjoined organism. This showed that, while explicit control over a robot is attainable with a virtual hormone system, virtual hormones can also be used to effectively arbitrating behaviour states.
Following this work additional hormone-inspired controllers have been successfully implemented to adapt swarm morphology, identifying context to environments via stimuli and then constructing appropriate formations [4,10]. These studies show that hormone-inspired systems can be engineered to provide an effective, computationally inexpensive method for robot control.
The need for mid-task adaptation for the energy efficient use of robot swarms has been highlighted in works such as [11]. In which the energy consumption of several bio-inspired robotic coordination procedures were investigated. This investigation found that energy consumption typically increased in line with parameters (e.g., swarm size, arena size, number of tasks). It is, therefore, important that such parameters are understood and controlled for before engaging in a task. This finding strengthens the demand for self allocating systems such as [5,7,12] that modulate the number of active robots performing a task. These self regulating systems reduce the need for a centralised decision on swarm size and means that swarms can instead perform multiple different tasks in series or explore different environments sequentially, without needing to return and redeploy.
In the previous implementations of hormone arbitration systems found in [5,7] the adaptive properties of hormone equations have been utilised for both task arbitration and robotic preference. By using hormone equations that provide a value that decays over time and increases as specified stimuli are encountered, environmental features can be extrapolated based on the current value provided by the equation. Through the comparison of hormone values receiving different stimuli or the comparison of hormone values present in different robots, hormone equations provide a powerful tool at a low computational cost for respectively regulating tasks or ranking the performance of robots within a swarm.
Using virtual hormones as a method for behavioural control, while providing a strong method for adaptation, does take an element of control away from the user. In traditional behavioural control where user defined thresholds or specific actions are used for behaviour transition, systems can be produced that behave consistently and repetitively in a manner that virtual hormones cannot. However, while this may be appropriate for individual robots whose performance and interactions can be predicted, in the context of swarms of robots exploring dynamic and volatile environments the level of on-line adaptation a virtual hormone system provides to the swarm will typically produce a better performance.
While the advantages of behavioural and preference control have be previously studied, there is very little literature on energy efficient speed control systems capable of adapting to demand. There are some examples of research investigating optimal speeds for energy efficiency [13,14]. However, this research only relates to rail vehicles, providing little relevance to puck robot vehicles. For this reason, the next section begins by obtaining data from real robots to obtain information that can be used to produce the motor driving hormone system before it is added to the other, previously developed hormone systems.

3. HIBAS Implementation for Control of a Foraging System with Deviating Motor Speeds

Hormone Inspired behavioural arbitration systems (HIBAS) have been studied using energy efficiency as the target output [5,7]. However, the speed at which robots move and the efficiency of their movement, vital to energy efficiency, have not been investigated. When simulating the energy consumption of robots it is typically assumed that robots in the swarm are either moving at a specific speed, stationary or consuming a fixed quantity of energy in a given behaviour state [5,12,15,16]. This section investigates the viability of virtual hormone implementation to directly control and adapt wheel speeds to achieve improved energy efficiency when foraging. A ‘demand’ concept will be present in the task that allows the user to specify, prior to or during use, the number of items to be gathered in a given time period. The purpose of this is to add an additional complexity for the swarm to overcome through adaptation.

3.1. Energy Characteristics of Psi Swarm Robot Hardware

In order to bring realism to the simulated experiments and reduce the reality gap data was taken from the PSI swarm robot platform [17] to obtain a power model similar to that produced in [18] for the MarXbot. This model would take an individual robots speed as an input and produce a realistic value for the power consumed at a given time step. As a result the total energy consumed by the swarm across an experiment could be recorded using reports of energy consumption from each swarm member, providing more meaningful data regarding changes of speed within the experiment.
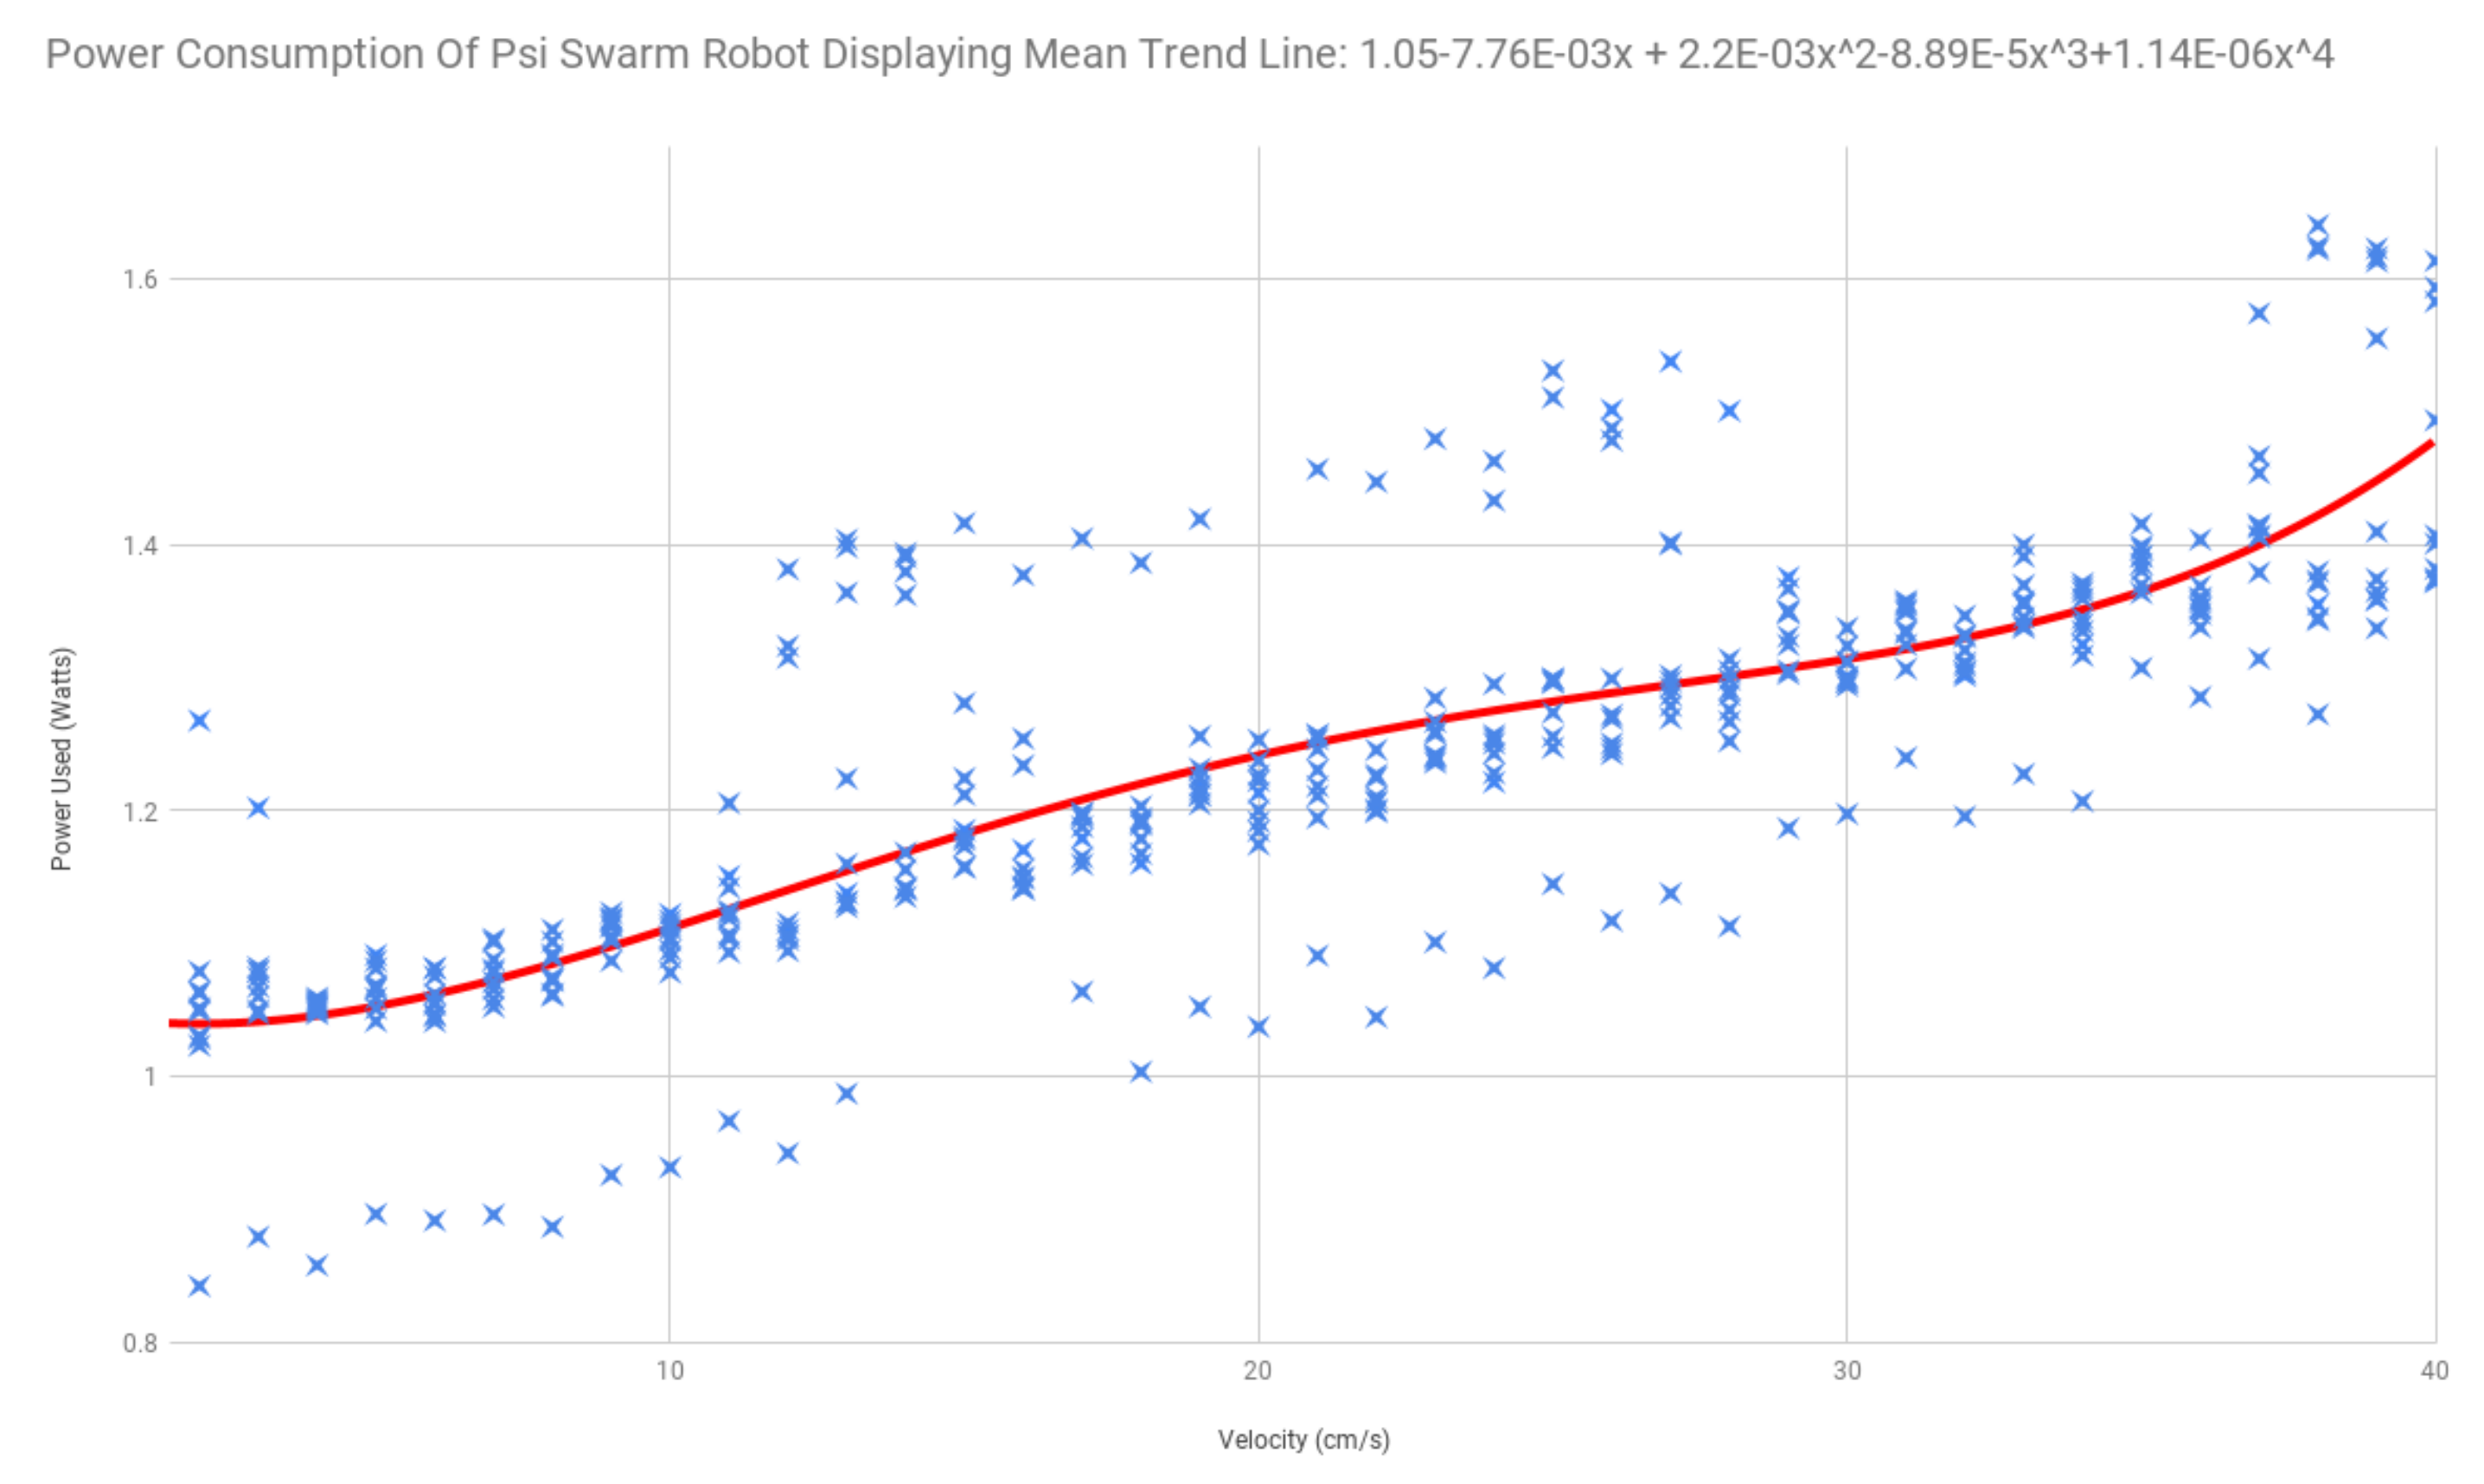
To construct a power model, power consumption was measured using a Keysight N6705B power analyser [19]. Results for power consumption as speed increases were recorded through 10 repetitions and a quartic trend line was fit to the mean of these results, this is illustrated in Figure 2. The resultant equation for power consumption with speed as the input was:
P = 1.05 7.76 × 10 3 s + 2.2 × 10 3 s 2 8.89 × 10 5 s 3 + 1.14 × 10 6 s 4
where P is energy consumption per second (Watts) and s is the current speed of the robot (cm/s). When implementing this equation in the robot swarm simulation, the offset of 1.05 was reduced to 0.05, as it was assumed that most of the offset was due to the base consumption of energy used by robot peripherals. The offset of 0.05 was left to ensure a negative power was never experienced during experiments. The equation was also scaled for the appropriate time frame, ensuring that the correct amount of power per wheel was collected per experiment tick. This equation was then used at each time step to calculate the current energy consumption based on the speed of each individual robot. Energy consumption could then be used to feed into the value of energy efficiency that would be used to measure the fitness of the systems tested in the experiments presented in this paper.
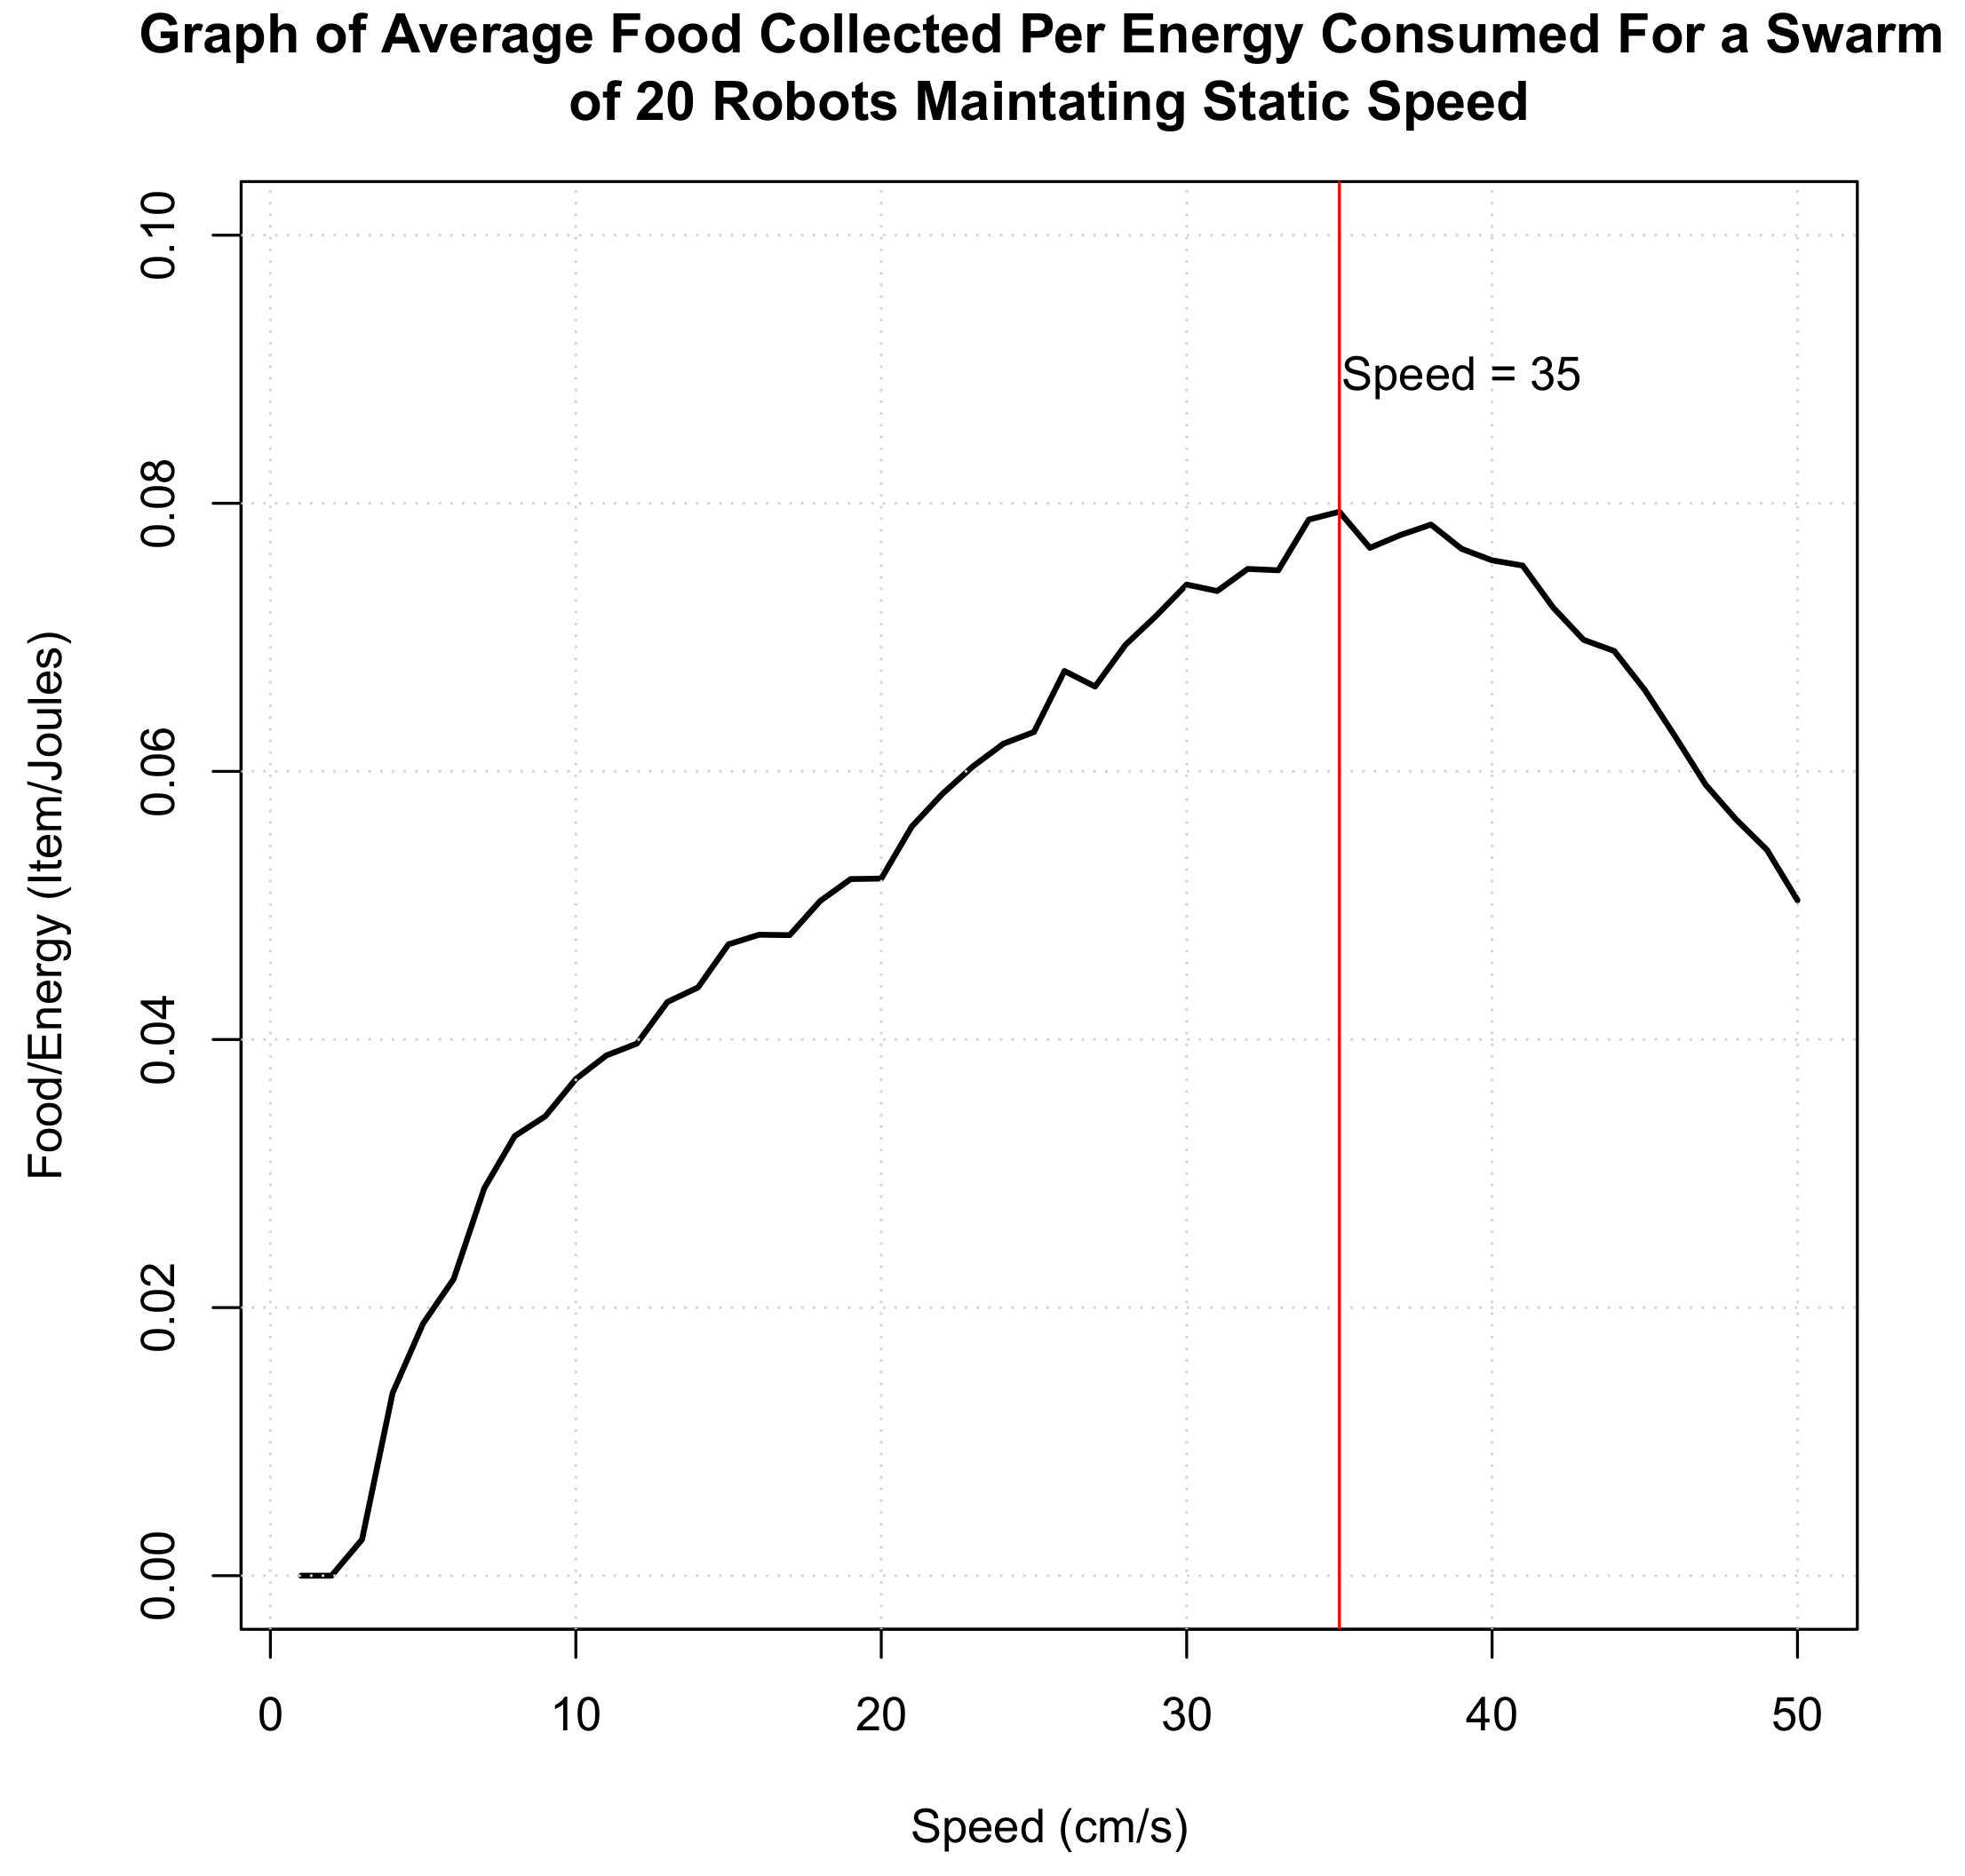
After implementing Equation (1) in the simulation, the analyses of energy efficiencies at different speeds were conducted. In these tests, 20 robots foraged in a simple environment for 500 simulated seconds or until 100 food items were gathered. The average final energy efficiency (food item per unit of energy consumed) from 50 trials at speeds ranging from 1 to 50 cm/s were then plotted (illustrated in Figure 3). Taking the peak value of energy efficiency for a given speed, a value was chosen to act as a baseline for the following experiments.

3.2. Hormone Interaction with Motor Speed

To produce a hormone equation that controlled motor speed in a direct manner and at appropriate speeds given context, it was decided that the two primary influencing factors should be: item demand and the evidence of negative performance.
The presence of frequent collisions and the decay present from failing to achieve task goals have been demonstrated as good indicators of negatives performance [5,7]. Collisions in these cases are identified by the detection of objects by short range proximity sensors, activating the avoidance behaviour, rather than a physical collision between a robot and another entity. These features were therefore used as the first step in the implementation of the new hormone system. The decay would reduce the hormone, and subsequently the speed, to an efficient settling point. Collisions would also reduce the hormone, thus inhibiting the speed of poorly performing robots and limiting their impact on energy consumption.

3.2.1. Demand

‘Demand’, as a new feature to the virtual hormone system, required the development of a novel formula accounting for: a target number of items to be collected (to be specified before deployment), the allotted time to collect said items, the current collection rate throughout the experiment. Following this, Equation (2) was created:
D ( t ) = I T t T I c + 1 t
In this equation D ( t ) represents the demand function, I T is the total number of items desired by the end of the allotted time period, t T is the end time for the allotted period, I c is the current number of stored items and t is the current time step. Decentralisation is required to remain ‘swarm like’ during the experiment, therefore the ‘demand value’ is only accessible to individual robots in the nest. The value is updated as they leave and used as their stimuli throughout their next period of exploration.
Equation (2) models the demand value to fluctuate as items were collected without incurring an exponential increase near the end of the experiment should the swarm only be a few items away from the target collection. By setting the demand as the difference between the required average rate of collection and the current rate of collection, the hormone value and speed could increase with repeated failure to meet target collection rates. This meant that speed would only slightly deviate from the optimal speed of travel. Gradual incrementation in this manner prevented an inefficient burst of speed late in the experiment to compensate for a lack of items collected.
With a function for demand in place, the two Hormone equations were produced (Return Hormone and Speed Hormone, shown respectively in Equations (3) and (4)) to regulate the speeds and behaviours of each robot in the swarm. The hormones produced in these experiments were designed in the same format as [5,7] with λ representing decay and γ representing the coefficient of stimuli.

3.2.2. Return Hormone

The return hormone equation is as follows:
H r ( t ) = λ r H r ( t 1 ) + γ r C
where t is the current time step H r is the return hormone, λ r is the decay for the system and γ r is the stimuli weighting. The return hormone has a single stimulus, C, for collision detection. Although it does not regulate speed, it does feed into the speed hormone. The primary function of the Return Hormone is to identify the frequency of collisions detected by a robot, between walls or other robots. This information can then be used to decide if an individual robot should return to the nest having been unsuccessful, typically by exceeding either a fixed or similarly adaptive threshold. At this stage the threshold for returning was set to 50, with any value of H r exceeding that resulting in a given robot changing behaviour state and travelling back to the nest site.

3.2.3. Speed Hormone

The speed hormone equation is as follows:
H s ( t ) = λ s H s ( t 1 ) + γ s 1 D ( t ) γ s 2 H r
where H s ( t ) is the Speed Hormone, λ s is the decay rate for the system, γ s 1 is the weighting for the stimuli and γ s 2 is the weighting for the inhibitor. The speed hormone had two influencing factors. A stimulus, D ( t ) (Demand), and an inhibitor, H r . With these features in place, higher demand would result in faster activity, consuming more energy but reducing the item demand. Conversely, the system would slow down robots in poor positions or in areas densely populated by other members of the swarm, consuming less energy while in a compromised position. It is worth noting that H r was used in this case rather than C in order to smooth the response to collisions, rather than experiencing a sudden, large value inhibiting the system upon encountering a collision, H r allows for the reduction to H s to be smooth and gradual. This avoids the sudden loss of mobility in what could potentially be a one off collision.
While the speed of a robot does increase with the Speed Hormone, it doesn’t have true direct control over the motor speed as has been seen in studies such as [8]. Instead, the Speed Hormone system allows the robot to operate at the optimal travelling speed for energy efficiency. To avoid deviation from this speed at low hormone levels, the speed hormone has no effect on speed until it exceeds the value of 10. Values below 10 in speed hormone would have very minimal effect on the actual speed of the robot while still reducing energy efficiency by deviating from the optimal speed. After the value of 10, the speed hormone effects the speed with the relationship shown in Equation (5), providing potential speeds ranging between 35, for H s values below 10, and 50 when H s is fully saturated.
S = 33.33 + H s 6

3.2.4. Parameters

Parameter values for the hormone equations (shown in Table 1) were selected empirically using the context of the experiments to decide on appropriate time scales for decay, these time scales were then converted to decay values using Equation (6), taking values for H s a t (the numerical value at which the virtual hormone will saturate) and H f i n (the smallest value deemed relevant to the hormone system) as 100 and 1 respectively. The period of decay chosen for the sleep hormone was based on the amount of time it would take for an ideally operating robot to locate and retrieve two food items. i.e., the time it would take to reach the centre of available items and return twice, travelling in a straight line while operating at optimal speed. This meant that under ideal operation stimuli from the previous collection would still be present when returning for the second time, allowing the hormone value to build. The period for decay for the return hormone was calculated for only a single full collection and the collisions in a previous search period should have minimal bearing on that of the next.
λ = H f i n H s a t n
Stimuli coefficients were subsequently chosen to provide adequate response when interacting at expected minimum and maximum values of decay and rate of collision.

3.3. Comparison Systems

In order to test how effective the designed hormone systems were, two additional systems were produced for comparison. The first had no adaptive element, keeping all robots at optimal speed (35 cm/s) while foraging. This system was not influenced by ‘demand’ and should highlight the point at which speed adaptation is required to obtain remaining items required in the collection. In order to keep environmental awareness consistent across the three systems, the return hormone was implemented across all systems, allowing swarm members to return to the nest site should they encounter too many collisions.
The second comparison system featured an on-line adaptation method similar to reinforcement learning. This engineered adaptation was driven by the same function for demand as featured in the virtual hormone system. This style of online engineered adaptation has been used in the past to modify swarm traits, finding optimal partition lengths in [20] modifying travel distances based on success and failure of swarm individuals.
The adaptive system, designed for speed control, stepped the robot motor speeds up or down depending on the value of demand upon returning to the nest site. Positive demand values would increase speed, and negative values would decrease it. As with the hormone system, this would allow speed to be increased or decreased (and hence increase or decrease energy expenditure) in relation to collection requirements.
The increments and decrements made by the engineered system were influenced by demand, providing a variable adaptation to the system. A base change of 1 was applied based on the sign of the demand in addition to a change proportionate to the value of demand itself, increased by a coefficient of 20 to make suitable changes to the speed value. These values were tuned via iterative selection to produce strong rates of collection and energy efficiency across a wide variety of task demands.
The base change was used so that the swarm can catch up to the required collection rate even when demand is small. If this change was not implemented, increments based solely of demand would be too small to have a perceivable effect on robot speed. The same effect could not be achieved by increasing the coefficient of demand because the system could react too quickly to large disparities in current collection rate versus required rate and overcompensate by a large margin.

3.4. Analysis of Systems Highlighting the Need for Adaptation

After designing these systems, preliminary tests were conducted to demonstrate why adaptation is required for the foraging task. This section will elaborate on the environment in which the systems where tested, detail the key features of the simulations and discuss the results produced from the experiments.

3.4.1. Environments

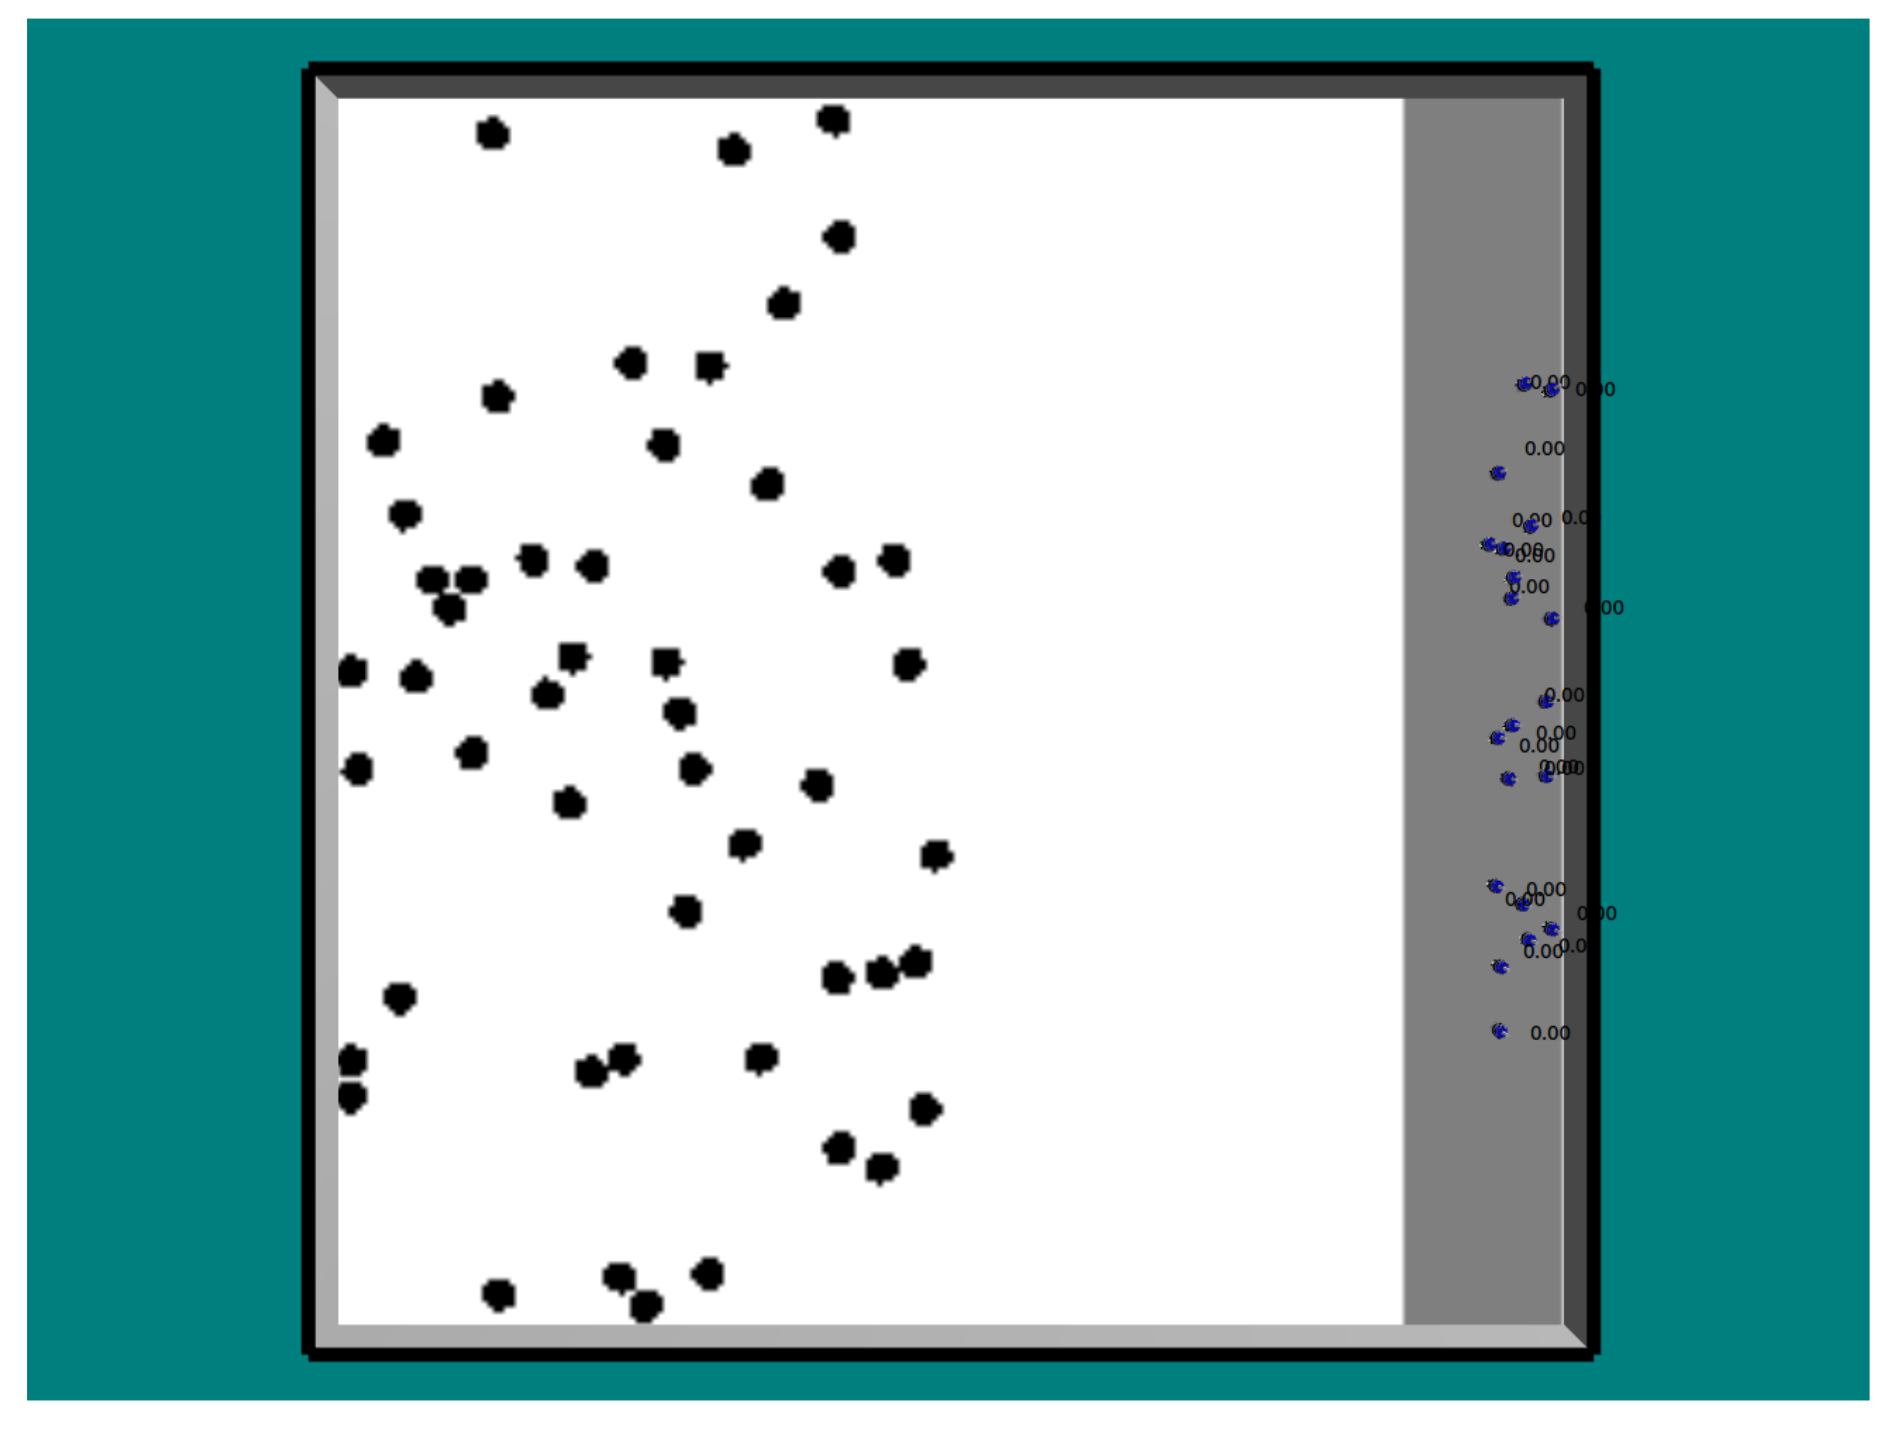
The three systems discussed in this paper were tested in two environments. The first is a square environment measuring 15 × 15 m. The first 2 meters of the environment were assigned as the nest area, highlighted in grey as illustrated in Figure 4. This environment provided an arena for simple operation, identifying whether the system, under only the pressure of the specified demand could operate effectively.
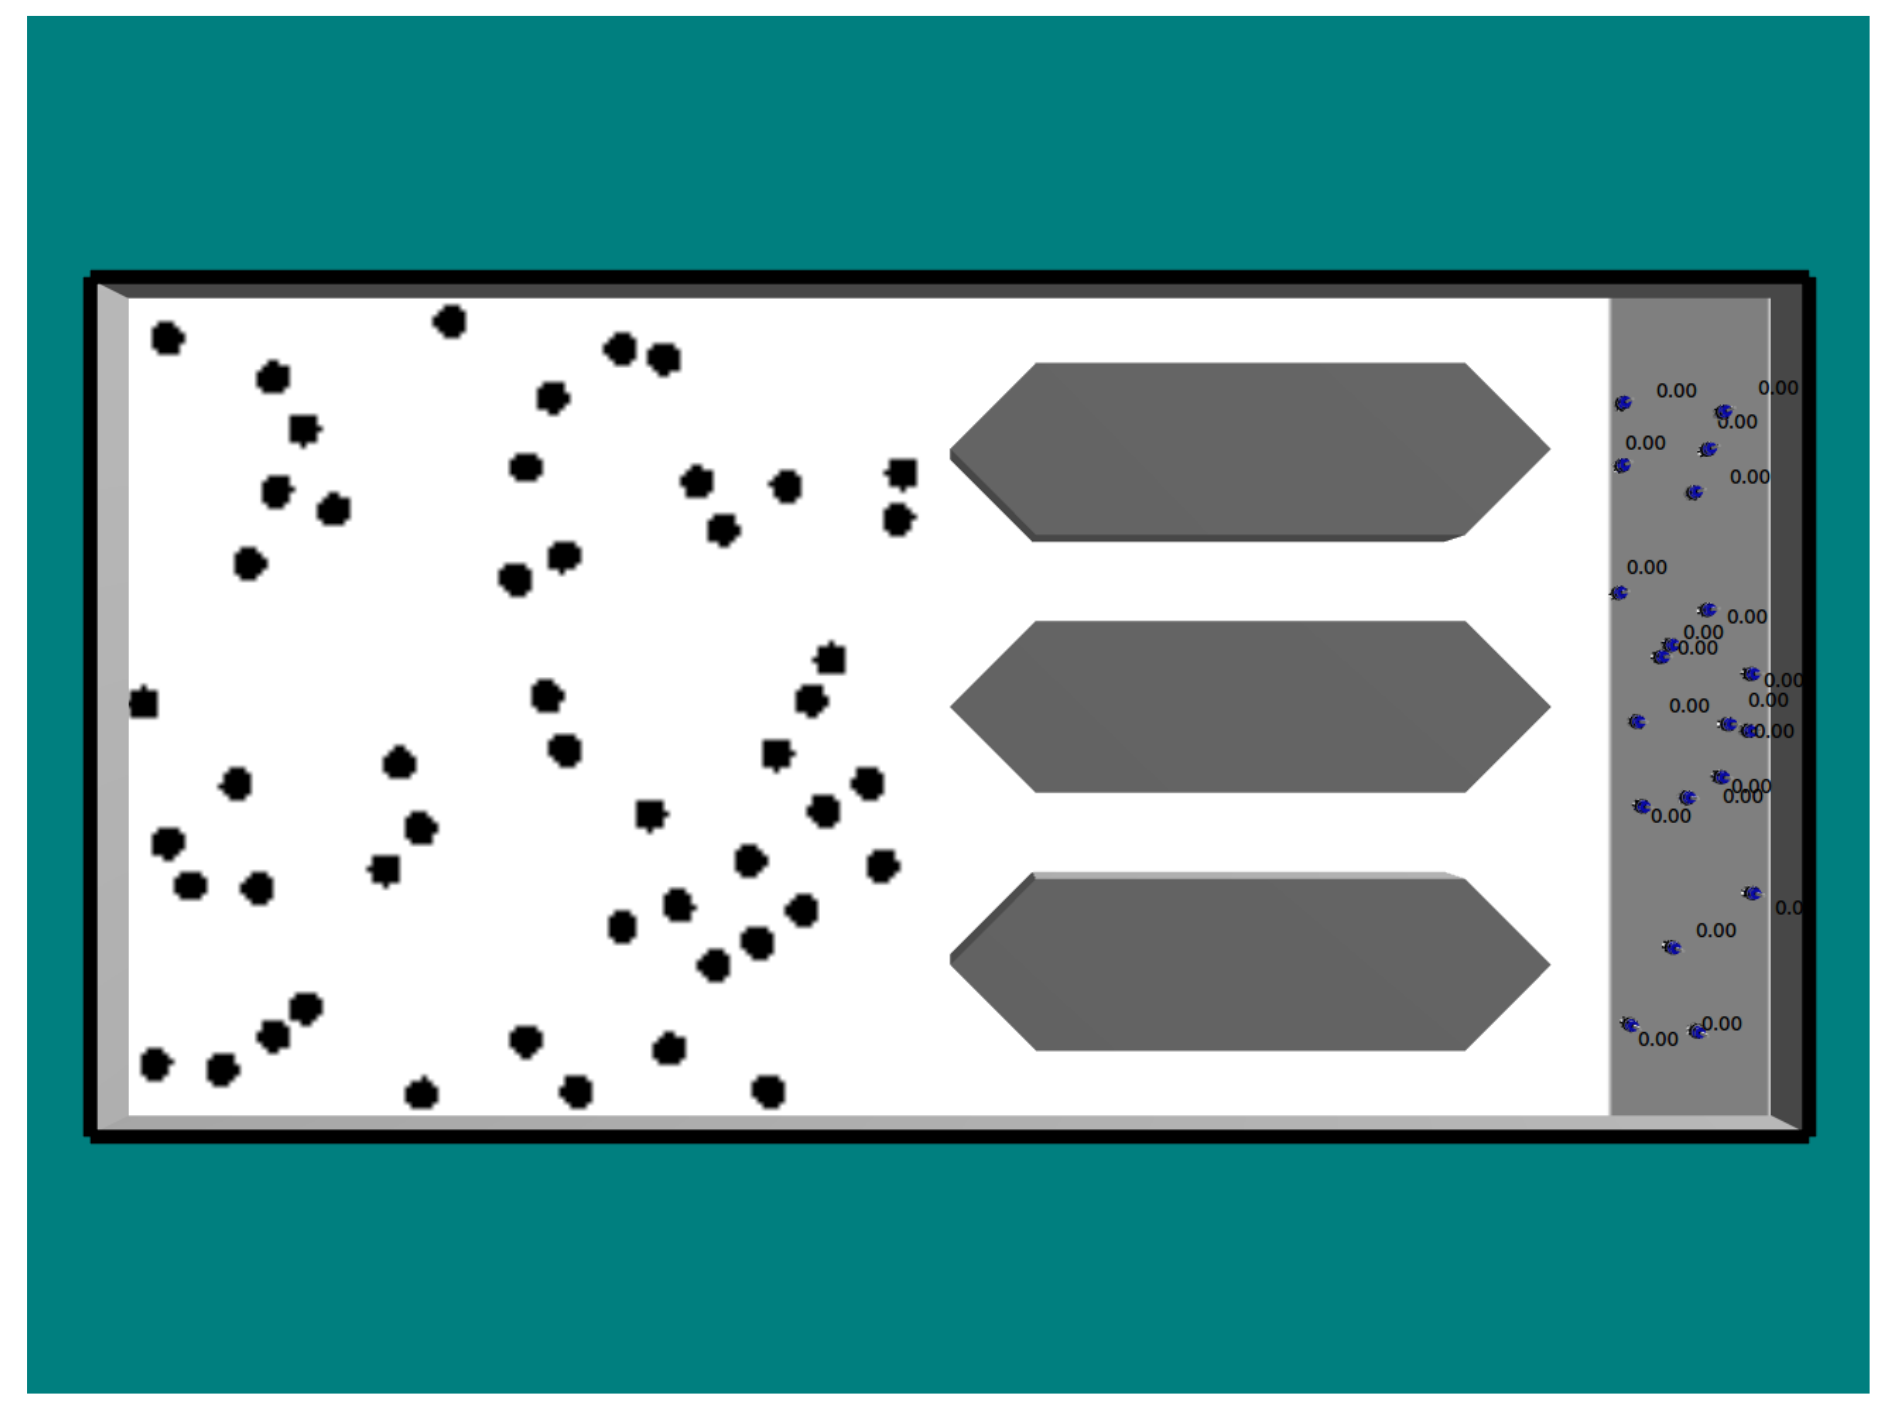
The second environment (illustrated in Figure 5) instead measured 20 × 10 m though retained a similar nest layout to the first. Four funnelled corridors were included in this environment to act as obstacles. These increase swarm density during exploration and provides additional difficulty to the tested systems, akin to that of a group of robots attempting to complete tasks in industrial settings such as mines, power plants or drainage systems, where space could be limited. This congestion will not only limit the success of the robots by slowing them down, but short range collision sensors will be triggered more frequently, meaning that the return hormone will potentially instruct robots to return home too early. This will heavily test the adaptability of the system, giving the combination of hormone systems a greater challenge, making the probability of one system disrupting the other in a negative fashion more likely.

3.4.2. Simulation

The experiments were performed in the ARGoS simulator [21] a multi robot simulator used to simulate large robot swarms. It was assumed that each of the robots was equipped with a food sensor, allowing them to identify food items within a 2m radius and each experiment featured a swarm of 20 robots.
Each test was executed for 500 simulated seconds (each simulation time step lasting 0.1 s) or until the target number of food items were collected.
The number of replicates required for consistent results were determined by performing cumulative mean tests as specified in [22]. This test indicated that the minimum number of trials required for consistency was 36. Therefore, 36 was the lowest number of replicates used when testing these systems.

3.5. Results

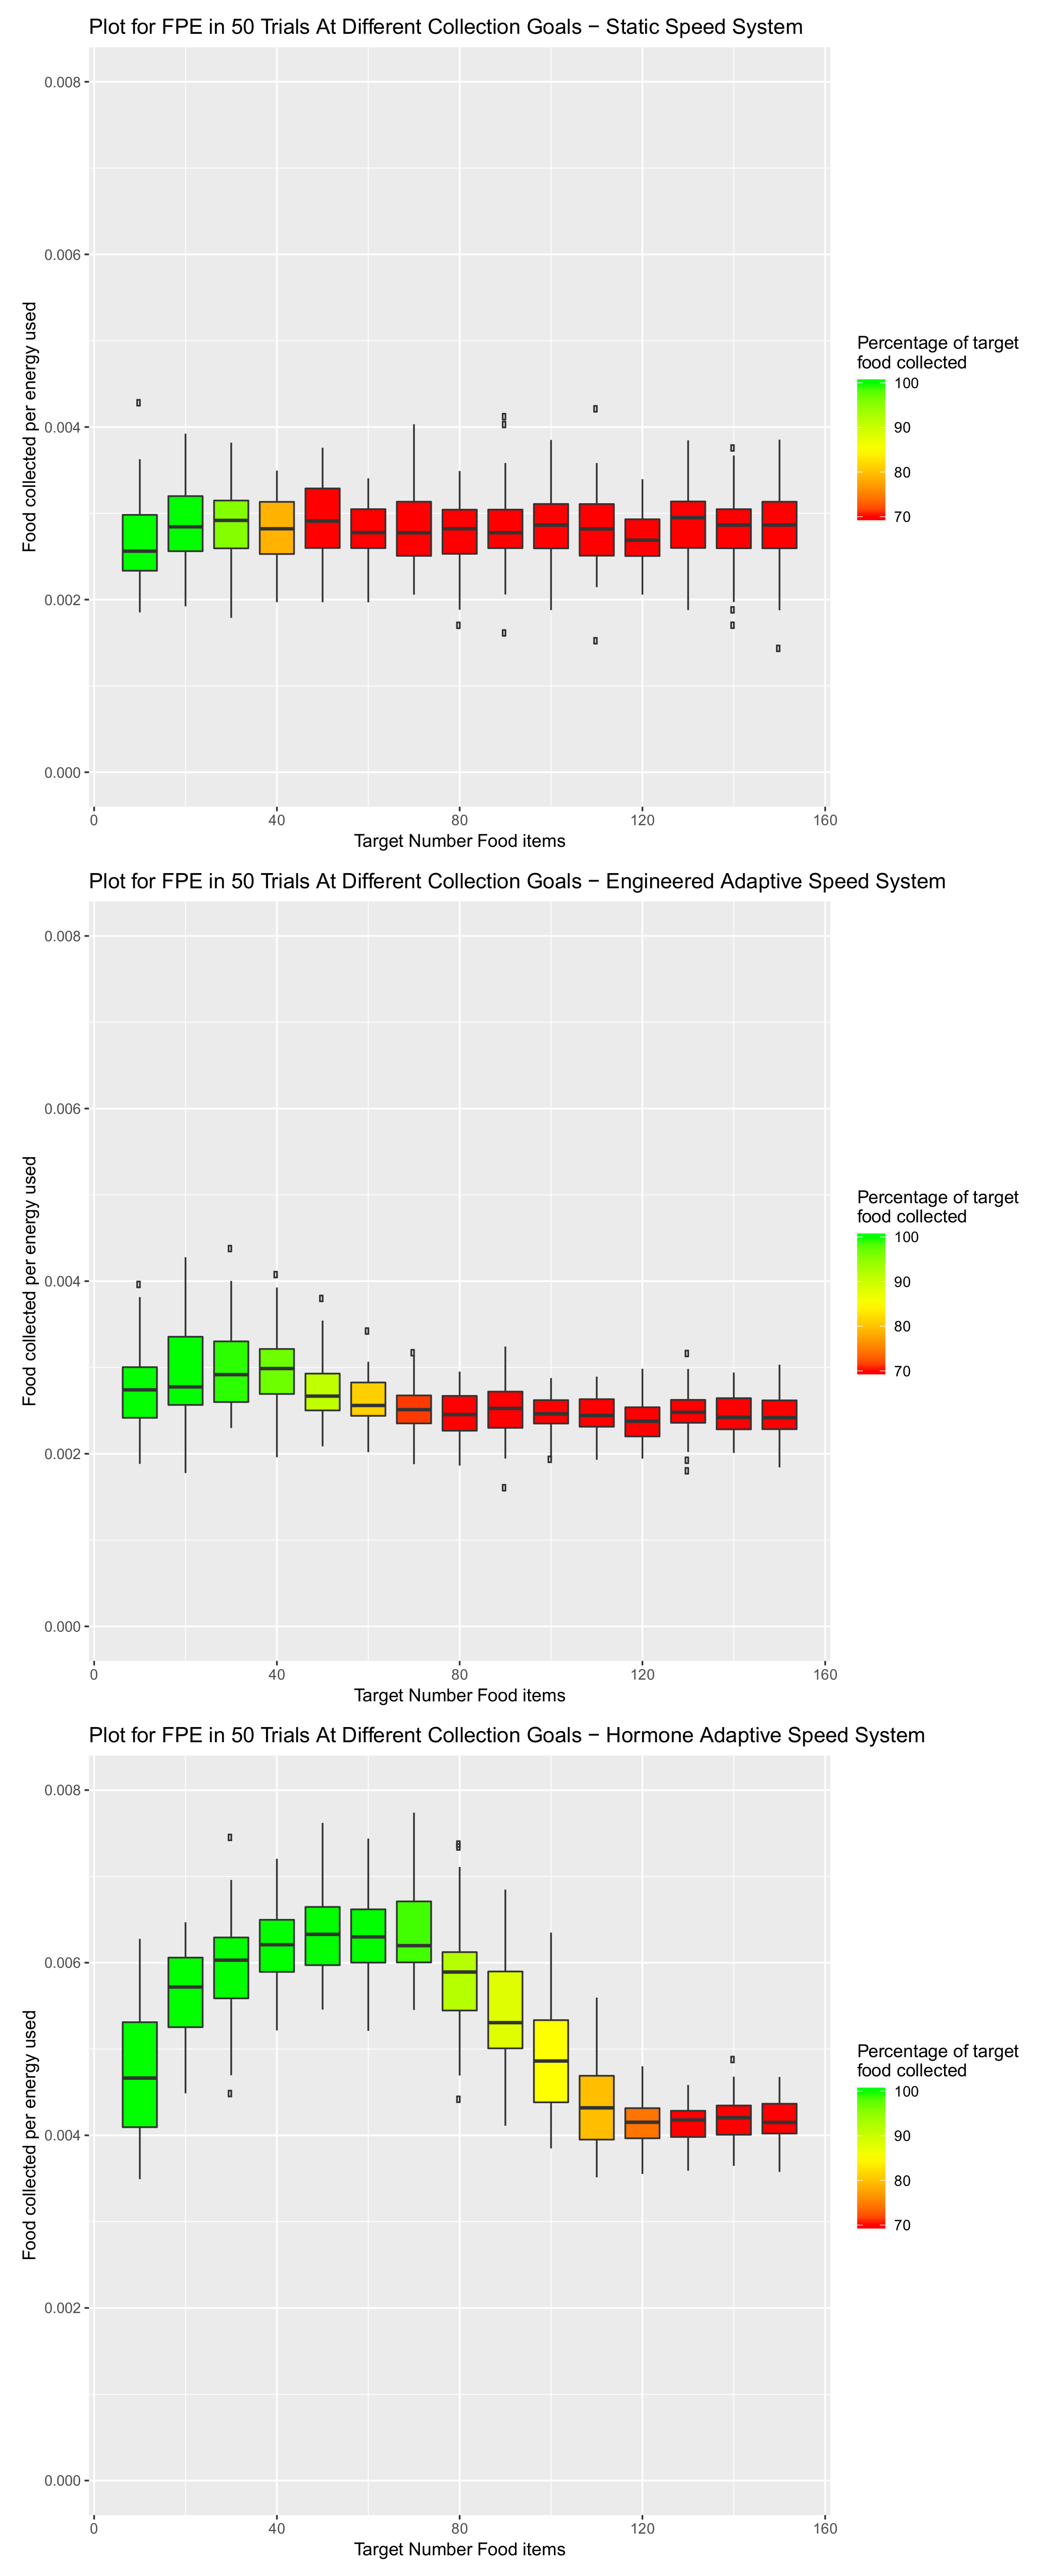
The results are illustrated in Figure 6 for environment 1 and Figure 7 for environment 2.

3.5.1. Environment 1—Square Open Arena

Visual inspection of the first environment (Figure 6) shows that the static speed system has a fairly consistent level of food collected per energy unit used as the demand increases. This is expected due to the lack of change in speed, though the lowest target number for item collection does see a drop in energy efficiency when compared with the rest of the collection rates. This is because not all of the robots in the swarm will have returned to the nest by the time the experiment terminates having reached the target number of items. This will result in unnecessary energy consumption from the robots unable to return food items within the short period of the experiment.
The downside of this consistent energy consumption is the inability to reach greater item target numbers. This drawback can be seen in the discolouration of the box plots starting at 100 food items required and saturating to red, indicating a collection of less than 70% of the required items, by 130 required items.
Disregarding the lack of success in large item demand experiments, the results from the static speed system provide a strong baseline for energy efficiency. Giving a clear target for the other two more intelligent systems to aim for.
When inspecting the results of the two adaptive system it is immediately obvious that target collections are met more consistently with the demand function introduced to the system, with discolouration starting at 120 in the engineered system and 130 in the hormone system. In the engineered system the collection rate drops to approximately 80% by the 150 item goal while the hormone system still manages to collect upwards of 90%.
In terms of energy efficiency the engineered adaptive system follows a similar initial trend to the none adaptive system. The similarity is maintained until an item target of 50, at which point the engineered system becomes increasingly less efficient. Table 2 supports this, showing that there is no significant difference in the data sets of the Engineered and static systems until 70 target items. At this point the systems diverge as the engineered system consumes more energy.
These results also show that the hormone system managed to outperform both systems in regard to energy efficiency. With a significant difference versus the engineered adaptation and increased median result at every collection target excluding 10, the hormone system results can be seen arcing over those of the engineered system after starting at a similar point. Similarly, when compared to the static system, the hormone system shows significant increases to the food collected per energy used in all cases but targets of 10, 120 and 130 items. The similarity in energy efficiency of the hormone and speed systems at item targets of 120 and 130 can be explained by the speed increase of the hormone system in cases of very high item demand, actually reaching collection targets while the static system misses them by a large margin.
The efficiency of the hormone system over the static and engineered systems was explained by three factors:
Sensitivity: 
The hormone system is sensitive to collisions and capable of not only returning robots to the nest due to collisions, but also reducing speed due to the prolonged influence of collisions.
Dispersion: 
Rather than consistent speeds, or speeds of specific increments, the speeds of the hormone driven robots fluctuate during the search. Thus, dispersion is a by-product of efficiency as speed will be diverse amongst the swarm. This in turn will lead to less traffic and more energy efficient item collection.
Gradual variability: 
Speed can build over the duration of a search. This is contrary to the engineered system, which made relatively large (and potentially exaggerated) changes in speed on an individual’s return to the nest.

3.5.2. Environment 2—Funnelled Corridor Arena

The results for the second environment, the increased length of environment and introduction of corridors, predictably show a notable decrease in percentage of target collection completed. The static system started to fail collection targets at 50 items and the engineered adaptive system starting to fail at 70. Compared with these, the change to collection rate in the hormone system is substantially less reduced. The results show the hormone system falling to a 70% collection rate at the 130 item target mark, showing a considerable increase in collection performance versus the two comparison systems.
In terms of energy efficiency there is again an expected drop in performance, when compared to the first environment, across all experiments due to the larger, more cluttered arena.
Analysing the systems tested in this environment, there is very little statistical similarity. Table 3 shows that almost all of the data sets at each item target number, with the exception of the first 5 item targets of the engineered versus static system, are all significantly different. The data produced from this environment does however follow very similar patterns those of the first environment. The static system maintains a consistent energy efficiency, though dipping slightly in the case of the smallest collection target. The Engineered system, while improving collection, does little to benefit energy consumption and lessens as target numbers increase. The hormone system, while exceeding the two comparison systems in both collection and energy efficiency, as it did in the first environment, does so in a much more exaggerated manner in the second environment.

4. Introduction of the Sleep Hormone to a Foraging Swarm

The foundations of the introduced sleep hormone system are very similar to those presented in [5], following the same behaviour states as formerly designed. The system transitions through search, sleep, food collection and obstacle avoidance behaviours, directed by hunger, sleep and avoidance hormones. The hunger hormone was given an identical structure. However, due to the slight change in context to the foraging system, the stimulus to the sleep hormone in the system was edited from the original equation (first seen in [5]):
Sleep Hormone ( original ) : H σ ( t ) = λ σ H σ ( t 1 ) + γ σ H A ( t 1 )
In these equations a sub index of ‘ σ ’ indicates relation to the sleep hormone and ‘A’ the relation to the avoidance hormone. Numbers ensuring these symbols indicate an additional coefficient relating to the parameter type i.e., decay or stimuli.
The additions to the original equation include both an α value and an inhibitor in the form of γ σ 2 d (where d ( t ) is the function of demand presented earlier in this paper) resulting in the new equation:
New Sleep Hormone : H σ ( t ) = α σ + λ σ H σ ( t 1 ) + γ σ 1 H A ( t 1 ) γ σ 2 d ( t )
The introduction of an α value offsets the settling point of the hormone. This allowed for the implementation of the demand based inhibitor ( γ A l 2 d ( t ) ) and ensured that the hormone could fluctuate below the settling point without producing a negative value. The demand inhibitor itself created a larger decrease to the sleep hormone under high demand circumstances, assisting the decay already present in the hormone and reducing sleep times when the swarm’s rate of collection was inadequate.
Meanwhile H h (the sub index of h indicating a parameters relation to the hunger hormone) was kept in the same format, using the equation:
Hunger Hormone : H h ( t ) = α h + λ h H h ( t 1 ) + γ h S
where S is a Boolean value representing whether the robot successfully returned a food item to the nest site or not.
The parameters used for the hunger and sleep hormones were calculated in a similar manner as Section 3.2.4, using the approximate time scale across which the hormones were expected to operate and thereafter tuning stimuli for the fitting reaction. The parameter values selected for the coming experiments are displayed in Table 4.

4.1. Preliminary Tests for Sleep Hormone in A Demand Lead Foraging Task

The initial tests conducted on the new sleep hormone system used the same environments as the previous section and operated until a time limit of 500 seconds or until the target number of items was reached. A cumulative mean test indicated that a minimum of 14 trials were required. To ensure certainty, 20 trials were run.

4.1.1. Environment 1—Square Open Arena

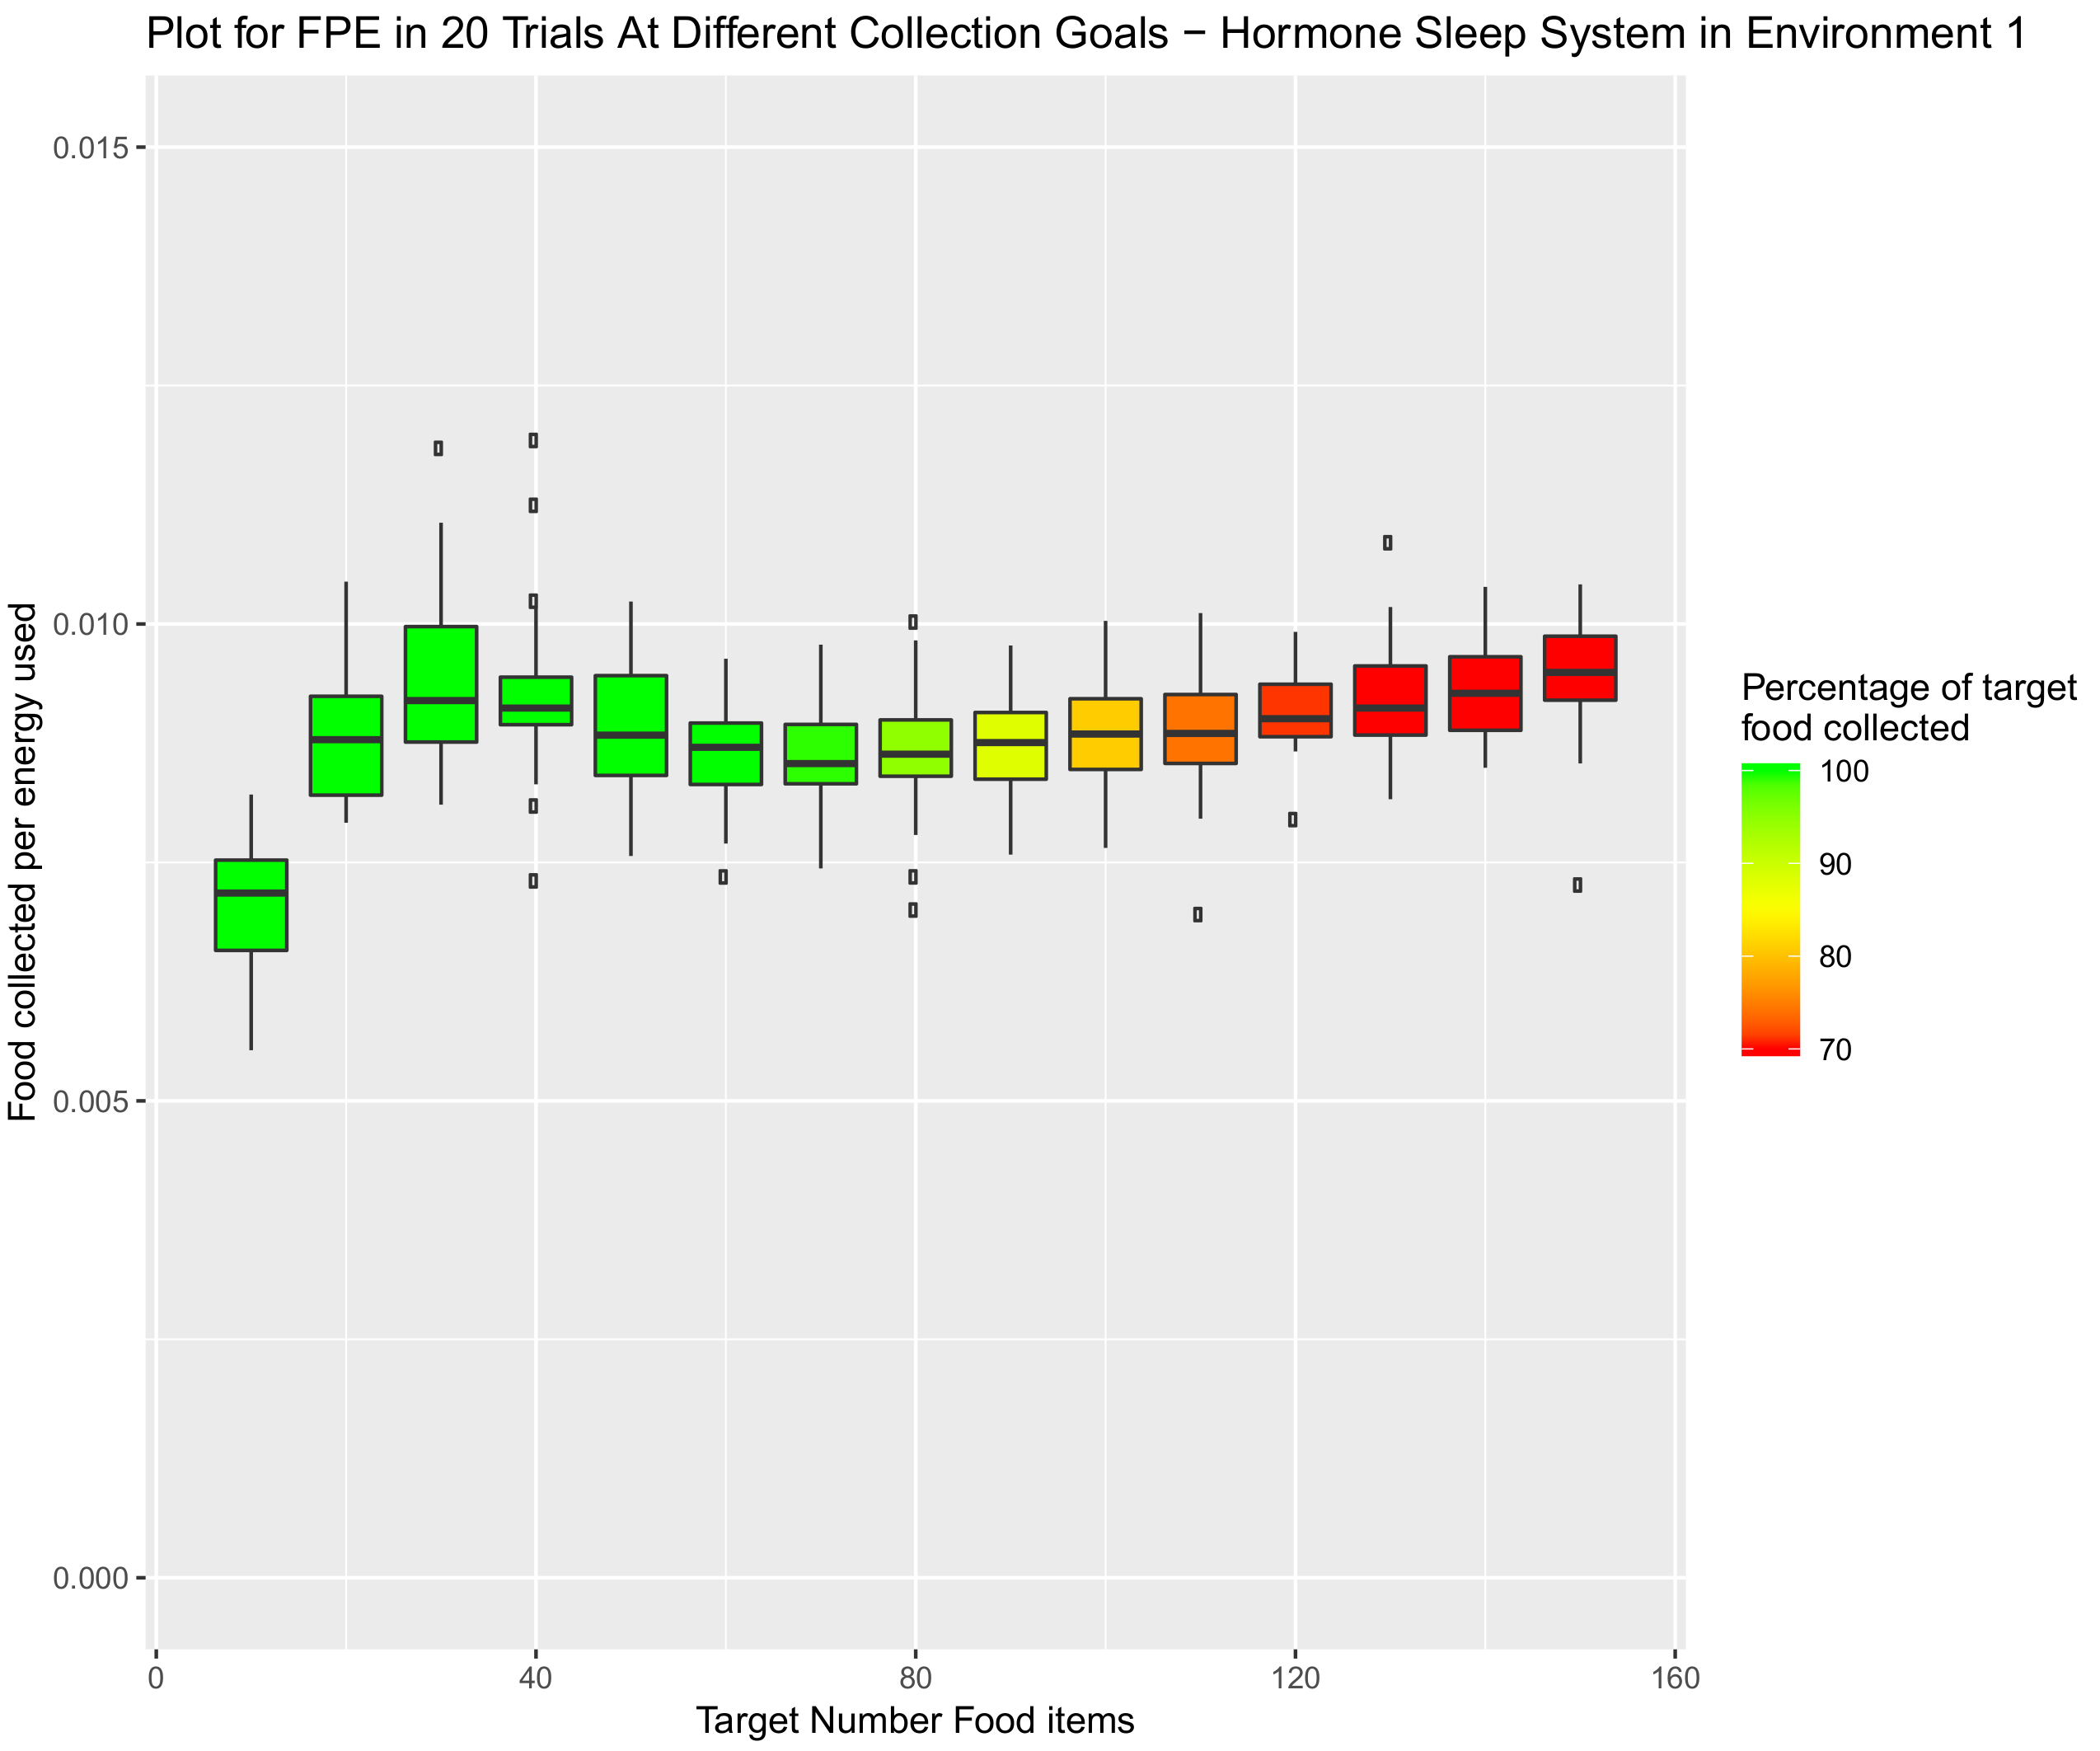
Observing the results for the first environment (illustrated in Figure 8) the results appear very different to those of the previous three systems. The energy efficiency starts low, peaking momentarily and, after a dip to median performance, increases as the number of target items does. This pattern leads to an increased energy efficiency at all item targets compared to the previously tested static speed system and considerably better efficiency performance at item targets greater than 120 for the other two adaptive systems.
The initial spike in performance from this pattern is explained by the removal of poorly positioned robots at deployment. Those robots starting off in large groups will enter the sleep state either immediately or very soon after exploration. This initial state selection is then diluted as robots make more passes between the nest and the food area, seen as the Food Collected Per Energy used (FPE) reduces to a similar level as the non-adaptive system seen in Section 3.5. The gradual increase to FPE thereafter is due to the sleeping of poorly performing robots across greater periods of time, while robots with better positioning within the arena are able to collect food items more effectively.
While this system sees several increases to performance in terms of energy efficiency, it sacrifices this for poor performance in terms of item collection, with collection starting to drop at item targets of 90, lower than even the static system in the previous section. This is expected as the system actively impedes collection speed, with the sleep state removing swarm members for brief periods of time.
Though the collection percentage is lower in the sleep system than in the systems previously examined, this does show that it may be beneficial from the perspective of energy efficiency to combine the speed and sleep systems. With the intention of reducing the decrease to FPE seen in the adaptive speed systems as item target increases and using the speed system to compensate for the poor collection performance seen at targets above 90.

4.1.2. Environment 2—Funnelled Corridor Arena

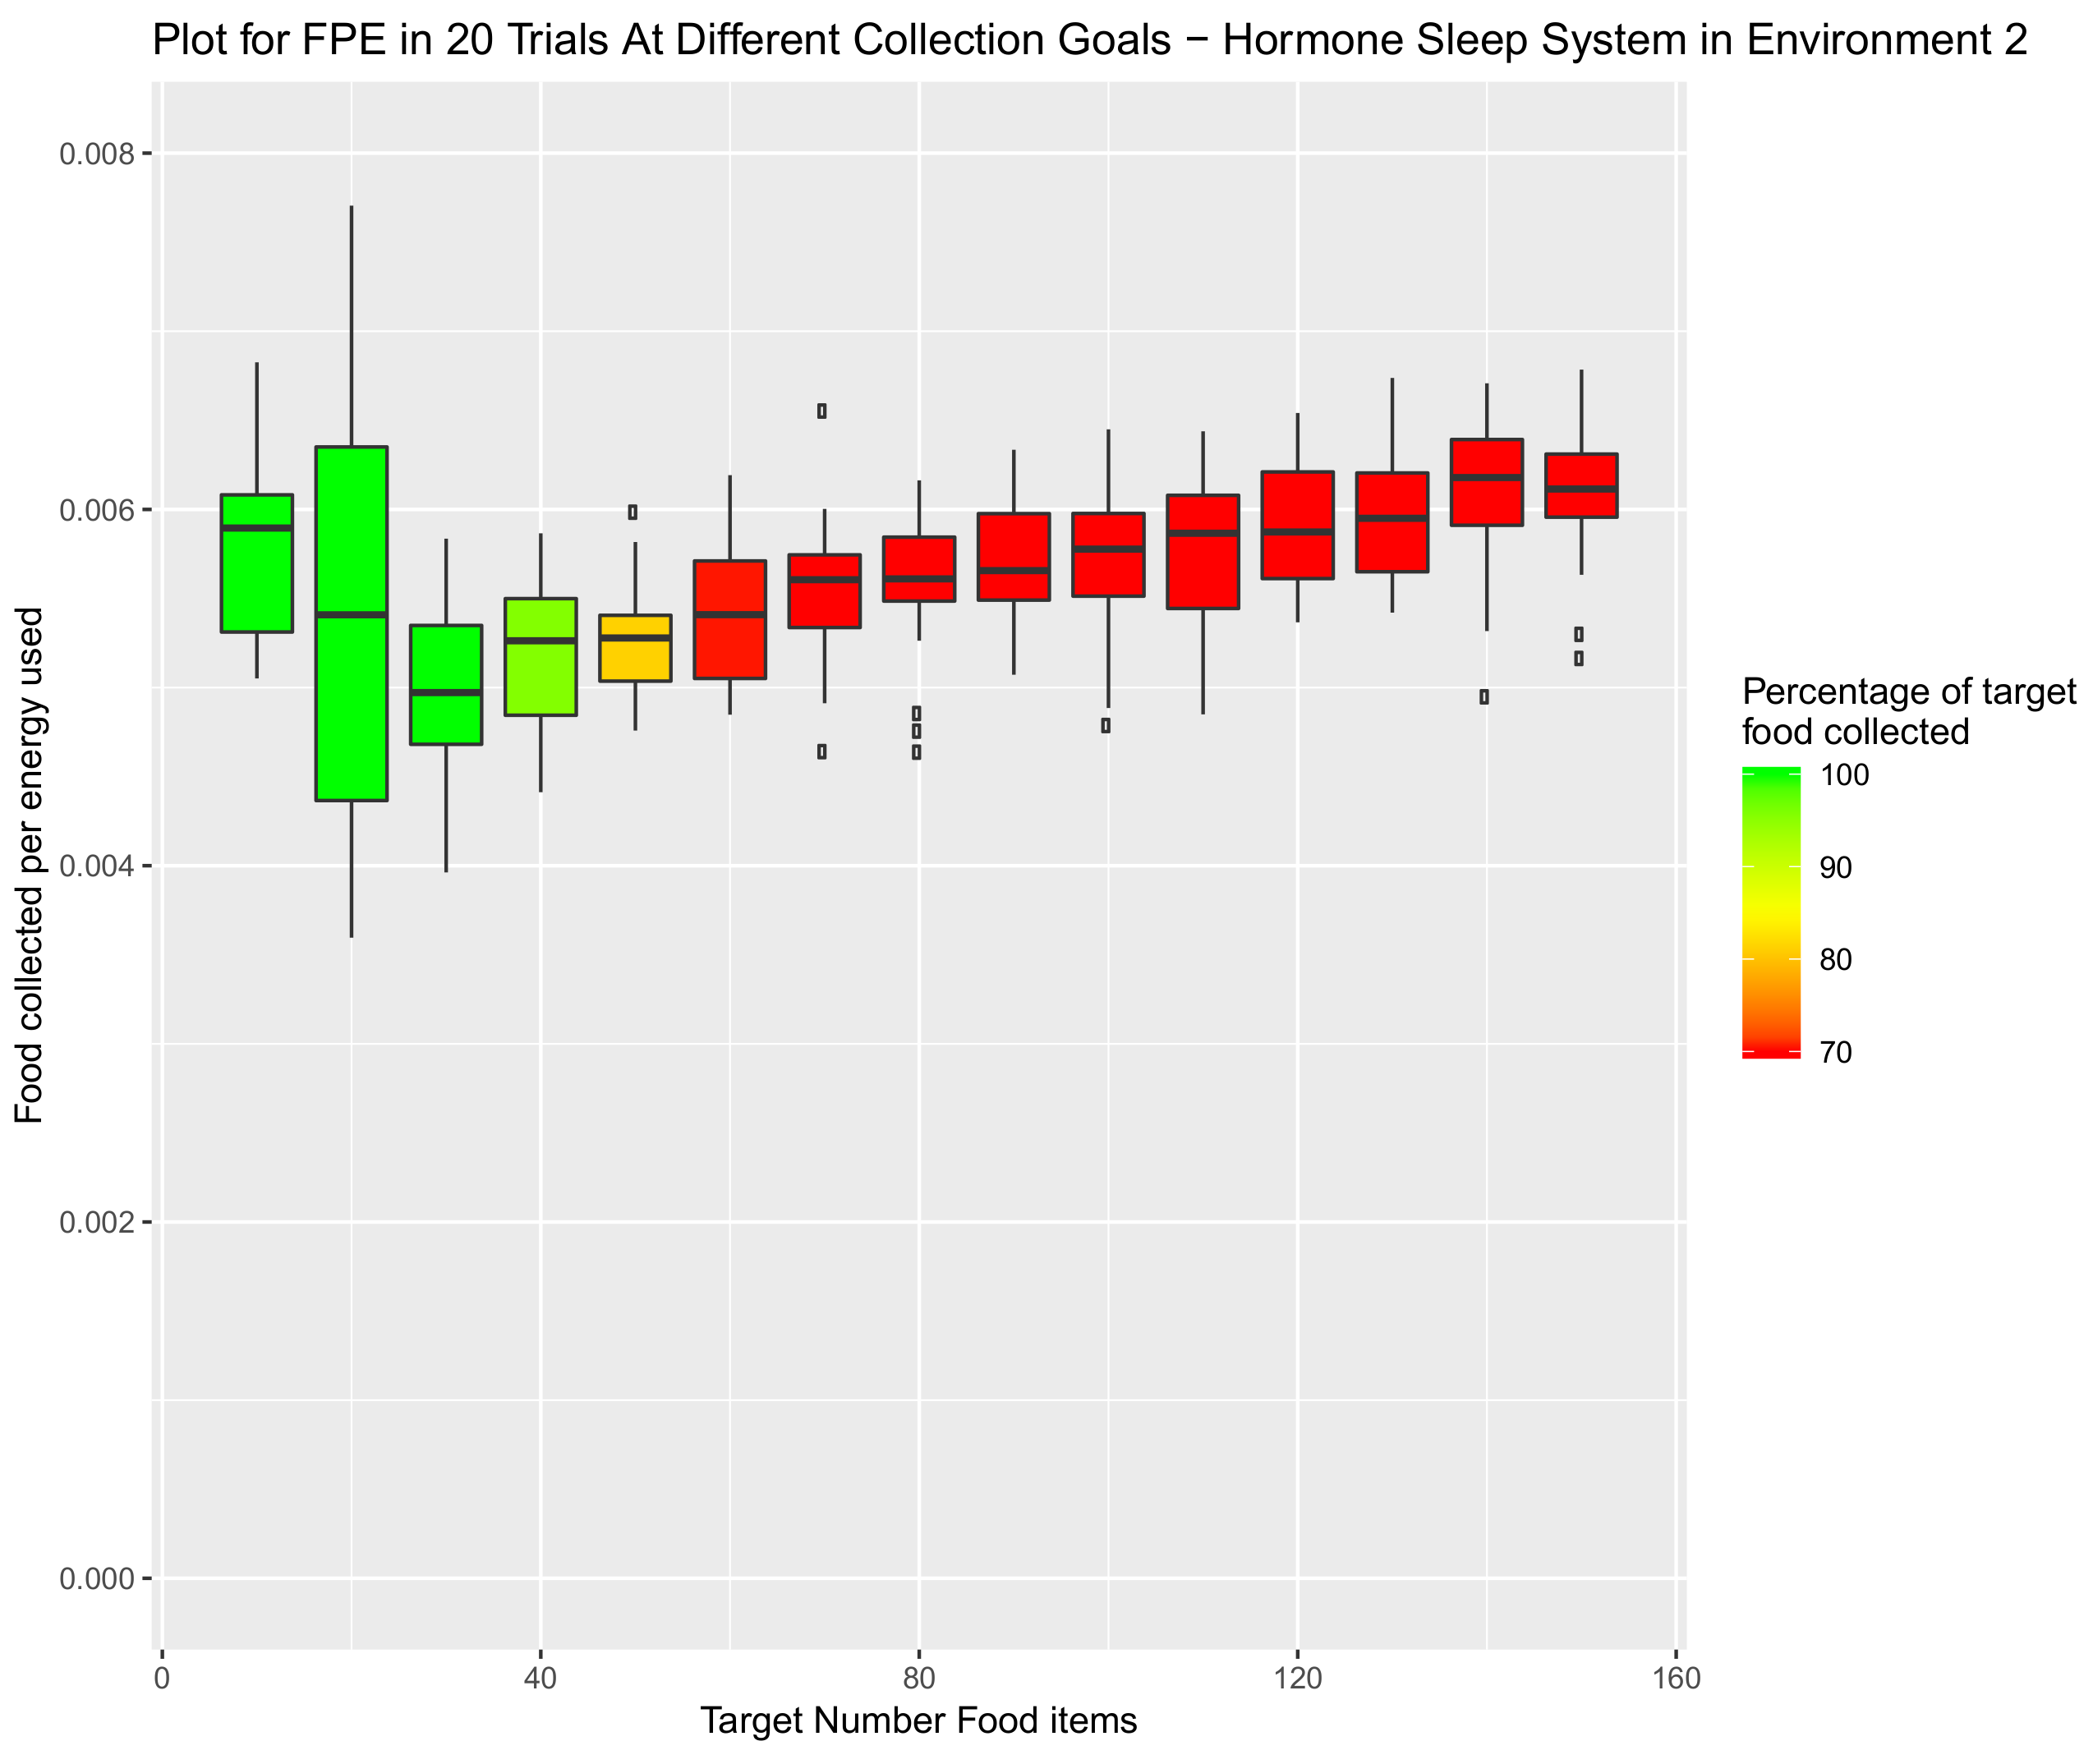
The benefit of this enhanced hormone system is further proven in the second environment. Following a similar pattern to the first environment, the energy efficiency increases with the target number (illustrated in Figure 9). In this environment, the sleep system is able to outperform the static and engineered system in terms of energy efficiency across all item target values. In addition to this, while not able to compete at lower item targets, after 80 items the sleep system largely outperforms the hormone speed system.
This increase to energy efficiency is due to the sleep system regulating the number of robots present in the corridors at any given moment, retaining poorly performing robots until demand is high and as a result increasing the productivity of the foraging swarm.
Again these results, while producing good values for energy efficiency, sacrifice collection rate. With collection similar to the static system, failing past 50 items.

4.2. Combining the Sleep Hormone with the Speed Deviating System

In an attempt to combine the benefits of both hormone systems and to identify the viability of combining existing hormone systems, the speed hormone was added to the already established sleep system. The parameter values established in prior testing were again used for the combined system. The speed hormone acted explicitly on motor speeds during exploration and the sleep hormone system regulated higher level behaviours.
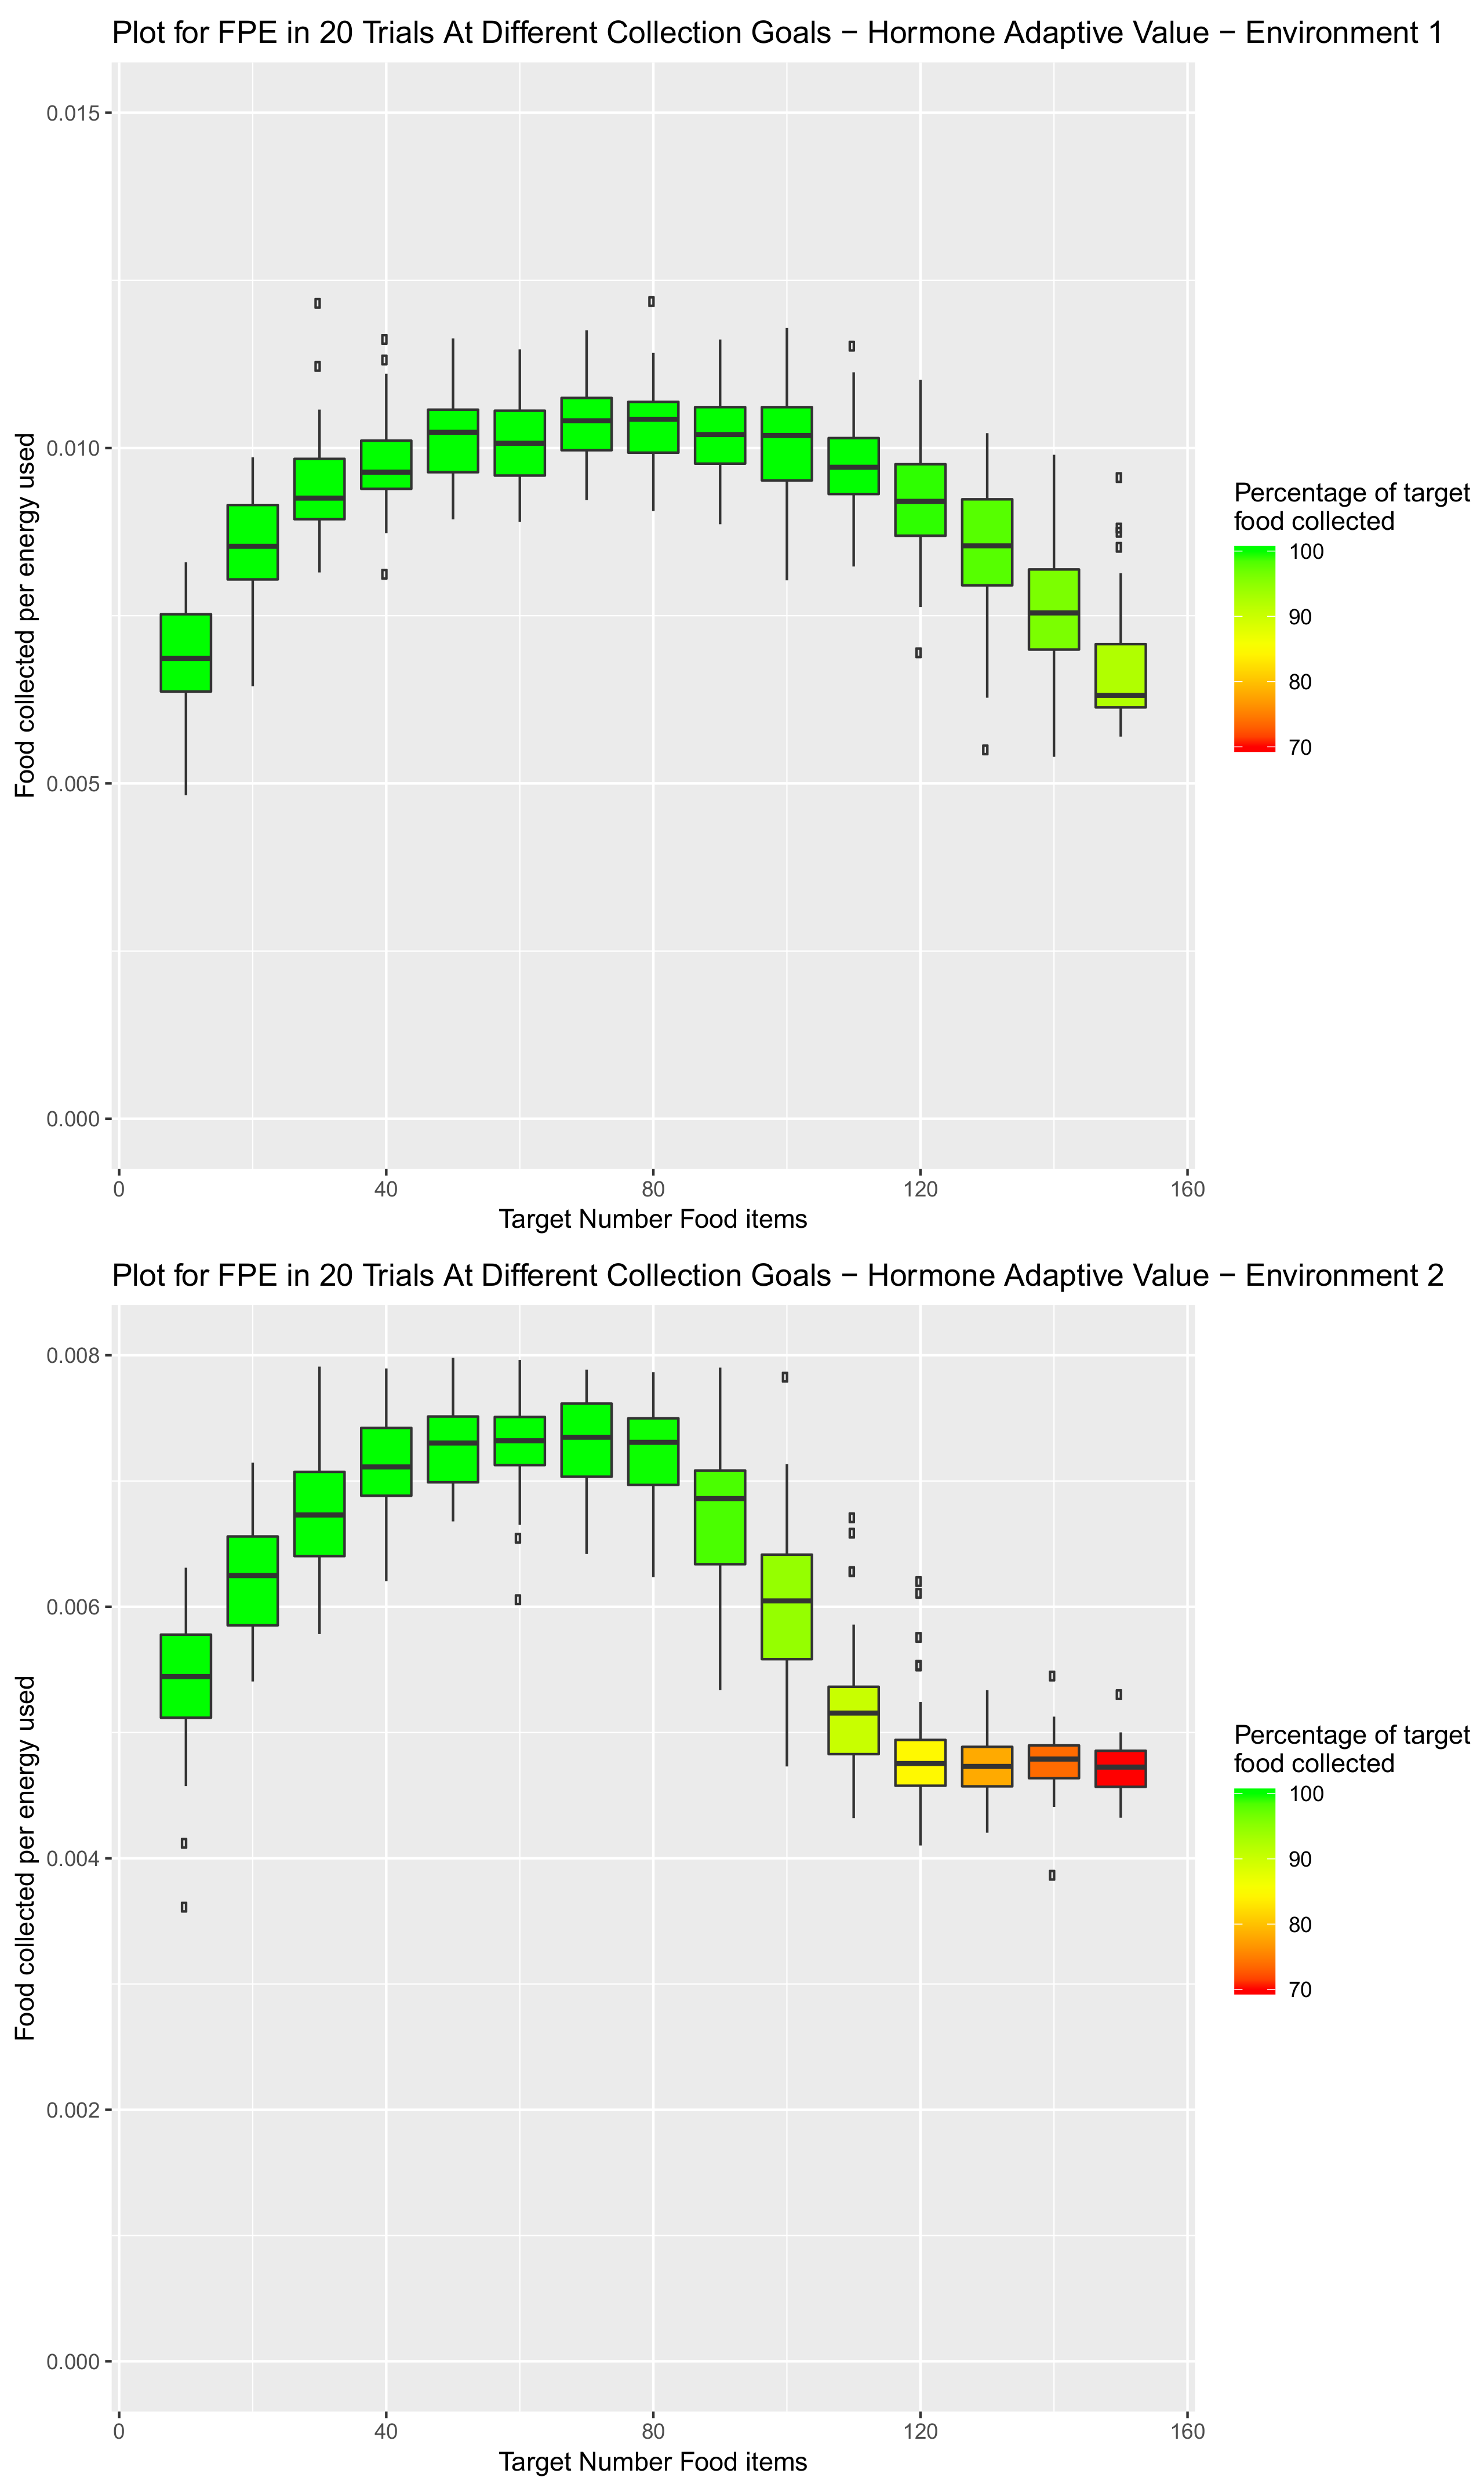
The performance of this new combined system is illustrated in Figure 10. The first obvious improvement to the system can be seen in the results from the first environment, this set of data achieves the highest average collection rate of any system at a required collection of 150, obtaining an average of 92.3% of the needed items.
In addition to this the combined system achieves a significantly greater energy efficiency versus the sleep system at all item targets between 50 and 110 in the first environment and all item targets before 100 in environment 2 (p values for these tests can be found in Table 5). At higher value item targets the energy efficiency still crosses over, though the exceptional item collection rate more than compensates for this.
Relative to the adaptive speed system the combined hormone system obtains very similar results in the first environment at target item values below 70. Though there are large improvements to the energy efficiency at item targets larger than this. This increase to performance is mirrored in environment 2, though with a consistent increase at all item target values.
The substantial improvement in performance is proposed to be the mutually beneficial actions of the separate systems. It allows the system to avoid the circumstance in which positioned poorly robots in a high demand context might travel at high speeds that a cause large drain to power for poor returns.
It is clear from these results that these systems work better in combination than separately. This shows a strong symbiosis of already established hormone control, verifying the viability of combining hormone systems.

5. Introduction of Environment Selection Hormones with Sleep and Speed Regulating Hormone Systems

With the viability of a larger hormone system confirmed, the next step taken was to combine the hormone combination system presented in the last section with yet more hormone arbitration. This was an important step because, while it has been shown that hormone systems can interact to produce satisfactory results, the current combination of hormone systems experience minimal detrimental interactions. In terms of behavioural arbitration, the speed and sleep hormone systems do not interfere with one another.
This section presents the amalgamation of the speed hormone, sleep hormone and a hormone system capable of monitoring the emergent success of the swarm under different conditions, implementing the designs shown in [7]. The monitoring of success and ensuing environmental preference, was driven by the speed at which items could be collected from the environments. Therefore, it is essential to investigate if the preference system will still be capable of categorising robots within a heterogeneous swarm effectively with an adaptive speed mechanism in place.
As such, the environment for these tests required a diverse terrain and multiple directional options alongside heterogeneity amongst the swarm.

5.1. Environmental Setup

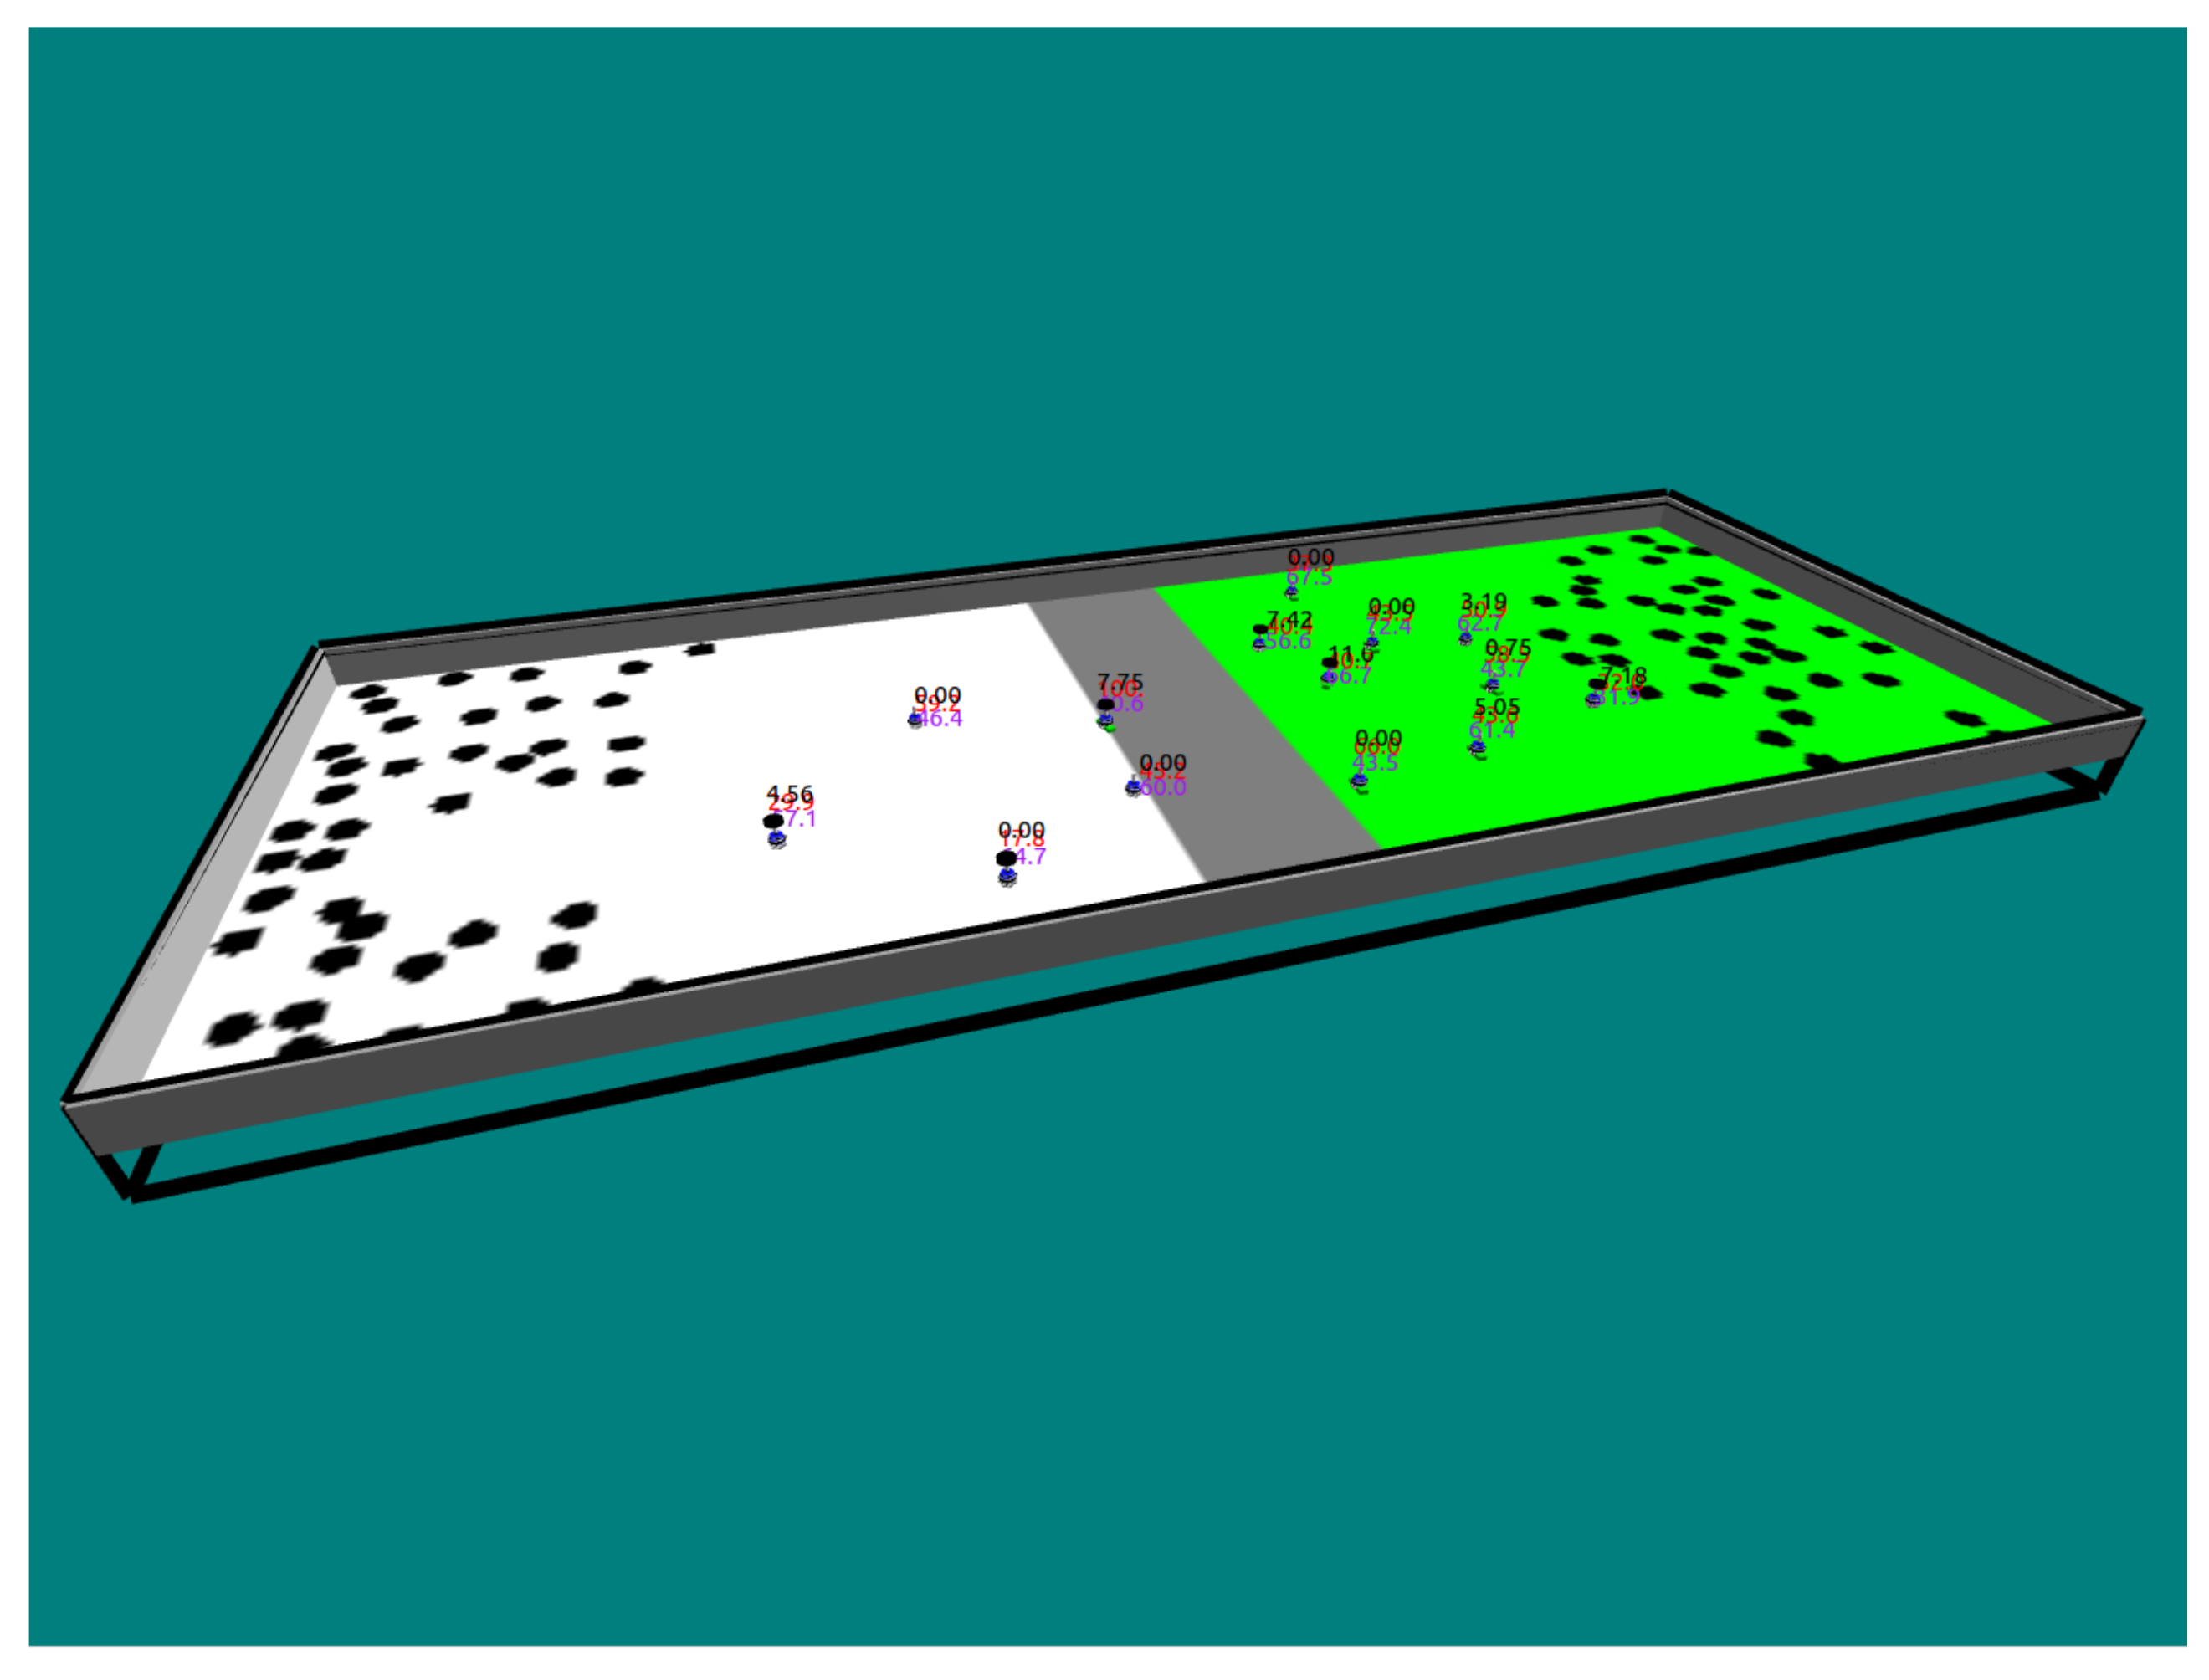
The new environment used for testing in this scenario was identical to that used in [7] and can be seen in Figure 11. It features two different terrains designed to challenge robots with two specific wheel types, using 7 robots of each type for a total of 14 as previously studied.
In order to incorporate heterogeneity into the swarm, while still using the energy characteristics presented in Section 3.1 to measure energy efficiency at different speeds, each wheel type was given a speed coefficient for respective terrains. These coefficients (displayed in Table 6) inhibited the speed properties of the wheels based on the ground a given robot was travelling on, these values are shown in Table 6. While not as realistic as the data used for wheel speeds in previous environment preference experiments, this allowed for the testing the combination of systems without extensive testing of robotic hardware.

5.2. Effect of Demand on Environment Selection When the Speed Hormone Is Combined with Environmental Preference Hormone

Before fully combining the systems, the speed hormone was added to the Environmental Preference System. The performance of the selection system was then measured by looking at the proportion of robots active in the environments they were best suited to as a percentage.
In order to incorporate the speed hormone to the directional preference hormone system, demand functions identical to that previously produced in Section 3.2.1 were created for both the north and south environments, taking only items collected in the respective environment into account when producing demand. Depending on the environmental preference when returning to the nest site, robots within the swarm would then update their demand stimuli with the corresponding demand value.
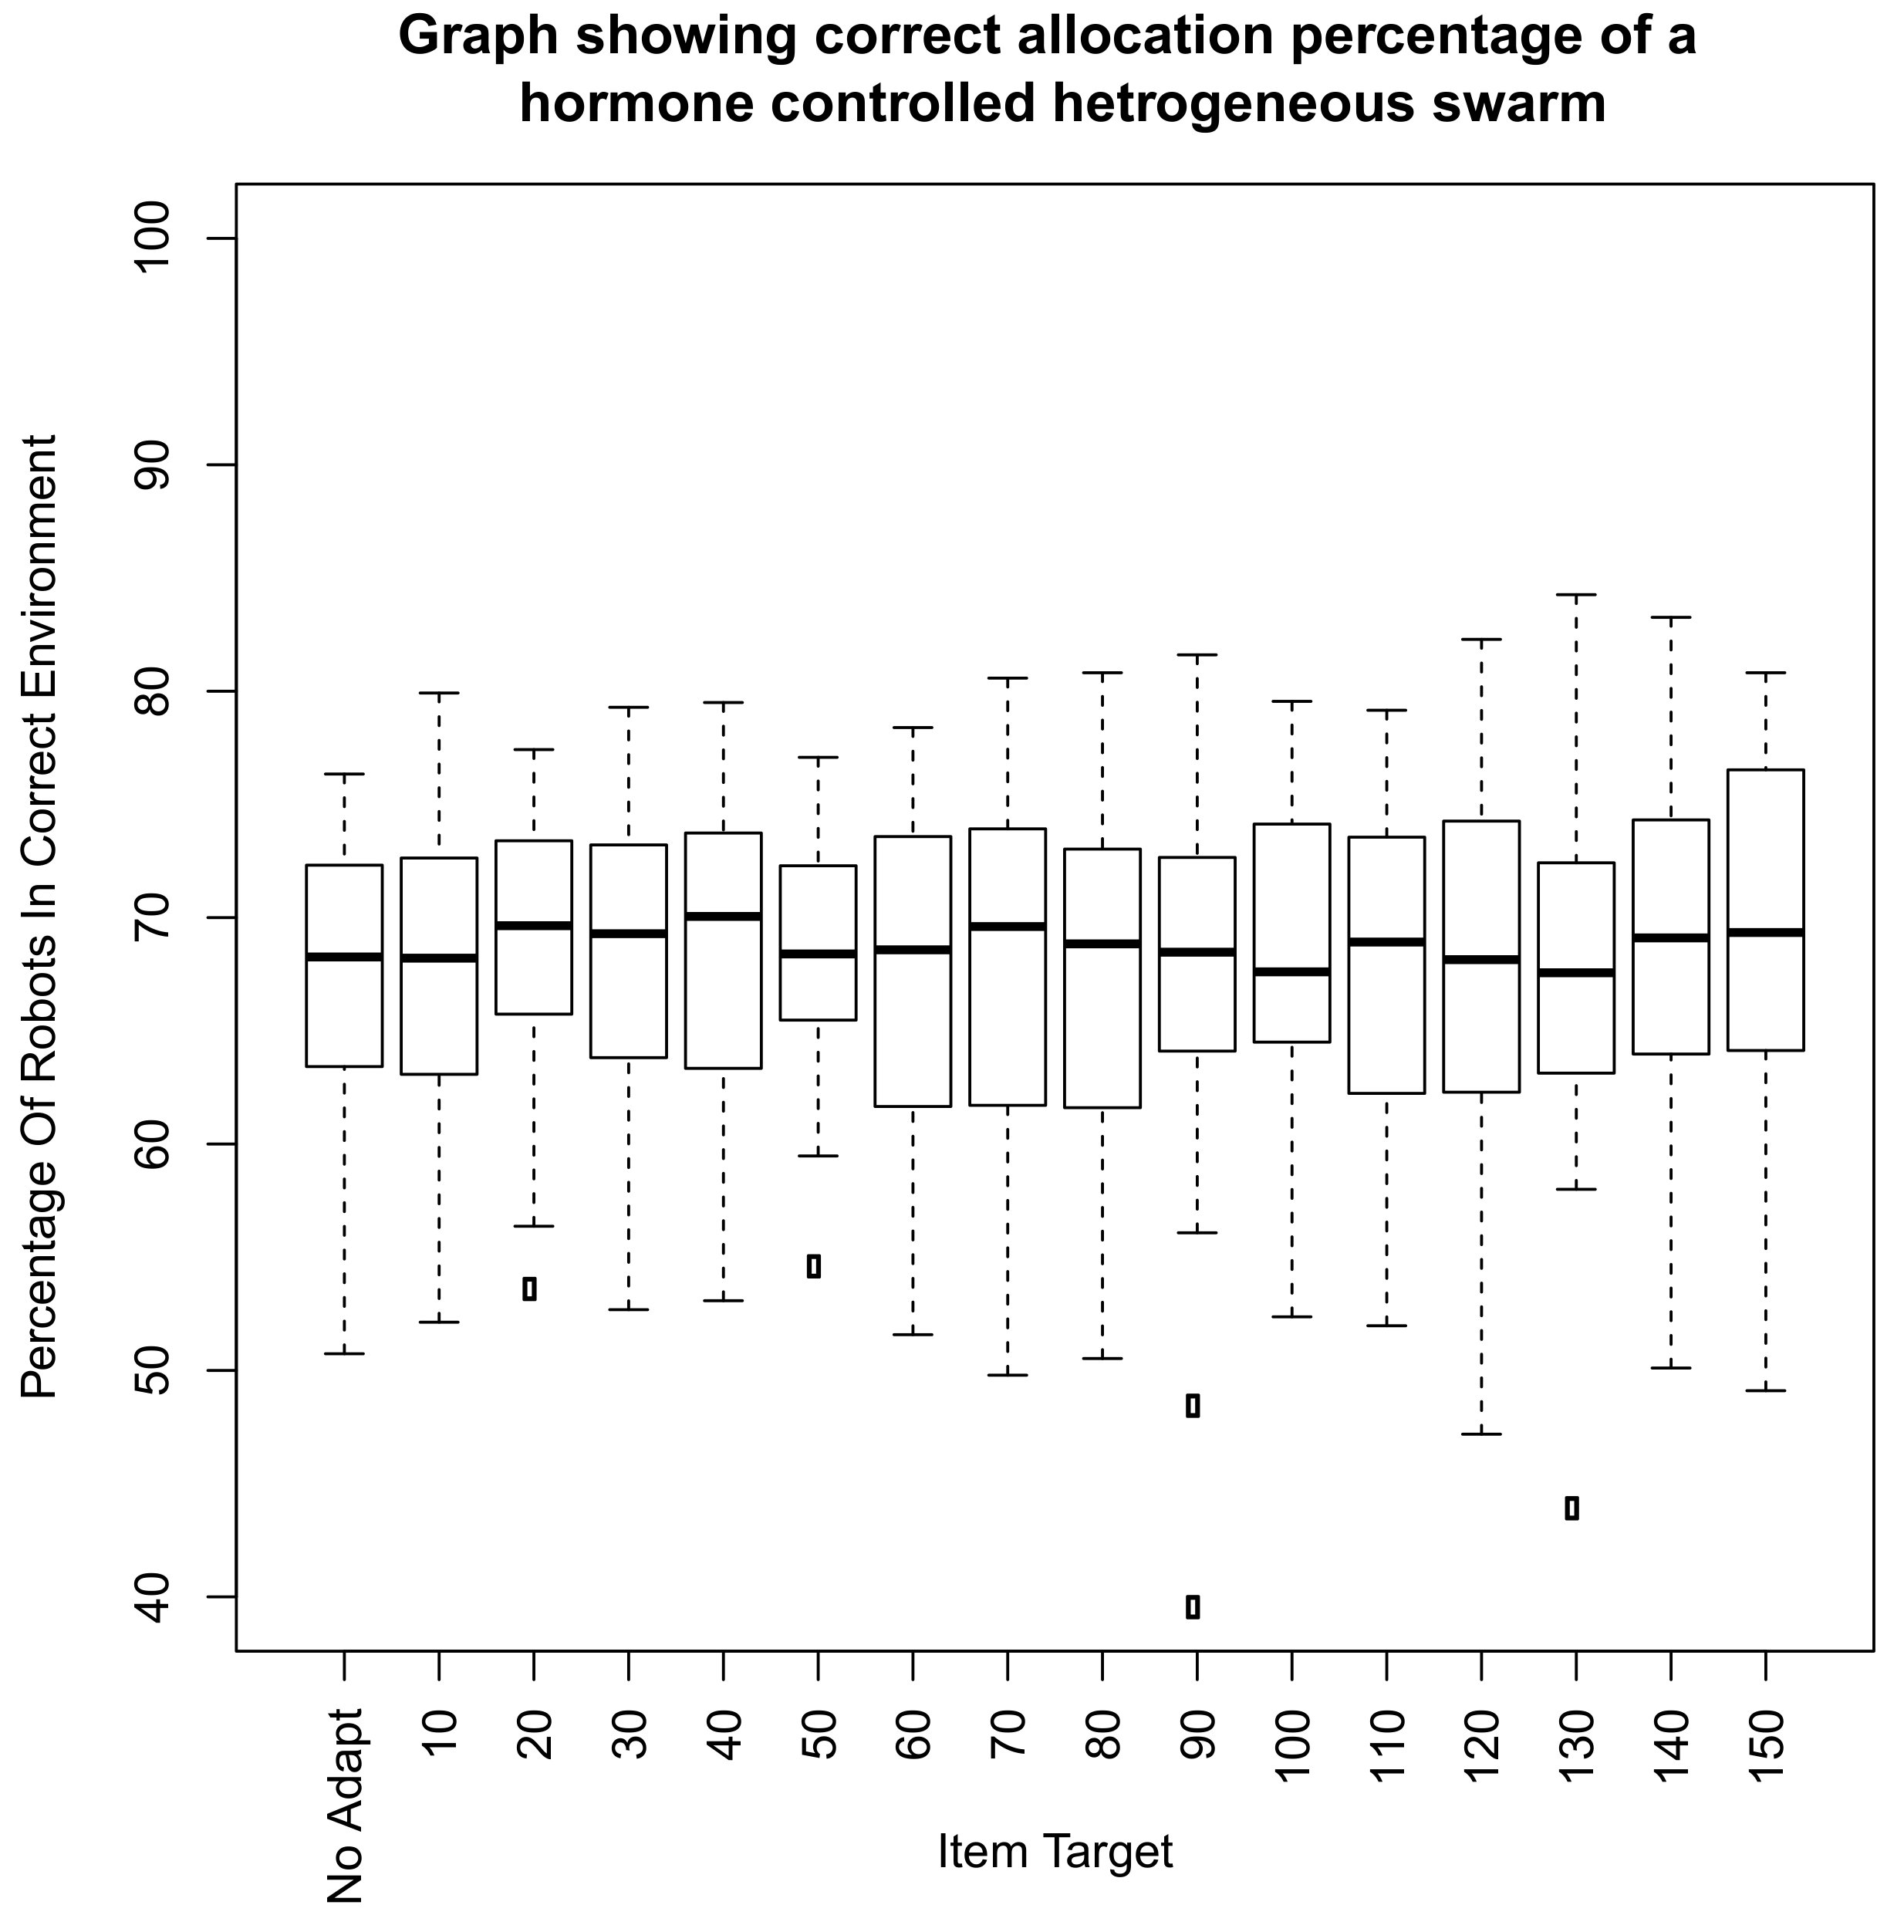
The full results of these tests are illustrated in Figure 12. Minimal differences were found in median categorisation across the range of item targets. Further, these were not found to differ from median categorisation found when the speed hormone was not included in the system. As the speed hormone did not appear to have a negative effect on the environmental preference hormones, it was deemed reasonable to further add the sleep hormone to the system.
With minimal negative interaction between the speed regulating and environmental preference hormones, it was deemed reasonable to continue with the implementation of the combined hormone system with the introduction of the hormone driven sleep system.

5.3. System Combining Sleep, Speed and Preference Hormones

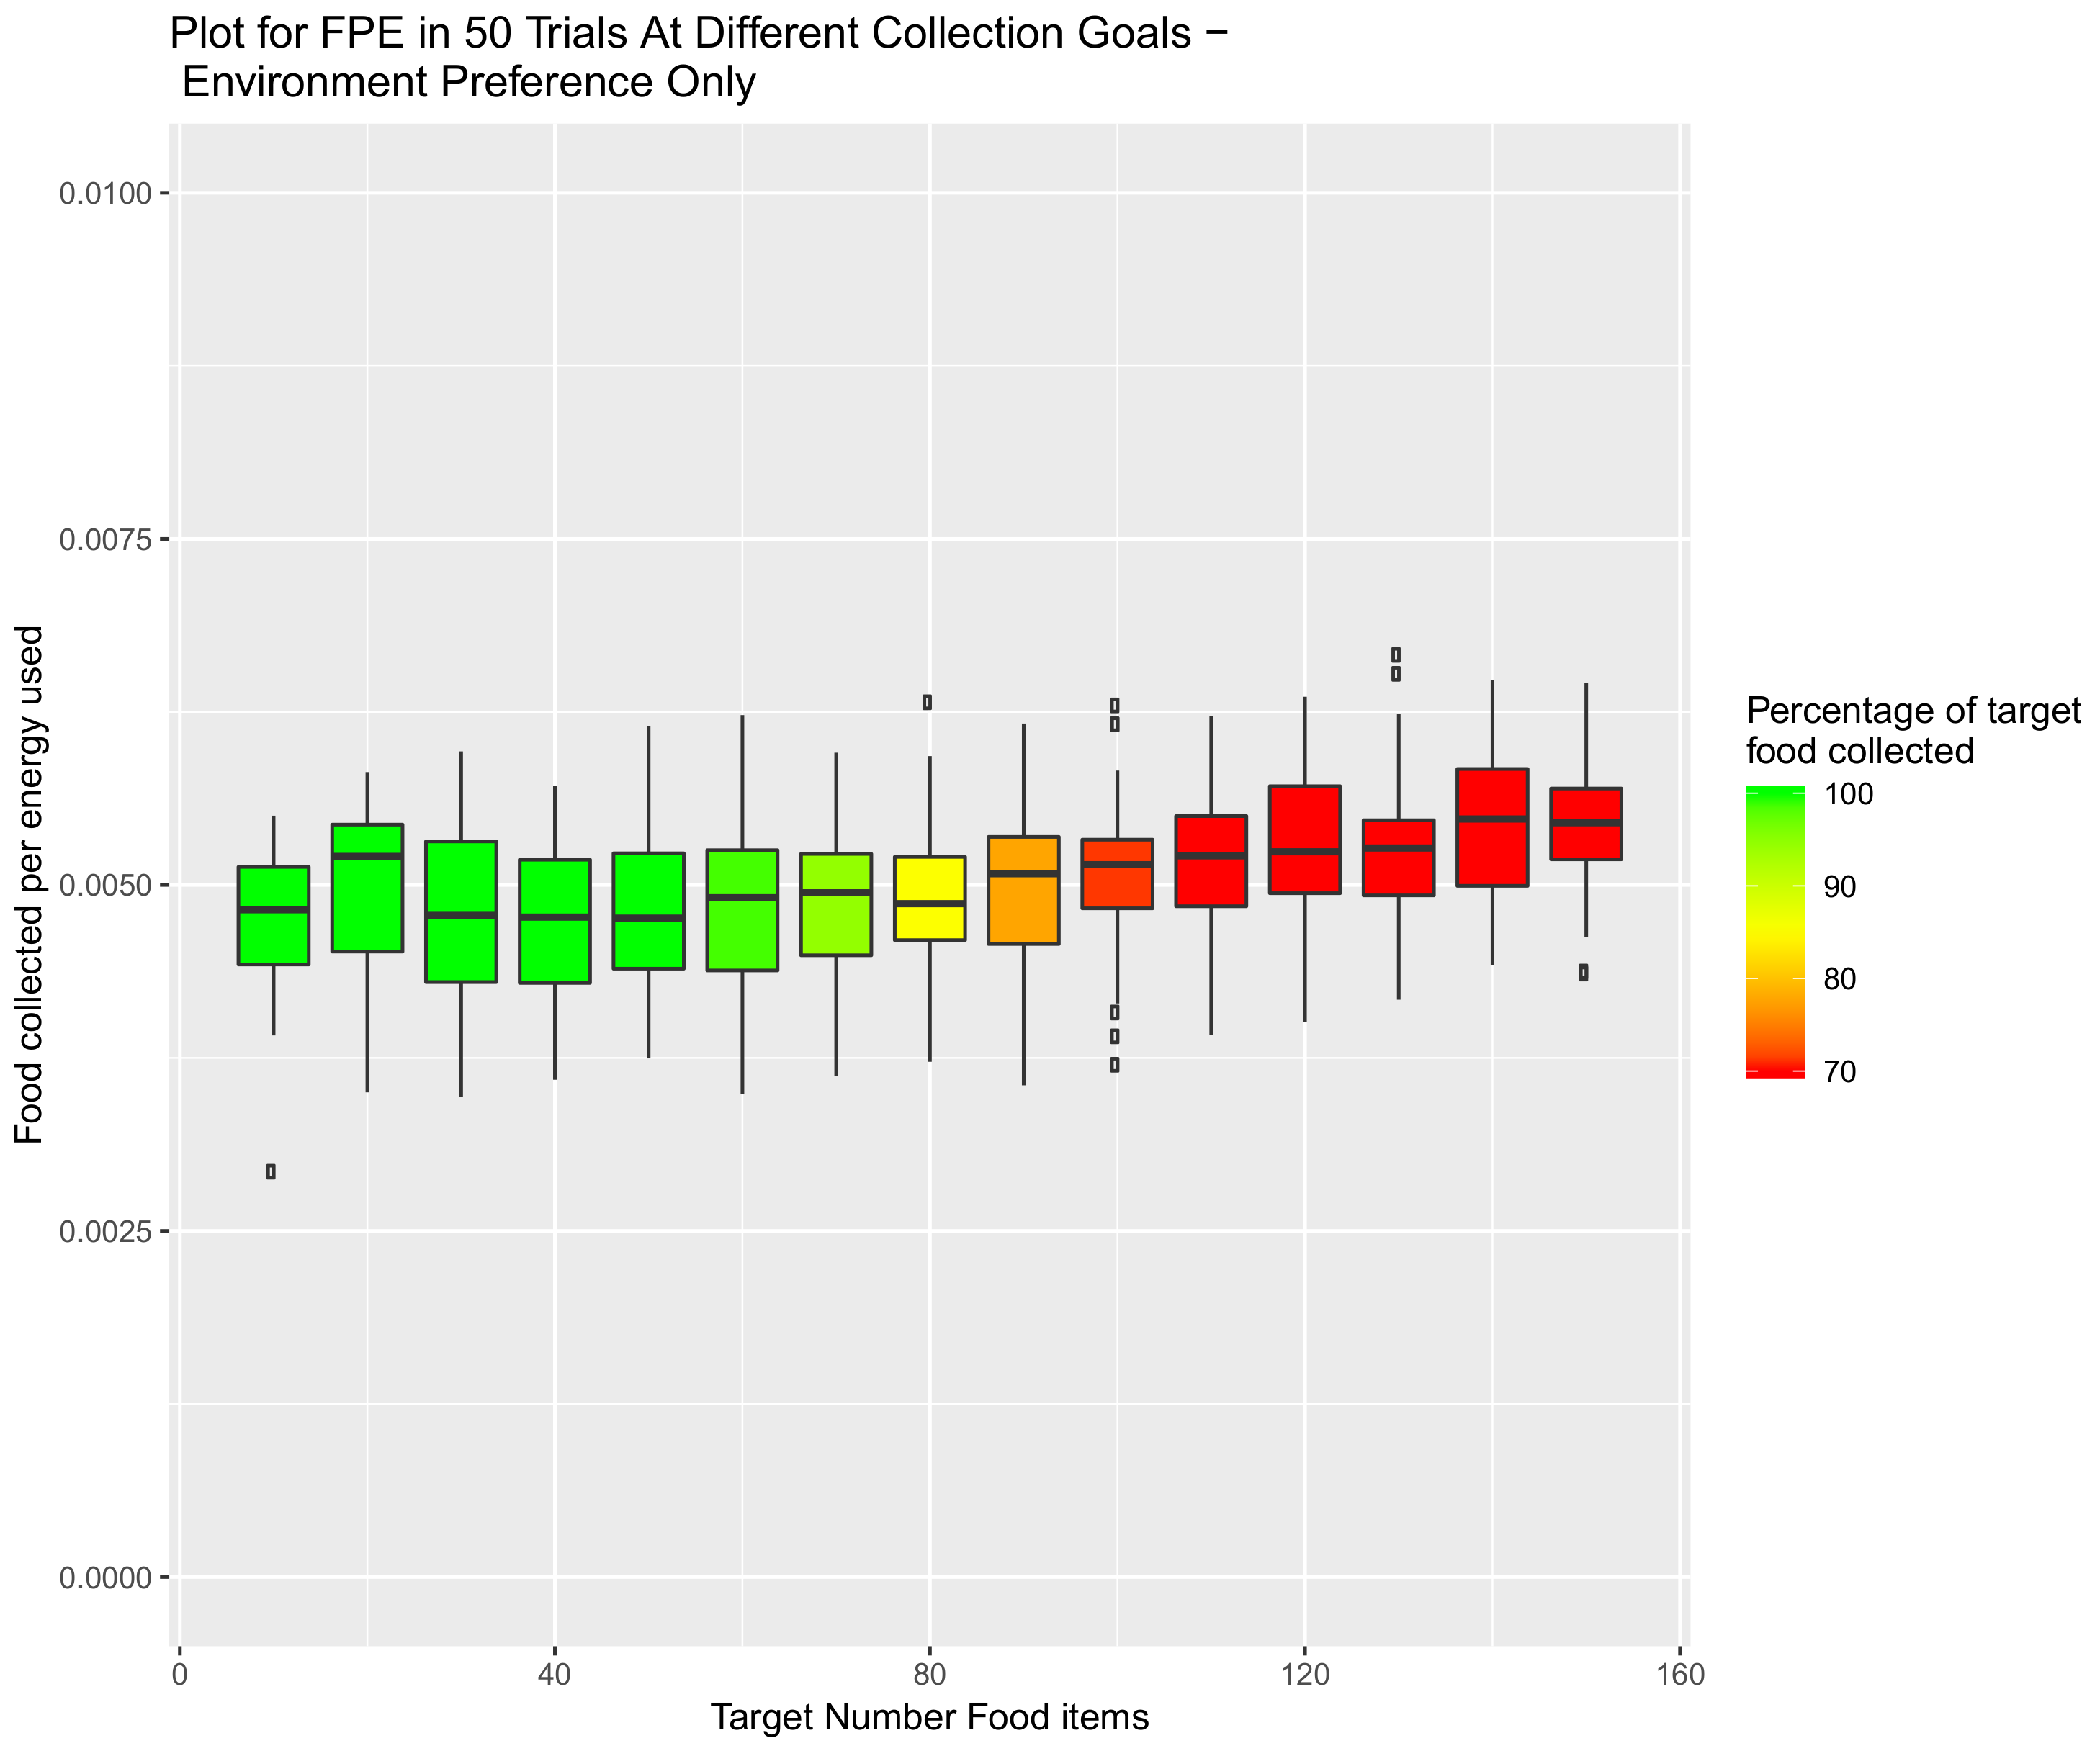
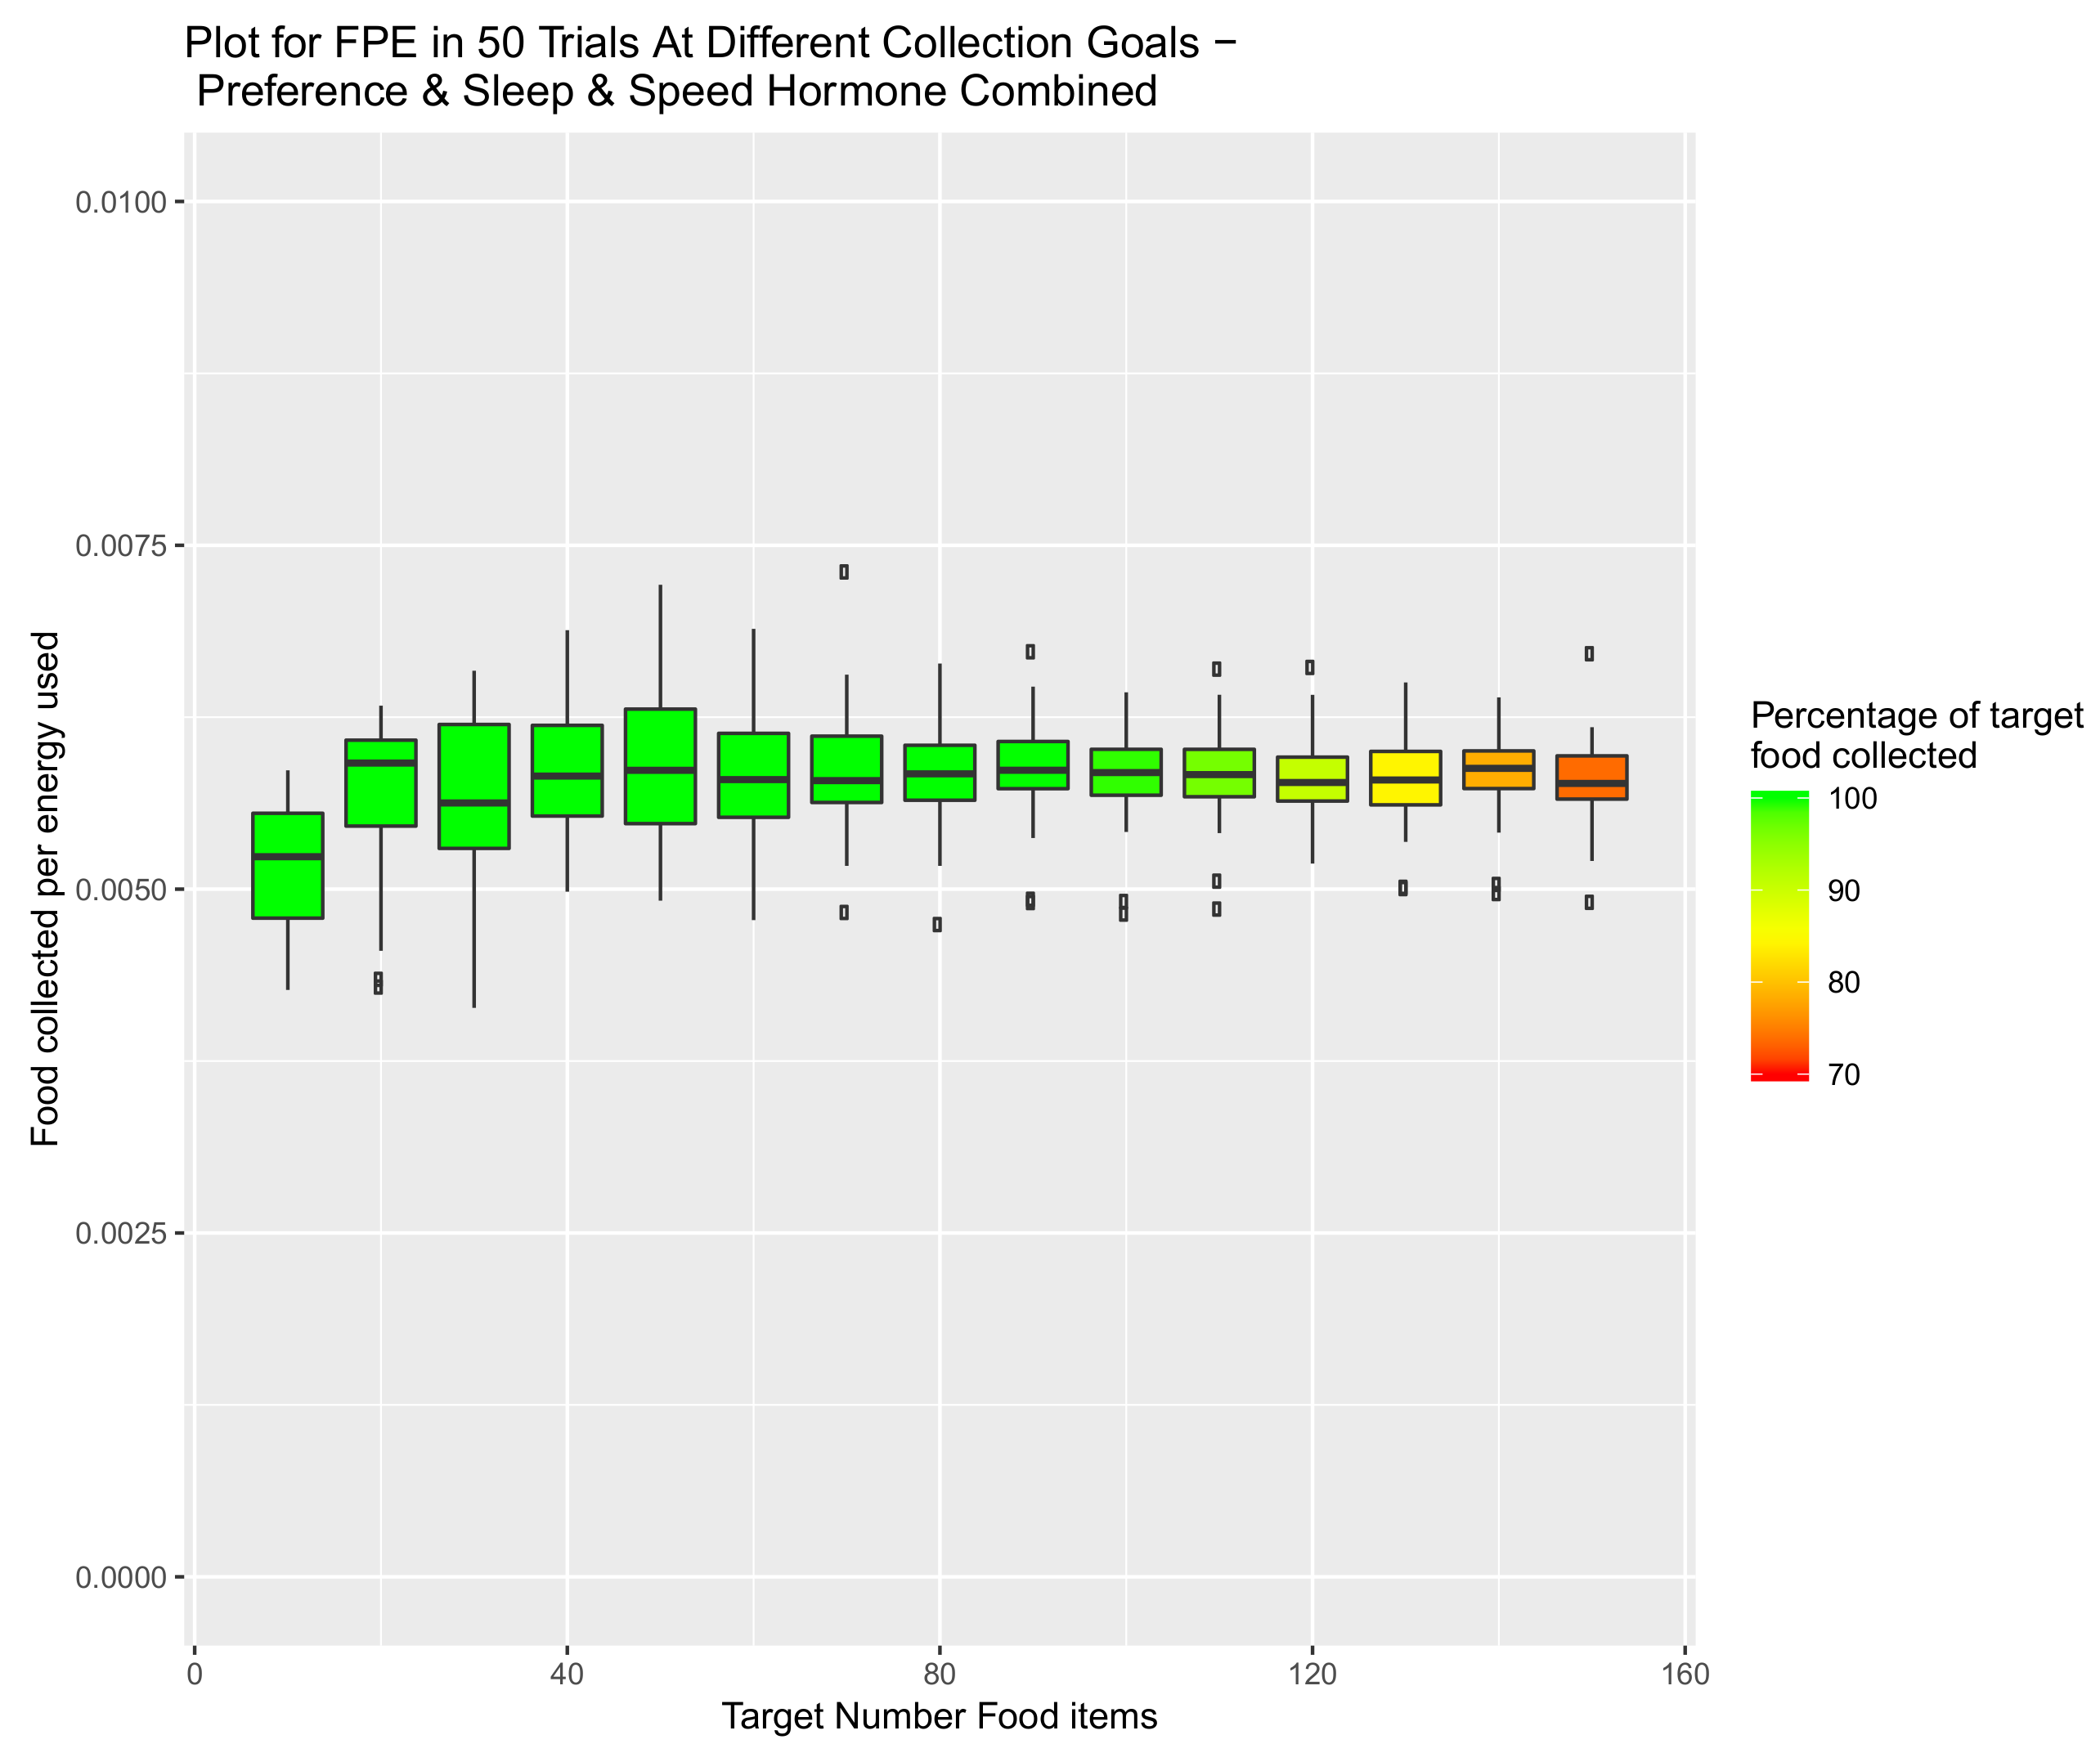
To observe the performance of this new system, the various combinations of hormone systems were tested in combination in the new multi-terrain environment. First the preference system was tested on its own, the results from this are illustrated in Figure 13. These results would act as a baseline to the additional systems as results from this new environment, with new task complexities, would be incomparable with data from previous experiments.
When adding the sleep hormone to the system (results illustrated in Figure 14), results for energy efficiency are consistently raised past the first item targets of 5, as shown by median results increasing by approximately 25% for item targets past 70. While there is a large improvement in terms of energy efficiency, adding the sleep hormone only results in a slight increase to collection rate, with the cut off point for collection becoming poor (below 90% of the target item collection) shifted from 80 to 90.
When the speed hormone is added to the system in the absence of the sleep hormone energy efficiency suffers considerably. This is seen with the consistent drop in efficiency results illustrated in Figure 15 when compared to the baseline results. However, this drop in efficiency is traded for a substantial improvement to collection rate, moving the cut off point for poor collection to 120 target items. These results are expected with the additional speed fluctuation and if the results from previous hormone combinations hold consistent, the addition of the sleep system to the preference/speed hormone regulation should amend the poor energy efficiency while maintaining the item collection rate.
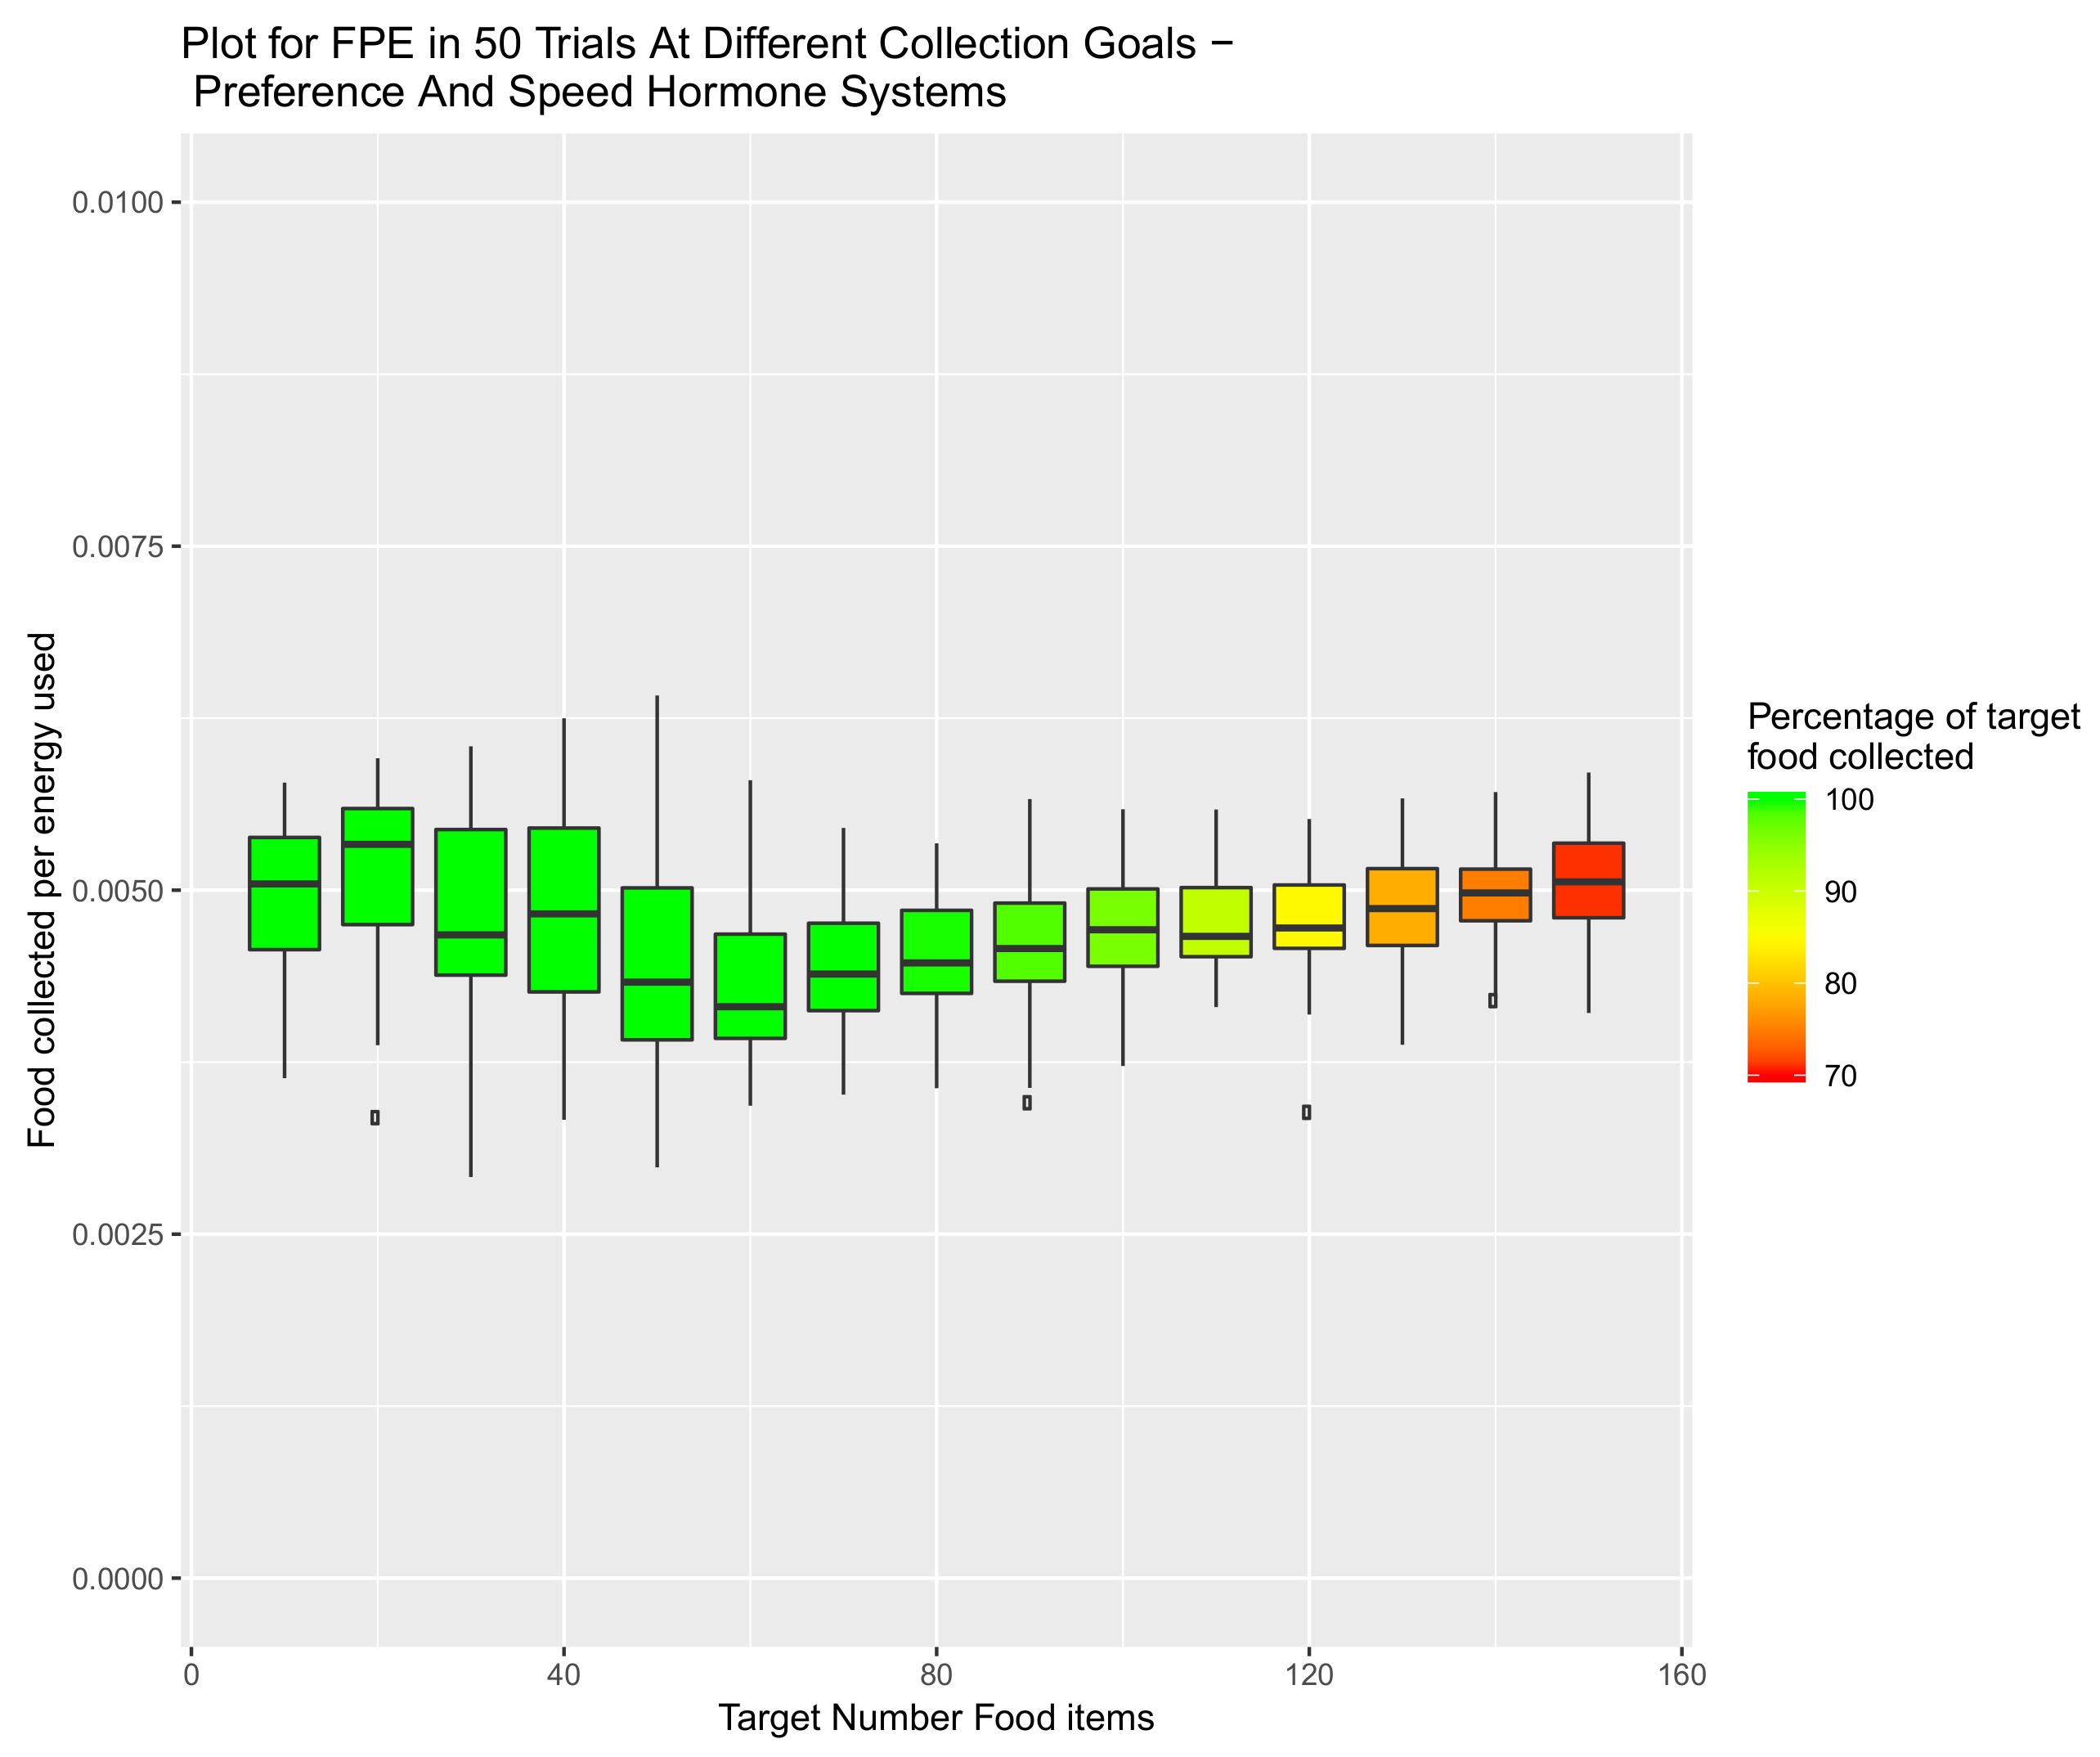
Combining all three systems (results illustrated in Figure 16) provides the best result in terms of item collection, maintaining adequate collection until the 130 target item trial. Simultaneously, the system that combines all three hormone types is capable of accomplishing competitive values for energy efficiency. These values show improvements across all item targets for the standard preference and combined speed hormone results. The three hormone system only marginally under performs in energy efficiency versus the combined preference and sleep system, although it shows much greater item collection percentages. These results suggest that the fully combined system as the strongest of the system permutations when considering both item collection and energy efficiency.

6. Scalability of Final Amalgamated Hormone System

To introduce a key element of difficulty to the system presented in this paper a scalability test was conducted. With more robots in the swarm, the more difficult it will be to move effectively within the environment without slowing due to clutter. Along side this, with greater swarm density robots may receive over-stimulation from the transmitted hormones of the increased number of robots or there may be too much competition for food items, with multiple robots travelling to the same item simultaneously. With these additional negative features present it will be difficult for robots to form accurate preferences to terrain due to the fact that these negative features may have a greater effect on performance than the speed variance provided by the different wheel types.
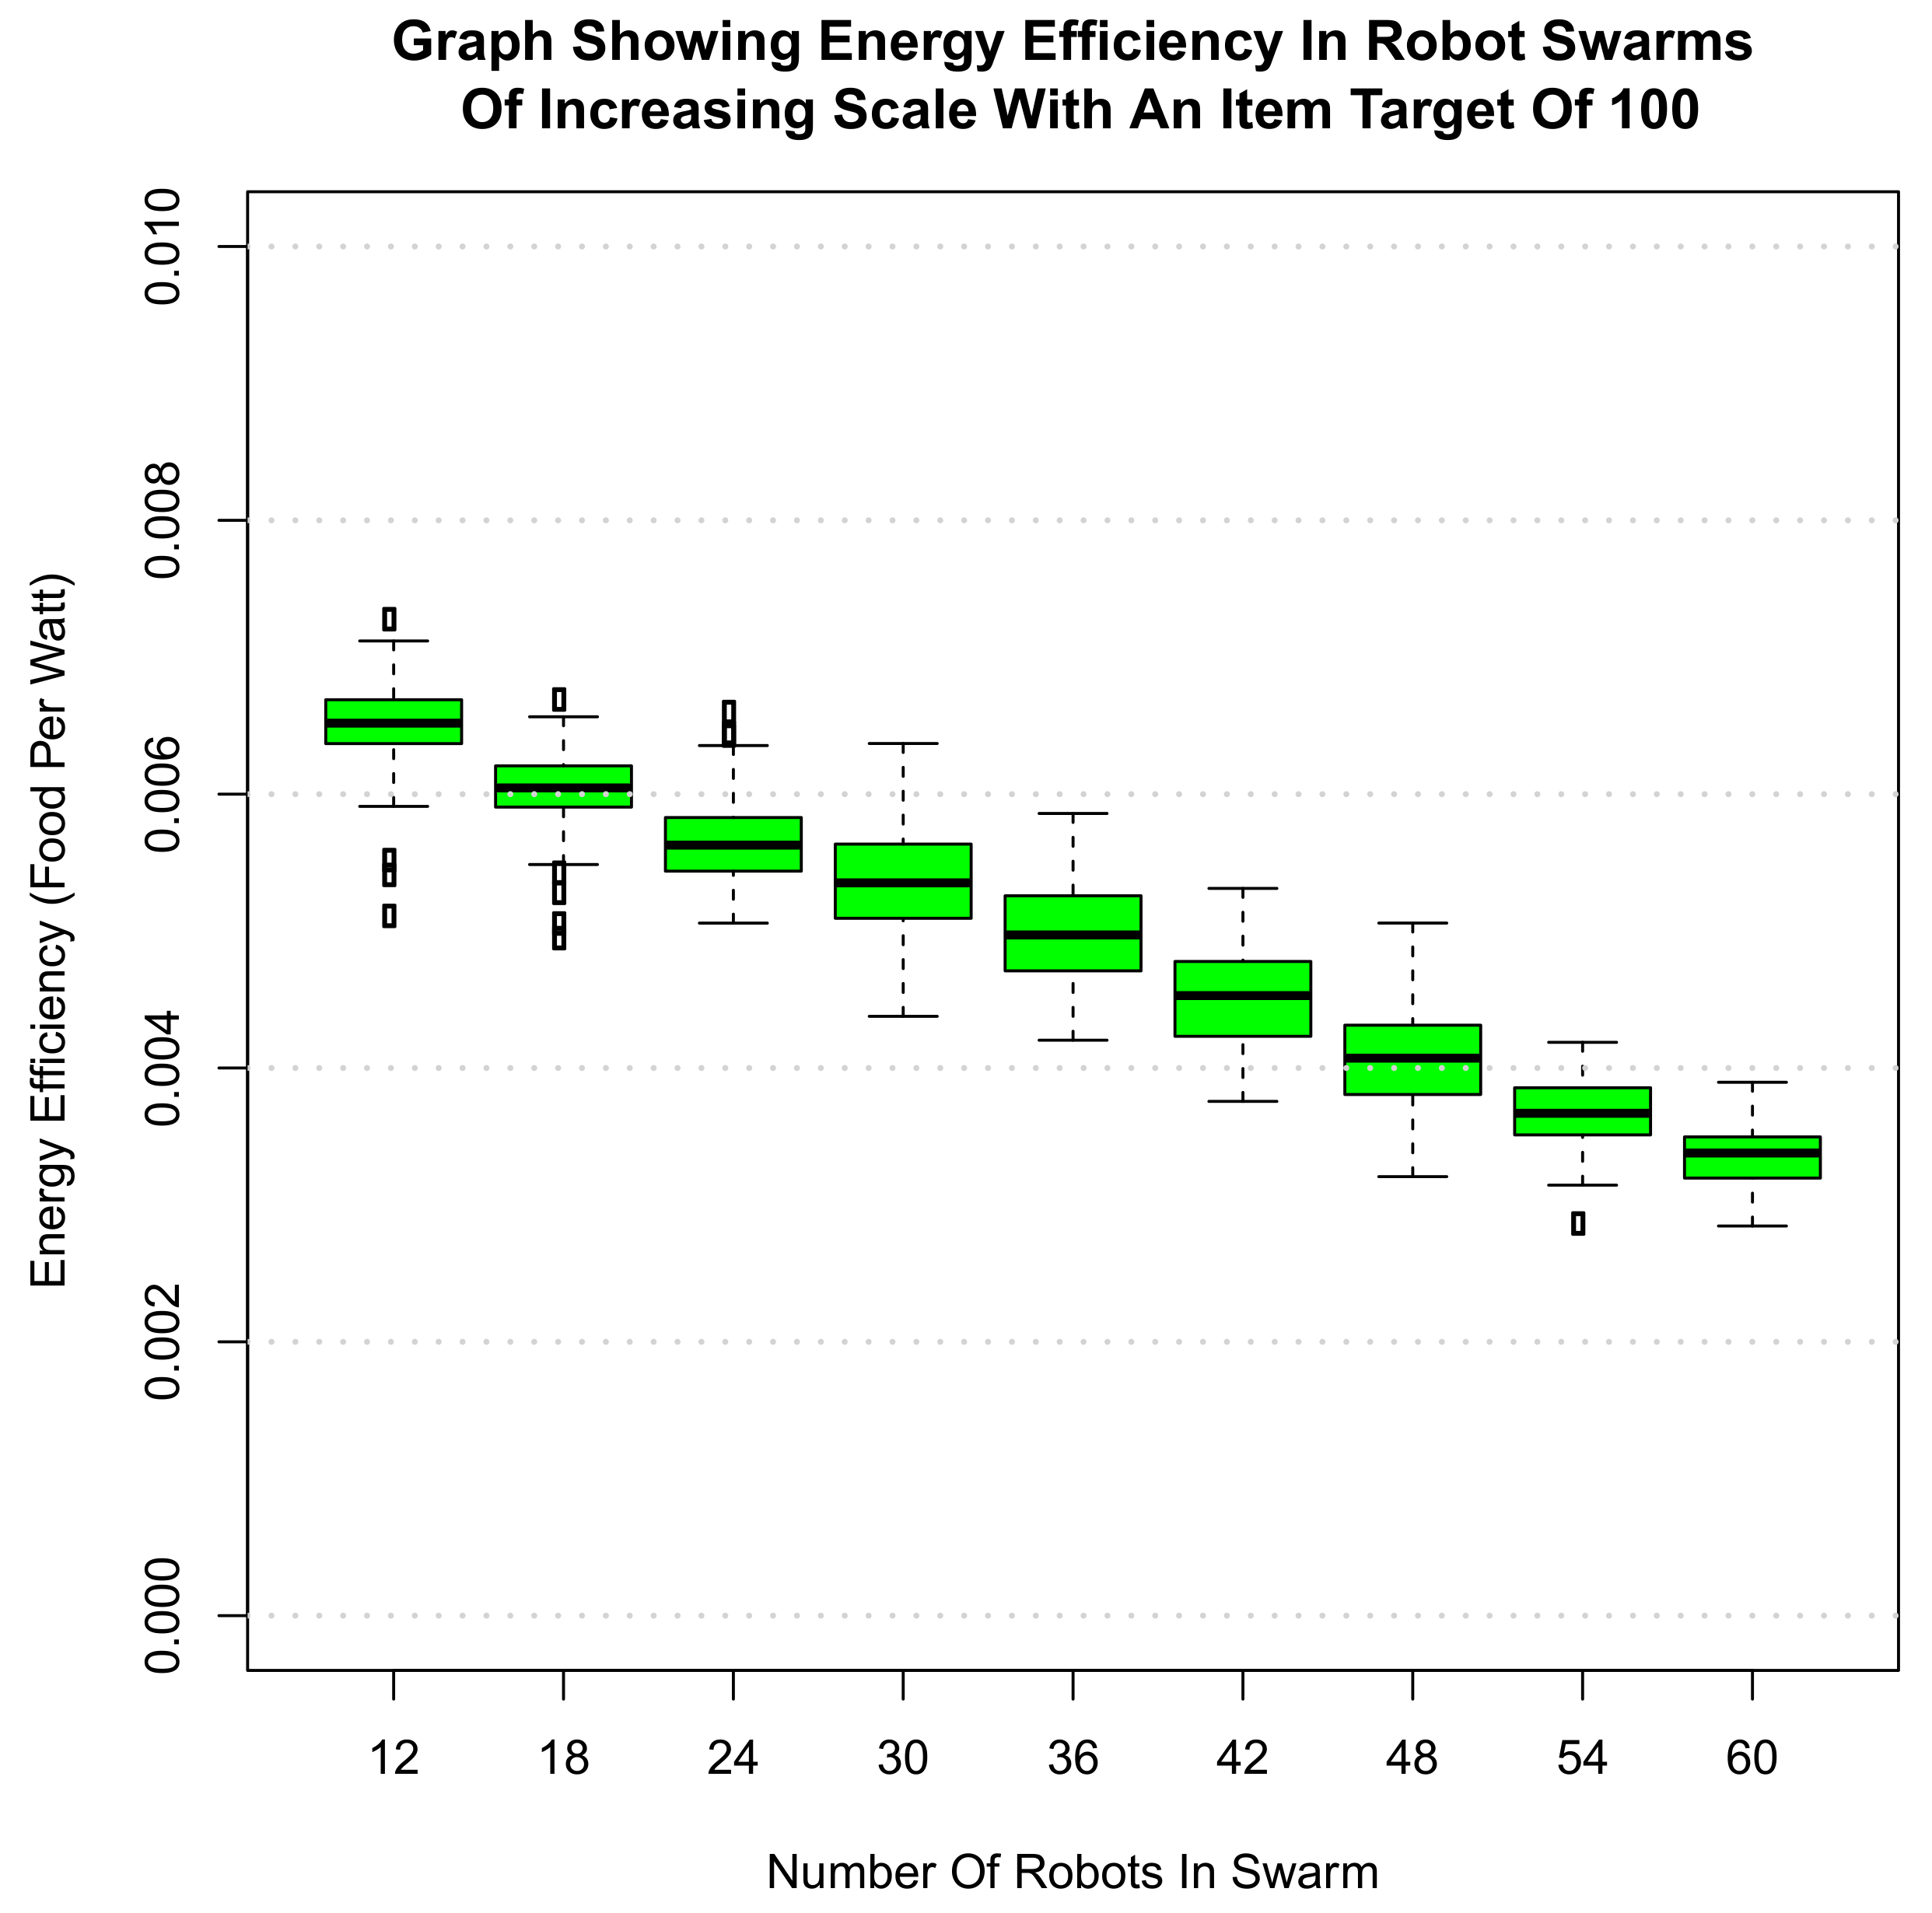
The scalability tests were conducted by increasing the number of robots in each simulation by 6 for each set of trials, testing swarm sizes ranging between 12 and 60. In each experiment the target number of items was set to 100 and in every test all of these items were retrieved. The experiments conducted terminated after 500 simulated seconds or if the target number of items was reached. The item target of 100 was chosen due to the variability in performance at said target number across each of the previously tested systems. This indicated that this number of items is an area of interest, providing substantial challenge to some systems while still an achievable goal to others.
The results of the scalability test can be seen illustrated in Figure 17. It can be seen that energy efficiency decreases linearly with the increase in members of the swarm. This was expected with the increased difficulty to the task as, while the amalgamated system is able to augment performance with a given swarm size, additional or unneeded robots will still create detriment to performance. Through the linear nature of this performance degradation, a user can select a swarm size which is suitable for a given task, trading off energy efficiency for the speed at which items should be gathered.

7. Discussion

This paper has explored the viability of numerous simultaneously functioning hormone inspired systems. To address this, a speed controller for a foraging swarm was designed using a hormone inspired system and proven to be effective for energy efficient item collection at a number of different item targets. This system was then combined with a previously developed sleep system. The combination of these two systems addressed issues found amongst each of the individual systems, creating large increases to performance with minimal drawbacks. Based on this success a third hormone system was introduced, allowing members of a heterogeneous swarm to form a preference for environment, based on how successful individual robots assessed themselves to be in a given terrain. This new system tested with the speed adapting virtual hormone, identified as the system that would cause the most issue when attempting to categorise robots, was still able to effectively categorise robots, with limited change as demand increased.
Finally, the combination of all of the hormone systems was tested. While not producing the best energy efficiency of the tested systems, the amalgamated hormone system produced the best combination of collection rate and energy efficiency for the environment the system was tested in. Considering the total performance of the system should definitely take into account both energy efficiency and item collection, as the values they represent show task effectiveness and task completion respectively.
The results from the work in this paper have shown that a complex system controlled almost entirely by virtual hormones can be an effective adaptation system within a swarm robotic context.
Future work will involve robustness analysis of the systems, ensuring that performance is not drastically reduced by problems to be expected in real world scenarios such as motor wear or actuator failure. Along side this, additional testing can further close the reality gap, introducing gaussian noise to both the power model and wheel speeds. This will introduce an element of variability to both, as it is expected that a group of robots in reality would experience non-perfect energy consumption and navigational abilities. In addition to this tests using the PSI swarm robots (the robots approximated in simulation within this papers presented experiments) should take place to demonstrate the capabilities of a physically implemented system. These capabilities will provide evidence to suggest that swarms, equipped with complex hormone systems, would be capable of functioning well in real world applications that require on-line adaptation. These applications could involve disaster relief work, with systems investigating vast areas of volatile and changing environments associated with disaster aftermath, securing survivors or sustaining resources. Equally, hormone systems could be implemented to enable searching for valuable minerals or suitable areas for habitation on foreign planets with hostile and erratic weather.

Author Contributions

Conceptualization, J.W.; methodology, J.W.; software, J.W.; validation, J.W.; formal analysis, J.W.; investigation, J.W.; data curation, J.W.; Writing—Original draft preparation, J.W.; Writing—Review and editing, J.T. and A.T.; visualization, J.W.; supervision, J.T. and A.T.

Funding

This research received no external funding.

Conflicts of Interest

The authors declare no conflict of interest.

References

  1. Jaycox, E.R. Behavioral changes in worker honey bees (Apis mellifera L.) after injection with synthetic juvenile hormone (Hymenoptera: Apidae). J. Kansas Entomol. Soc. 1976, 46, 165–170. [Google Scholar]
  2. Adkins-Regan, E. Hormones and Animal Social Behavior; Princeton University Press: Princeton, NJ, USA, 2005. [Google Scholar]
  3. Baird, T.A. Lizards and other reptiles as model systems for the study of contest behaviour. In Animal Contests; Cambridge University Press: Cambridge, UK, 2013; pp. 258–286. [Google Scholar]
  4. Kuyucu, T.; Tanev, I.; Shimohara, K. Hormone-inspired behaviour switching for the control of collective robotic organisms. Robotics 2013, 2, 165–184. [Google Scholar] [CrossRef]
  5. Wilson, J.; Timmis, J.; Tyrrell, A. A Hormone Arbitration System for Energy Efficient Foraging in Robot Swarms. In Annual Conference Towards Autonomous Robotic Systems; Springer: Berlin, Germany, 2018; pp. 305–316. [Google Scholar]
  6. Shen, W.; Will, P.; Galstyan, A.; Chuong, C. Hormone-inspired self-organization and distributed control of robotic swarms. Auton. Robots 2004, 17, 93–105. [Google Scholar] [CrossRef]
  7. Wilson, J.; Timmis, J.; Tyrrell, A. A Hormone-Inspired Arbitration System For Self Identifying Abilities Amongst A Heterogeneous Robot Swarm. In Proceedings of the 2018 IEEE Symposium Series on Computational Intelligence (SSCI), Bangalore, India, 18–21 November 2018; pp. 843–850. [Google Scholar]
  8. Stradner, J.; Hamann, H.; Schmickl, T.; Crailsheim, K. Analysis and implementation of an artificial homeostatic hormone system: A first case study in robotic hardware. In Proceedings of the 2009 IEEE/RSJ International Conference on Intelligent Robots and Systems, St. Louis, MO, USA, 10–15 October 2009; pp. 595–600. [Google Scholar]
  9. Kernbach, S.; Meister, E.; Schlachter, F.; Jebens, K.; Szymanski, M.; Liedke, J.; Laneri, D.; Winkler, L.; Schmickl, T.; Thenius, R.; et al. Symbiotic robot organisms: REPLICATOR and SYMBRION projects. In Proceedings of the 8th workshop on performance metrics for intelligent systems, Gaithersburg, MD, USA, 19–21 August 2008; pp. 62–69. [Google Scholar]
  10. Jin, Y.; Guo, H.; Meng, Y. Robustness analysis and failure recovery of a bio-inspired self-organizing multi-robot system. In Proceedings of the 2009 Third IEEE International Conference on Self-Adaptive and Self-Organizing Systems, San Francisco, CA, USA, 14–18 September 2009; pp. 154–164. [Google Scholar]
  11. Palmieri, N.; Yang, X.S.; De Rango, F.; Marano, S. Comparison of bio-inspired algorithms applied to the coordination of mobile robots considering the energy consumption. Neural Comput. Appl. 2017, 31, 263–286. [Google Scholar] [CrossRef]
  12. Liu, W.; Winfield, A.F.T.; Sa, J.; Chen, J.; Dou, L. Towards energy optimization: Emergent task allocation in a swarm of foraging robots. Adapt. Behav. 2007, 15, 289–305. [Google Scholar] [CrossRef]
  13. De Martinisl, V.; Gallo, M.; D’Acierno, L. Estimating the benefits of energy-efficient train driving strategies: A model calibration with real data. Urban Transp. XIX 2013, 130, 201–211. [Google Scholar]
  14. Miyatake, M.; Ko, H. Optimization of train speed profile for minimum energy consumption. IEEJ Trans. Electr. Electron. Eng. 2010, 5, 263–269. [Google Scholar] [CrossRef]
  15. Lee, J.H.; Ahn, C.W. Improving energy efficiency in cooperative foraging swarm robots using behavioral model. In Proceedings of the 2011 IEEE Sixth International Conference on Bio-Inspired Computing: Theories and Applications, Penang, Malaysia, 27–29 September 2011; pp. 39–44. [Google Scholar]
  16. Pang, B.; Zhang, C.; Song, Y.; Wang, H. Self-organized task allocation in swarm robotics foraging based on dynamical response threshold approach. In Proceedings of the 2017 IEEE 18th International Conference on Advanced Robotics (ICAR), Hong Kong, China, 10–12 July 2017; pp. 256–261. [Google Scholar]
  17. Hilder, J.; Horsfield, A.; Millard, A.G.; Timmis, J. The Psi Swarm: A Low-Cost Robotics Platform and Its Use in an Education Setting. In Conference Towards Autonomous Robotic Systems; Springer: Berlin, Germany, 2016; pp. 158–164. [Google Scholar]
  18. Bonani, M.; Longchamp, V.; Magnenat, S.; Rétornaz, P.; Burnier, D.; Roulet, G.; Vaussard, F.; Bleuler, H.; Mondada, F. The marXbot, a miniature mobile robot opening new perspectives for the collective-robotic research. In Proceedings of the 2010 IEEE/RSJ International Conference on Intelligent Robots and Systems, Taipei, Taiwan, 18–22 October 2010; pp. 4187–4193. [Google Scholar]
  19. Keysight Technologies. N6700 Modular Power System Family; Keysight Technologies: Santa Rosa, CA, USA, 2016. [Google Scholar]
  20. Buchanan, E.; Pomfret, A.; Timmis, J. Dynamic Task Partitioning for Foraging Robot Swarms. Prodeedings of the International Conference on Swarm Intelligence, Bali, Indonesia, 25–30 June 2016; Springer: Berlin, Germany, 2016; pp. 113–124. [Google Scholar]
  21. Pinciroli, C.; Trianni, V.; O’Grady, R.; Pini, G.; Brutschy, A.; Brambilla, M.; Mathews, N.; Ferrante, E.; Di Caro, G.; Ducatelle, F.; et al. ARGoS: A Modular, Parallel, Multi-Engine Simulator for Multi-Robot Systems. Swarm Intell. 2012, 6, 271–295. [Google Scholar] [CrossRef]
  22. Robinson, S. Simulation: The Practice of Model Development and Use; Wiley: Chichester, UK, 2004. [Google Scholar]
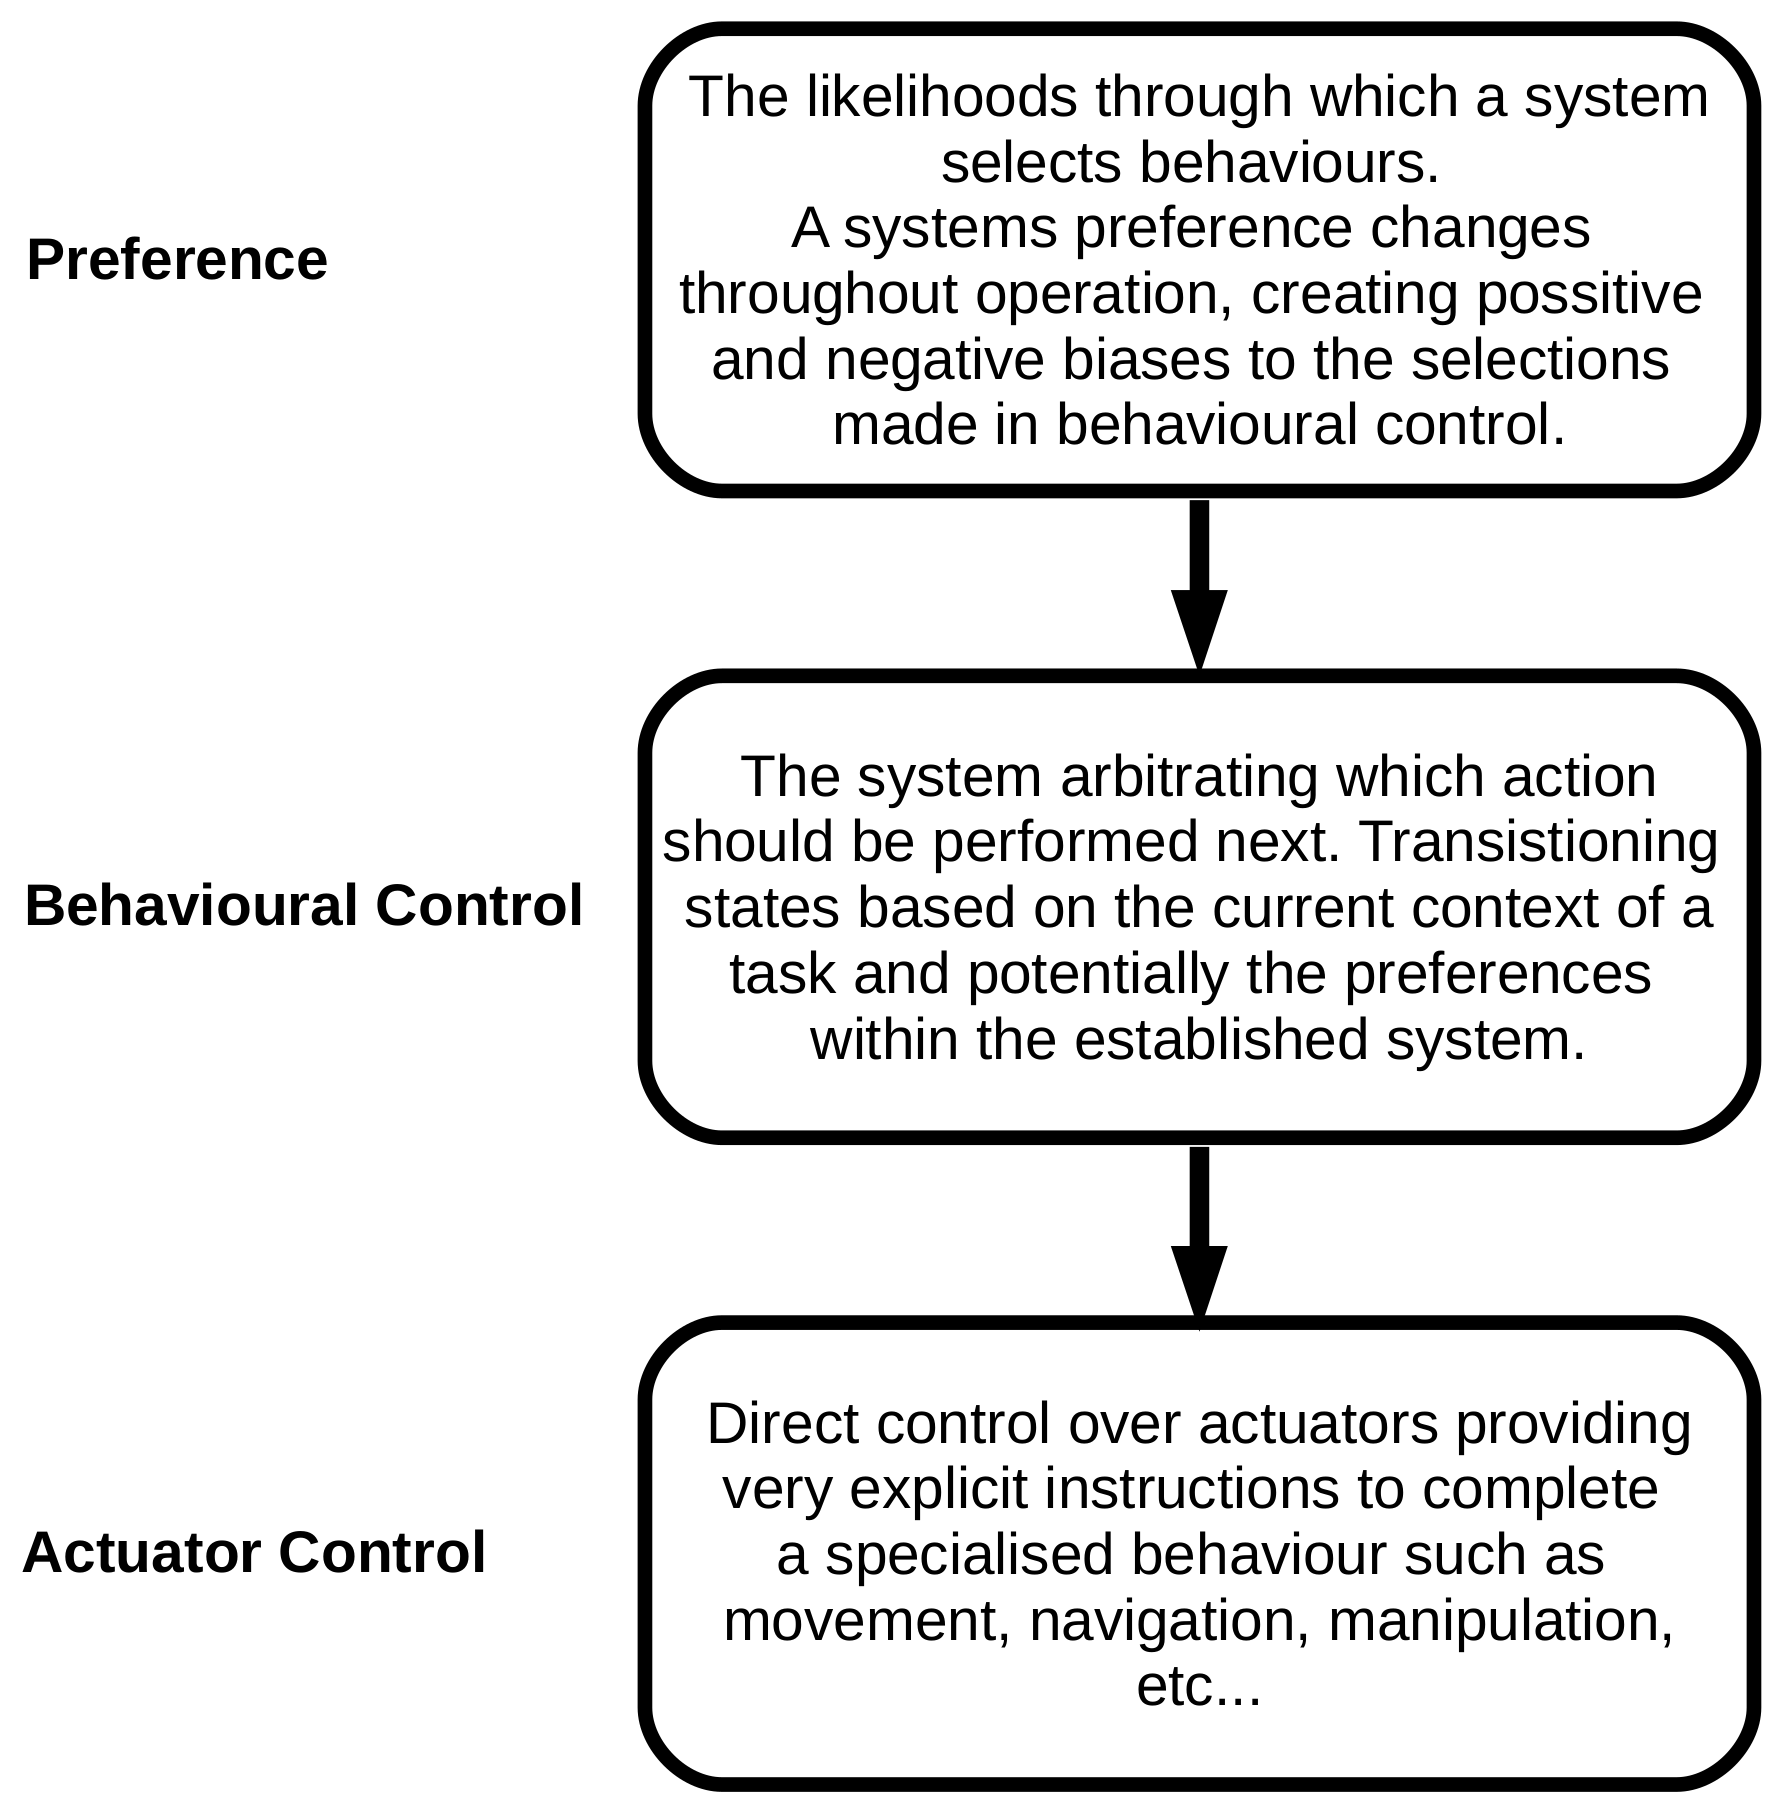
Figure 1. Behavioural hierarchy for those behaviours investigated within this paper.
Applsci 09 03524 g001
Figure 2. Graph displaying the results of the power consumption of a Psi Swarm robot increasing motor speed gradually. 10 repetitions were taken for these results and a trend line has been fit to the mean of these results and is shown in red.
Applsci 09 03524 g002
Figure 3. Graph showing average food gathered per energy unit consumed in a swarm of 20 foraging robots across 50 trials.
Applsci 09 03524 g003
Figure 4. Screenshot of first simulated environment used. Food items are shown as black circles in the white environment, puck robots can be seen waiting in the nest area (light grey).
Applsci 09 03524 g004
Figure 5. Screenshot of second simulated environment used. Food items are shown as black circles in the white environment, puck robots can be seen waiting in the nest area (light grey). Obstacles creating corridors are illustrated in dark grey.
Applsci 09 03524 g005
Figure 6. Target number for items collected ranged from 10 to 150 items of food. Percentage of the items requested versus those collected by the end of the simulation is indicated by colour (Green 100% and Red < 70%).
Applsci 09 03524 g006
Figure 7. Three systems tested in in environment 2. Target number for items collected ranged from 10 to 150 items of food. Percentage of the items requested versus those collected by the end of the simulation is indicated by colour (Green 100% and Red < 70%).
Applsci 09 03524 g007
Figure 8. Hormone inspired sleep system tested in environment 1. Target number for items collected ranged from 10 to 150 items of food. Percentage of the items requested versus those collected by the end of the simulation is indicated by colour (Green 100% and Red < 70%).
Applsci 09 03524 g008
Figure 9. Hormone inspired sleep system tested in environment 2. Target number for items collected ranged from 10 to 150 items of food. Percentage of the items requested versus those collected by the end of the simulation is indicated by colour (Green 100% and Red < 70%).
Applsci 09 03524 g009
Figure 10. Combined hormone sleep and speed system tested in both environments. Target number for items collected ranged from 10 to 150 items of food. Percentage of the items requested versus those collected by the end of the simulation is indicated by colour (Green 100% and Red < 70%).
Applsci 09 03524 g010
Figure 11. Environment used for all tests requiring terrain preference and categorisation of heterogeneous robots within the swarm.
Applsci 09 03524 g011
Figure 12. Effect of item target values driving different demands in the speed hormone on the percentage of robots taking preference to their optimal environment. The categorisation system running with no speed hormone present is marked as ‘no adapt’.
Applsci 09 03524 g012
Figure 13. Hormone preference system tested in the environment containing two difference terrain types. Target number for items collected ranged from 10 to 150 items of food. Percentage of the items requested versus those collected by the end of the simulation is indicated by colour (Green 100% and Red < 70%).
Applsci 09 03524 g013
Figure 14. Hormone preference system, combined with the sleep hormone system tested in the environment containing two difference terrain types. Target number for items collected ranged from 10 to 150 items of food. Percentage of the items requested versus those collected by the end of the simulation is indicated by colour (Green 100% and Red < 70%).
Applsci 09 03524 g014
Figure 15. Hormone preference system, combined with the speed hormone system tested in the environment containing two difference terrain types. Target number for items collected ranged from 10 to 150 items of food. Percentage of the items requested versus those collected by the end of the simulation is indicated by colour (Green 100% and Red < 70%).
Applsci 09 03524 g015
Figure 16. Hormone preference system combined with both the sleep and speed hormone system, tested in the environment containing two difference terrain types. Target number for items collected ranged from 10 to 150 items of food. Percentage of the items requested versus those collected by the end of the simulation is indicated by colour (Green 100% and Red < 70%).
Applsci 09 03524 g016
Figure 17. Results for energy efficiency as the number of robots in the swarm increases from 12 to 60.
Applsci 09 03524 g017
Table 1. Parameter values for the Return and Speed Hormones.
λ r γ r λ s γ s 1 γ s 2
0.997750.99990.01
Table 2. Environment 1: Wilcoxon rank sum tests comparing the three systems for the tested item collection targets between 10–150 in terms of energy efficiency. Significant differences (indicated by a p value of <0.05) are highlighted in bold.
System TypeEngineered vs. StaticHormone vs. StaticHormone vs. Engineered
Item Target Number
100.85500.03300.0053
200.1648p < 0.0001p < 0.0001
300.1800p < 0.0001p < 0.0001
400.2626p < 0.0001p < 0.0001
500.0906p < 0.0001p < 0.0001
600.8227p < 0.0001p < 0.0001
700.0068p < 0.0001p < 0.0001
800.0262p < 0.0001p < 0.0001
90p < 0.0001p < 0.0001p < 0.0001
100p < 0.0001p < 0.0001p < 0.0001
110p < 0.0001p < 0.0001p < 0.0001
120p < 0.00010.0199p < 0.0001
130p < 0.00010.3984p < 0.0001
140p < 0.0001p < 0.0001p < 0.0001
150p < 0.0001p < 0.0001p < 0.0001
Table 3. Environment 2: Wilcoxon rank sum tests comparing the three systems for the tested item collection targets between 10–150 in terms of energy efficiency. Significant differences (indicated by a p value of <0.05) are highlighted in bold.
System TypeEngineered vs. StaticHormone vs. StaticHormone vs. Engineered
Item Target Number
100.2482p < 0.0001p < 0.0001
200.6918p < 0.0001p < 0.0001
300.3432p < 0.0001p < 0.0001
400.1010p < 0.0001p < 0.0001
500.0817p < 0.0001p < 0.0001
600.0020p < 0.0001p < 0.0001
700.0002p < 0.0001p < 0.0001
80p < 0.0001p < 0.0001p < 0.0001
90p < 0.0001p < 0.0001p < 0.0001
100p < 0.0001p < 0.0001p < 0.0001
110p < 0.0001p < 0.0001p < 0.0001
120p < 0.0001p < 0.0001p < 0.0001
130p < 0.0001p < 0.0001p < 0.0001
140p < 0.0001p < 0.0001p < 0.0001
150p < 0.0001p < 0.0001p < 0.0001
Table 4. Parameter values for the Return and Speed Hormones.
α σ λ σ γ σ 1 γ σ 2 α h λ h γ h
0.010.9990.010.060.0.0150.99910
Table 5. Wilcoxon rank sum tests comparing the combined hormone system with both the speed hormone system and the sleep hormone system, in both of the previously established environments. Tests were conducted for item collection targets between 10–150 in terms of energy efficiency. Significant differences (indicated by a p value of <0.05) are highlighted in bold.
Item Target NumberHormone Speed vs. Hormone CombinationHormone Sleep vs. Hormone Combination
(Environment 1)(Environment 2)(Environment 1)(Environment 2)
100.96800.00470.23150.019
200.88300.00400.16530.0056
300.5290p < 0.00010.5831p < 0.0001
400.6017p < 0.00010.0810p < 0.0001
500.5290p < 0.0001p < 0.0001p < 0.0001
600.0809p < 0.0001p < 0.0001p < 0.0001
700.0283p < 0.0001p < 0.0001p < 0.0001
800.0047p < 0.0001p < 0.0001p < 0.0001
900.0675p < 0.0001p < 0.0001p < 0.0001
1000.0024p < 0.0001p < 0.00010.0430
1100.0910p < 0.00010.00240.0002
1200.0763p < 0.00010.9042p < 0.0001
1300.1081p < 0.00010.0211p < 0.0001
1400.0227p < 0.0001p < 0.0001p < 0.0001
1500.2648p < 0.0001p < 0.0001p < 0.0001
Table 6. Speed Coefficients for Heterogeneous Robot Wheels on Different Terrains.
Terrain TypeWood Suited WheelsGrass Suited Wheels
Grass0.60.7
Wood10.8