The Self-Calibration Method for the Vertex Distance of the Elliptical Paraboloid Array

 , , ,
, , ,
Abstract
1. Introduction
2. Materials and Methods
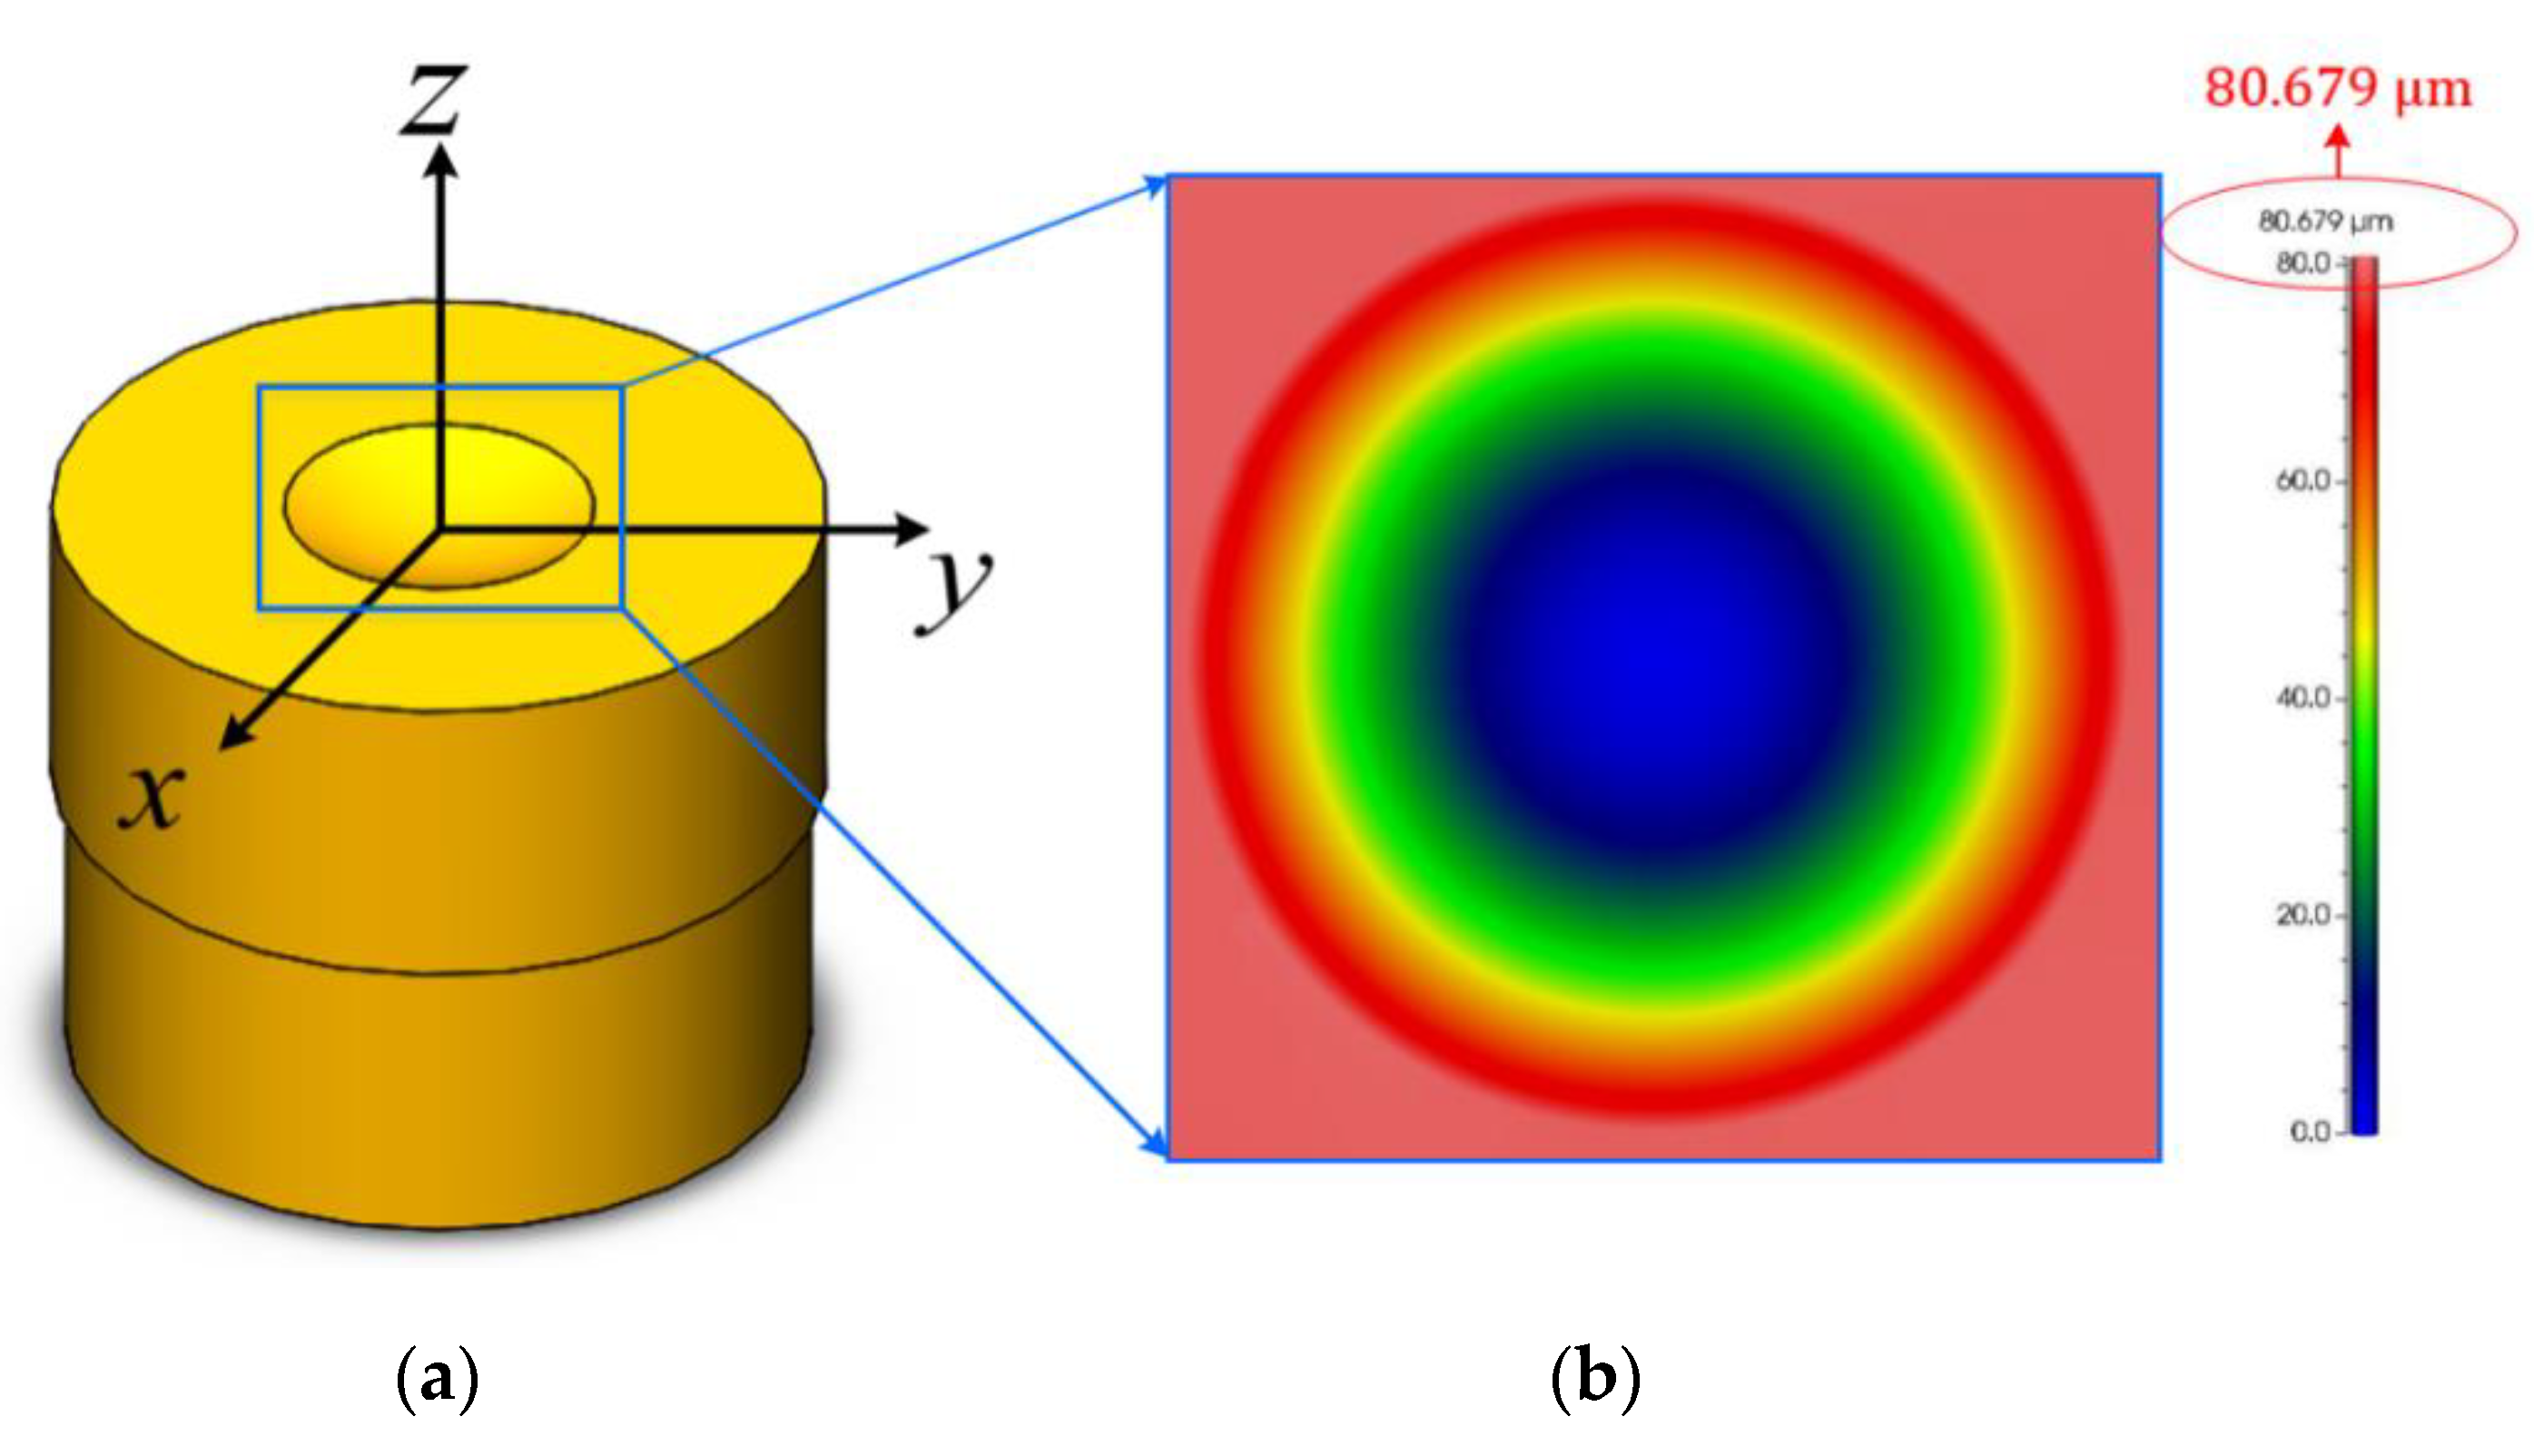
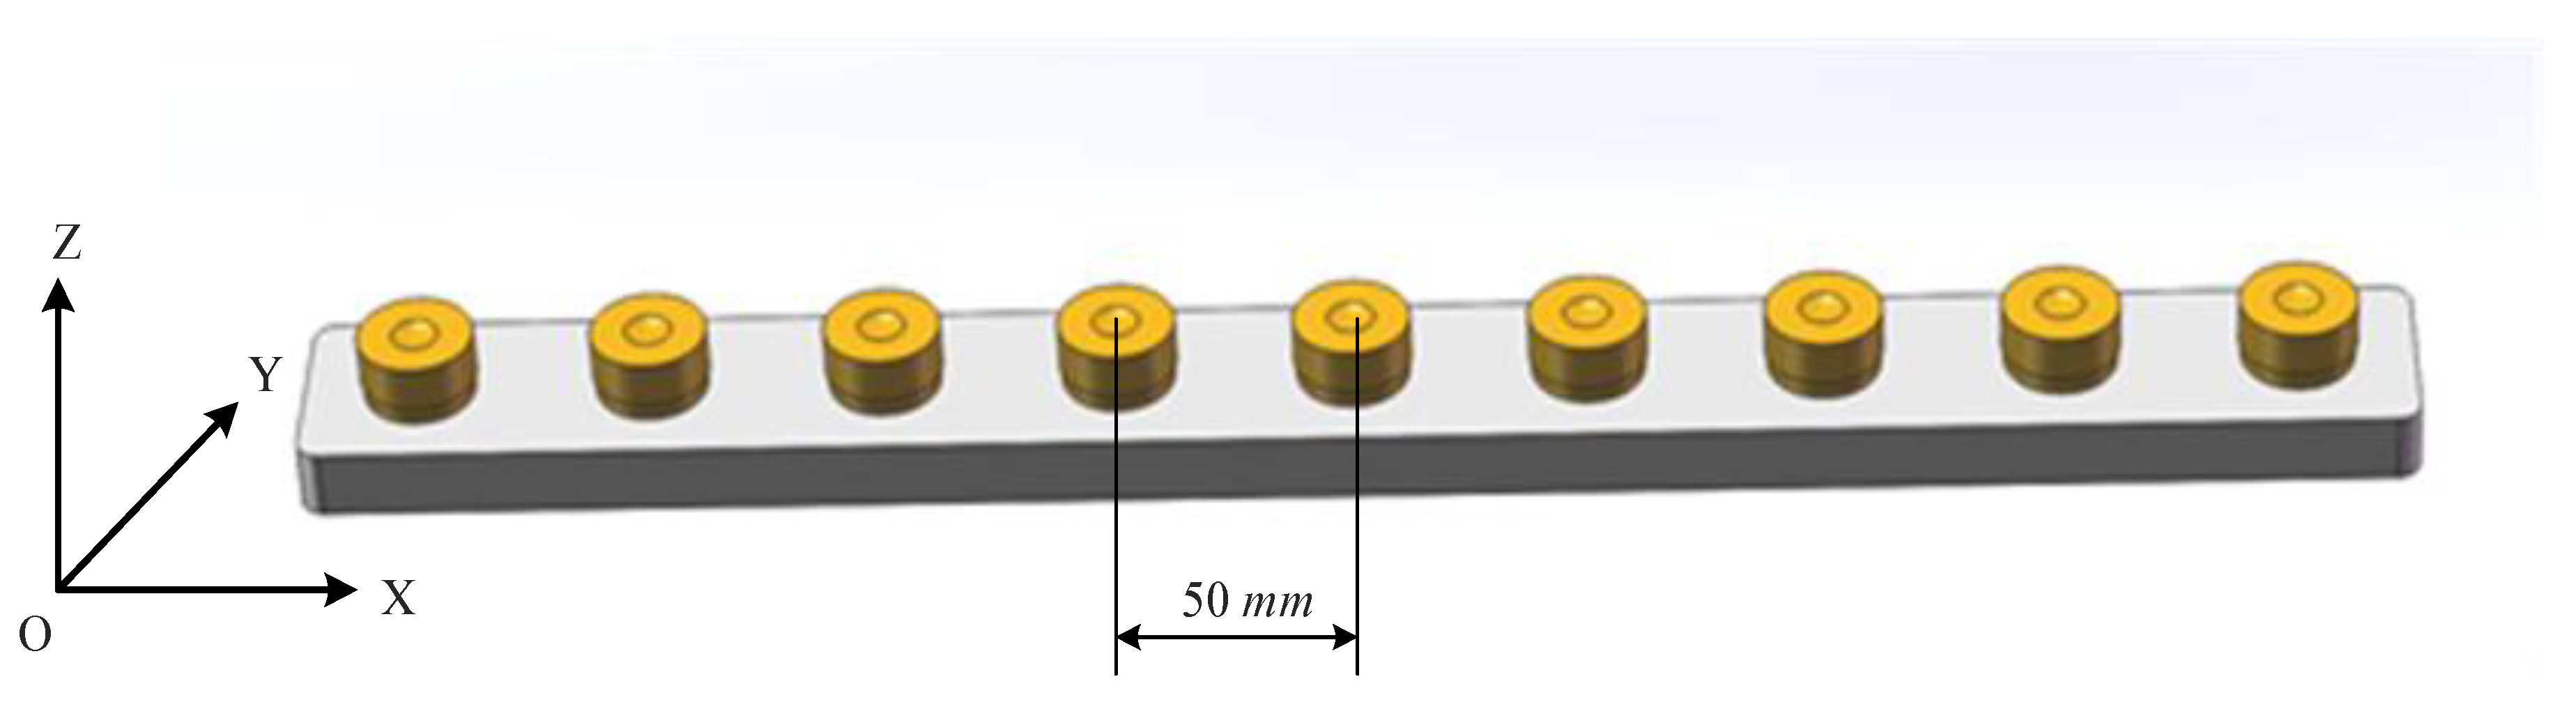
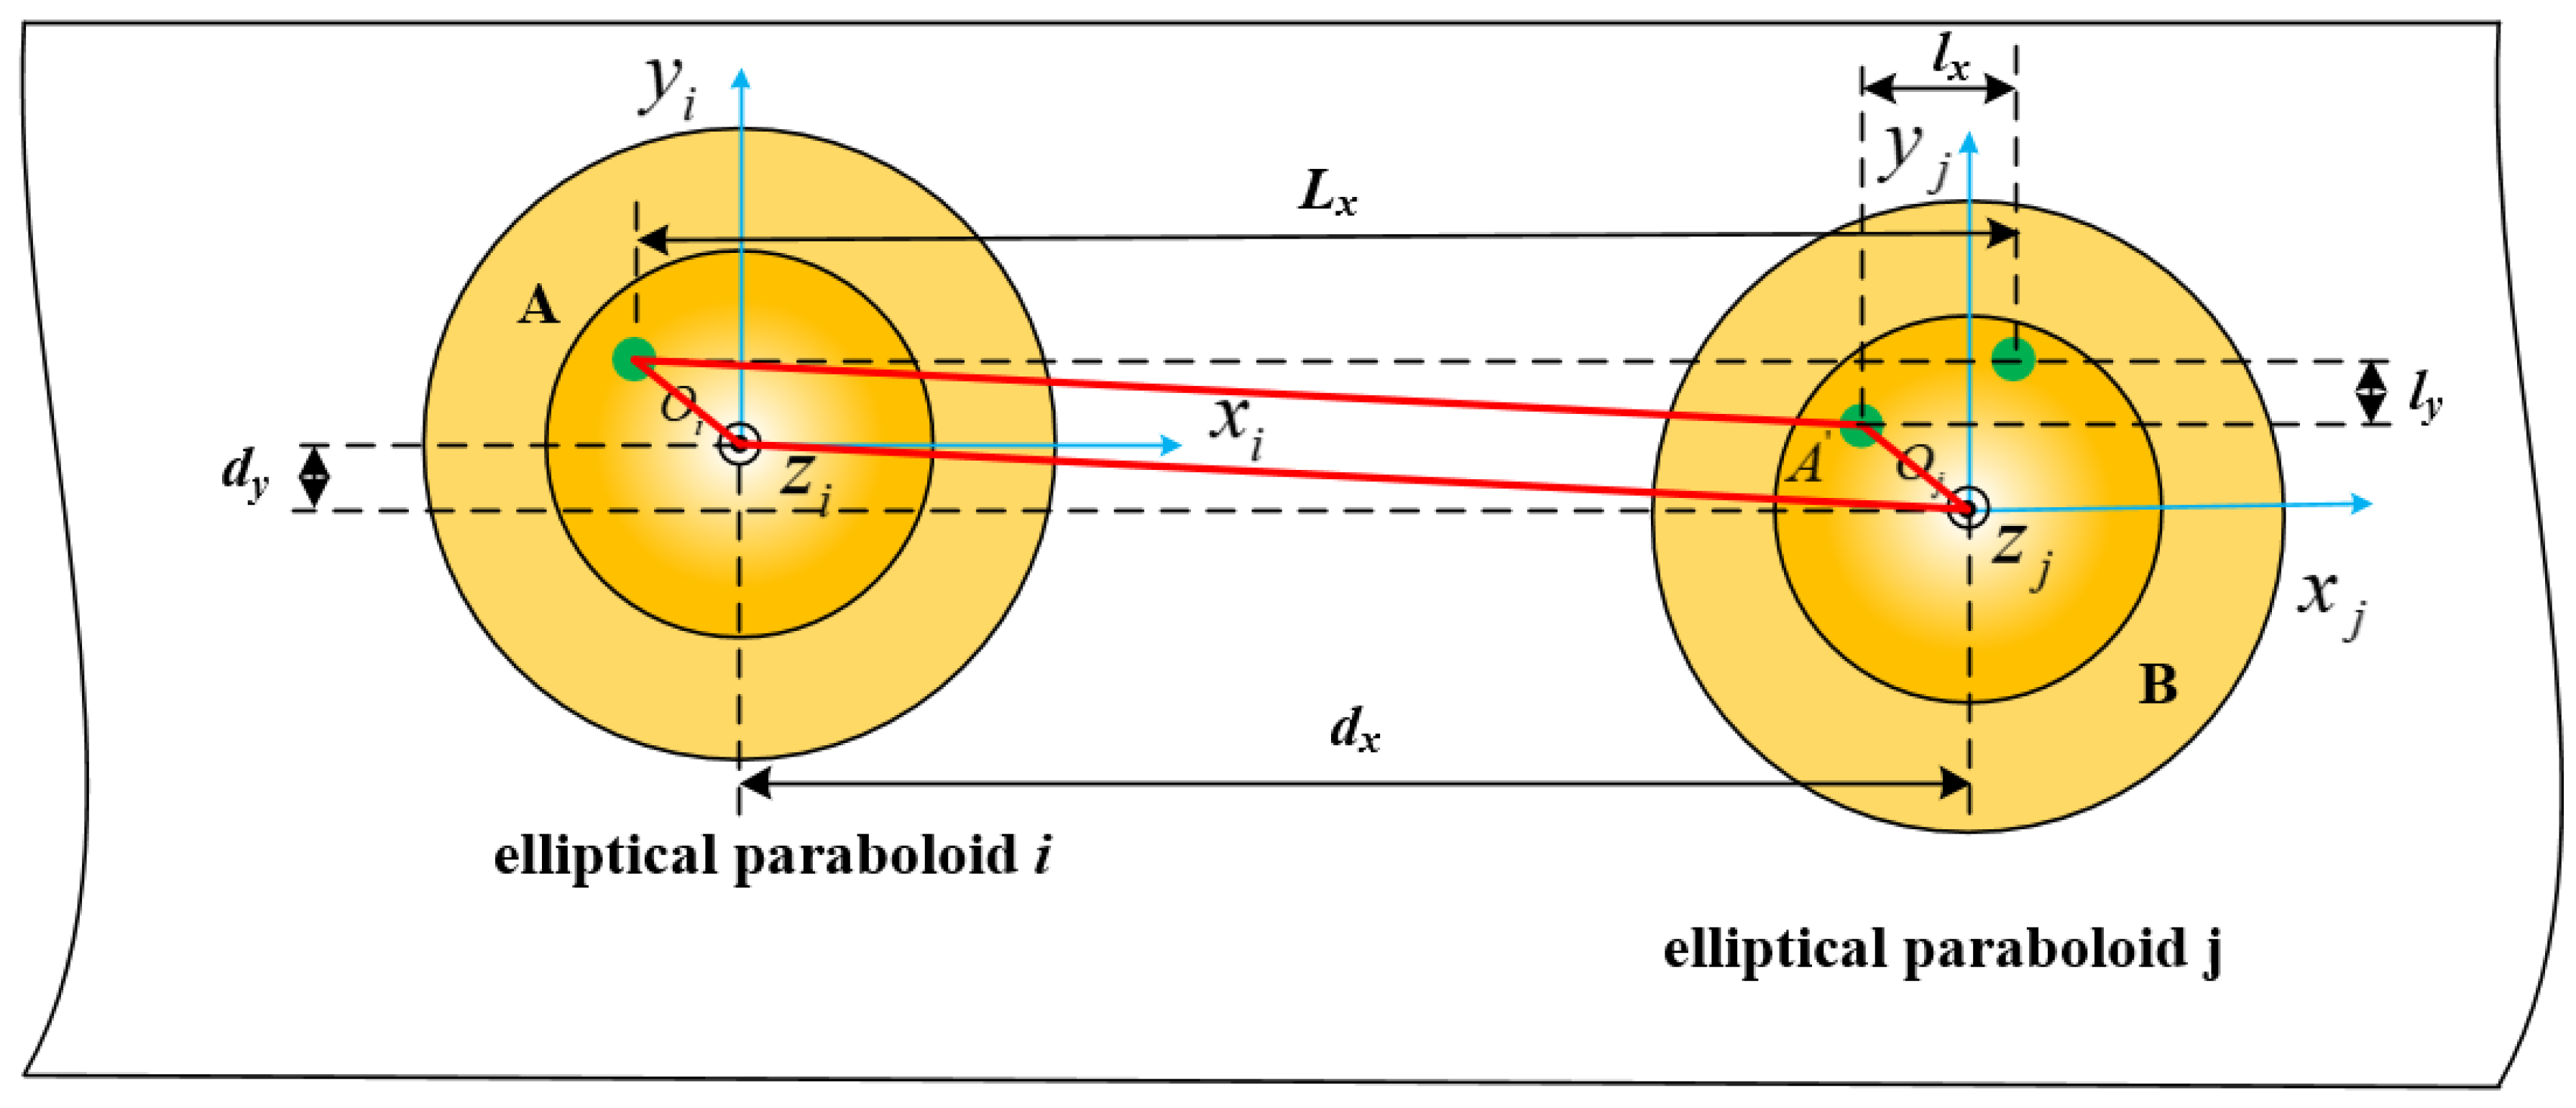
2.1. Elliptical Paraboloid Array
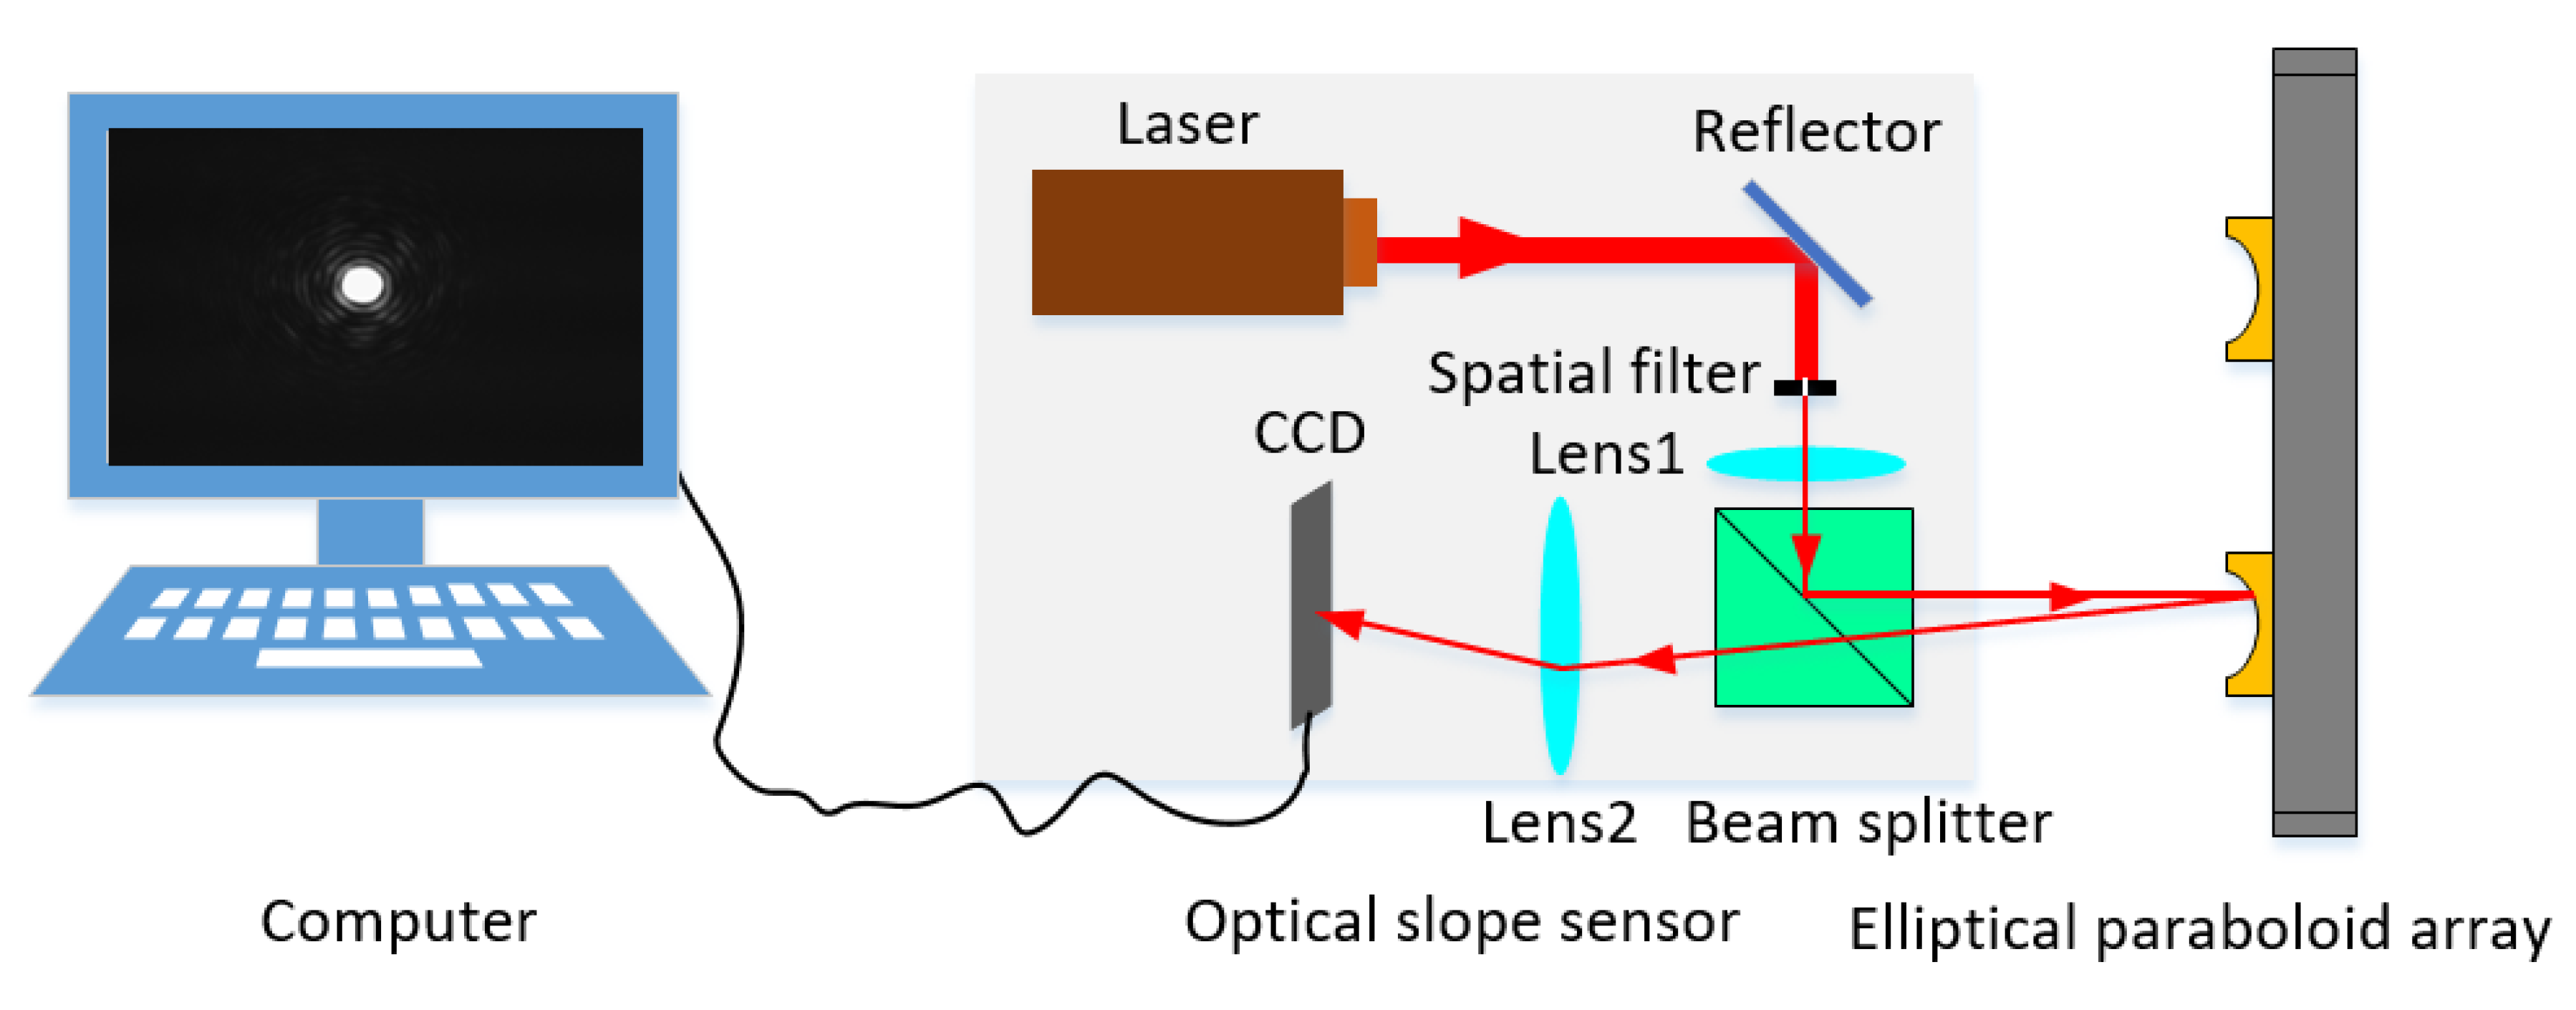
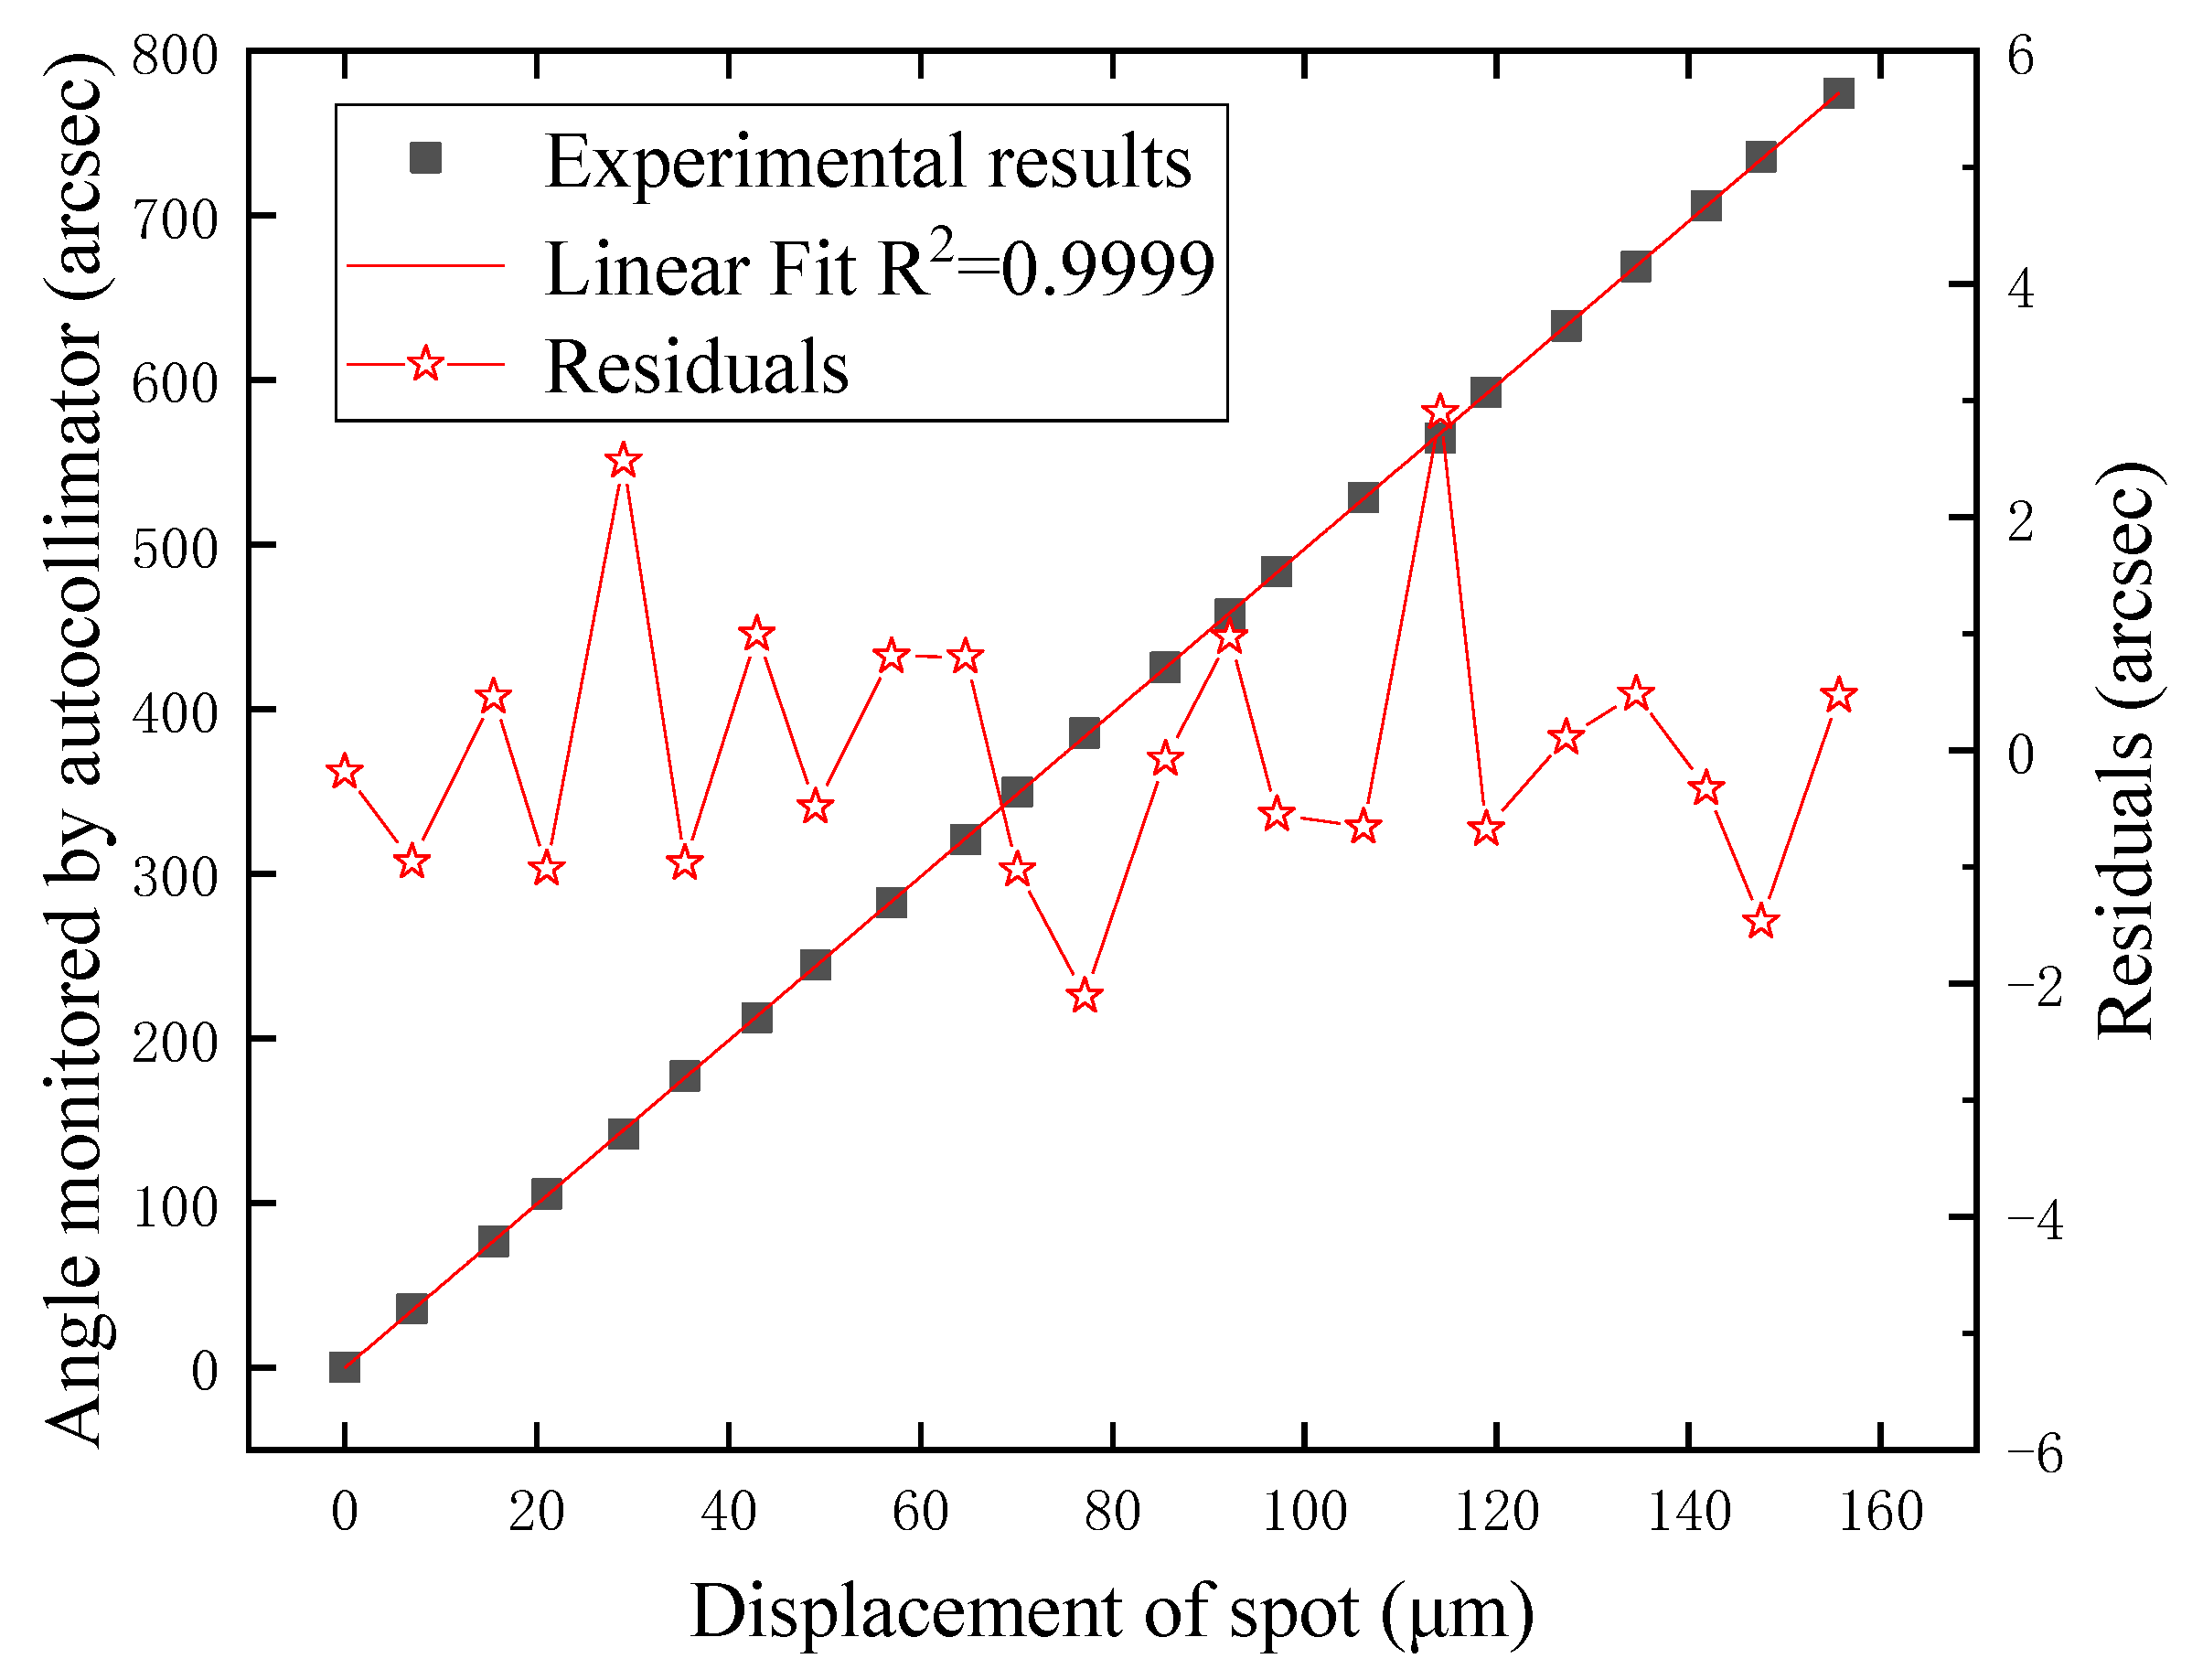
2.2. Optical Slope Sensor
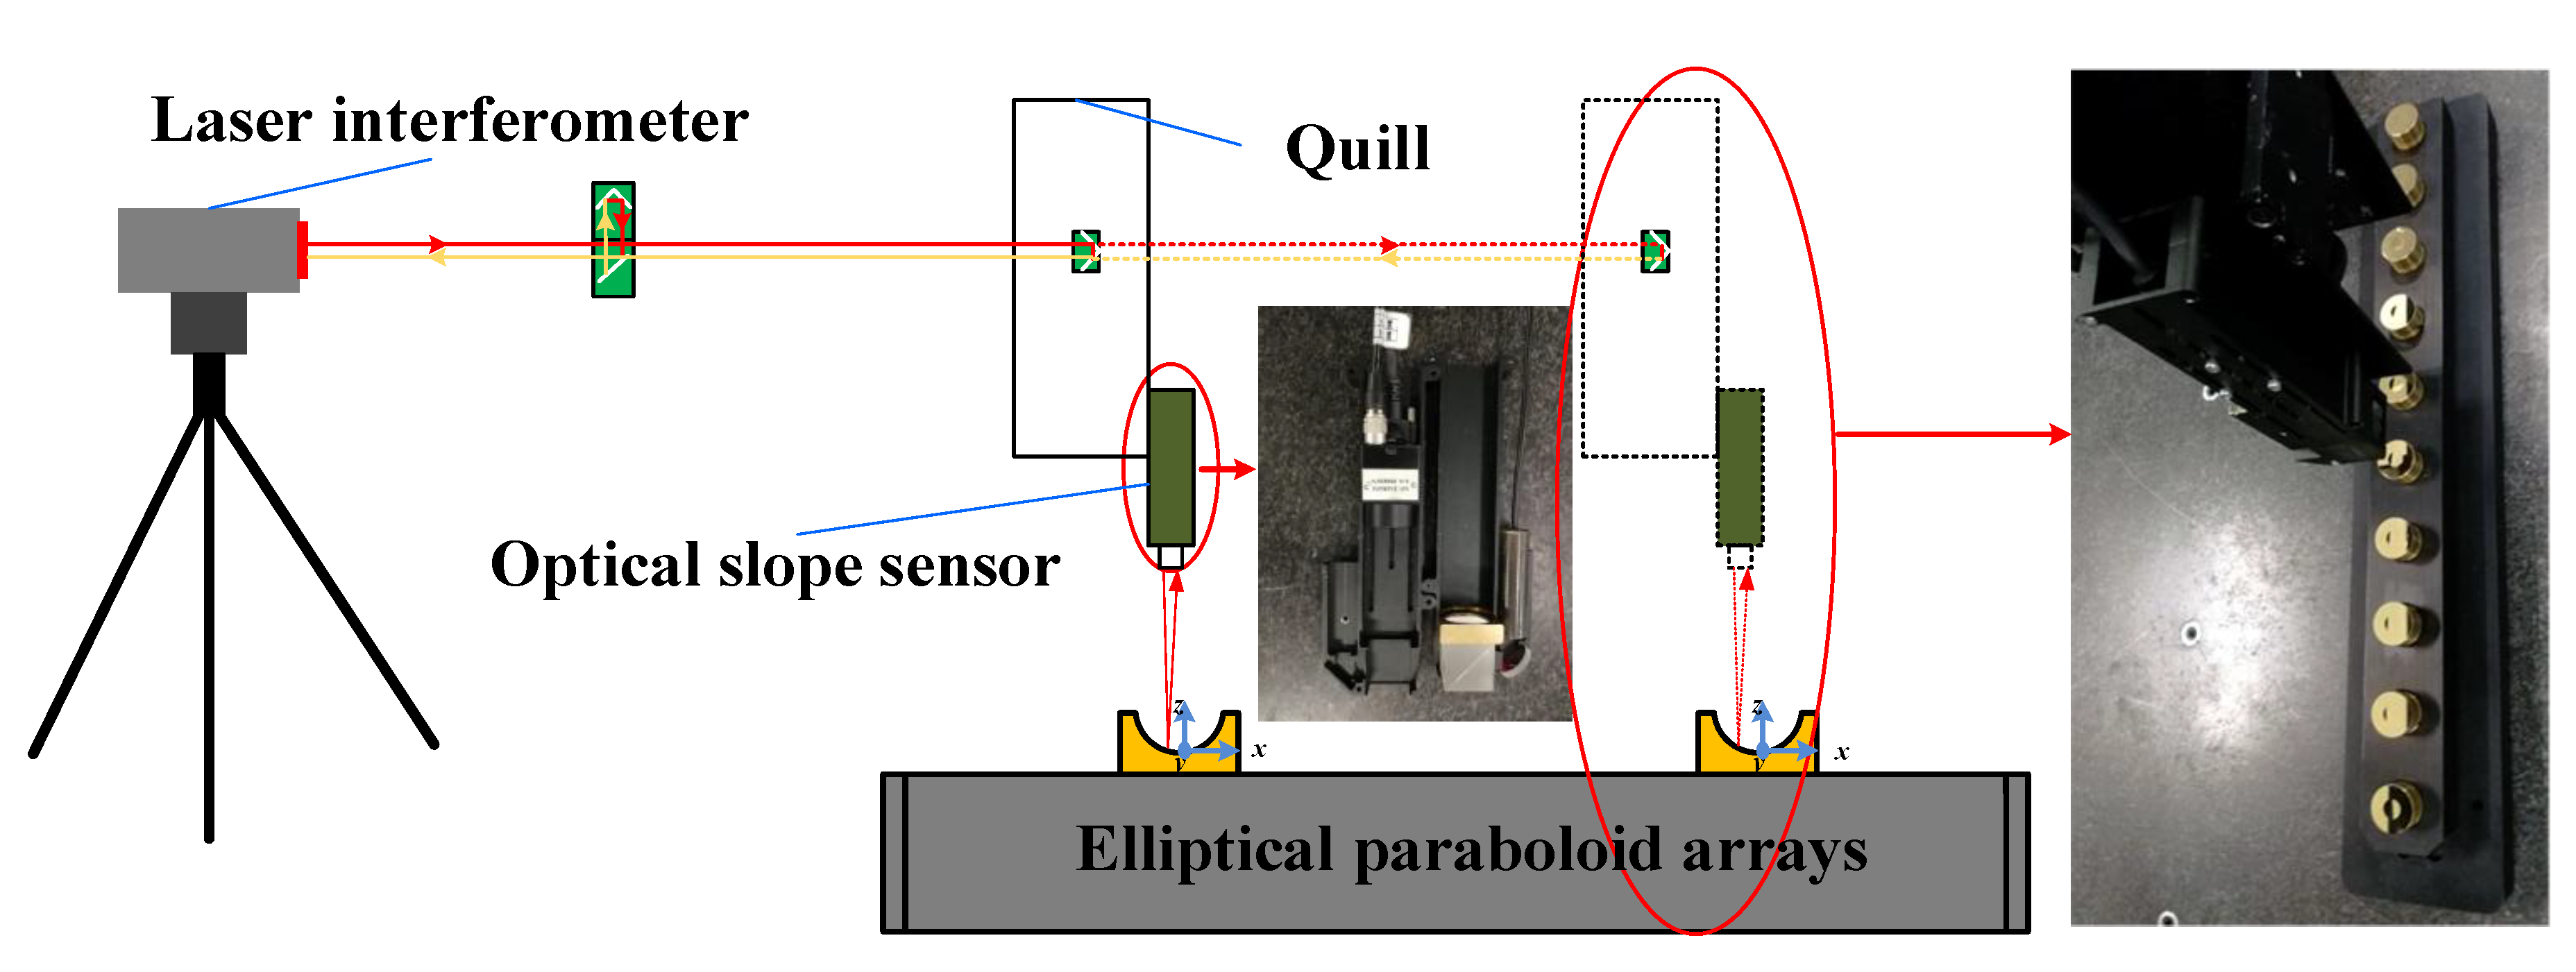
2.3. Experimental Apparatus
2.4. Mathematical Model
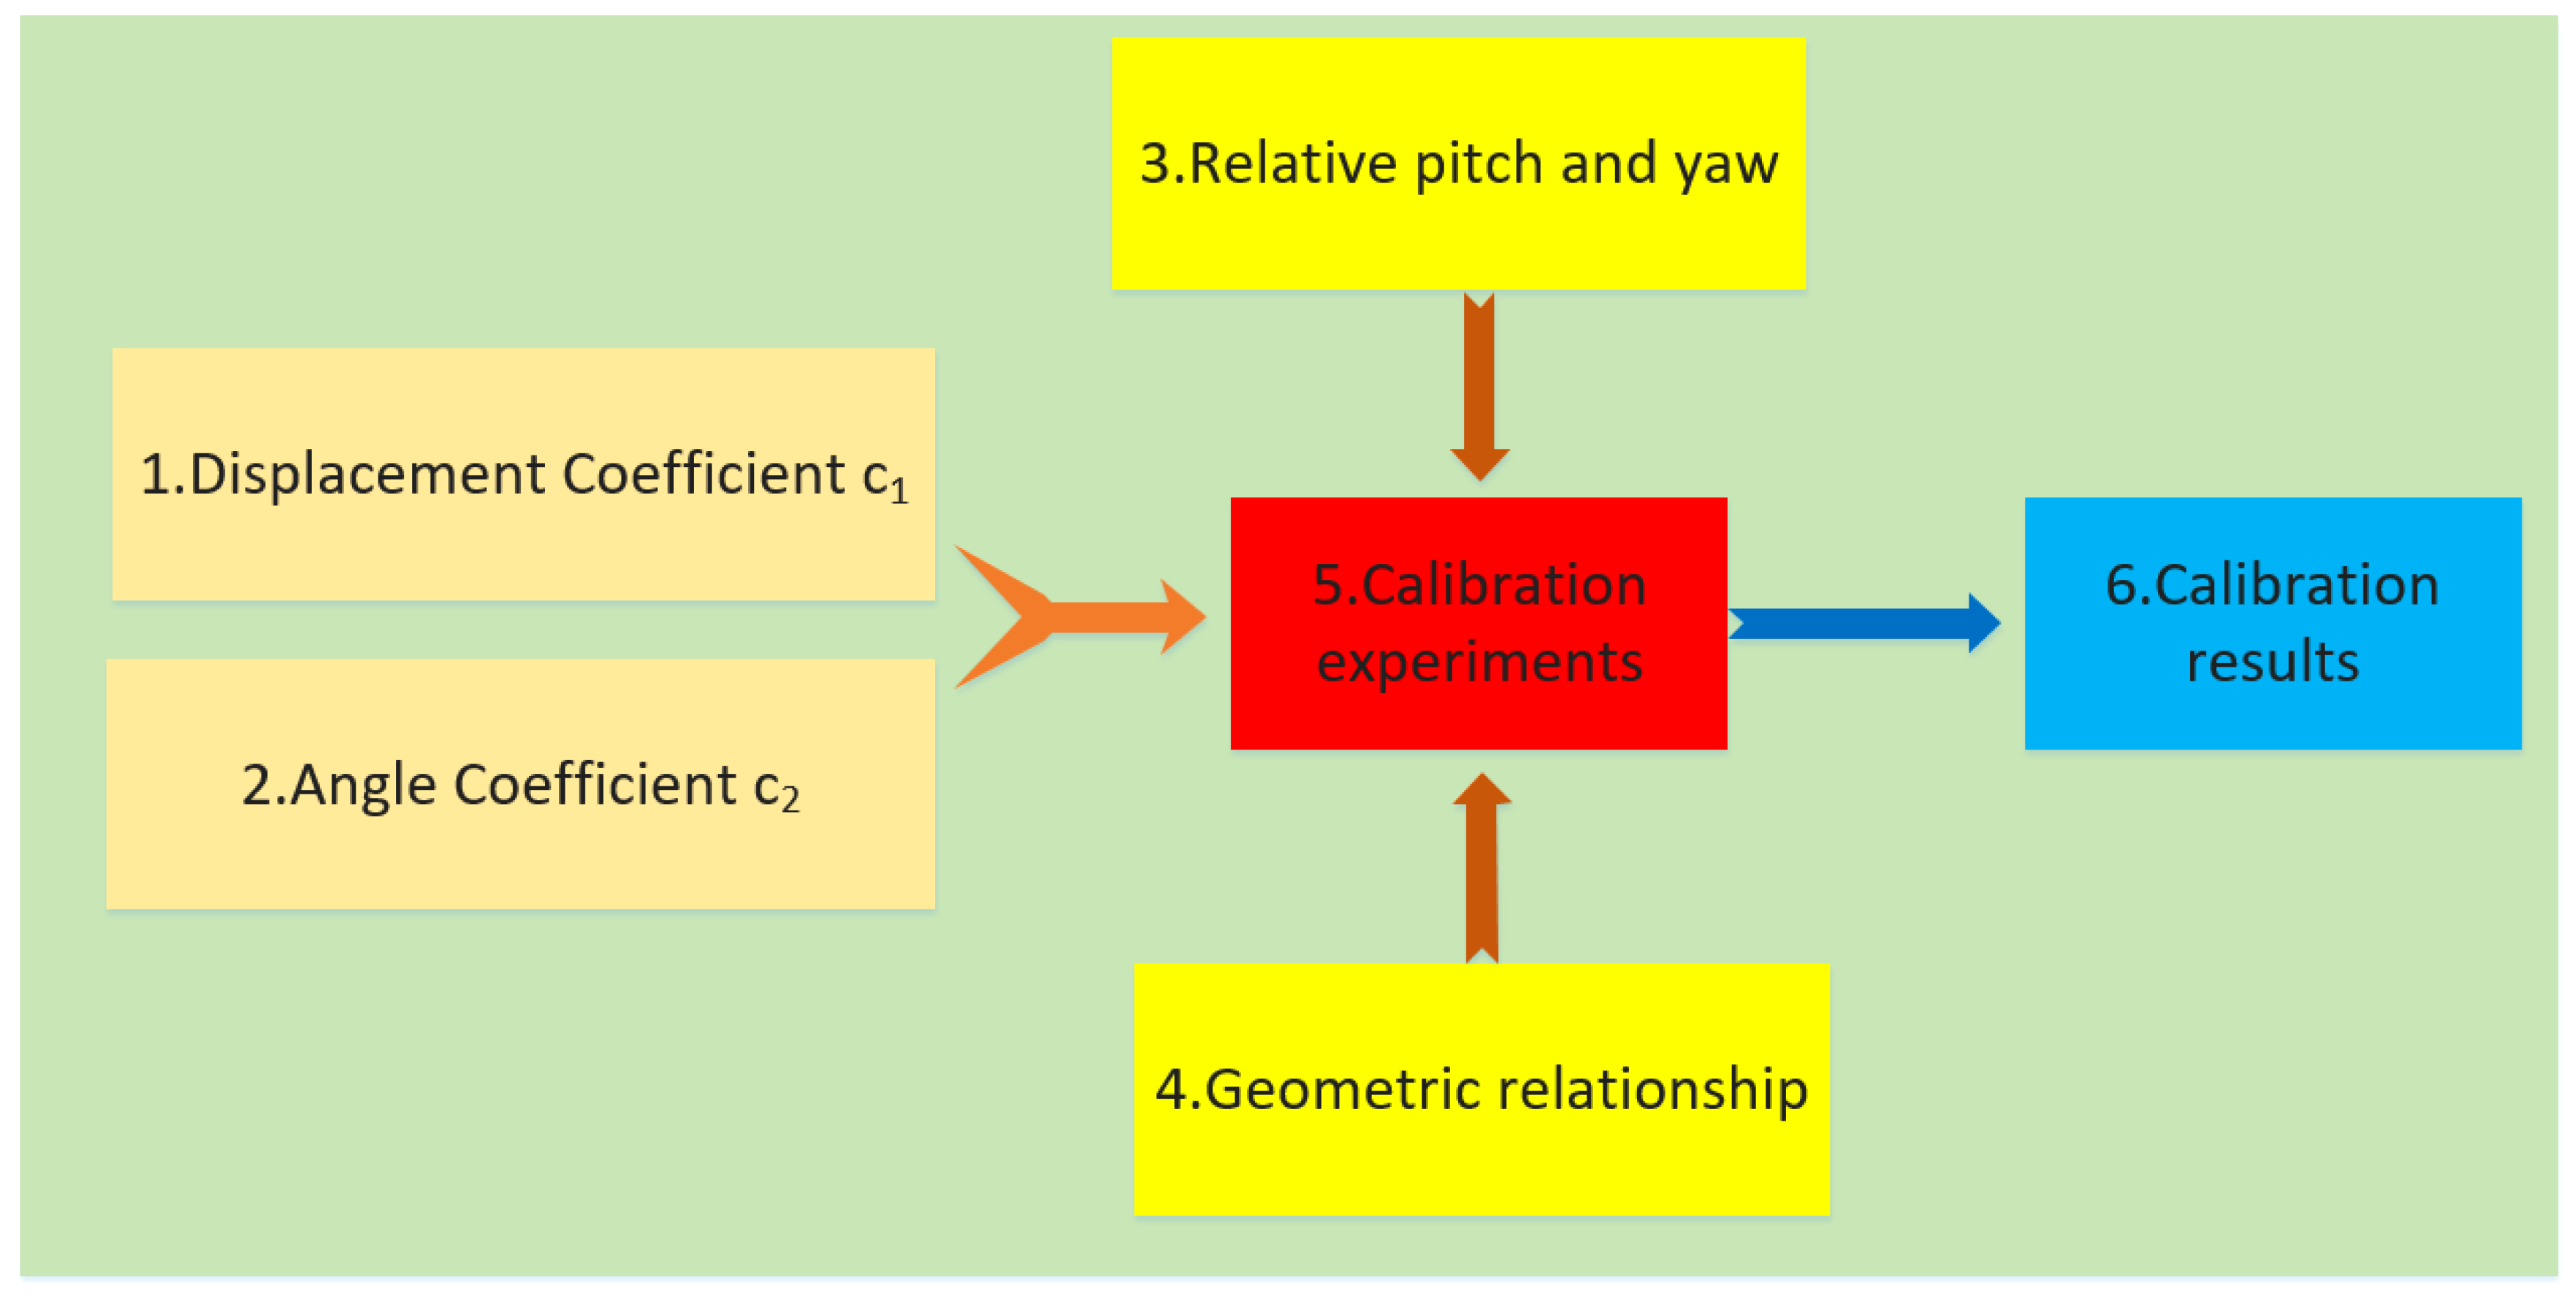
2.5. Calibration Procedure
3. Experimental Results
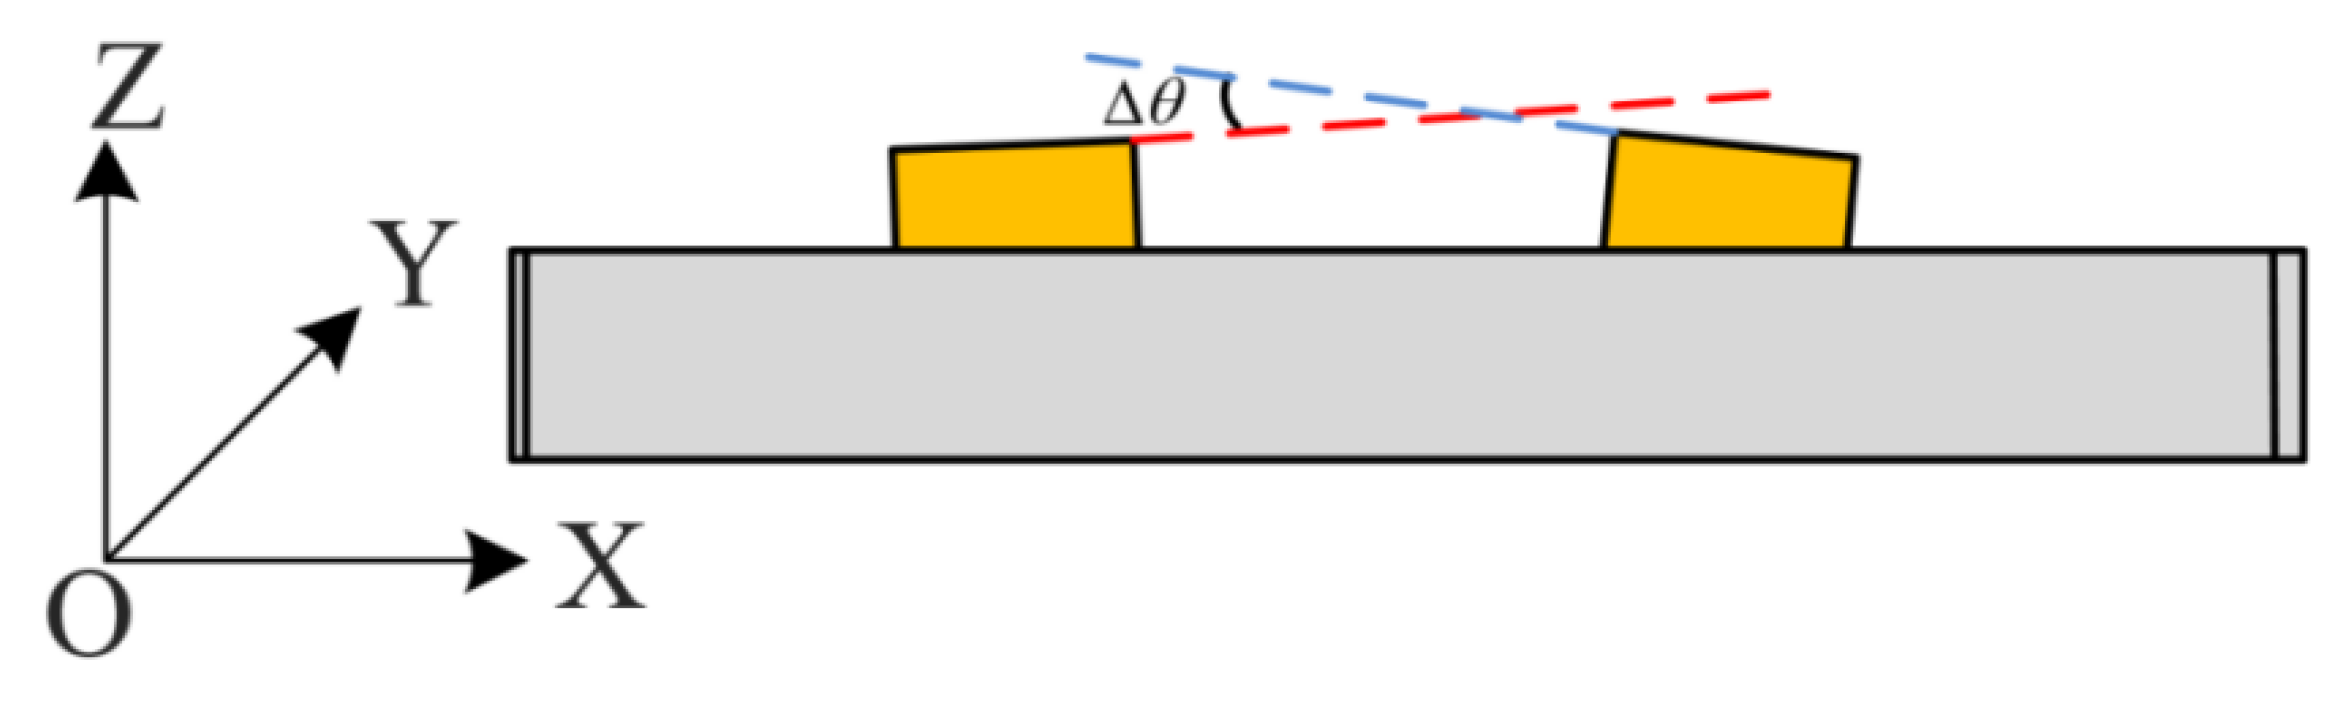
3.1. Relative Pitch and Yaw
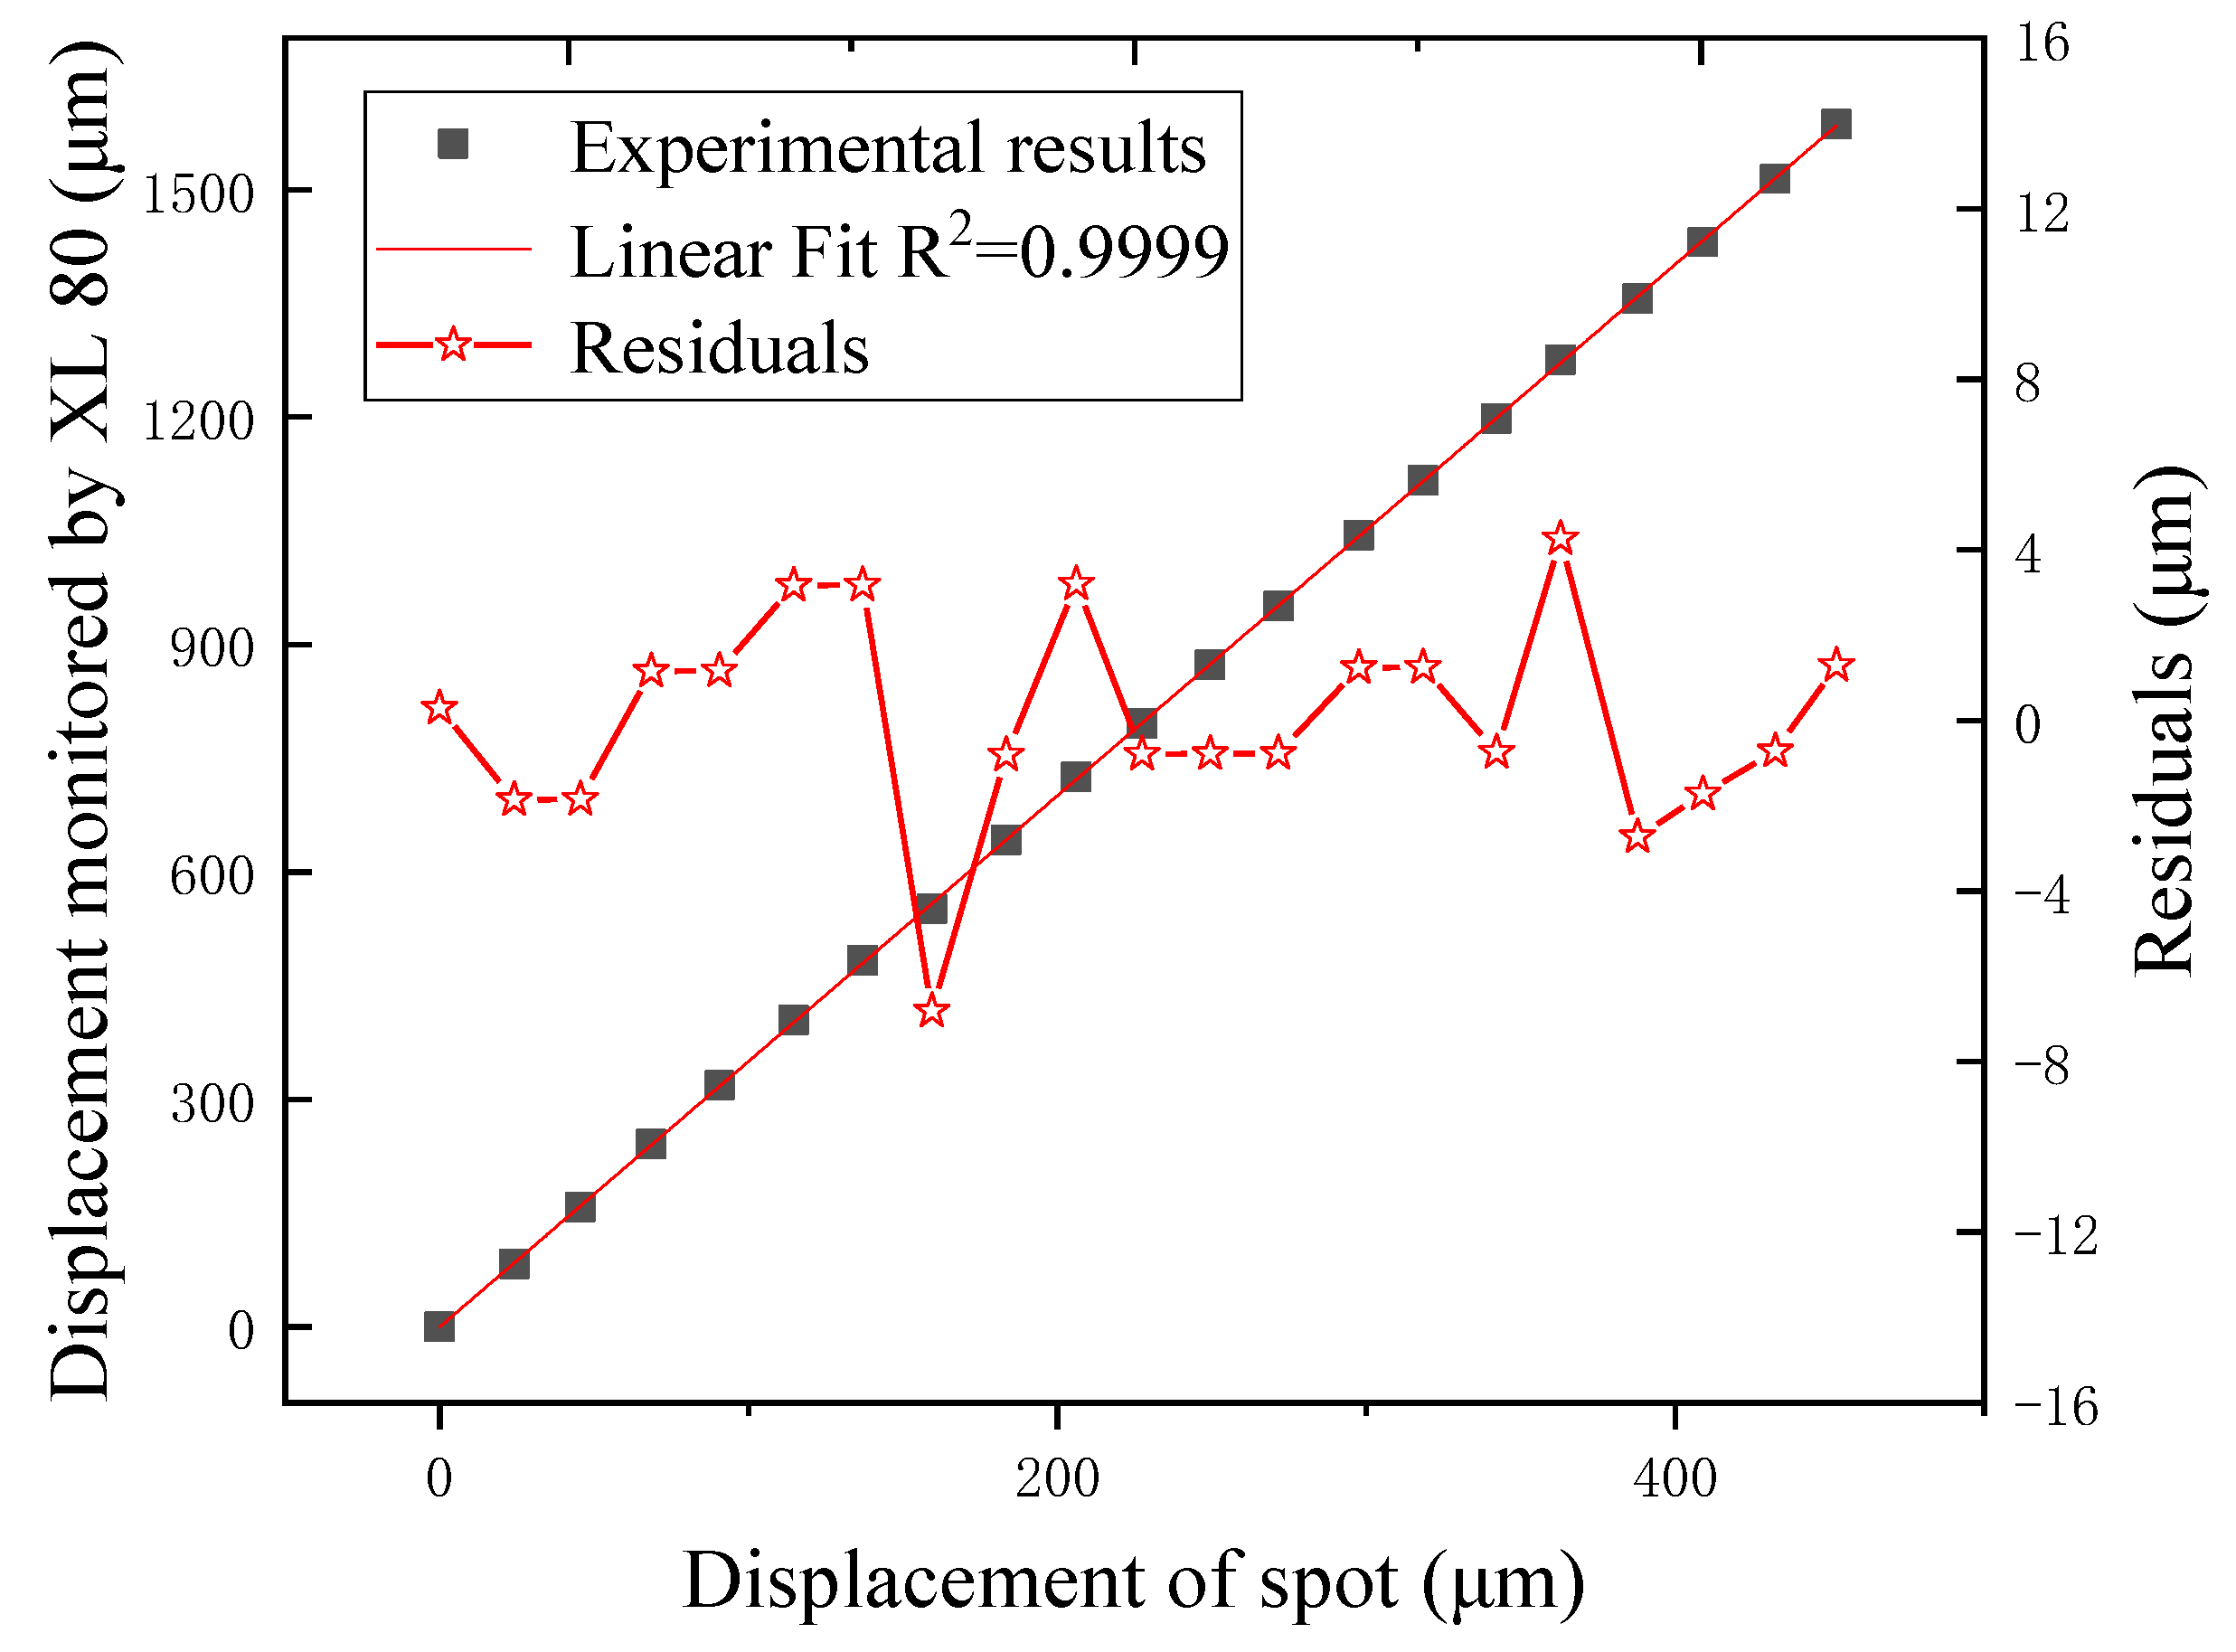
3.2. Calibration Results
3.3. Comparison Experiment
4. Conclusions
Author Contributions
Funding
Conflicts of Interest
References
- GhazaI, N.; Ebrahim, G.-Z.; Antoine, L.; Mohamad, S. Smart Cell Culture Monitoring and Drug Test Platform Using CCD Capacitive Sensor Array. IEEE Trans. Biomed. Eng. 2019, 66, 1094–1104. [Google Scholar]
- Jie, H.; Hanmin, P.; Ting, M.; Tingyu, L.; Mingsen, G.; Penghui, L.; Yalei, B.; Chunsheng, Z. An airflow sensor array based on polyvinylidene fluoride cantilevers for synchronously measuring airflow direction and velocity. Flow Meas. Instrum. 2019, 67, 166–175. [Google Scholar]
- Kaisti, M.; Panula, T.; Leppänen, J.; Punkkinen, R.; Tadi, M.J.; Vasankari, T.; Meriheinä, U. Clinical assessment of a non-invasive wearable MEMS pressure sensor array for monitoring of arterial pulse waveform, heart rate and detection of atrial fibrillation. NPJ Digit. Med. 2019, 39, 1–10. [Google Scholar] [CrossRef] [PubMed]
- Zhong, Y.; Xiang, J.; Chen, X.; Jiang, Y.; Pang, J. Multiple Signal Classification-Based Impact Localization in Composite Structures Using Optimized Ensemble Empirical Mode Decomposition. Appl. Sci. 2018, 8, 1447. [Google Scholar] [CrossRef]
- Cui, X.; Yan, Y.; Guo, M.; Han, X.; Hu, Y. Localization of CO2 Leakage from a Circular Hole on a Flat-Surface Structure Using a Circular Acoustic Emission Sensor Array. Sensors 2016, 16, 1951. [Google Scholar] [CrossRef] [PubMed]
- Chung, S.; Park, T.; Park, S.; Kim, J.; Park, S.; Son, D.; Cho, S. Colorimetric Sensor Array for White Wine Tasting. Sensors 2015, 15, 18197–18208. [Google Scholar] [CrossRef]
- Si, W.; Zhao, P.; Qu, Z. Two-Dimensional DOA and Polarization Estimation for a Mixture of Uncorrelated and Coherent Sources with Sparsely-Distributed Vector Sensor Array. Sensors 2016, 16, 789. [Google Scholar] [CrossRef]
- Li, R.; Li, Y.; Peng, L. An Electrical Capacitance Array for Imaging of Water Leakage inside Insulating Slabs with Porous Cells. Sensors 2019, 19, 2514. [Google Scholar] [CrossRef]
- Tan, X.; Zhang, J. Evaluation of Composite Wire Ropes Using Unsaturated Magnetic Excitation and Reconstruction Image with Super-Resolution. Appl. Sci. 2018, 8, 767. [Google Scholar] [CrossRef]
- Gao, W.; Araki, T.; Kiyono, S.; Okazaki, Y.; Yamanaka, M. Precision nano-fabrication and evaluation of a large area sinusoidal grid surface for a surface encoder. Precis. Eng. 2003, 27, 289–298. [Google Scholar] [CrossRef]
- Wu, H.; Duan, Q. Gas Void Fraction Measurement of Gas-Liquid Two-Phase CO2 Flow Using Laser Attenuation Technique. Sensors 2019, 19, 3178. [Google Scholar] [CrossRef] [PubMed]
- Zappa, D. Low-Power Detection of Food Preservatives by a Novel Nanowire-Based Sensor Array. Foods 2019, 8, 226. [Google Scholar] [CrossRef] [PubMed]
- Kekonen, A.; Bergelin, M.; Johansson, M.; Kumar Joon, N.; Bobacka, J.; Viik, J. Bioimpedance Sensor Array for Long-Term Monitoring of Wound Healing from Beneath the Primary Dressings and Controlled Formation of H2O2 Using Low-Intensity Direct Current. Sensors 2019, 19, 2505. [Google Scholar] [CrossRef] [PubMed]
- Ghasemi, F.; Hormozi-Nezhad, M.R. Determination and identification of nitroaromatic explosives by a double-emitter sensor array. Talanta 2019, 201, 230–236. [Google Scholar] [CrossRef] [PubMed]
- Zhang, G.X.; Zang, Y.F. A method for machine geometry calibration using 1-D ball array. CIRP Ann. 1991, 40, 519–522. [Google Scholar] [CrossRef]
- Ouyang, J.F.; Jawahir, I.S. Ball array calibration on a coordinate measuring machine using a gage block. Measurement 1995, 16, 219–229. [Google Scholar] [CrossRef]
- Anke, G.; Dirk, S.; Gert, G. Self-Calibration Method for a Ball Plate Artefact on a CMM. CIRP Ann. 2016, 65, 503–506. [Google Scholar]
- Tao, J.; Wang, Y.; Cai, B.; Wang, K. Camera Calibration with Phase-Shifting Wedge Grating Array. Appl. Sci. 2018, 8, 644. [Google Scholar] [CrossRef]
- Xu, Y.; Maeno, K.; Nagahara, H.; Taniguchi, R.I. Camera array calibration for light field acquisition. Front. Comput. Sci. 2015, 9, 691–702. [Google Scholar] [CrossRef]
- Zhang, X.; Liu, Q.; Yin, Z.; Zhao, R.; Lin, J. Research on In-situ Measurement System of Microstructure Array. Modul. Mach. Tool Autom. Manuf. Tech. 2018, 6, 93–97. [Google Scholar]
- Solórzano, A.; Rodriguez-Perez, R.; Padilla, M.; Graunke, T.; Fernandez, L.; Marco, S.; Fonollosa, J. Multi-unit calibration rejects inherent device variability of chemical sensor arrays. Sens. Actuators B Chem. 2018, 265, 142–154. [Google Scholar] [CrossRef]
- Sun, D.; Ding, J.; Zheng, C.; Huang, W. Array geometry calibration for underwater compact arrays. Appl. Acoust. 2019, 145, 374–384. [Google Scholar] [CrossRef]
- Zhai, Y.; Song, P.; Chen, X. A Fast Calibration Method for Photonic Mixer Device Solid-State Array Lidars. Sensors 2019, 19, 822. [Google Scholar] [CrossRef] [PubMed]
- Lv, Z.; Li, X.; Su, Z.; Zhang, D.; Yang, X.; Li, H.; Li, J.; Fang, F. A Novel 2D Micro-Displacement Measurement Method Based on the Elliptical Paraboloid. Appl. Sci. 2019, 9, 2517. [Google Scholar] [CrossRef]


| Elliptical Paraboloid | Relative Pitch Angle/Arcsec | Relative Yaw Angle/Arcsec |
|---|---|---|
| 1 | 0 | 0 |
| 2 | −149.8 | 103.9 |
| 3 | −81.7 | 124.3 |
| 4 | 176.7 | −71.5 |
| 5 | 186.5 | 155.8 |
| 6 | 82.7 | −34.0 |
| 7 | 107.1 | −92.2 |
| 8 | −44.1 | 166.7 |
| 9 | −175.4 | 185.7 |
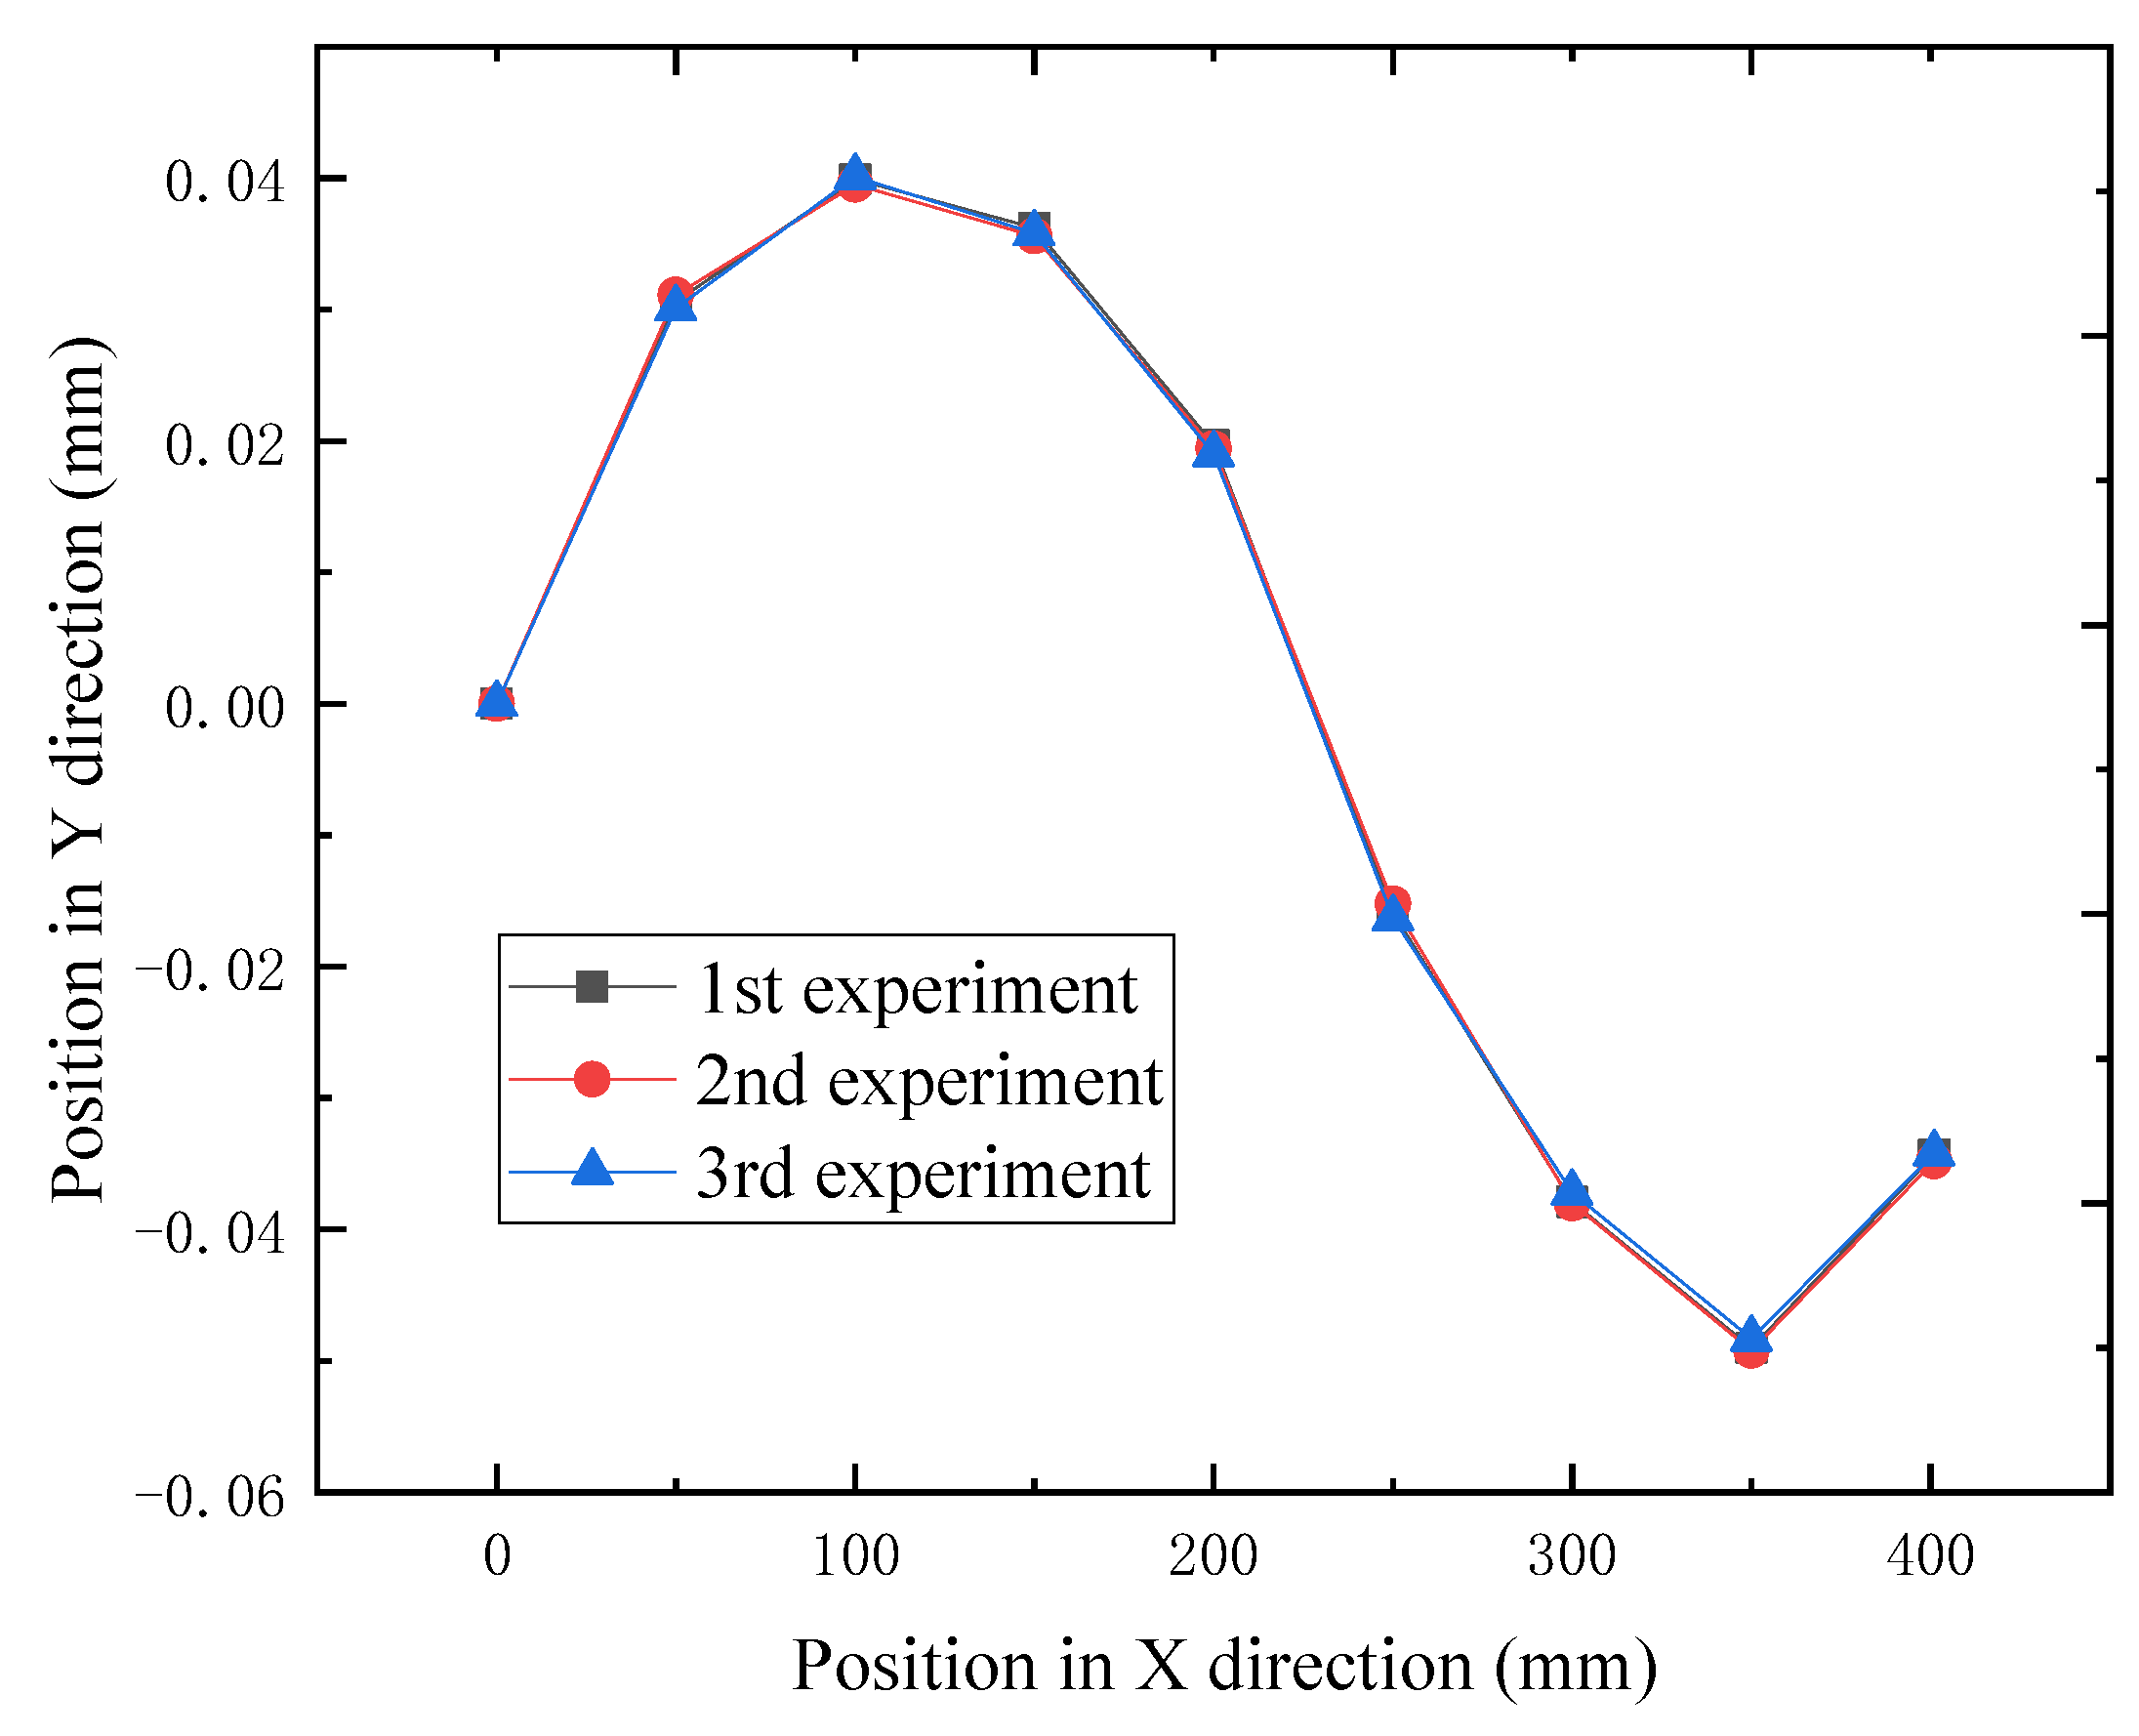
| Type | 1 | 2 | 3 | 4 | 5 | 6 | 7 | 8 | 9 |
|---|---|---|---|---|---|---|---|---|---|
| X/mm | 0 | 49.9681 | 100.0044 | 149.9427 | 199.9558 | 250.0217 | 300.0113 | 350.0063 | 400.0362 |
| Y/mm | 0 | 0.0306 | 0.0398 | 0.0359 | 0.0194 | −0.0158 | −0.0377 | 0.0488 | −0.0344 |
© 2019 by the authors. Licensee MDPI, Basel, Switzerland. This article is an open access article distributed under the terms and conditions of the Creative Commons Attribution (CC BY) license (http://creativecommons.org/licenses/by/4.0/).
Share and Cite
Lv, Z.; Su, Z.; Zhang, D.; Gao, L.; Yang, Z.; Fang, F.; Zhang, H.; Li, X. The Self-Calibration Method for the Vertex Distance of the Elliptical Paraboloid Array. Appl. Sci. 2019, 9, 3485. https://doi.org/10.3390/app9173485
Lv Z, Su Z, Zhang D, Gao L, Yang Z, Fang F, Zhang H, Li X. The Self-Calibration Method for the Vertex Distance of the Elliptical Paraboloid Array. Applied Sciences. 2019; 9(17):3485. https://doi.org/10.3390/app9173485
Chicago/Turabian StyleLv, Zekui, Zhikun Su, Dong Zhang, Lingyu Gao, Zhiming Yang, Fengzhou Fang, Haitao Zhang, and Xinghua Li. 2019. "The Self-Calibration Method for the Vertex Distance of the Elliptical Paraboloid Array" Applied Sciences 9, no. 17: 3485. https://doi.org/10.3390/app9173485
APA StyleLv, Z., Su, Z., Zhang, D., Gao, L., Yang, Z., Fang, F., Zhang, H., & Li, X. (2019). The Self-Calibration Method for the Vertex Distance of the Elliptical Paraboloid Array. Applied Sciences, 9(17), 3485. https://doi.org/10.3390/app9173485