Article

Corrosion-Fatigue Evaluation of Uncoated Weathering Steel Bridges

Department of Bridge Engineering, School of Civil Engineering, Southwest Jiaotong University, Chengdu 610031, China
*
Author to whom correspondence should be addressed.
Appl. Sci. 2019, 9(17), 3461; https://doi.org/10.3390/app9173461
Submission received: 19 July 2019 / Revised: 11 August 2019 / Accepted: 19 August 2019 / Published: 22 August 2019
(This article belongs to the Special Issue Extreme Sciences and Engineering)

Abstract

:

Featured Application

The new findings highlight the enhancement in corrosion-fatigue performance of steel bridges by using the uncoated weathering steel. Besides, an innovative approach has been established to simulate the corrosion-fatigue process in uncoated weathering steel bridges, providing deep insights into the service life of the bridges. The approaches suggested in the article can be used (not limited to) as a reference for the research and design of uncoated weathering steel bridges.

Abstract

Uncoated weathering steel (UWS) bridges have been extensively used to reduce the lifecycle cost since they are maintenance-free and eco-friendly. However, the fatigue issue becomes significant in UWS bridges due to the intended corrosion process utilized to form the corrodent-proof rust layer instead of the coating process. In this paper, an innovative model is proposed to simulate the corrosion-fatigue (C-F) process in UWS bridges. Generally, the C-F process could be considered as two relatively independent stages in a time series, including the pitting process of flaw-initiation and the fatigue crack propagation of the critical pitting flaw. In the proposed C-F model, Faraday’s law has been employed at the critical flaw-initiation stage to describe the pitting process, in which the pitting current is applied to reflect the pitting rate in different corrosive environments. At the crack propagation stage, the influence of pitting corrosion is so small that it can be safely ignored. In simulating the crack propagation stage, the advanced NASGRO equation proposed by the NASA is employed instead of the classic Paris’ law, in which a modified fatigue limit is adopted. The fatigue limit is then used to determine the critical size of pitting flaws, above which the fatigue effect joins as a parallel driving force in crack propagation. The model is then validated through the experimental data from published articles at the initiation stage as well as the whole C-F process. Two types of structural steel, i.e., HPS 70W and 14MnNbq steel, have been selected to carry out a case study. The result shows that the C-F life can be notably prolonged in the HPS 70W due to the enhancement in fatigue strength and corrosion resistance. Besides, a sensitivity analysis has been made on the crucial parameters, including the stress range, stress ratio, corrosive environment and average daily truck traffic (ADTT). The result has revealed the different influence of the above parameters on the initiation life and propagation life.

1. Introduction

Weathering steel has been widely used in bridge engineering in the U.S., Europe and Japan since half a century ago. Due to the excellent corrosion resistance of weathering steel, it can be applied in the corrosive environment without coating. Various grades of weathering steel have already been incorporated in the codes of practice, such as American grades A242, A588, A606 and A709, Japanese grades JIS SMA and the British S355J2G1W [1,2]. Since 2017, over 50% of highway steel bridges in the US were constructed with weathering steel. In Japan, 75% of the weathering steels were used in bridge engineering in 2008, and 80% of newly built steel bridges were constructed with weathering steel in the past 25 years [3,4]. In China, the first weathering steel bridge was constructed in 1991 [5], followed by the massive application in the 2010s.
A great advantage of uncoated weathering steel (UWS) bridges is the reduction of cost. Dolling et al. [1] claimed that approximately 5% of the initial cost and far in excess of the 5% on capital costs could be saved. Moreover, Horii et al. [6] indicated that weathering steels could reduce about 25% life cycle cost according to recently under construction bridges. In addition, Dolling also listed the environmental benefits of UWS bridges arising from avoiding painting [1]. It is also worth noting that the fire incident has now become a very critical issue in steel bridges since it can lead to extremely detrimental consequences [7]. Wan et al. [8] claimed that the chemical element Mo could notably improve the fire-resistant of steel. Since the element Mo is generally included in making the high-performance weathering steel, a much better fire-resistant performance can be expected when compared with the common carbon steel. However, further investigations are still required to reveal the actual fire resistance of weathering steel.
In steel bridges, the fatigue issue is of particular concern due to the persistent loading-and-unloading process by the vehicles. Similar to the degradation of steel bridges from the fire hazard [7], the corrosion effect should be considered into the design. Nevertheless, the fatigue issue of steel bridges will be further accelerated when exposed to the corrosive environment. The corrosion process will lead to geometric irregularities in components, escalating the local stress concentration, which serves the fatigue issue. In UWS bridges, the problem is even more serious: The fatigue crack is hard to be detected due to the rust layer used to proof corrodents. Thus, it is crucial to take into consideration the coupling effect of corrosion-fatigue (C-F) on the service life of UWS bridges.
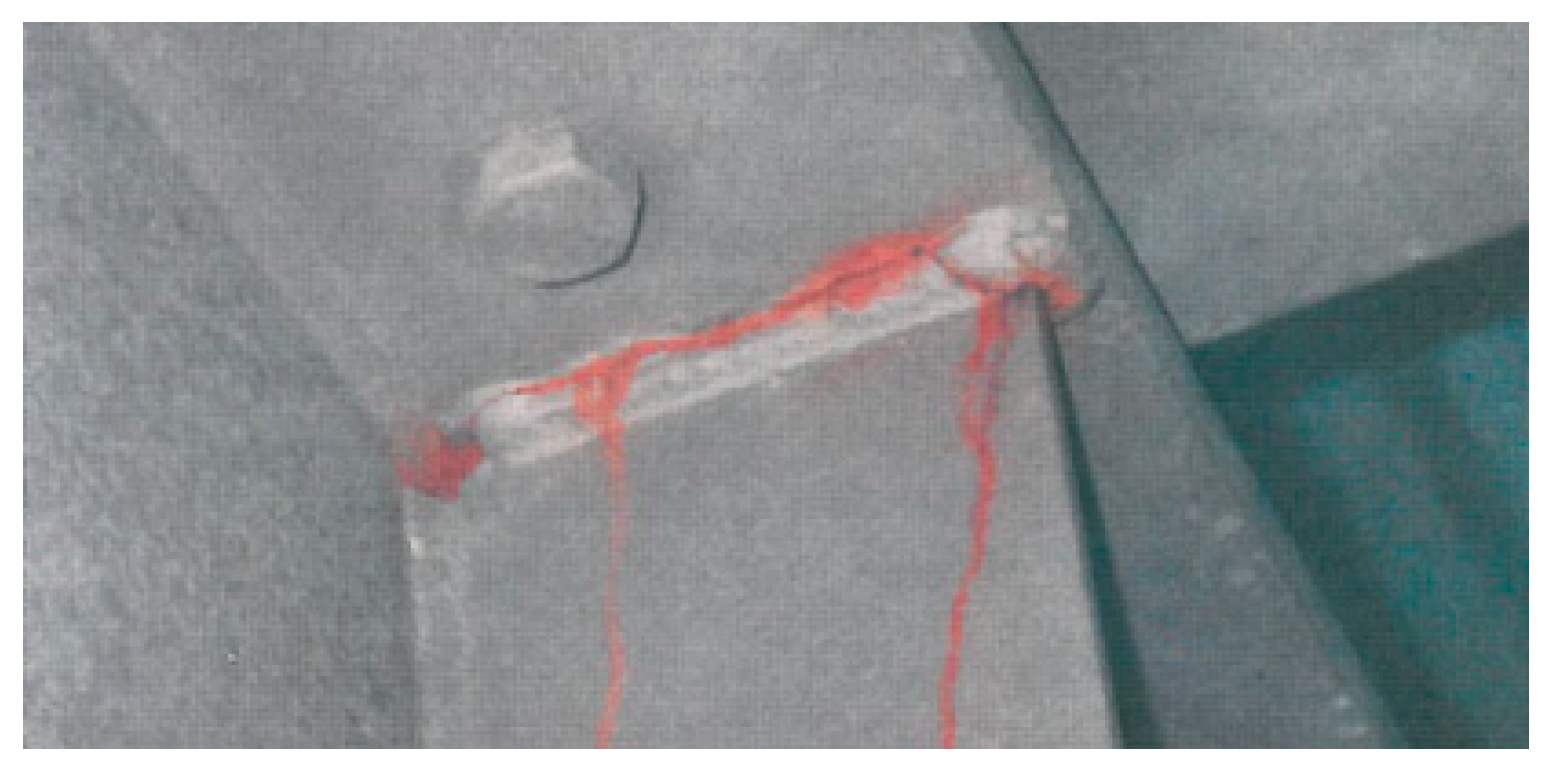
Figure 1 shows a typical fatigue crack in a UWS bridge, which is identified by the dye penetration check [9]. It is worth stating that, this type of crack is very difficult to be detected using common approaches, especially in its early stage. Due to the difficulty in detection, a considerable number of unrecognized fatigue cracks might exist in the aged UWS bridges, imposing high risks on the durability or even safety of the bridge consequently. Therefore, a well-established model is urgently required for the evaluation on the service life of UWS bridges considering the C-F process.
The aim of the present study is to provide a deep insight into the corrosion-fatigue (C-F) performance of UWS bridges, which can serve as a useful guidance for design and maintenance of this type of bridges. On this end, an innovative deterioration model has been established to simulate the coupled C-F process. In the model, the whole C-F process has been divided into two interrelated stages, i.e., the corrosion-critical stage and fatigue-critical stage. In the study, the C-F process is assumed to be started with the pitting corrosion, in which the crack-like pitting flaw will initiate [10]. In modeling the pitting corrosion, the electrochemistry theory is applied, and the pitting current is utilized as the index reflecting the influence of different environments. Meanwhile, the critical pitting flaw size is used to connect the two stages smoothly, beyond which the fatigue process can come into effect as a driving force in crack propagation. In simulating the fatigue-induced crack propagation, the fracture mechanics-based NASGRO equation, which is proposed by the NASA [11,12], is applied to consider the propagation behavior of short cracks. In addition, a competition-based criterion has been introduced, in which the corrosion process and fatigue process are competing in terms of the propagation rate and the C-F process is controlled by the one with the higher rate. Based on the above method, the service life can be predicted at the two stages, respectively. Through combining the life at the two stages, the whole service life under the C-F process can be solved. The proposed model has been carefully verified through the experimental data collected from several publications. With the validated model, sensitivity analysis has been made on the crucial parameters, including the stress range, stress ratio, corrosive environment and average daily truck traffic (ADTT). The result reveals the influence of different factors on the C-F life of UWS bridges. Meanwhile, the proposed method can be referred to in the fatigue design of UWS bridges. Moreover, this study also highlights the advantage of UWS bridges in service life under corrosion and fatigue when compared with the traditional steel bridges.

2. Literature Review

Extensive efforts were made by researchers on the C-F process of weathering steel. Hyun et al. [13] predicted the fatigue life of the aged car-body. In the analysis, the effect of corrosion on the car-body was simulated by proportionally reducing the plate thickness with the time. As a result, when considering corrosion, the fatigue life of the car-body was decreased by 20% and 40% for the 23-years old car and 40-years old car, respectively. Ludvík Kunz et al. [14] studied the fatigue performance of weathering steel Atmofix 52 in corroded and non-corroded situations. The result was expressed by the fatigue strength at 1 × 10⁷ cycles under two stress ratios, i.e., R = −1 and R = 0. When the stress ratio equals to −1, the fatigue strength of non-corroded steel and corroded steel was 240 MPa and 140 MPa, respectively. Under the stress ratio of zero, the two values were respectively 190 MPa and 120 MPa. Overall, the fatigue strength of corroded steel could be significantly lower than that of uncorroded steel. Albrecht et al. [15] investigated the fatigue performance of weathering steel A588 in two corrosive environments, including pure water and salt spray. The result indicated a significant increase in the fatigue notched factor, which reflects the degradation in fatigue strength. According to the result, the fatigue notched factors of sheltered welded steel beam were 1.52 and 3.07 in pure water and salt spray, respectively. At the same time, the fatigue notched factors of the sheltered plate steel beam were respectively 2.56 and 3.01 in pure water and salt spray. Several similar studies also demonstrated the degradation in fatigue performance under the corrosion, especially in the chlorine-rich environment [10,16]. Zampieri [17] studied the fatigue strength of bolted connections, which indicates that corrosion can influence the fatigue life of the joint. Moreover, extended studies were done by Zampieri et al. [18,19] that showed the degradation of the corroded bolted joint due to pitting corrosion. Besides, relevant studies suggested that the pitting flaw initiated by corrosion could be regarded as the source of fatigue cracking [14,16,20]. However, since the C-F process is a highly complicated issue, few models can be yet found on the C-F issue of steel bridges.
As a matter of fact, the most reliable way to investigate the C-F process is the fatigue test under the corrosive environment. However, the corrosion is such a long-term process that it is difficult to be incorporated in the fatigue test employing a relatively high loading frequency (from 5 to 50 Hz). Alternatively, pre-corroded specimens were commonly used in the fatigue test [7,10]. Garbatov et al. [21] made specimens with corroded ship building steel in seawater, and the result showed that the fatigue strength decreases from FAT 86 to 64.95 MPa. In this case, the whole C-F process cannot be revealed comprehensively since the two interactive processes are artificially separated in the test. Generally, Kondo [16] claimed that the pitting corrosion is believed as the dominating effect at the early stage of the C-F process. On this end, the electrochemistry theory has been applied to evaluate the pitting corrosion process, which has been validated by the experimental data on aluminum alloy, stainless steel and crude steel [22,23]. Under this content, the electrochemistry theory is employed to describe the time-dependent development of pitting flaws, which can be regarded as the initial flaw in the crack propagation. Nevertheless, it is still difficult to find a way to couple the two processes systematically. Thus, efforts are now gradually made to combine the electrochemistry theory and fracture mechanics in describing the C-F process of metal materials [10,23,24]. For instance, according to the article [10], under the pitting corrosion the initial flaws will be generated on the exposed material surface at the beginning of the C-F process. Then, when the stress intensity factor (SIF) reaches the fatigue limit, the process will be dominated by the fatigue-induced crack propagation. Similarly, in the article [24], the corrosion-fatigue performance of carbon steel in the corrosive solution was experimentally studied. In the test, the cyclic bending loads were applied to the specimens. According to the study, the C-F process can be divided into the pitting growth stage, small crack growth stage and long crack growth stage. Besides, the pitting growth stage can be evaluated by Faraday’s law, while the Paris law can be utilized to evaluate the small crack growth stage and long crack growth stage. In addition, it is also claimed in the study that the moment when the SIF reached the fatigue limit can be considered as the end of the pitting growth stage.
Some recent studies worked on the C-F issue on steel. Zampieri et al. [19] studied the fatigue life of corroded bolted connections by a certain scale of tests and numerical analyses, in which pitting corrosion was taken into consideration. In this study, the Smith–Watson–Topper strain-life method was utilized to evaluate the fatigue life of corroded joints. Meanwhile, the result indicated that corrosion was not the only influence factor on the fatigue life of bolted connections. Xu et al. [20] also studied the fatigue behavior of corroded steel, which indicated that the fatigue life of corroded steel decreased rapidly due to the increasing rough surface. Peng et al. [25,26] combined the uniform corrosion and NASGRO equation to determine the remaining life of structures, the result indicated that the C-F life of the structure was decreased with the assumed initial flaw size increasing.

3. Corrosion Pitting Evaluation

3.1. Mechanism of Pitting Corrosion

In UWS bridges, corrosion is always a big challenge to durability [27]. Generally, the corrosion process can be classified into two types, i.e., uniform corrosion and pitting corrosion. The two types of corrosion usually occur simultaneously in steel bridges, both of which can degrade the performance of the bridge. Under the uniform corrosion, the thickness of structural members will be reduced with time, which raises the stress level in the members. However, the effect of uniform corrosion in UWS bridges can be almost ignored due to the corrodent-proof rust film.
Thus, the pitting corrosion is of particular concerns in UWS bridges. The pitting corrosion is an autocatalytic process inducing local corrosion interspersing on the material surface. The interspersing could be regarded as a kind of local irregularity, which in turns escalates the local stress concentration. Generally, the pitting corrosion is believed as the most detrimental form of corrosion, which could even cause structural failure [28]. In a C-F analysis, pitting flaw can be regarded as an equivalent initial flaw, from which the final critical fatigue crack can be formed under cyclic stress [29,30].
Based on the mechanism of corrosion, Zaya [31] divided the post-rust pitting corrosion into four different stages as the following: (1) The rupture of the stable rust layer; (2) the achievement of the critical condition that the pit begins to grow; (3) the dissolution of the substrate and (4) the formation of visible pitting irregularity.
Referring to the above classification, the pitting process in the UWS bridges can be defined in a similar way, as shown in Figure 2. It is shown that the rupture of the protective film occurs at first, followed by the initiation of the pitting flaw with weakened protective film. Finally, the pitting flaw grows without a protective film. However, some researchers [32,33,34] indicated that the rupture of the protective film occurred very rapidly. Besides, Melchers reported that the initiation of the pitting process only costs as short as several microseconds [32]. On this end, it is assumed in the following analysis that the C-F life is roughly equal to the time cost by the latter two stages, i.e., the initiation of pitting flaws and the propagation of the flaw.
The pitting corrosion process can be accelerated by both the mechanical (e.g., cyclic loads) and chemical factors (e.g., corrosive environment), as suggested by studies [23,35]. In the presence of cyclic loads, the protective film is prone to rupture because of the reduced strength. At the same time, the pitting corrosion rate could be notably increased under the high-level stress range induced by the cyclic loads [23,35]. Besides the mechanical factor, the pitting process can also escalate the corrosive environment, especially the concentration of chlorine (Cl). Albercht et al. [36] claimed that pitting flaw could appear to the surface of the steel in high Cl ions concentration. For instance, the pitting corrosion rate of bridges in the marine environment, where the Cl ions concentration is high, is significantly higher than those in the non-marine environment. Meanwhile, the structural member will experience serious pitting corrosion when located in the sheltered position of UWS bridges, since the Cl ions attached on the surface cannot be washed directly by the rain [37].

3.2. Proposed Model for Pitting Corrosion

Kondo [16] proposed that the pitting flaw depth has a power relation with the time based on the test data, in which the power index is 1/3. The similar relation is also reflected by the well-known Faraday’s law established through electrochemistry [38,39], as shown in Equation (1):
d V d t = M I p n F ρ ,
where V is the volume of the pit; t is the corrosion time; M is the atomic mass of the material; n is the number of electrons released during corrosion of the metal; F is the Faraday constant; ρ is the density of the material and I p is the pitting current related to the corrosive environment.
The pitting current could be solved using Equation (2):
I p = I p 0 exp ( Δ H R T ) ,
where I p 0 is the pitting current coefficient; R is the universal gas constant; T is the absolute temperature and Δ H is the activation enthalpy.
Obviously, the pitting volume is a natural index describing the degree of pitting corrosion. Thus, as shown in Equations (1) and (2), the degree is determined by factors such as the time exposed to corrosion, corrosive environment, temperature and activation enthalpy. In this study, the pitting flaw is idealized as a semi-ellipsoid with the round projection on the material surface, as a common practice [10]. The pitting volume could be calculated as shown in Equation (3):
V = 2 3 π a b 2 ,
where a is the pitting depth and b is the radius of the round on the project surface.
Since the pitting depth is believed as the major index reflecting the pitting process [28], it can be solved by combining Equations (1) and (3), as shown in Equation (4):
a = B m a s p 2 / 3 I p 1 / 3 t 1 / 3 ,
where m a s p is the aspect ratio of the pitting flaw lateral section, i.e., a / b ; B is a material-related constant and t stands for the time exposed to corrosion.
Studies show that the aspect ratio of pitting flaws is close to 1.0 [10,40]. On this end, the aspect ratio in this study was determined as 1.0. Meanwhile, the constant B can be determined by the aforementioned material properties, as shown in Equation (5):
B = 3 M 2 π n F ρ 3 ,
where the parameters could be applied as M = 56 × 10−3 kg/mol, n = 2, F = 96,500 C/mol and ρ = 7850 kg/m3, respectively.

3.3. Degree of Pitting Corrosion

It is important to find an index reflecting the corrosive environment. On this end, the pitting current I p could be utilized since it only dependents on the corrosive environment. Thus, the pitting current has been explicitly expressed by rewriting Equation (4), as shown in Equation (6):
I p = a 3 t 3 B 3 m a s p 2 .
The code ISO 9223 [41] classified the corrosive environment into six categories, named C1, C2, C3, C4, C5 and CX. A series of experiments has been carried out on the corrosion of weathering steel at various places representing different corrosive environment categories in China [42]. Five key indices are adopted to reflect various corrosive environments, and the value of each index corresponding to five corrosive environment categories are statistically obtained based on 8 years of data (from 2006 to 2014), as listed in Table 1.
The pitting current in Table 1 is plotted against the corrosivity category in Figure 3, along with a brief description of the geographic feature, i.e., the marine or non-marine. The following letters “-M” and “-A” stand for the maximal and average value of pitting current, respectively.
It can be observed from Figure 3 that the corrosivity category was directly proportional to the pitting current. Meanwhile, the result also indicates that the average pitting current was remarkably higher in the marine location than in the non-marine location, i.e., 3.38–5.92 times higher. Besides, the ratio of the max value to average value was highly scattered in different places, ranging from 53.6%–700%. It is worth noting that, the most critical place Jiangjin (C5) was not in the marine location. However, this place is a historic industrial area with heavy pollution of sulfur dioxide (SO2), which accelerates the corrosion significantly. In sum, the rate of pitting corrosion was dependent on both the corrosivity category and chemical factor, while the latter could have a larger influence.

4. Model of Corrosion-Fatigue

4.1. Corrosion-Fatigue Progress

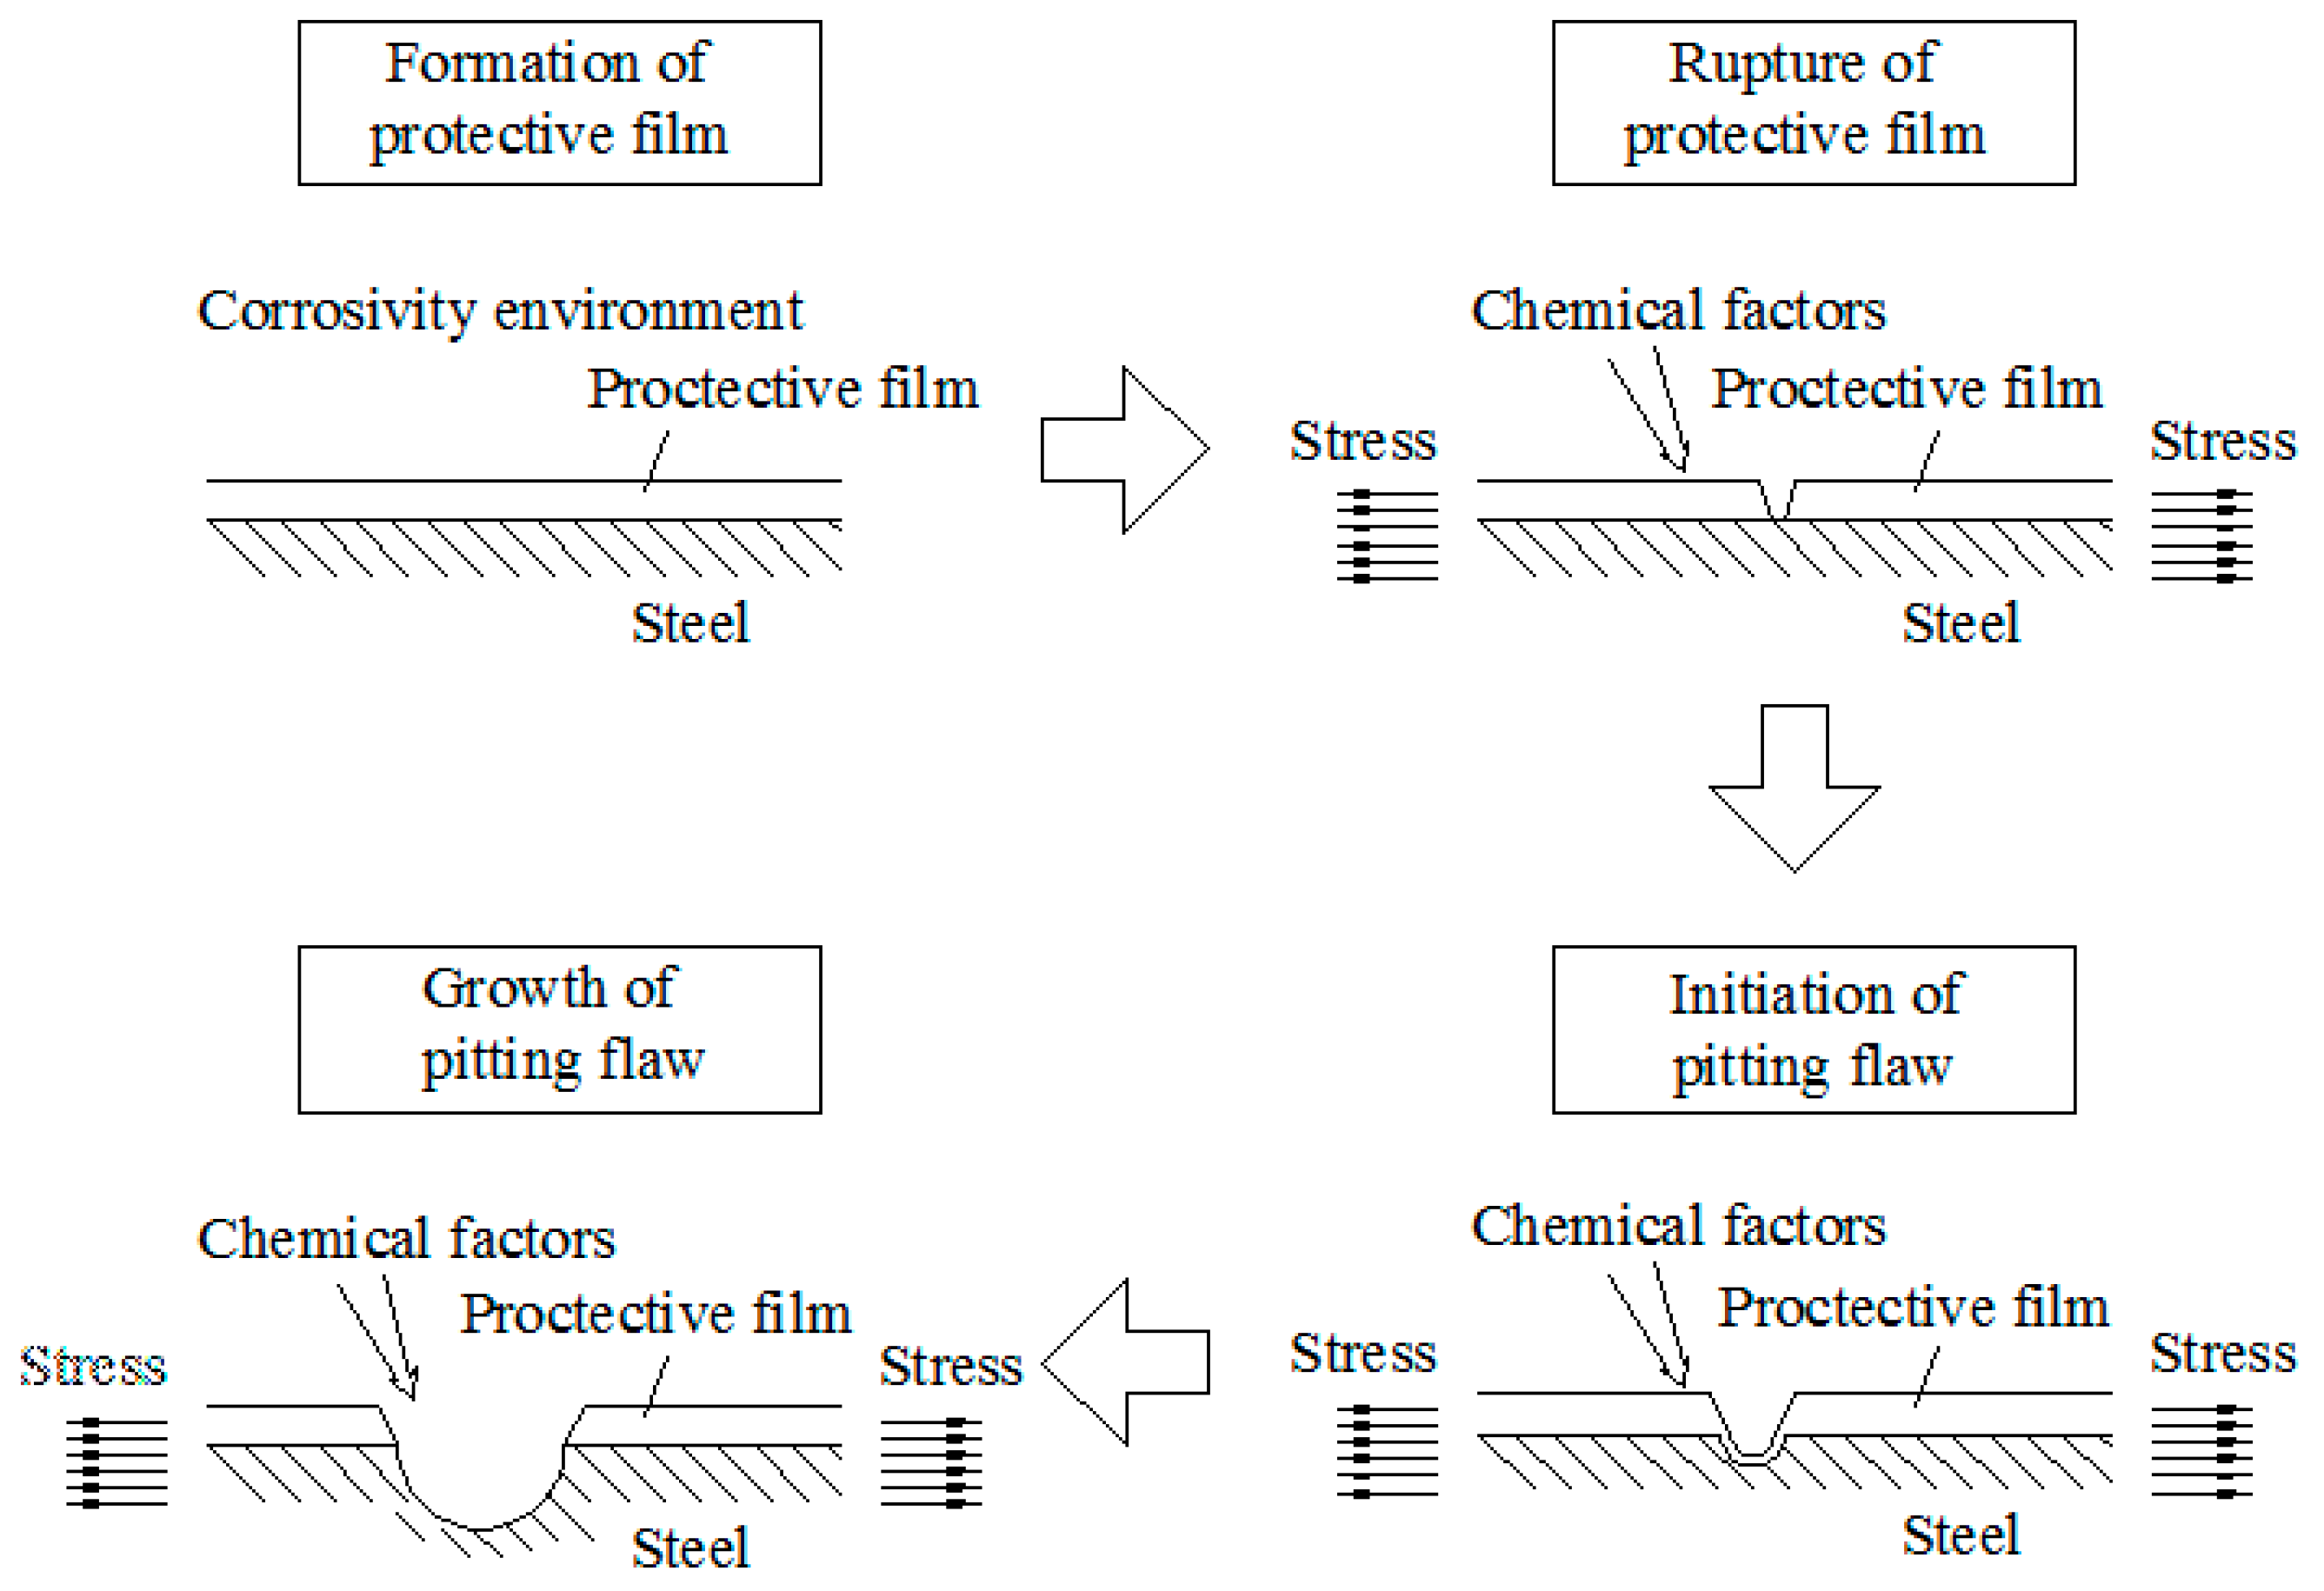
Since UWS bridges are exposed to the corrosion and fatigue action simultaneously, it is critical to incorporate the coupling effect of the two processes in solving the service life. At the early stage, pitting flaws will be generated on the surface of components by the corrosion. The size of these flaws increases with the time, as suggested by the Faraday’s law [22,39]. Meanwhile, the pitting process could be further escalated by the load-induced stress range [23,35]. Once the pitting flaw reaches the critical size, the fatigue process becomes the major driving force in the crack propagation while the chemical effect could be ignored [11]. Generally, the range of SIF could be used to determine the propagation rate of cracks [43]. Meanwhile, failure of members could be assumed when the crack penetrated through the thickness of any plate in the member. Based on the above analysis, C-F life can be divided into two stages, the C-F crack initiation and the C-F crack propagation, which is also suggested in [44]. 
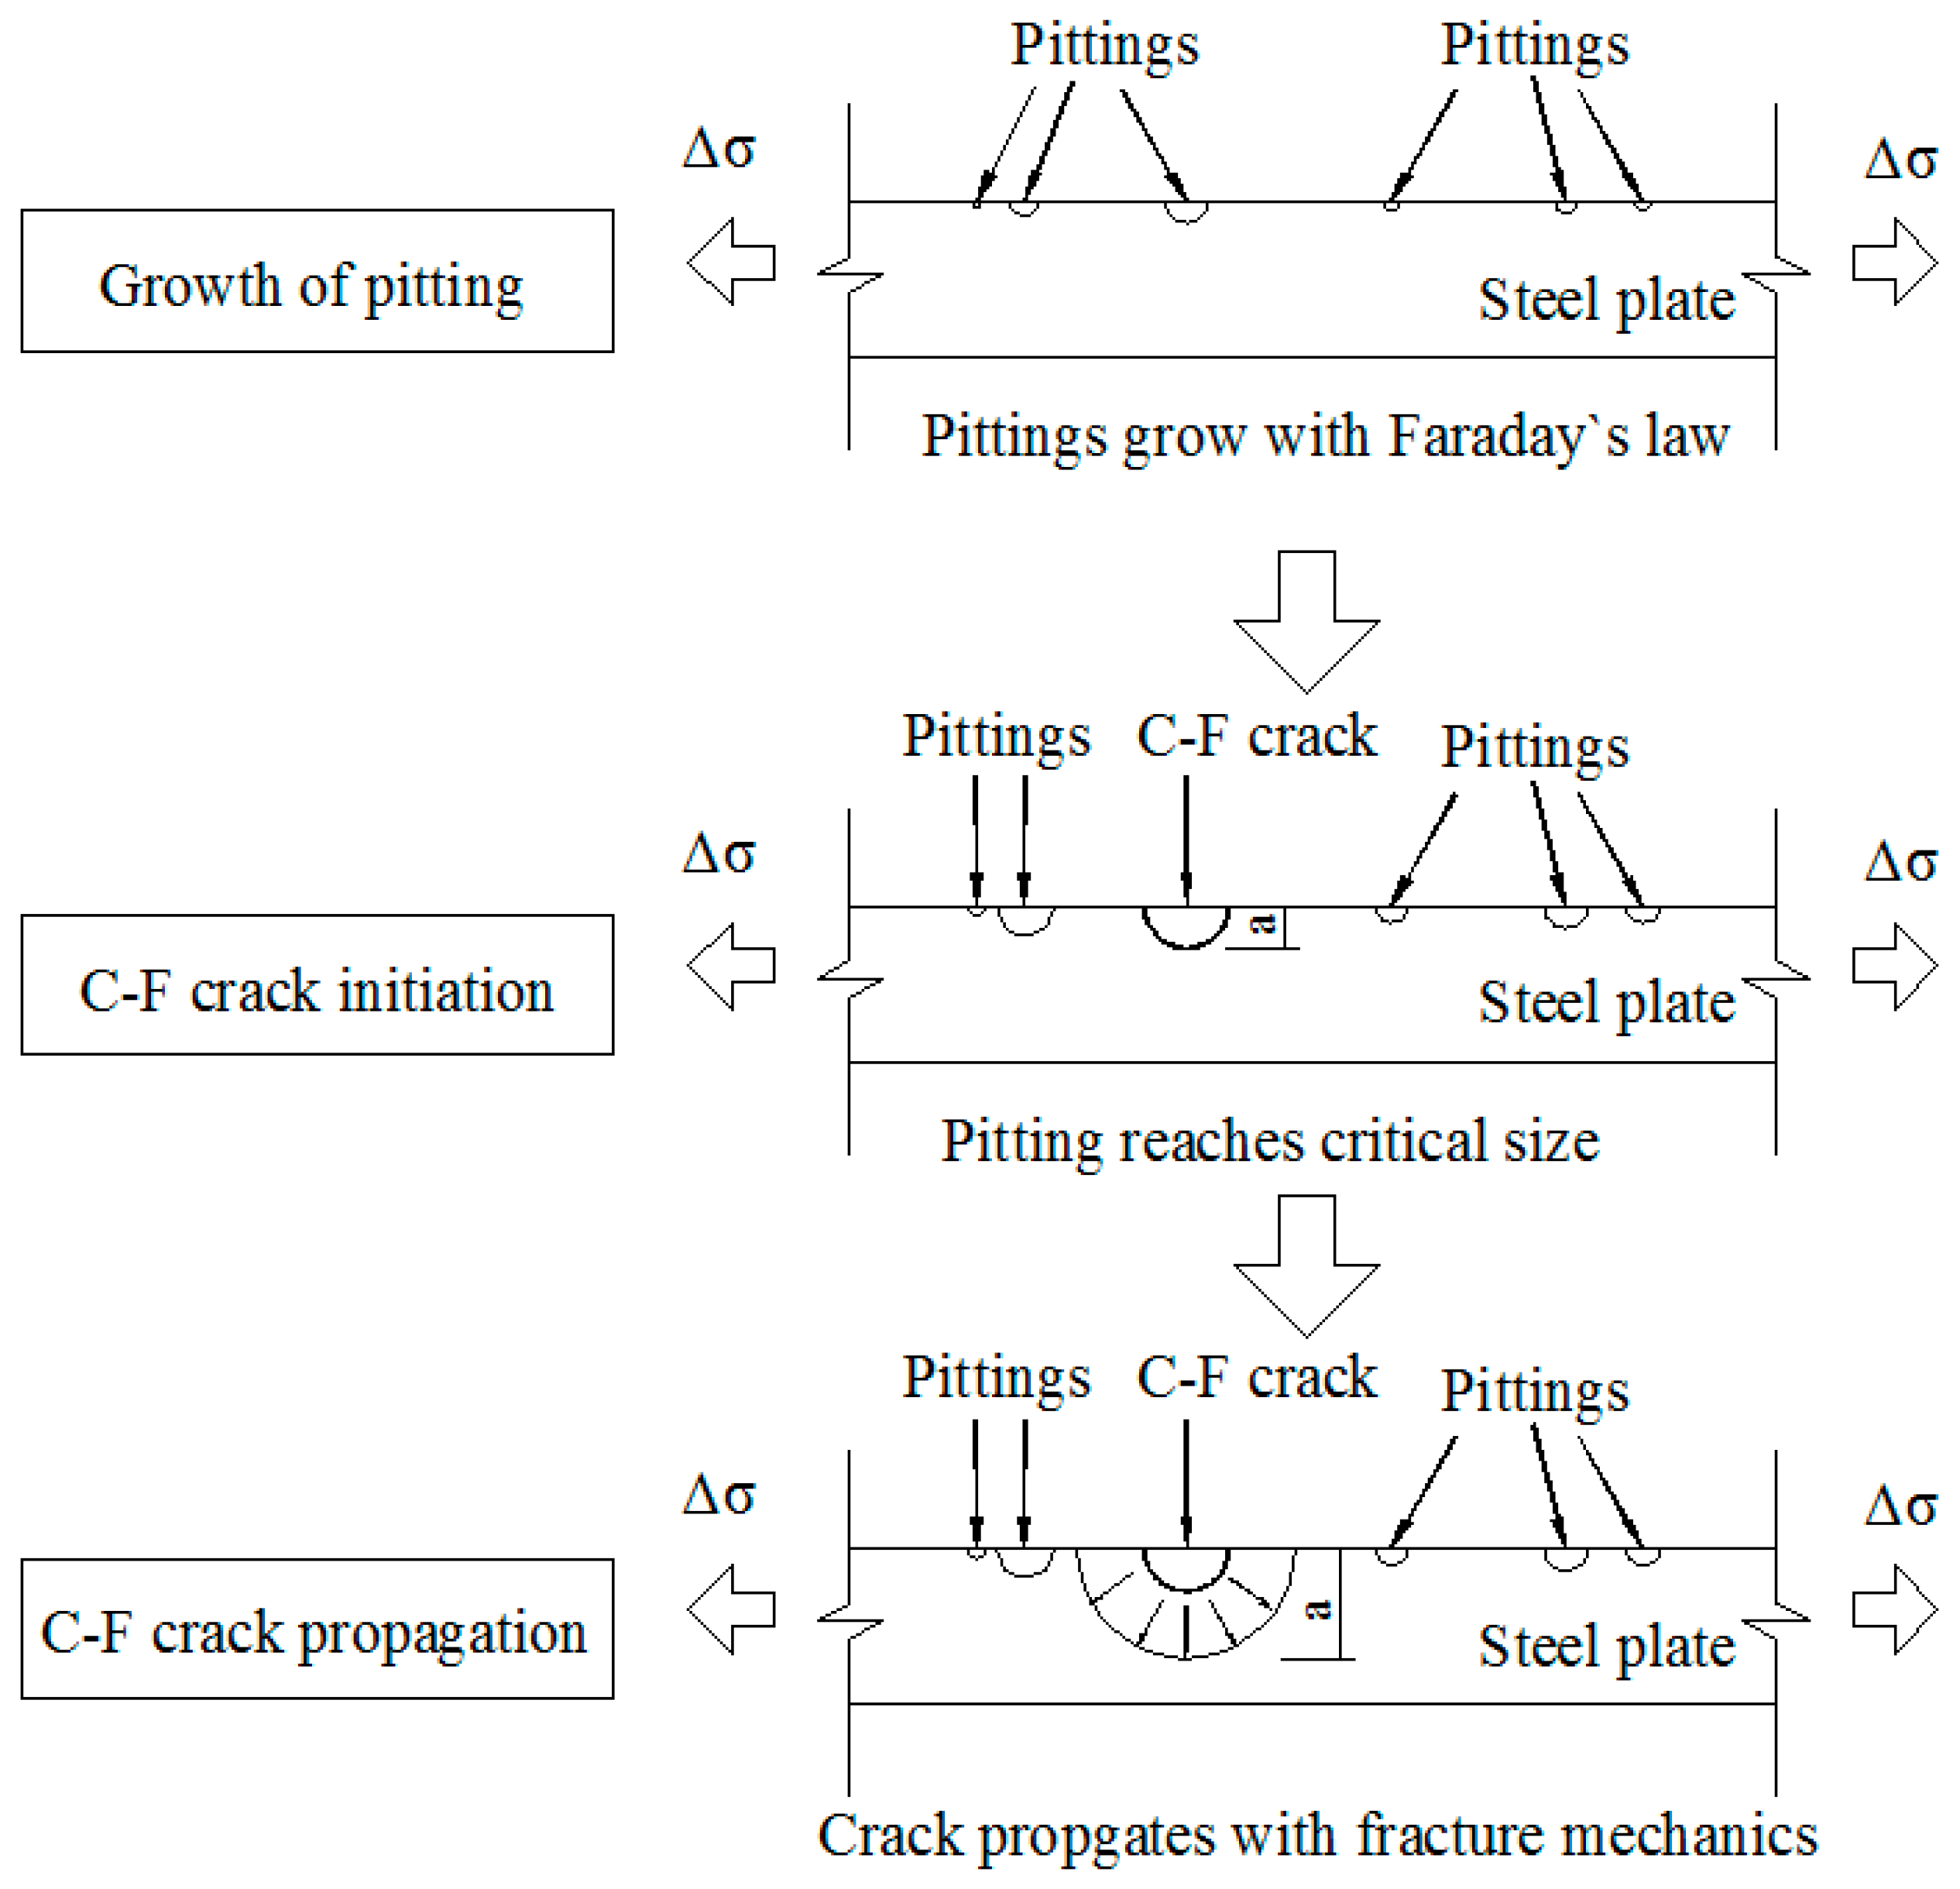
Figure 4 illustrates the whole C-F process.
According to the above discussion, the C-F model can be established. At the beginning of the C-F process, the pitting flaw keeps growing under the corrosion only, as described by Faraday’s law. The corrosion process could be further accelerated by the vehicle-induced cyclic stress [23,35]. Thus, modification has been made in Equation (4) to incorporate the influence of cyclic stress, as shown in Equation (7):
a = B m a s p 2 / 3 I p 1 / 3 t 1 / 3 C p σ a ,
where C p is the constant related to the material and σ a is the stress range.
As aforementioned, the pitting flaw could be regarded as an equivalent crack. As suggested by Newman et al. [40], the stress intensity factor (SIF) could be solved for the equivalent crack based on the stress range, pitting flaw property and geometry of plates, as shown in Equation (8):
Δ K = ( S t + H S b ) π a Q F ( a t , a c , c b , ) ,
where a is the pitting depth; c is the pitting width; t it the thickness of the plate; b is the width of the whole plate; is the angle of crack boundary; S t and S b are uniform-tension stress and bending stress; H is boundary-correction factor and Q and F are functions associated with a , c , t , b and .
Due to the fatigue limit that exists in metals, the fatigue effect has little influence on the crack propagation when the crack size is under a specific critical size. Once the pitting flaw grows to the critical size, the fatigue effect will join as a parallel driving force in the crack propagation. The fatigue-induced propagation could be solved according to the fracture mechanics. For instance, the well-known Paris law [43] can be applied, as shown in Equation (9):
d a d N = C ( Δ K ) m ,
where a is the crack size; N is the numbers of loading cycles; C and m are the material-related constant and power index, respectively and Δ K is the range of the SIF.
As proposed in [39], the competition criterion is introduced that the two effects, i.e., corrosion and fatigue, will compete in terms of the crack growth rate. As a result, the C-F process will be dominated by the driving force with the higher rate. It can be found from Equations (7)–(9) that, with the time passing, the growth rate of pitting corrosion is decreasing while that of the fatigue is increasing. As a result, the fatigue will gradually replace the corrosion as the major driving force in the propagation as aforementioned.
Based on the above analysis, the time period before the growth rate of fatigue surpasses that of pitting corrosion could be regarded as the C-F crack initiation stage, in which the crack growth is only determined by the corrosion process. After that, the influence of corrosion can be ignored, and the corresponding stage can be regarded as the C-F crack propagation stage. At this stage, the fatigue process becomes the only driving force in crack propagation, in which the SIF can be used to calculate the propagation rate.
It is worth noting that, according to Equation (8), the larger flaw size leads to the higher SIF under the same stress state. As a result, fatigue crack is more likely to initiate from the larger pitting flaw. Since the maximal pitting current can represent the highest degree of pitting corrosion, it has been employed in Equation (7) for conservativeness.

4.2. Service Life of Corrosion-Fatigue Crack Initiation

In solving the service life of C-F crack initiation it is crucial to determine the critical flaw size, beyond which the fatigue can become the major driving force. There are generally two approaches proposed to determine the critical size: (1) The equal rate method, assuming that the critical size reaches at the time when the growth rates of corrosion equals to the one of fatigue [16,45] and (2) the fatigue limit method, which determines the critical size based on the fatigue limit in terms of SIFs [10,46]. In the type (1) method, the growth rate of fatigue should be solved at the beginning of the C-F process when the flaw is extremely small. However, the propagation behavior of small cracks is still a controversial issue that can hardly be illustrated. Alternatively, the type (2) method only requires the solution on the well-initiated flaws, which is more concise and practical but may compromise the accuracy to a small extent. To determine the critical size with appreciable accuracy, the above two types of methods were combined in determining the crack initiation life in the present study.
By setting the SIF same as the fatigue limit, the critical size could be solved using Equation (8). It is worth stating that the fatigue limit here is not the threshold value for the long crack, which will be discussed in detail later. Based on Equation (7), the service life of initiation could be solved, as shown in Equation (10):
t i = a c 3 B 3 m a s p 2 I p C 3 σ a C p 3 σ a + t c ,
where t i is the service life of the C-F crack initiation; a c stands for the critical depth and t c is the service life spent during the competition, which is calculated from the moment when critical depth is reached to the moment when the growth rate of the fatigue effect exceeds that of pitting corrosion.
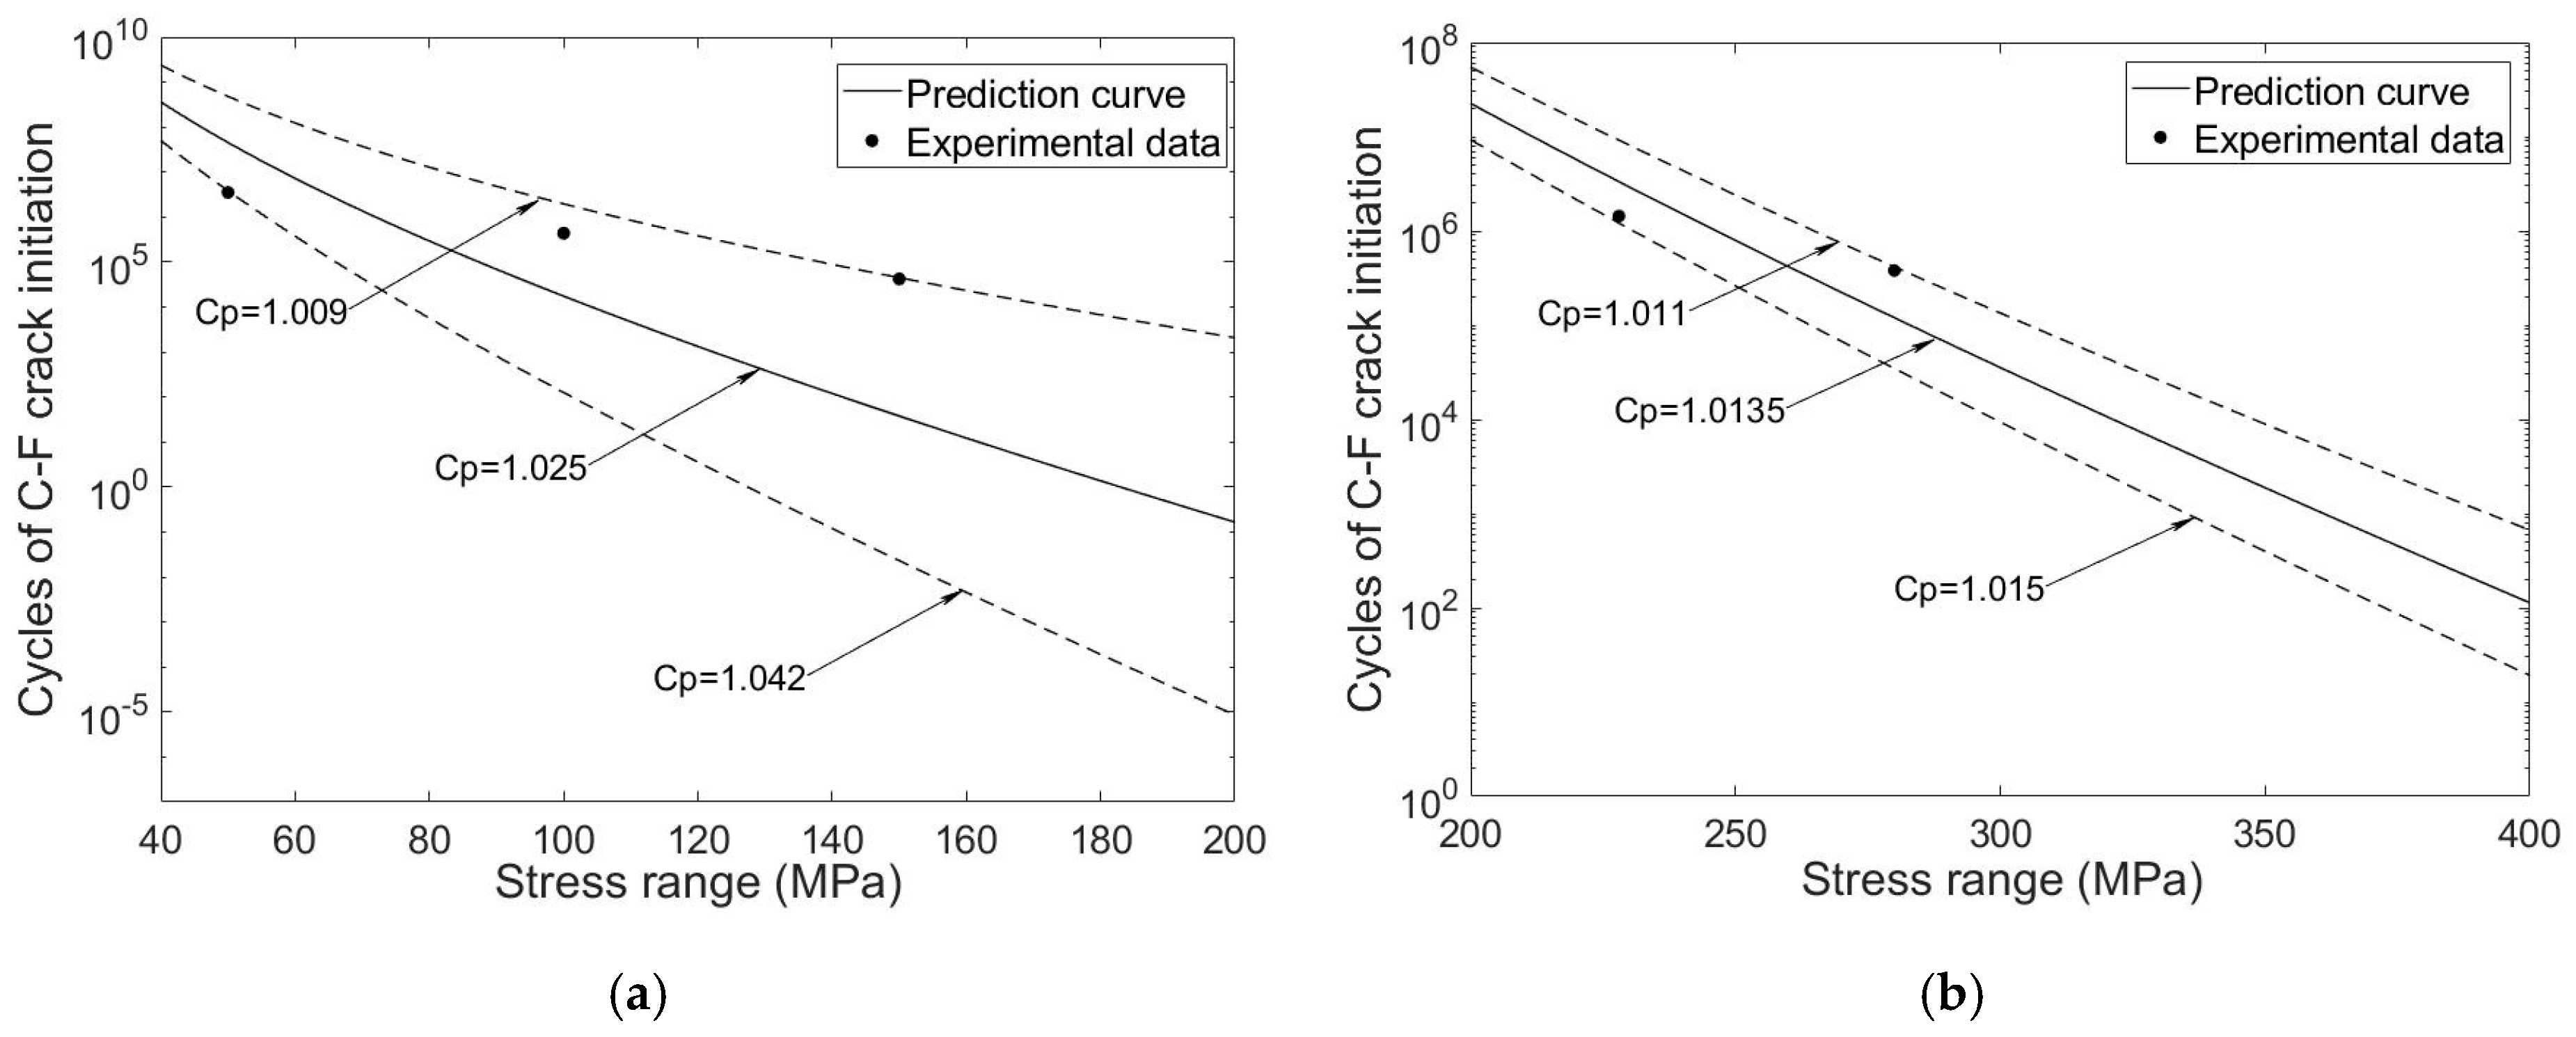
Verification has been carried out using two typical materials [35], including the 2024-T3 aluminum alloy and the 12% Cr stainless steel. The material properties are listed in Table 2.
The prediction value is plotted against the test data [22,23] under various stress ranges, as shown in Figure 5. In the prediction, the critical depth was solved by the fatigue limit listed in Table 2, while the Paris’ law was employed to determine the crack growth rate induced by the fatigue effect. The result shows that the prediction curve matched well with the test data, indicating the effectiveness of the proposed method in solving the C-F crack initiation life. It is worth noting that a similar verification was done by Mao et al. [47].

4.3. Service Life of Corrosion-Fatigue Crack Propagation

As aforementioned, once the critical flaw size is achieved, the fatigue effects as well as the corrosion effects are the two major driving forces in crack propagation. Accordingly, the fatigue process competes with the corrosion process in terms of the crack growth rate, and the propagation is dominated by the one with a higher growth rate. It can be inferred from Equations (7) and (9) that, with the development of the crack, the growth rate is decreasing for the corrosion process while increasing for the fatigue process. Once the growth rate induced by the fatigue process exceeds that caused by the corrosion process, the fatigue effect becomes the dominated driving force and the influence of corrosion could be ignored. Therefore, it is crucial to determine the crack growth rate induced by the fatigue effect. Studies [48] show that the fatigue crack can be divided into small (short) cracks and long cracks during the propagation. For small cracks, the fatigue limit is significantly lower than that of long cracks, while the propagation rate is much faster [48]. Obviously, the behavior of small cracks cannot be reflected by the crude Paris law since the difference is not considered.
Thus, the advanced NASGRO equation has been applied, in which the small crack is considered, as shown in Equation (11):
d a d N = D [ ( Δ K Δ K t h r ) / 1 K m a x / A ] m ,
where Δ K t h r is the decreased fatigue limit in terms of the SIF range, which will be discussed later; K m a x is the maximal SIF; R is the stress ratio; A is the fracture toughness and D is a material-related constant.
The maximal SIF can be calculated based on the stress ratio, as shown in Equation (12):
K m a x = Δ K ( 1 R ) .
Based on Equation (11), the service life of propagation could be solved, as shown in Equation (13):
t p = 1 f a i h d a / { D [ ( Δ K Δ K t h r ) / 1 K m a x / A ] m } ,
where f is the frequency of the applied cyclic loads and a i is the crack initiation depth.

4.4. Corrosion-Fatigue Model

In the C-F crack initiation stage, Faraday’s law is more suitable for this process, which considers many factors such as the material property, temperature, corrosion system and time. In the C-F crack propagation stage, Paris law needs different propagation parameters C, m and the threshold value for a short crack and long crack respectively, which makes the evaluation rather complicated. Thus, the NASGRO equation requiring only a few parameters is preferable for the evaluation on this process, while it can describe both a short crack and long crack within the same pattern effectively.
Based on the above analysis, the whole C-F life of the structural steel for bridges could be solved by combining the initiation life and propagation life, as shown in Equation (14):
t C F = a c 3 B 3 m a s p 2 I p C p 3 σ a + t c + 1 f a i h d a / { D [ ( Δ K Δ K t h r ) / 1 K m a x / A ] m } ,
where t C F is the C-F life of the material.
As shown in Equation (14), the whole C-F life consists of three parts. In the first part, the pitting corrosion is the only driving force since the condition is not met for the fatigue-induced propagation. The material constant B is similar in different kinds of steel so that its influence on the C-F life of different steel is not significant. Meanwhile, the constant C p is highly dependent on the category of steel that a small variation in the constant can lead to a great difference in the initiation life. Besides, with the increase in the environment-related pitting current, the initiation life can be remarkably decreased. It is also indicated by Equation (14) that, the higher stress range further accelerates the pitting process described in the first part. In the last part, the fatigue effect outcompetes the corrosion effect and becomes the major driving force in crack propagation. Fatigue limit and fracture toughness are dependent on the fracture mechanical property of the material. Meanwhile, a higher frequency of cyclic loads can reduce the propagation life directly. Within the integral operation, the parameters Δ K and K m a x related to the stress range and stress ratio can also influence the propagation. Besides, the constants D and m are almost the same for structural steel, as given in [12]. For the geometric factor a i , it depends on the stress range, stress ratio, plate thickness, the rate of pitting corrosion and the rate of fatigue crack propagation. In the middle part, it is assumed that during the time period t c , both the pitting corrosion and the fatigue effect serve as the driving force in crack propagation parallelly and compete with each other. Thus, the time period t c at this part will be affected by the above factors in both the corrosion and fatigue process. In sum, the C-F life of steel is a highly complicated process, which is affected by many crucial factors.
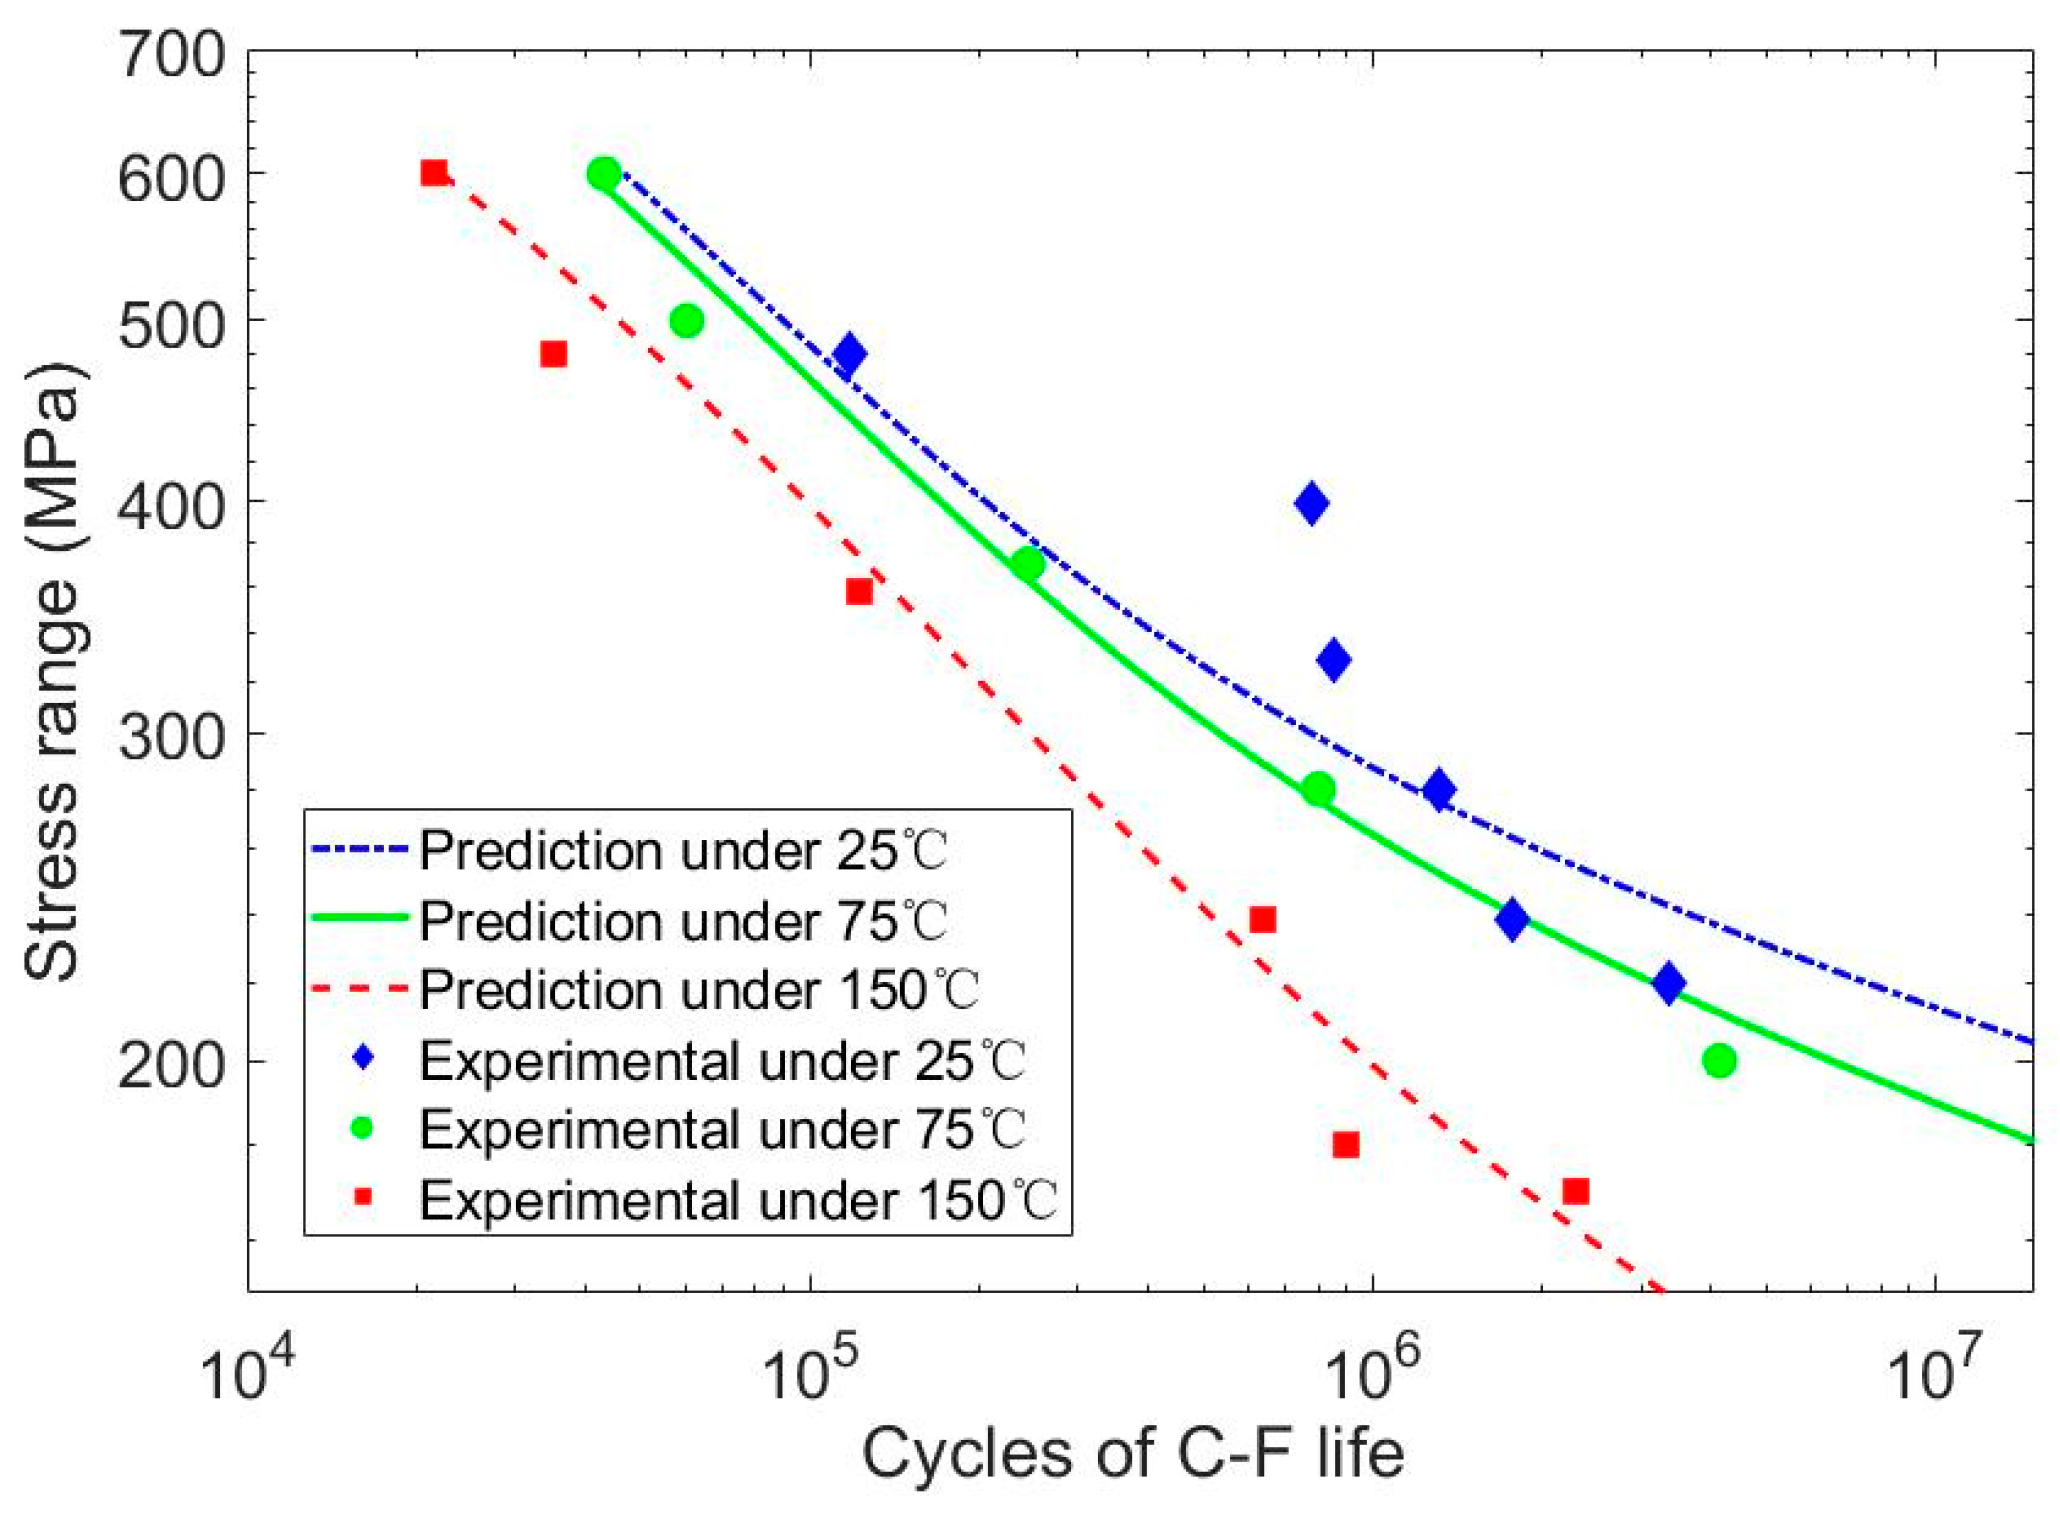
Further verification has been carried out for the whole C-F life, through the experimental data of a type of precipitation hardening steel [10]. The material properties of the steel are listed in Table 3, with the fatigue limit recommended by Kondo [16]. The experiment data has been obtained under three different temperatures, i.e., 25 °C, 75 °C and 150 °C. Based on that, the pitting current can be respectively calculated under the three testing temperature based on Equation (14). As a result, the pitting currents are determined as, 1.8065 × 10⁻⁸ C/s, 1.8991 × 10⁻¹¹ C/s and 8.7407 × 10⁻¹¹ C/s under 25 °C, 75 °C and 150 °C, respectively.
The prediction curve is plotted against the experimental data, as shown in Figure 6. In the prediction, the specimens were in the round section. For this reason, the expression for the SIF range can be written as follows:
Δ K = ( 2.2 π ) K t · Δ σ π · a ,
where K t is the stress concentration factor in the location, however, the K t = 1 for the location with regular geometry.
The result exhibited that the experimental data under 25 °C and 75 °C were similar, which shows the minor influence of the pitting current on C-F life in relatively low temperatures. Generally, the prediction curves match well with the experimental data, especially under 75 °C and 150 °C. It is also worth noting that a notable deviation existed between the experimental data and the prediction curve under 25 °C. Further analysis suggests that this deviation could be attributed to the relative large scatter in the data under 25 °C However, the trend was still highly similar between the test data and prediction curve under 25 °C Thus, it was proved that the proposed model could predict the whole C-F life effectively.

5. Analysis on Corrosion-Fatigue of Structural Steel for Bridges

5.1. Material

Based on the proposed model, a case study was carried out to investigate the C-F process in steel bridges. The typical weathering steel HPS 70W [49] was selected while the normal carbon steel 14MnNbq (named Q370q at the same time) was also investigated for comparison. The HPS 70W is a kind of high performance steel widely used in bridge engineering, which has higher strength, better corrosion resistance and better weldability compared to traditional weathering steel. The yield strength of the HPS 70W and the 14MnNbq steel are 485 MPa and 370 MPa, respectively. The chemical compositions and mechanical properties [49,50,51,52] are listed in Table 4 and Table 5, respectively. It is worth stating that the fatigue limit Δ K t h in Table 5 was the value for the long crack.
As suggested by the NASGRO equation, instead of the original fatigue limit, a decreased fatigue value should be used in accordance with fracture toughness, to consider the behavior of small cracks. Table 5 shows the two parameters of the selected steel under different stress ratios.
The parameters of the selected steel [12] are shown in Table 6.

5.2. Fatigue Limit

As fatigue cracks can be divided into long cracks and small cracks, Phillips et al. [53] claimed that different fatigue limits should be applied for the large-crack and small-crack, respectively [53]. Meanwhile, Kondo [16] proposed that the threshold value for crack initiation is smaller than that of the fatigue limit for long cracks. In another world, the crack can also initiate and propagate when the SIF range is between the fatigue limit for a long crack and the threshold for crack initiation. On this end, the decreased fatigue limit recommended in [12] was utilized as shown in Equation (11). Studies [54,55] indicate that the fatigue limit of steel is affected by the stress ratio, as shown in Equation (16):
Δ K t h = Δ K t h , 0 ( 1 α R ) ,
where Δ K t h is the decreased fatigue limit; R stands for the stress ratio; Δ K t h , 0 is the fatigue limit when R = 0 and α is a material-related parameter.
According to Equation (16), the threshold value of the two selected materials can be obtained under different stress ratios, as shown in Table 7.

5.3. Critical Pitting Depth of Steels

As aforementioned, the pitting flaw can be treated as an equivalent crack. As suggested by Newman [40,56], the range of SIFs at the pitting flaw can be calculated as shown in Equations (17) and (18):
Δ K b = [ 1.04 + 0.201 ( a h ) 2 0.106 ( a h ) 4 ] 2 π Δ σ π a ,
Δ K s = [ 1.04 + 0.201 ( a h ) 2 0.106 ( a h ) 4 ] [ 1.1 + 0.35 ( a h ) 2 ] 2 π Δ σ π a ,
where Δ K b and Δ K s are the ranges of SIFs at the crack tip and the crack edge, respectively; a is the pitting depth; h is the plate thickness and Δ σ is the remote stress range.
As aforementioned, the critical size of pitting flaws is achieved when any of the SIFs reaches the fatigue limit. It can be found from Equations (17) and (18) that the critical size is determined by the remote stress range, stress ratio and the plate thickness. Thus, the critical size in the HPS 70W and 14MnNbq was investigated under different combinations of parameters, as shown in Figure 7 and Figure 8. The result indicates that critical pitting depth of these two types of steel decreased with the increase in stress range and stress ratio. For instance, when the stress range increased from 50 MPa to 200 MPa, the critical pitting depth reduced roughly by 93% in both types of steel. Meanwhile, as the stress ratio rose from 0.01 to 0.5, the critical depth reduced by 33% in the HPS 70W and 77% in the 14MnNbq. Moreover, critical pitting depth was much more sensitive to stress range in low stress range state. It could also be found that the plate thickness had little impact on critical pitting depth, which was less than 3% change in the depth when the thickness increased from 20 mm to 50 mm. Besides, the result also suggests that the critical depth in the HPS 70W was not sensitive to the change in the stress ratio when compared with the 14MnNbq. As a result, a considerable higher critical depth could be expected in the HPS 70W under a high stress ratio, which in turn indicates its better robustness in fatigue performance.

5.4. Evaluation on the Corrosion-Fatigue Process

The C-F crack development in UWS bridges mainly depends on the category of environment, the fracture mechanics-related properties and the stress state under live loads. Meanwhile, there are also some other conditions that lead to an accelerated C-F process under same corrosion environment and material, e.g., the relatively huge pitting flaw size due to the uncertainty in pitting corrosion.
As suggested by Albrecht [15,57], the fatigue strength will be reduced due to the corrosion effect, and the degree of reduction increases with original fatigue strength. Since the base metal is believed with the highest fatigue strength, the reduction in the fatigue strength of the base metal is correspondingly the most serious. Thus, investigations were made on the C-F performance of base metal. The stress range used in the analysis was determined after the design fatigue strength at 2 million cycles in the Chinese code JTG D64 [58]. The ADTT was selected according to the number of heavy vehicles in traffic category 2 stipulated in the Eurocode 1 [59]. In addition, the pitting current was used the same as the value from the corrosion test in Qingdao [42]. The main parameters were listed as the following: Δ σ = 140 MPa, R = 0.4, ADTT = 1370, I p = 1.05 × 10⁻⁸ C/s, C p = 1 and m a s p = 1. Besides, it was assumed that each passing truck generated only one stress range. The results are shown in Figure 9.
The result indicates that crack development at the crack initiation stage was notably different from that at the crack propagation stage. For instance, the crack growth rate was remarkably lower at the initiation stage than at the propagation stage. In addition, it could also be found that the initiation life accounted for the largest part of the whole C-F life in both types of steel, i.e., 80.3% in the HPS 70W and 61.6% in the 14MnNbq. Similar conclusions can also be found in many relevant studies [22,60]. At the same time, the crack initiation life in HPS 70W was much longer than in the 14MnNbq, i.e., almost 5.3 times longer. On this end, the weathering steel HPS 70W steel exhibited much better C-F performance than the normal carbon steel 14MnNbq, even under the same pitting current. This advantage of the HPS 70W could be attributed to the higher fatigue resistance and lower decrease in fatigue limit with the increase in stress ratio. Besides, the corrosion resistance of HPS 70W was far better than the normal carbon steel 14MnNbq, which led to a further enhancement in the C-F performance of the HPS 70W.

6. Sensitivity Analysis on Parameters

In this section, a sensitivity analysis was performed to investigate the influence of the C-F life-critical factors, including the stress range, stress ratio, corrosive environment and ADTT on the C-F life of both two types of steel. For comparison purpose, the original sets of parameters were kept the same as in Section 5.4.

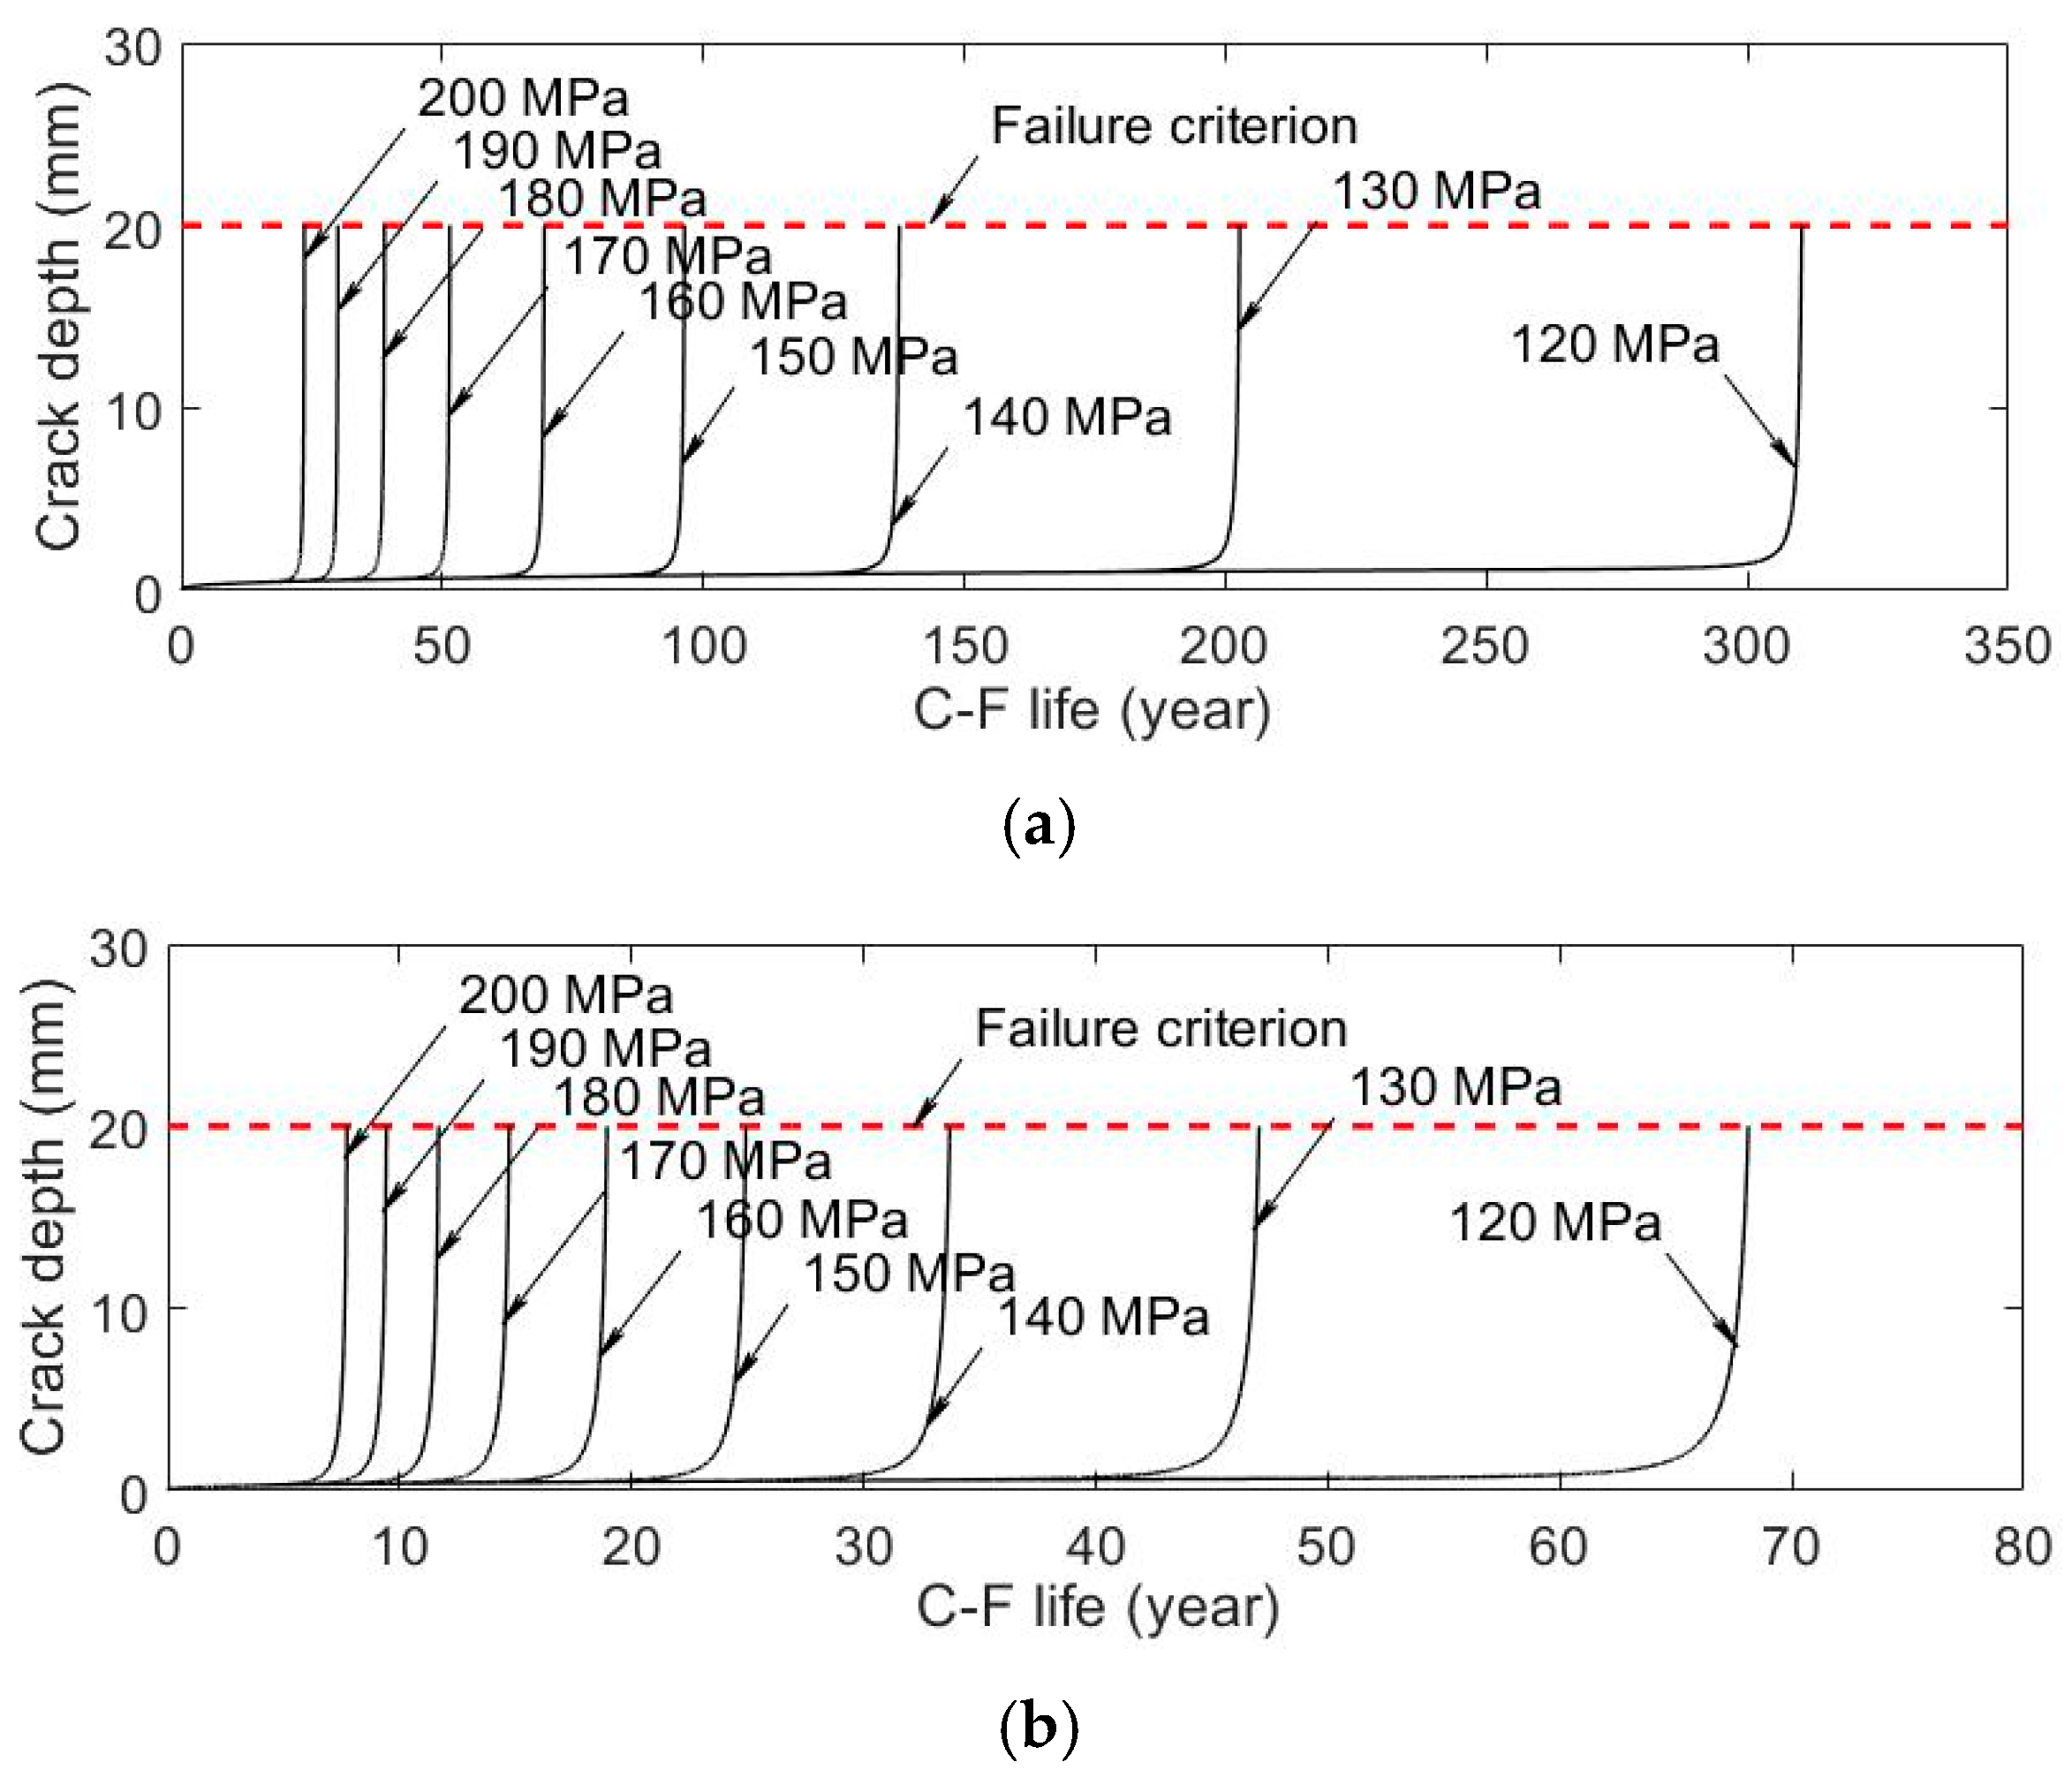
6.1. Influence of the Stress Range

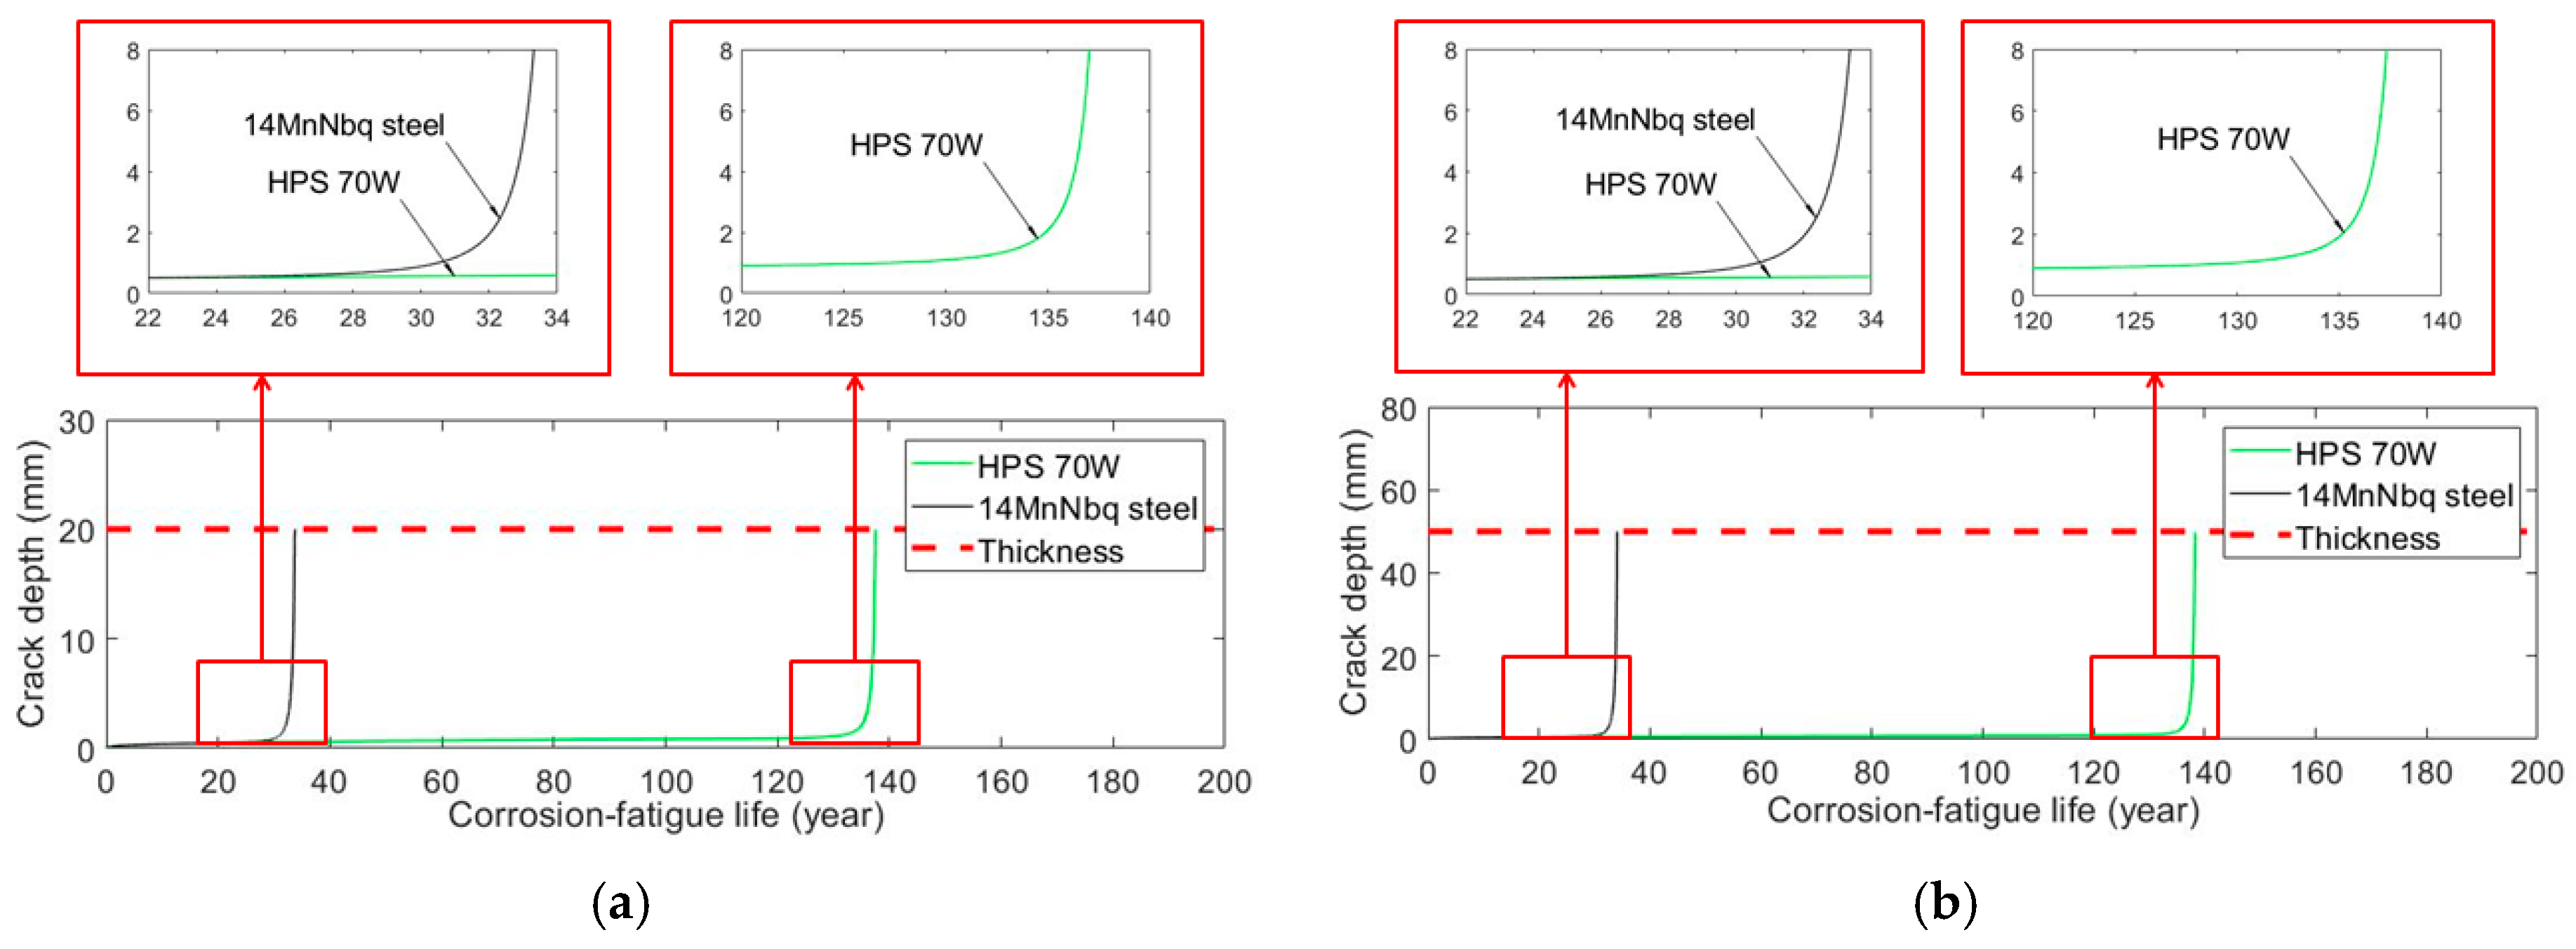
The stress range varied from 120 MPa to 200 MPa in the analysis. The crack depth was plotted against time, as shown in Figure 10. According to the result, when the stress range increased from 120 MPa to 200 MPa, the whole C-F life in the two types of steel was reduced by similar rates, i.e., 92.4% in the HPS 70W and 88.7% in the 14MnNbq. However, it should be noted that the C-F life of HPS 70W was far longer than that of 14MnNbq steel due to postponing in the crack initiation.
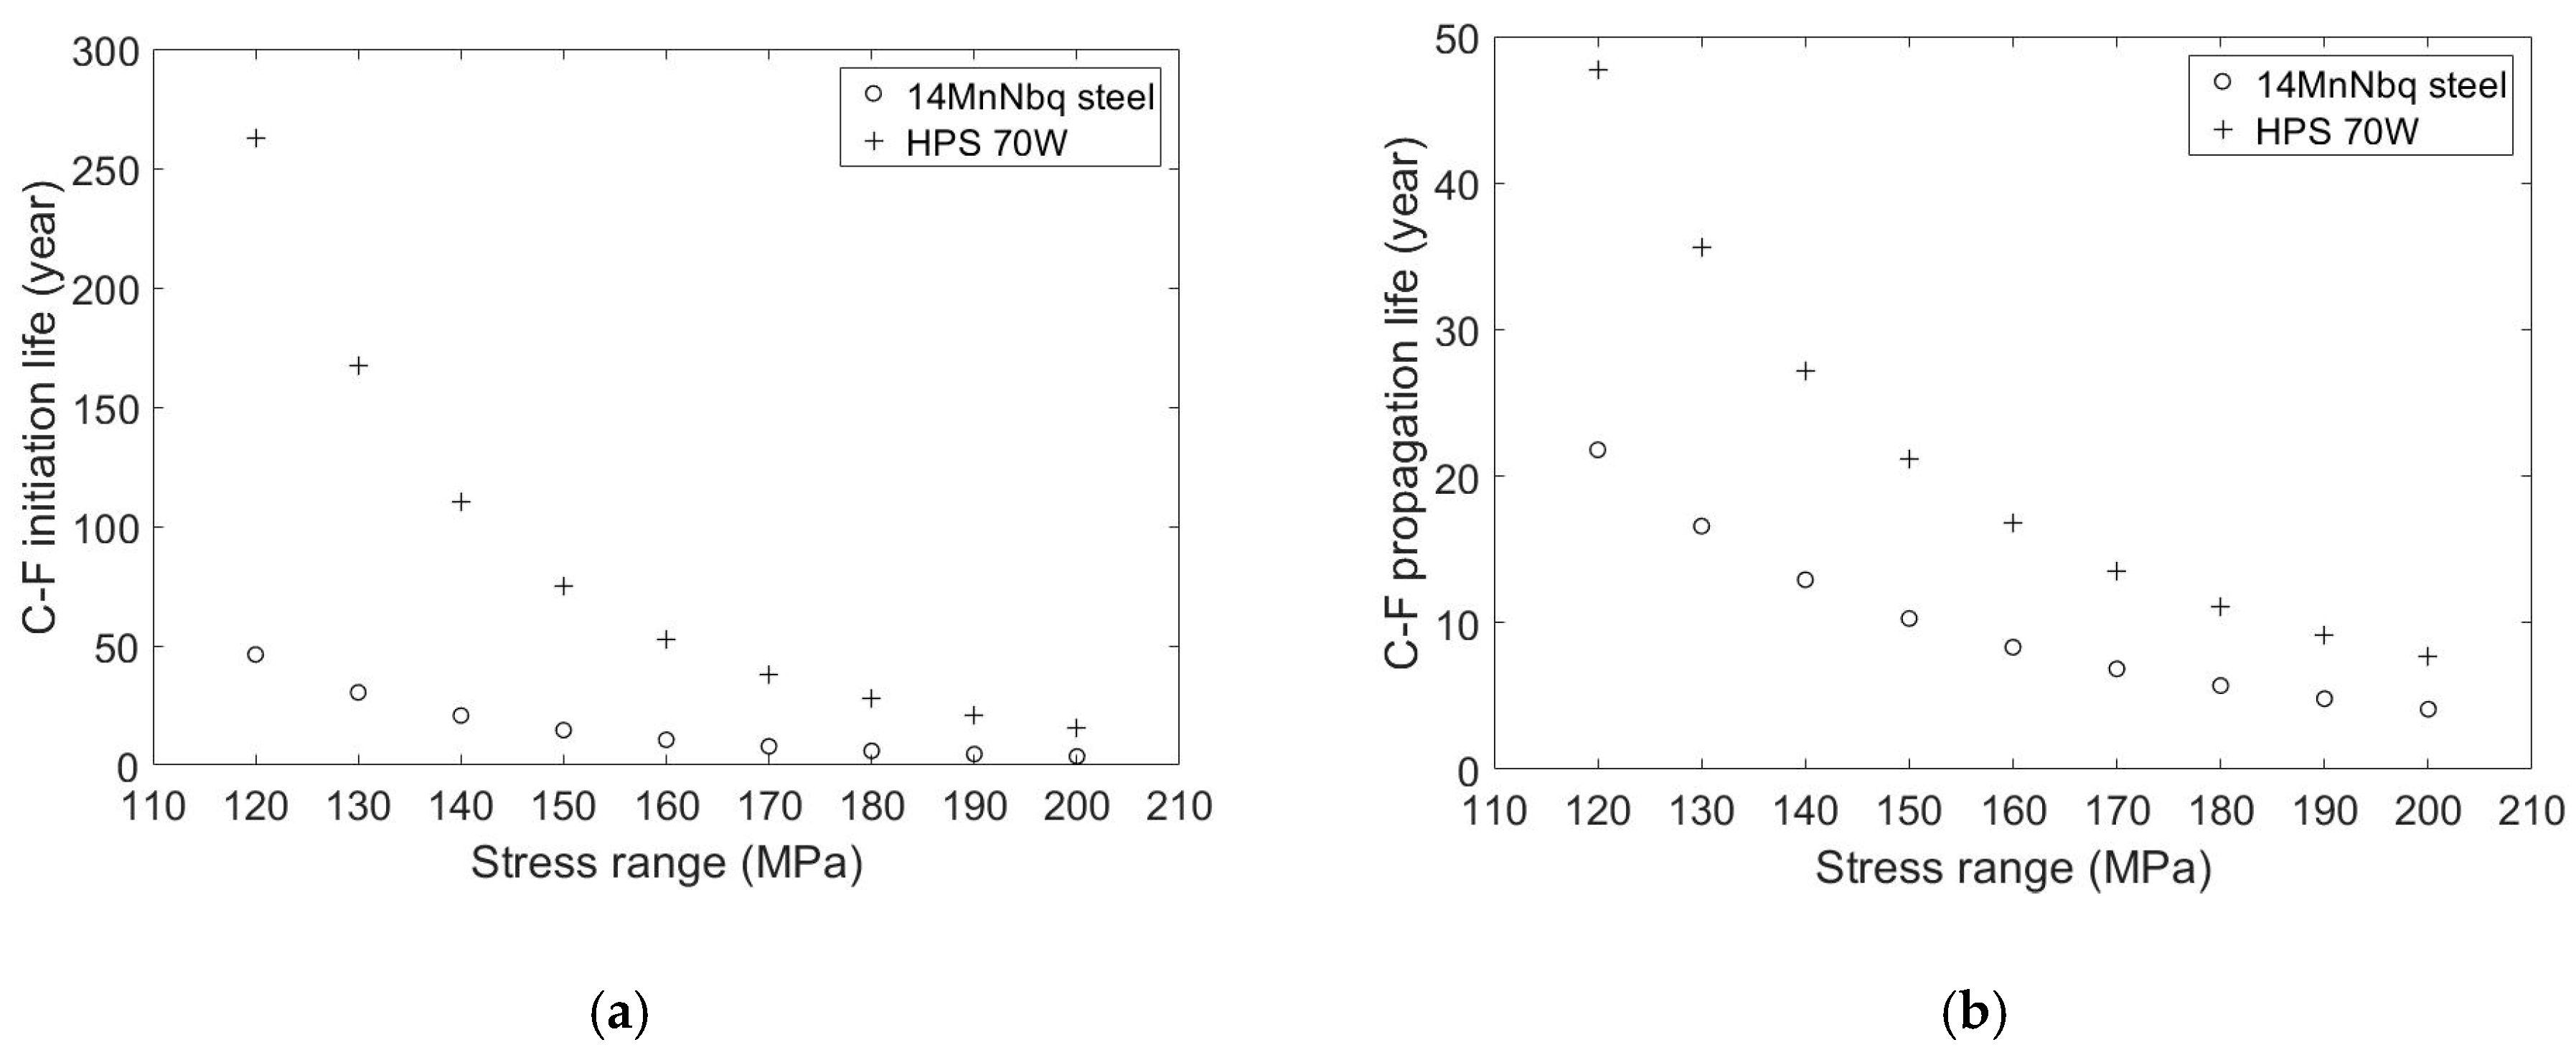
For further comparison, the influence of the stress range on the initiation life and the propagation life are shown in Figure 11a,b, respectively. It can be found that, due to the increase in the stress range, the propagation life was reduced by 83.9% in the HPS 70W and 81.2% in the 14MnNbq. Meanwhile, the initiation life in the HPS 70W steel was reduced by 94.0% while that in the 14MnNbq steel was decreased by 92.2%. The result suggests that the stress range had a great effect on the C-F life of both types of steel at both the two stages. Meanwhile, it also could be found that the effect of the stress range on the C-F life of both two types of steel was highly similar.

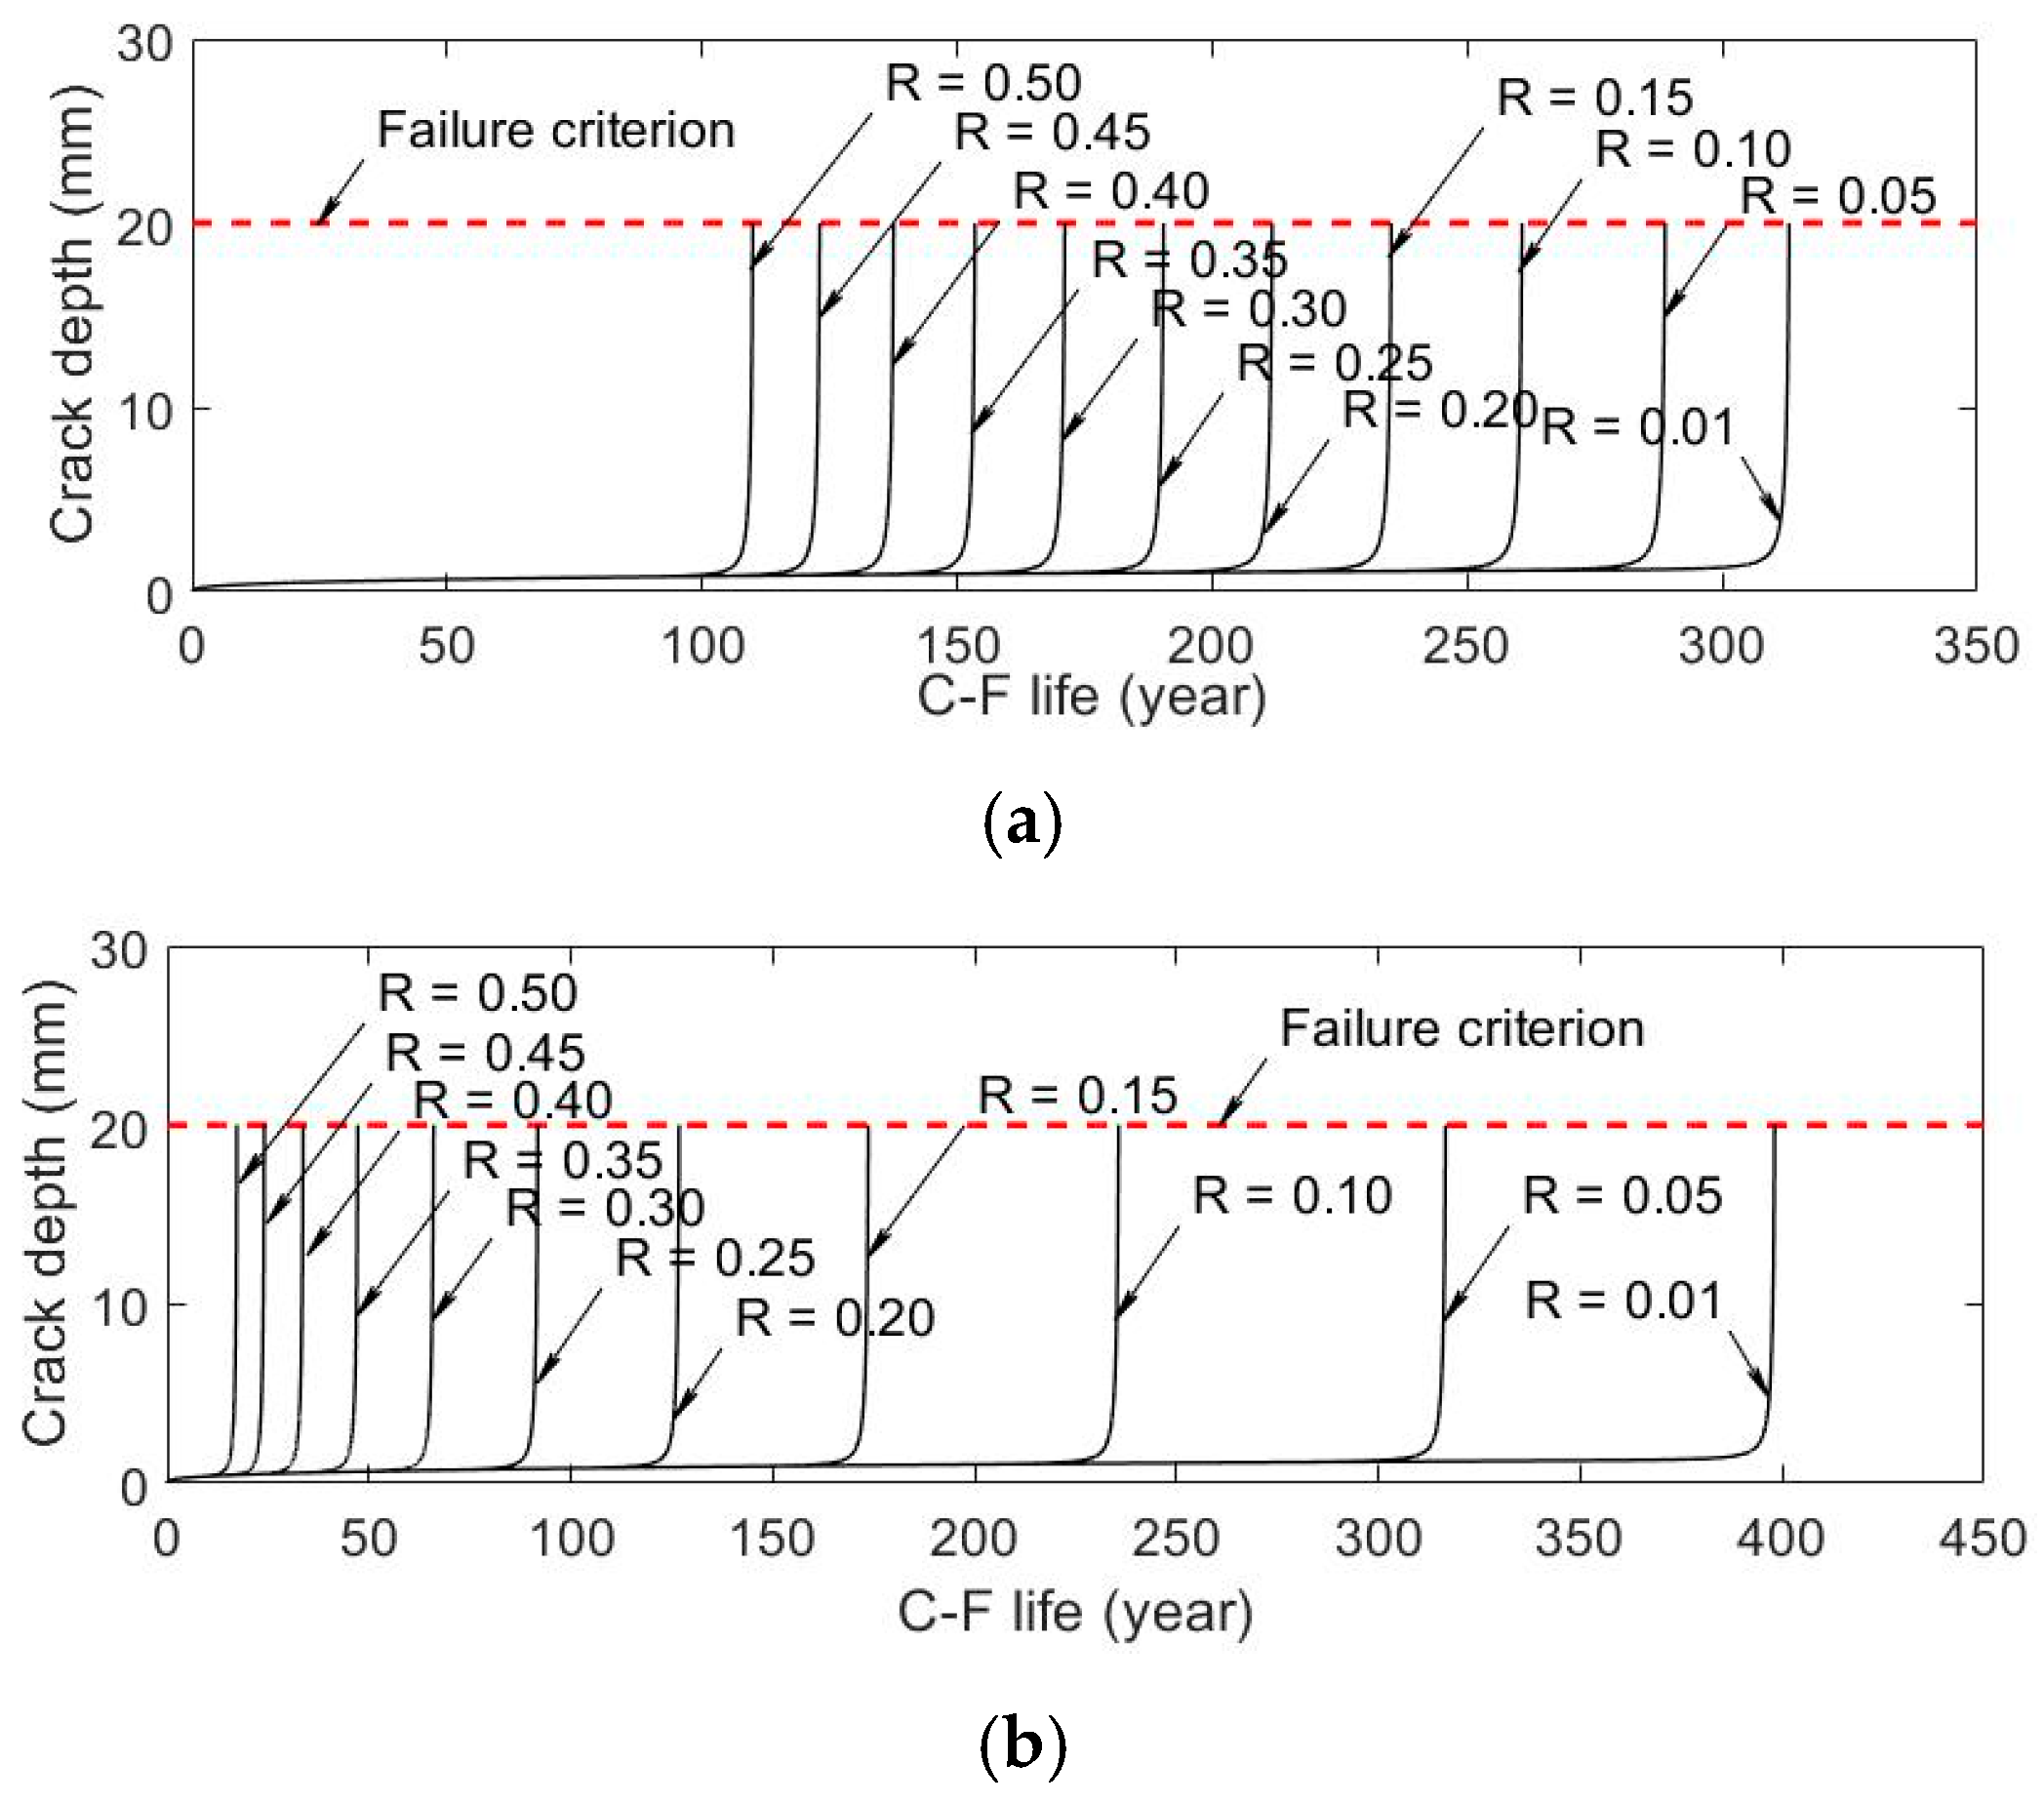
6.2. Influence of the Stress Ratio
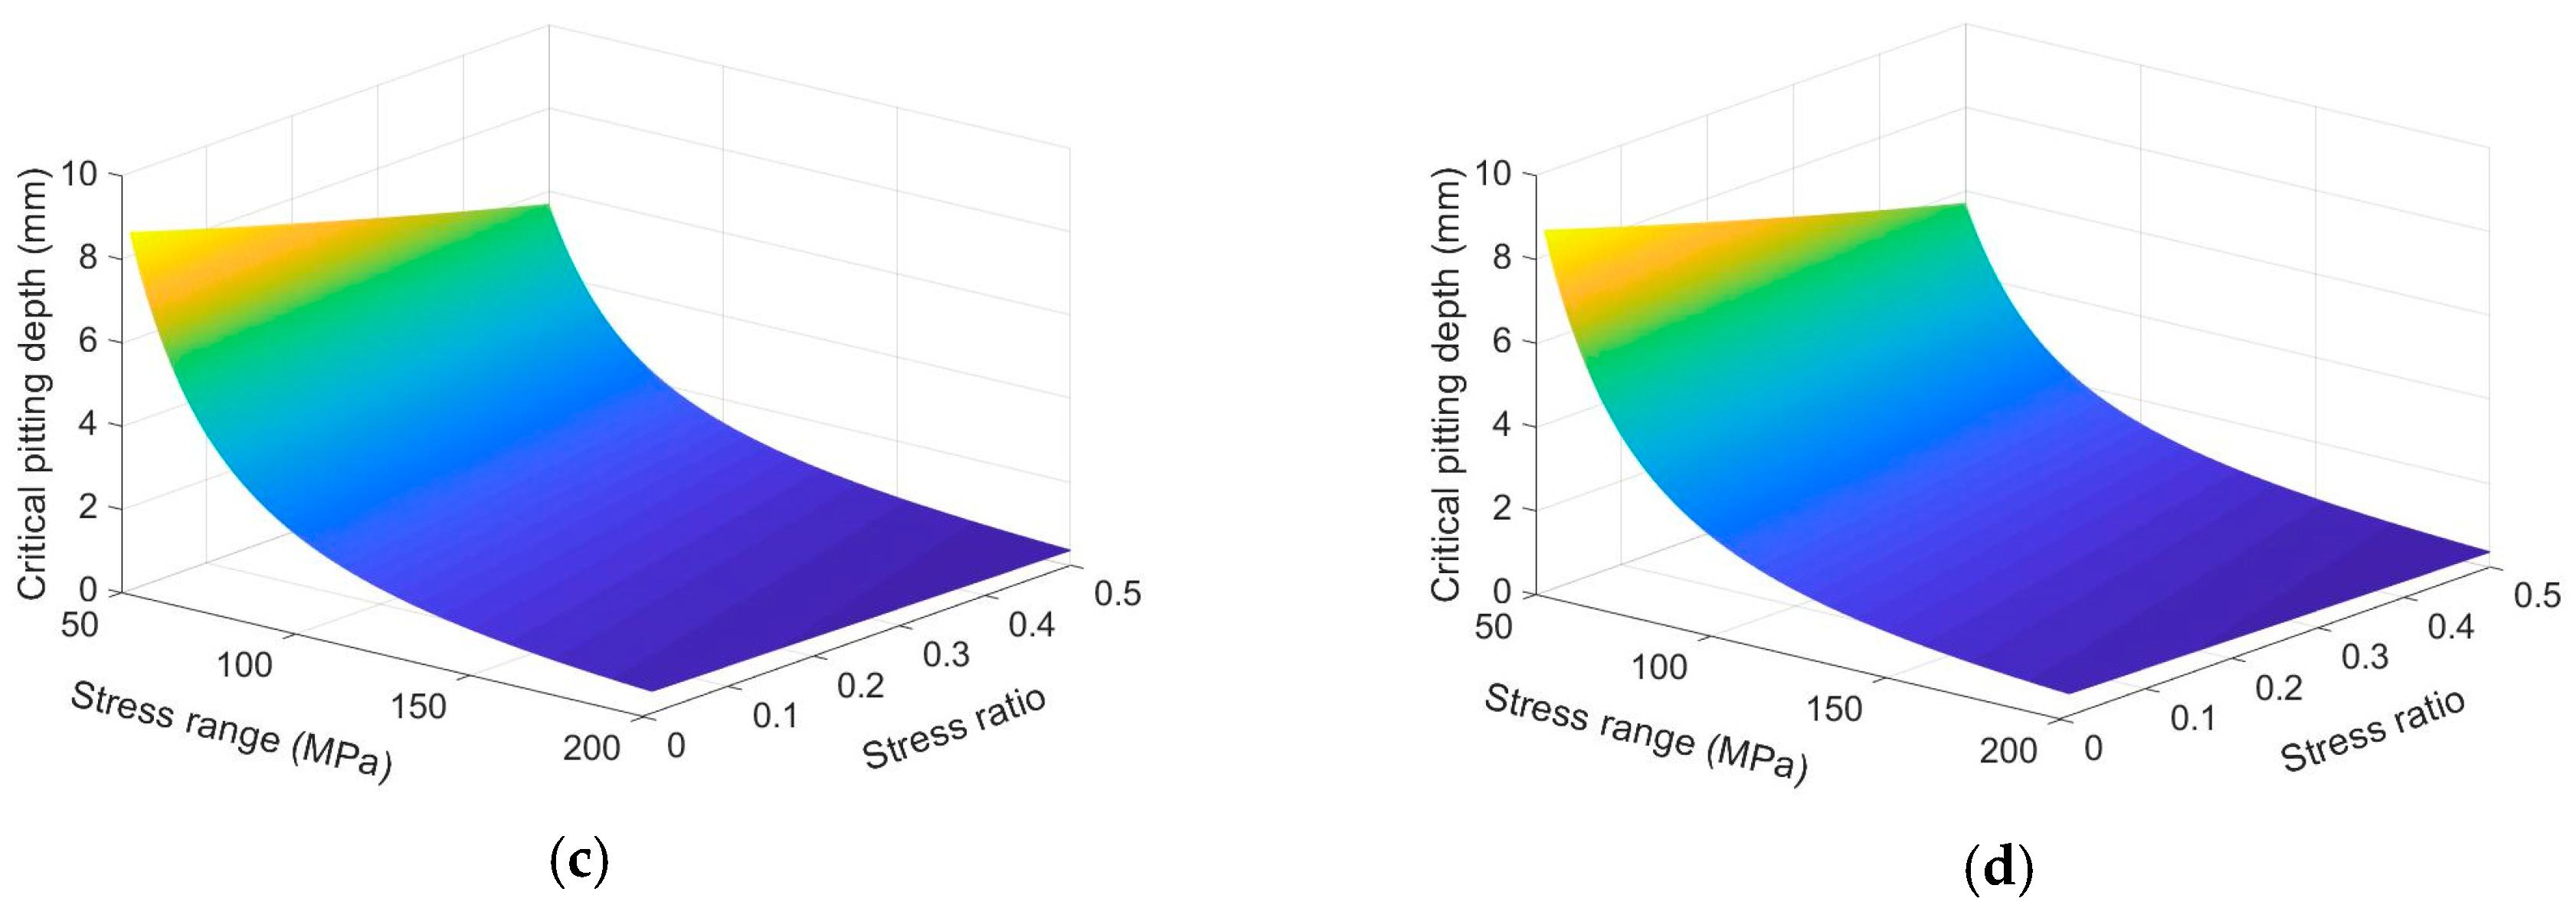
The stress ratio (R) varied from 0.01 to 0.5 in the analysis. The crack depth was plotted against time, as shown in Figure 12. According to the result, when the stress ratio ranges increased from 0.01 to 0.5, the whole C-F life was reduced by 64.9% in the HPS 70W and 95.6% in the 14MnNbq. It is also worth noting that the C-F life in the 14MnNbq became longer than that in the HPS 70W when the stress ratio was below 0.05, which would be discussed in the following.
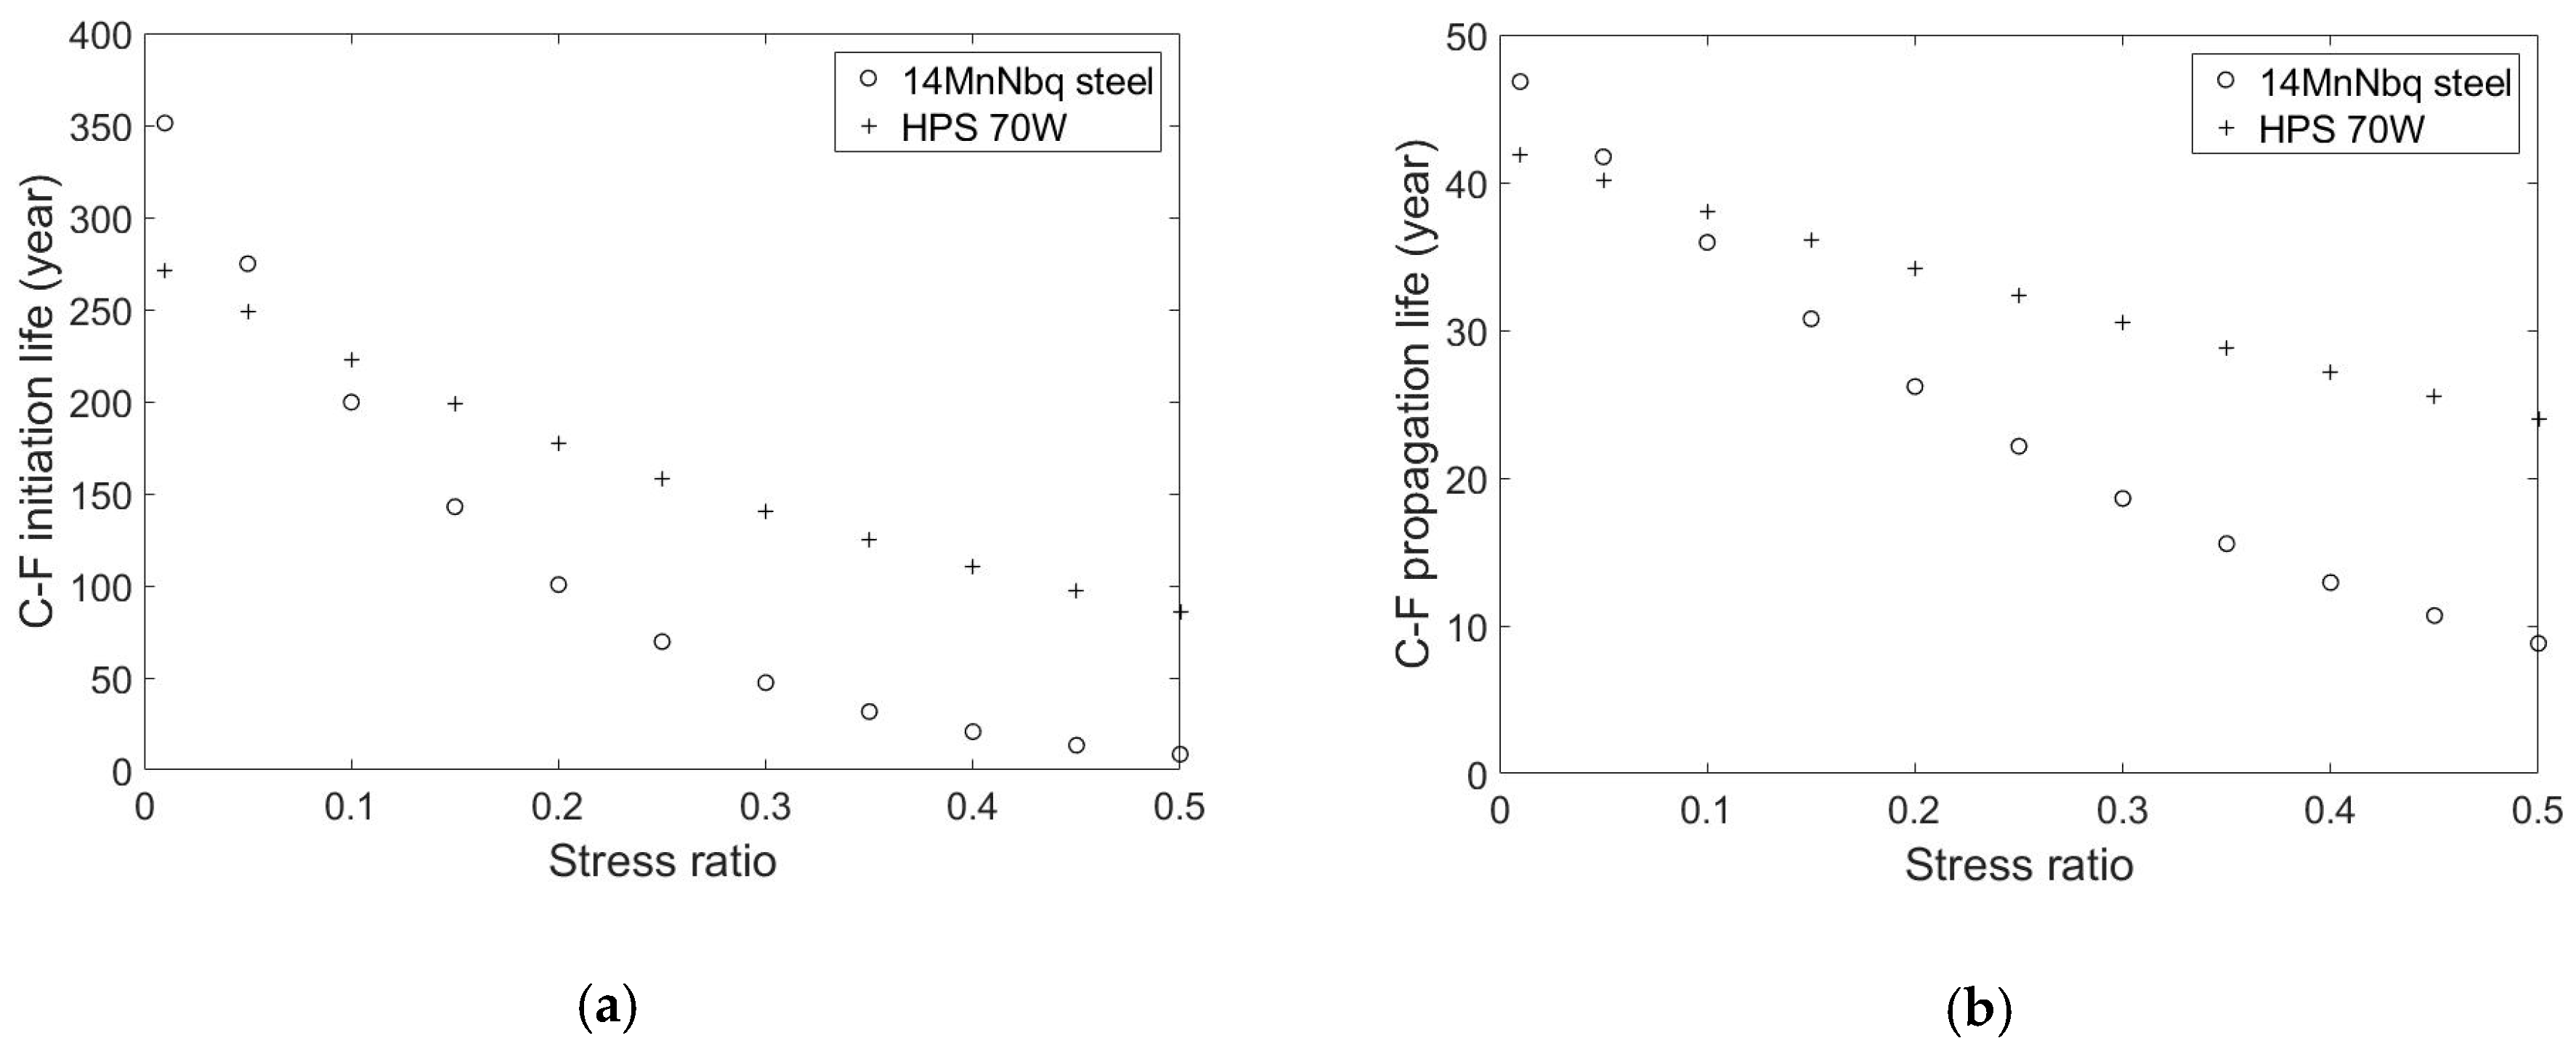
The influence of the stress range on the initiation life and the propagation life are also shown in Figure 13a,b, respectively. It could be found that with the increases in the stress ratio, the propagation life steel was decreased by 42.7% in the HPS and 81.2% in the 14MnNbq. Meanwhile, the initiation life was reduced by 68.3% in the HPS 70W and 97.6% in the 14MnNbq. The result suggests that the C-F life in the HPS 70W was less sensitive to the variation in the stress ratio. In another word, the HPS 70W had better robustness under the change in the stress ratio as previously illustrated by the analysis on the critical depth. It is also worth noting that when the stress ratio was less than 0.05, both the initiation life and the propagation life in the HPS 70W were shorter than that in the 14MnNbq. On the contrary, once the stress ratio increased beyond 0.05, a totally opposite trend could be observed. This phenomenon could explain the fact why the C-F life in the 14MnNbq was higher under a stress ratio of 0.05, as shown in Figure 12. However, it only happened under some extremely rare situations that the stress ratio was under 0.05 in steel bridges. Thus, the HPS 70W could be said to have a much better C-F performance under different stress ratios.

6.3. Influence of the Corrosive Environment

For better illustration, I p 
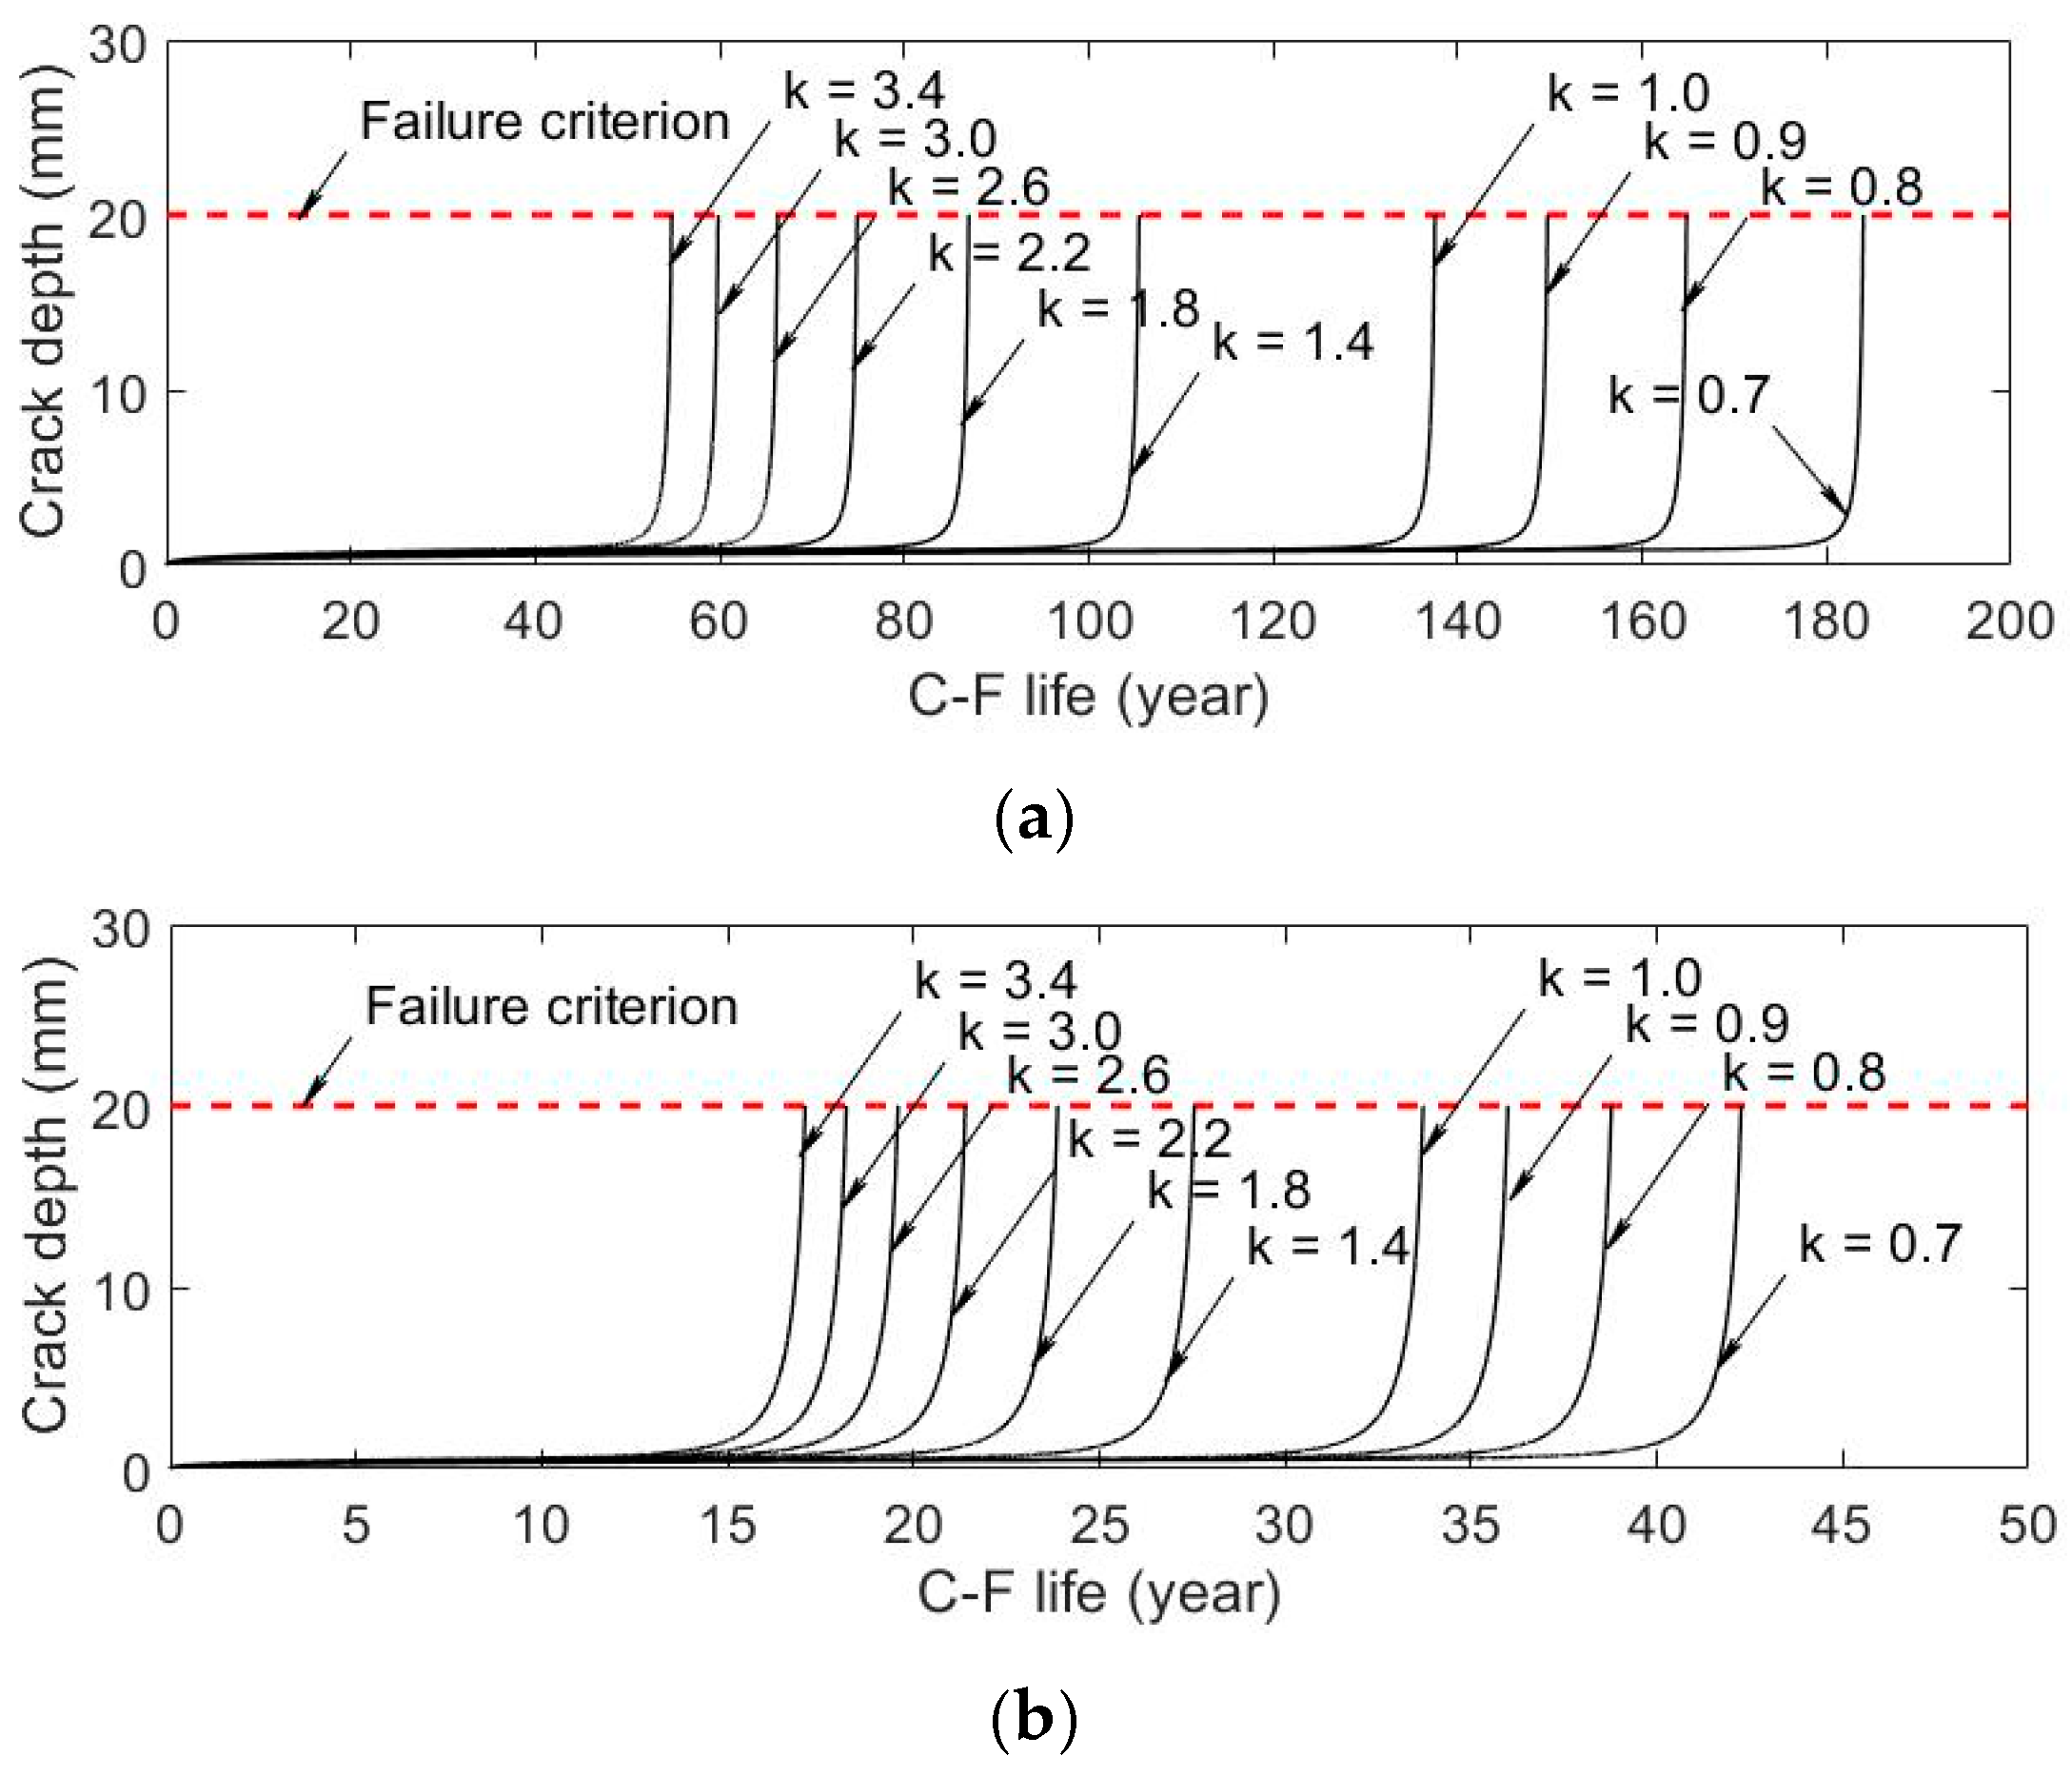
can be written in the form of I p = k × I p i where I p i stands for the original pitting current that is 1.05 × 10⁻⁸ C/s, and k is the pitting current magnify coefficient ranging from 0.7 to 3.4. The crack depth was plotted against time, as shown in Figure 14.
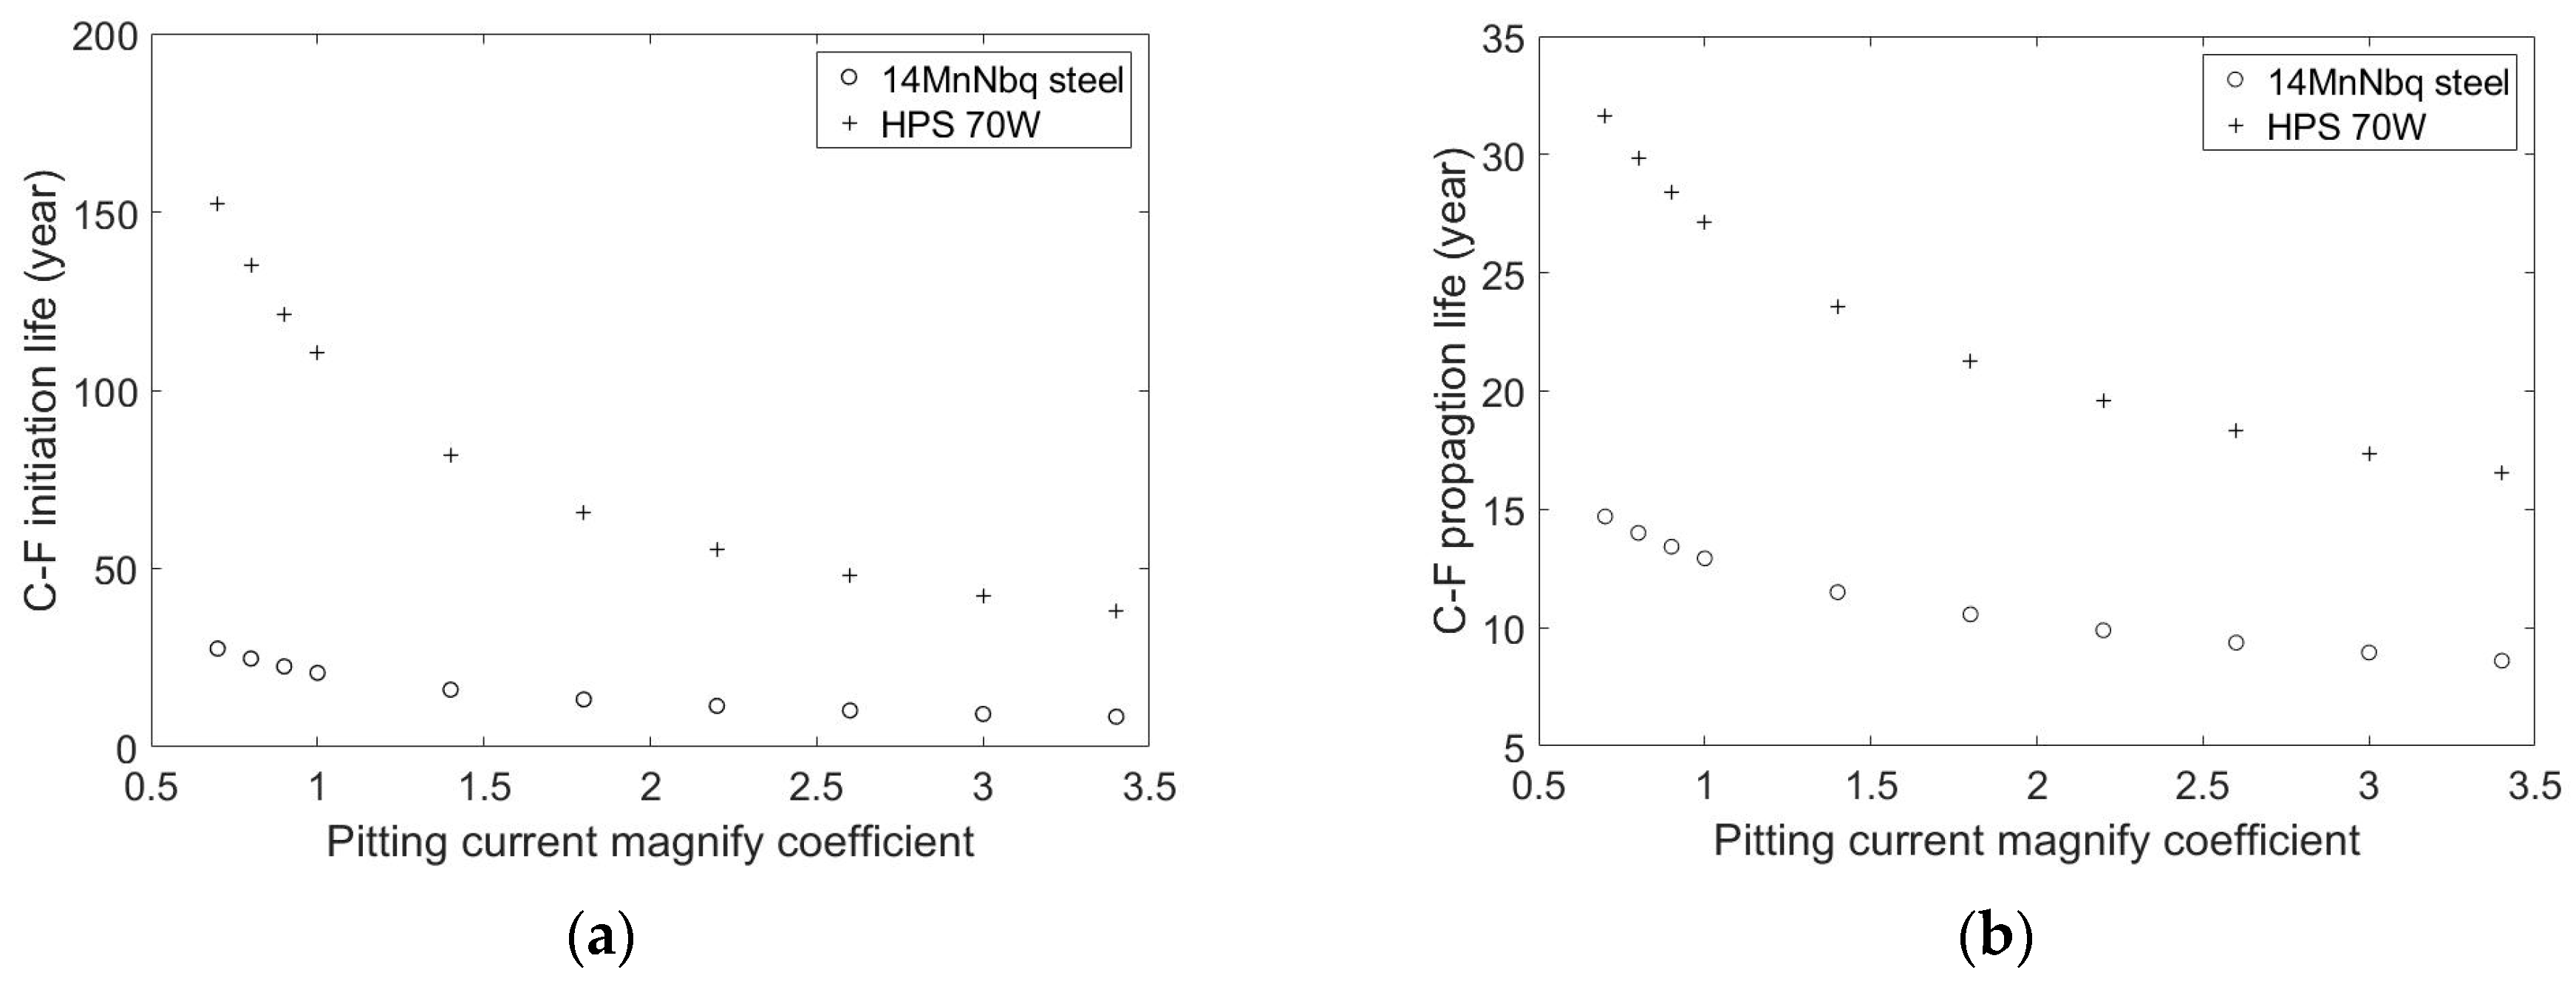
According to the result, when the pitting current magnify coefficient increased from 0.7 to 3.4, the whole C-F life was reduced by 70.2% in the HPS 70W steel and 59.6% in the 14MnNbq steel. However, even under the higher reduction rate, the C-F life in the HPS 70W was still far longer than that in the 14MnNbq under various pitting currents.
For further analysis, the influence of pitting current on the initiation life and the propagation life are shown in Figure 15a,b, respectively.
It could be found that with the increases in the pitting current, the initiation life was reduced by 74.9% in the HPS 70W and 69.2% in the 14MnNbq steel. Meanwhile, with the same change in the pitting current, the propagation life was reduced by 47.7% in the HPS 70W and 41.5% in the 14MnNbq steel. It could also be found that the difference in the initiation life between two types of steel was extremely high under the low pitting current. As the current increased, the difference gradually reduced to a relative stable value after the magnify coefficient reached 3.0. A similar trend could also be observed in terms of the propagation life. Meanwhile, it is worth noting that pitting corrosion could still dominate the C-F process for a while after the pitting depth reached the critical size, especially under the high pitting current. Therefore, it indicates that the high pitting current could lead to the result that the corrosion-induced growth rate was higher than the fatigue-induced rate when crack size was small.

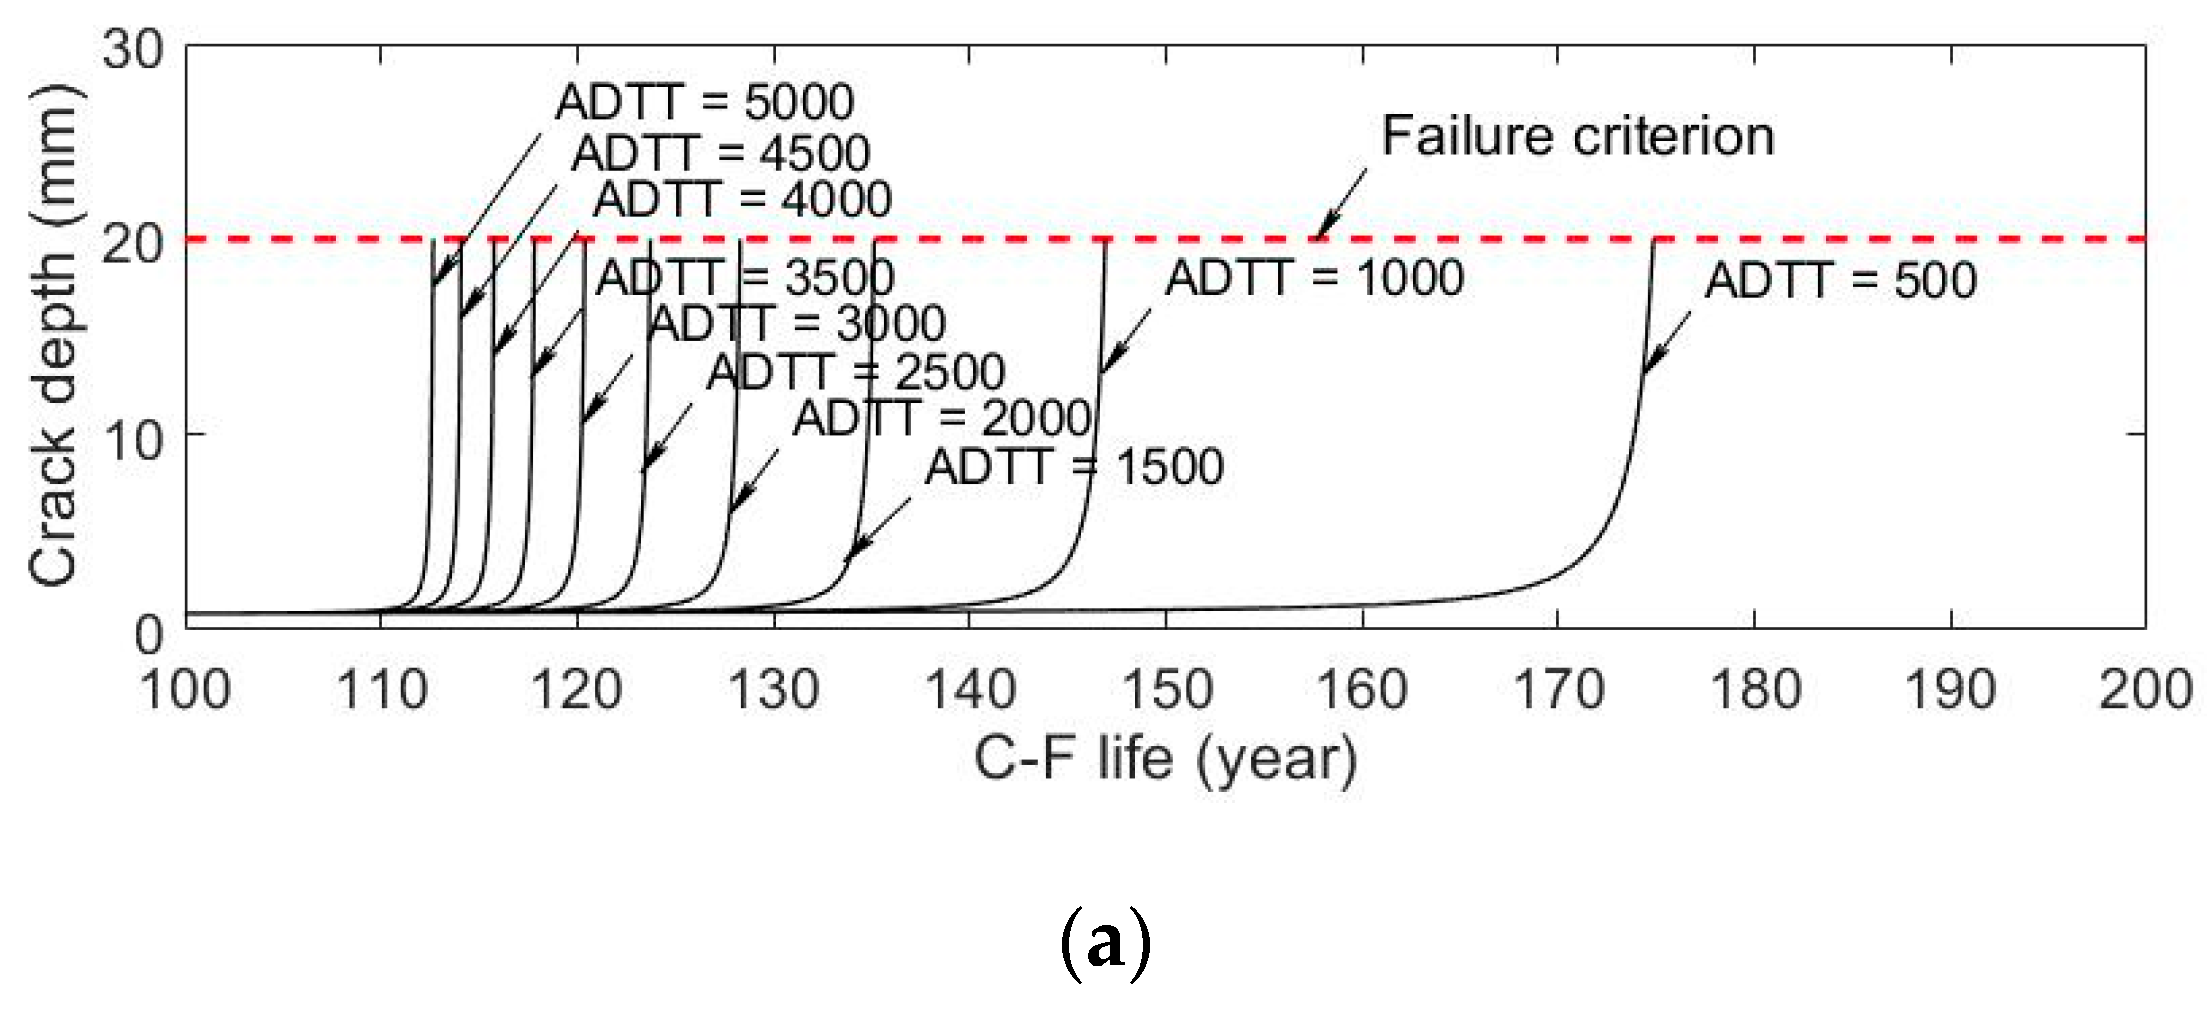
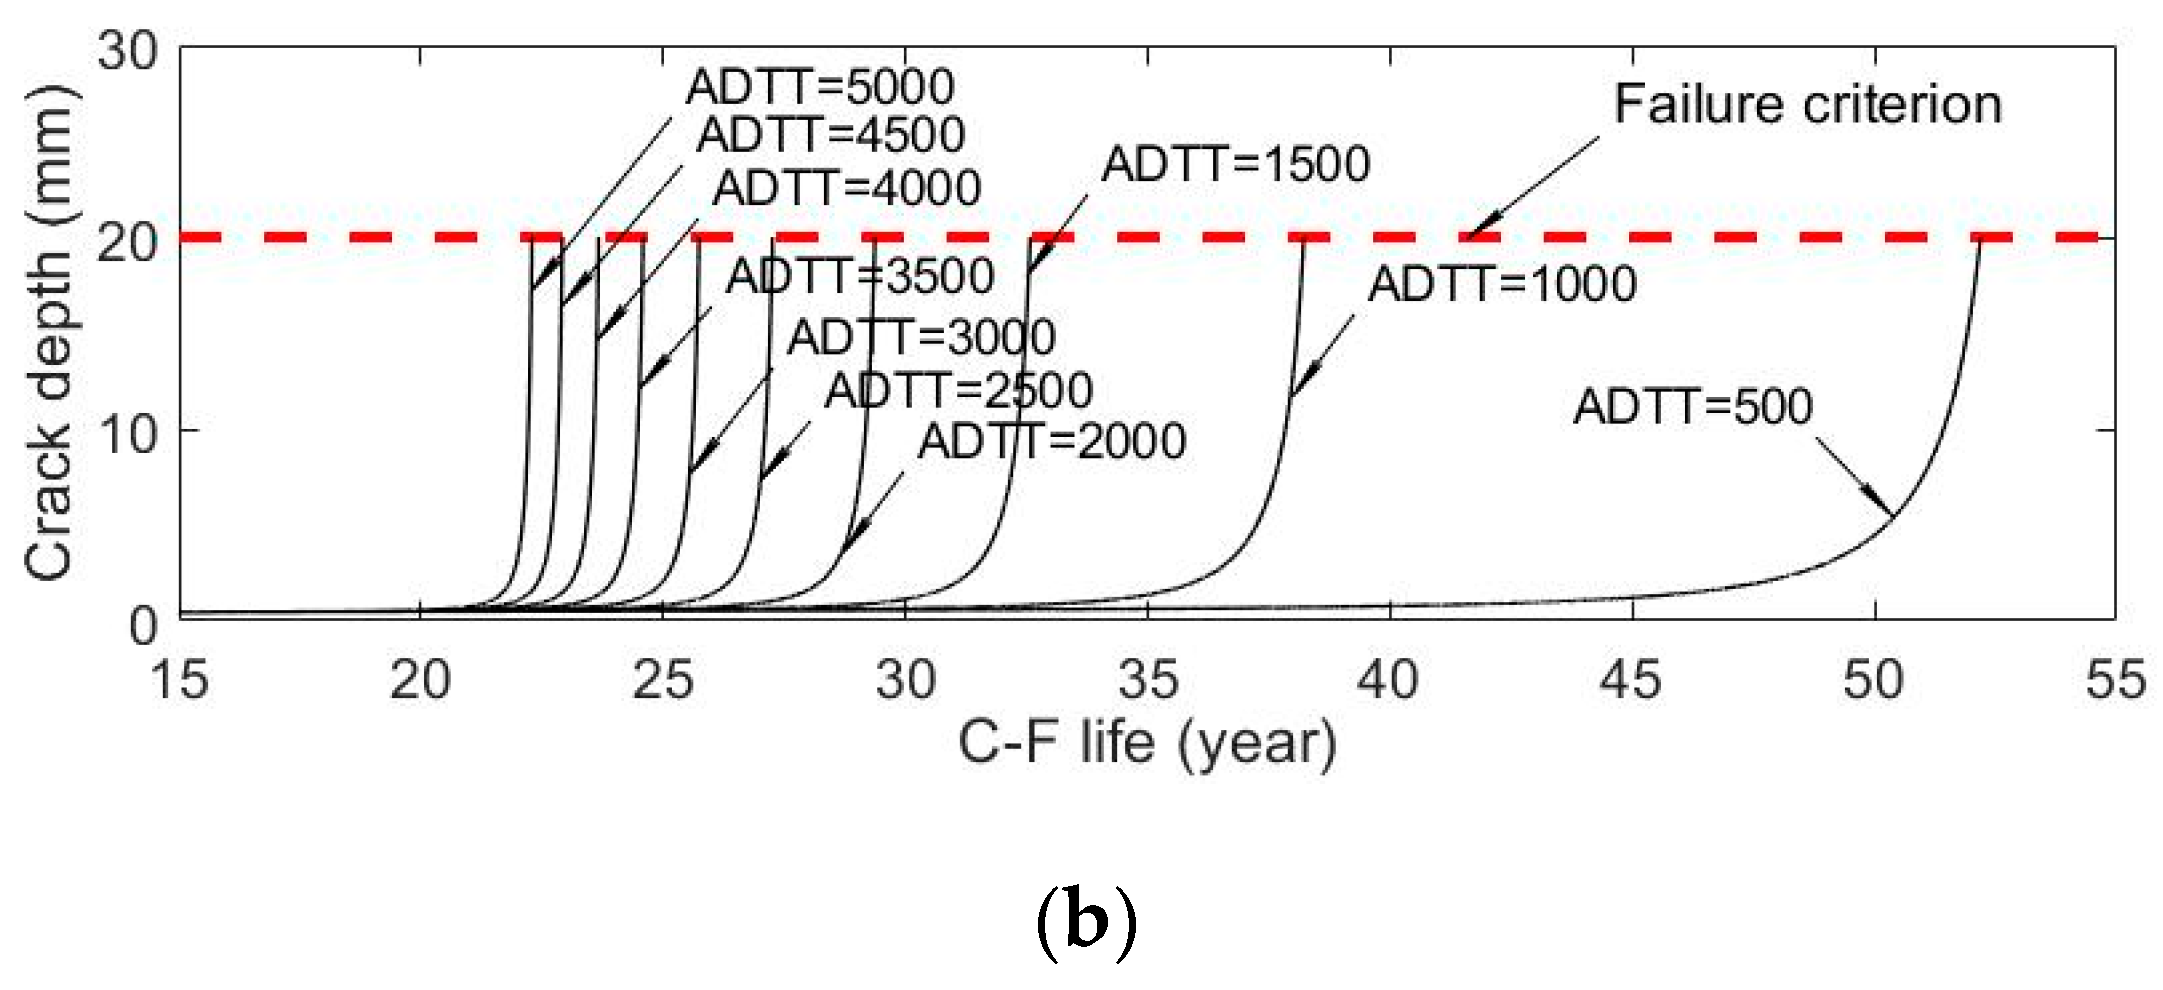
6.4. Influence of ADTT

The average daily truck traffic (ADTT) varied from 500 to 5000 in the analysis. The crack development was plotted against time, as shown in 
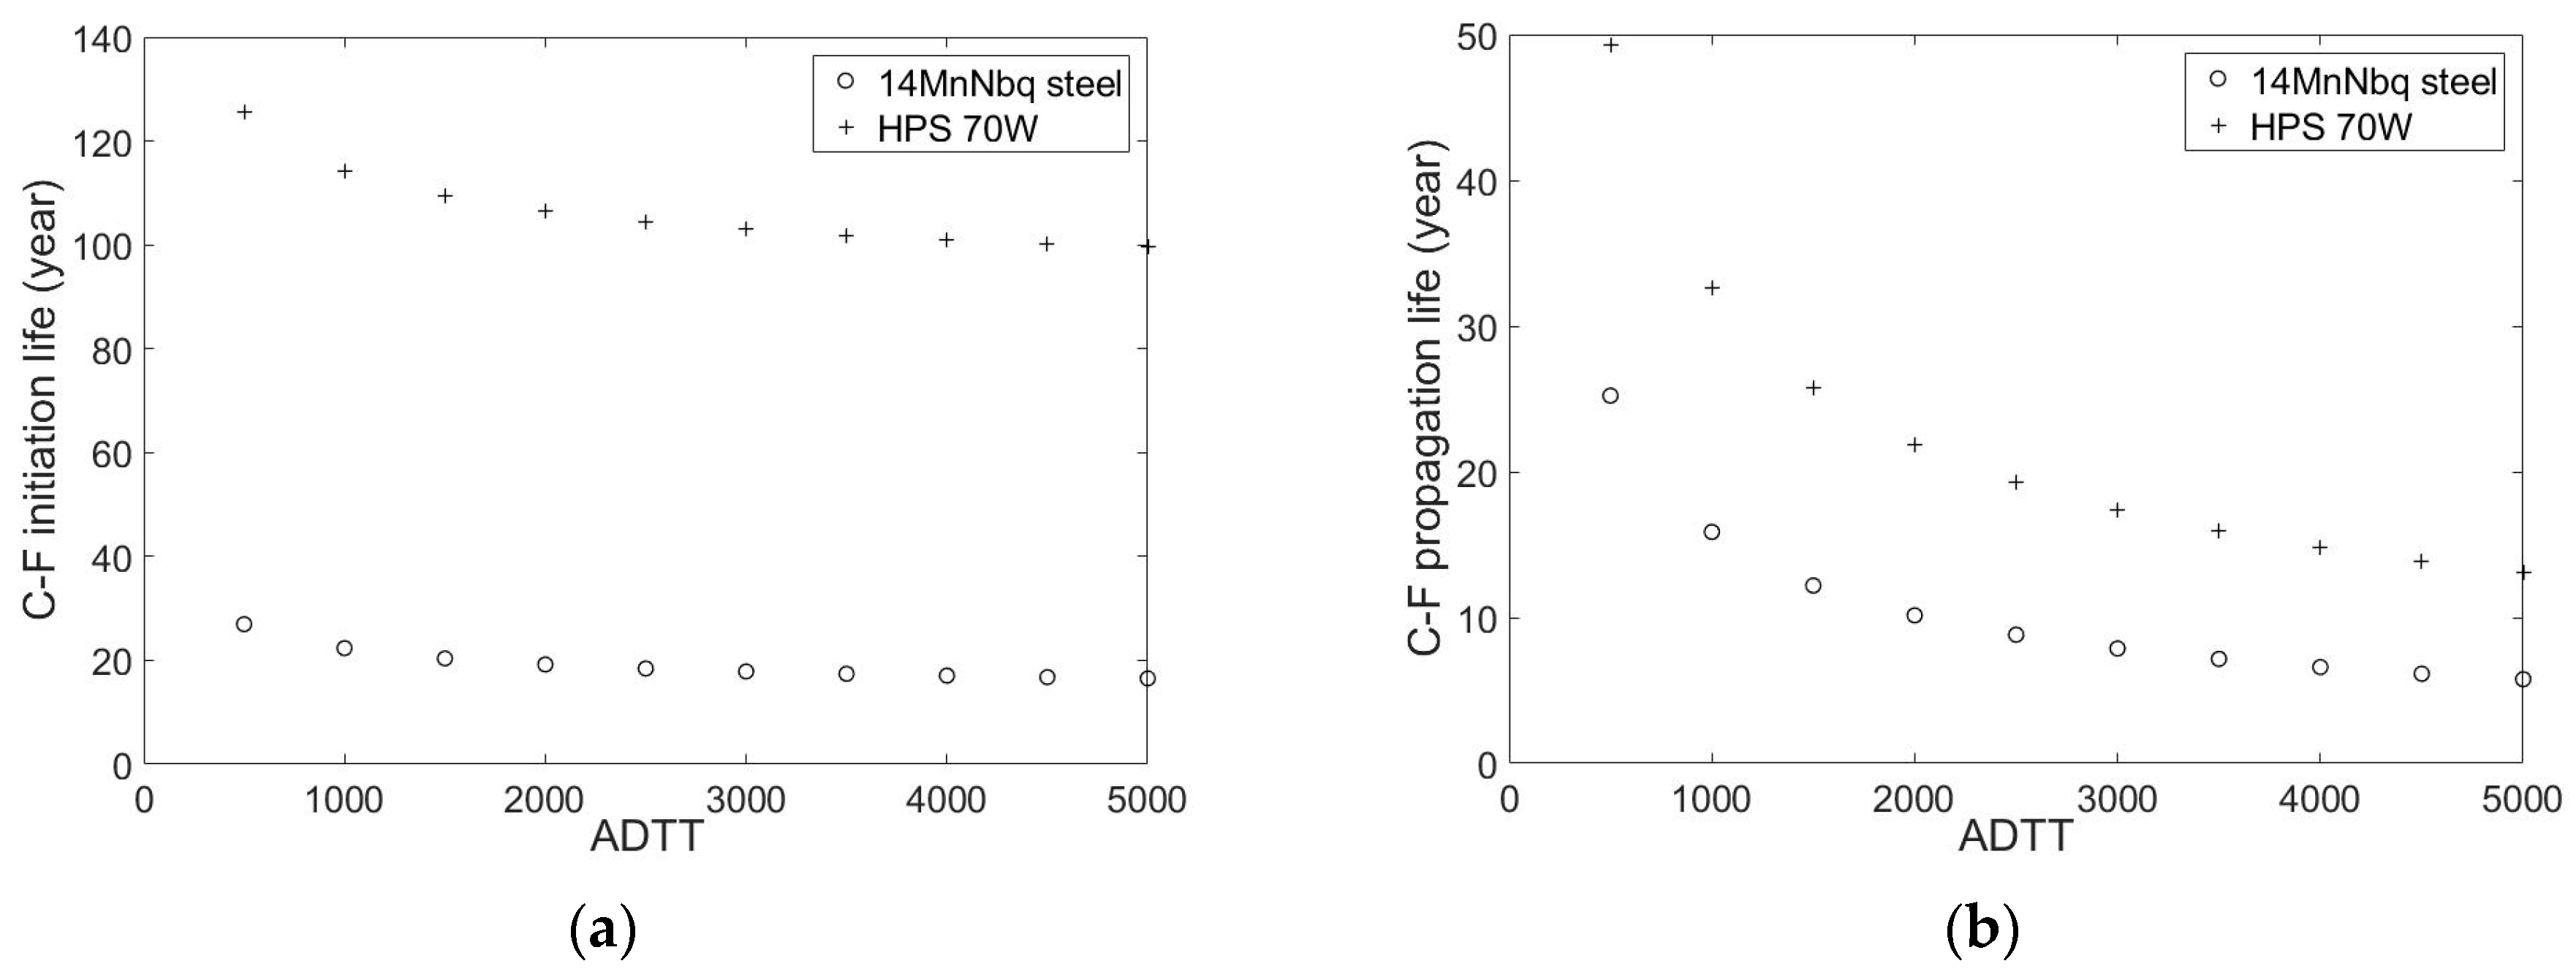
Figure 16. According to the result, when the ADTT increased from 500 to 5000, the whole C-F life was reduced by 35.5% in the HPS 70W and 57.3% in the 14MnNbq. However, even under the extremely high ADTT (i.e., 5000), the whole C-F life in the HPS 70W was still significantly higher than that in the 14MnNbq.
For further analysis, the influence of ADTT on the initiation life and the propagation life are shown in Figure 17a,b, respectively.
It could be found that with the increases in the ADTT, the propagation life was reduced by 73.4% in the HPS 70W and 77.1% in the 14MnMbq steel. Meanwhile, the initiation life was reduced by 20.7% in the HPS 70W and 38.7% in the 14MnMbq steel. Consequently, in addition to the notable impact on the propagation life, the ADTT also had a secondary effect on the initiation life in both types of steel. In this case, with the increase in the ADTT, the fatigue-related crack growth rate was increased. As a result, the competition time period t c was reduced, which in turn affected the initiation life.

7. Conclusions

The uncoated weathering steel (UWS) bridges become increasingly popular due to their advantages in both the lifetime cost and environment protection. However, the C-F issue is of particular concern in UWS bridges, which is further escalated by the designated corrosion process. On this end, a solid evaluation method is urgently required for the C-F process in UWS bridges to ensure the lifetime serviceability and, more important, safety. In this paper, an innovative model was established through combining the electrochemistry theory and fracture mechanics. The proposed model for C-F crack initiation was then validated using the experimental data in existing literatures. Based on the verified model, the case study was carried out on two typical types of structural steel, i.e., HPS 70W and 14MnNbq steel. Besides, investigations were also made on the effect of crucial C-F parameters, including the stress range, stress ratio, corrosive environment and average daily truck traffic (ADTT).
Based on the above analysis, the following conclusions could be drawn:
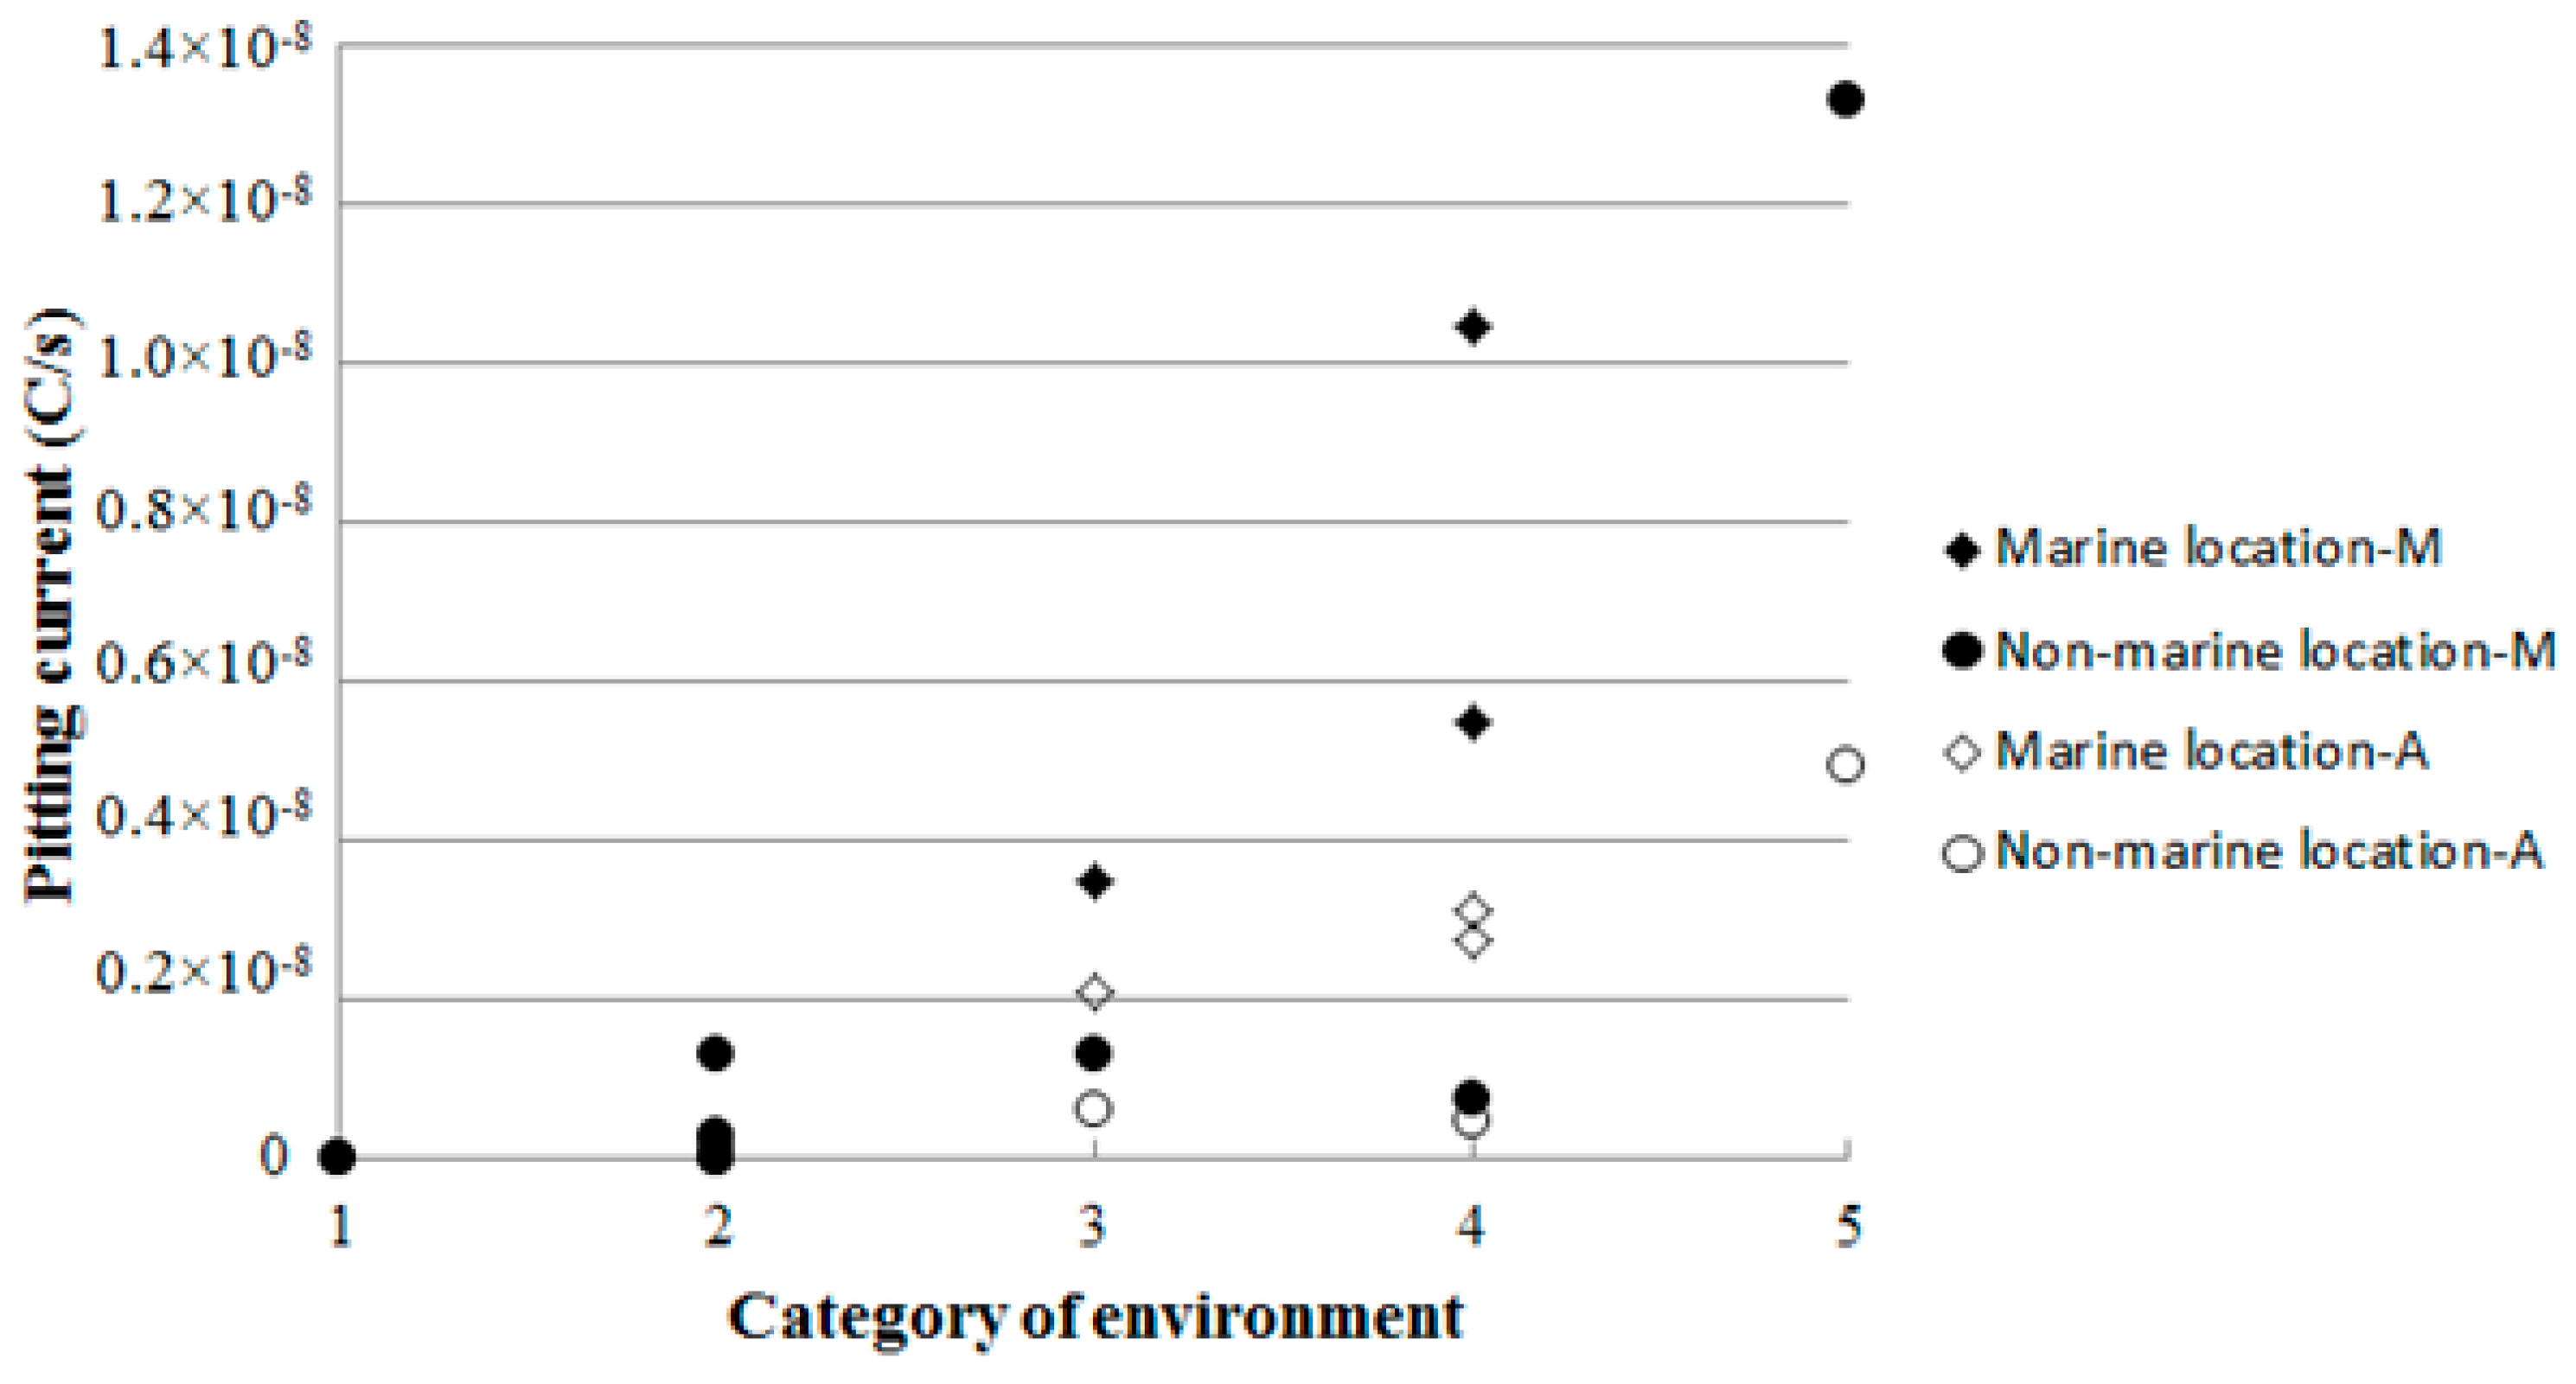
(1) Analysis was made to find out a suitable index to reflect the degree of corrosion, based on the experiment data collected at various places with different corrosion categories in China. As a result, a clear relation could be observed between the degree of corrosion and the pitting current, which were only related to the corrosion environment. Thus, the pitting current was utilized to reflect the degree of pitting corrosion in this study.
(2) An innovative model was established to simulate the C-F process in UWS bridges. The two stages in the C-F process were independently treated in series, i.e., the C-F crack initiation stage and the C-F crack propagation stage. Meanwhile, the critical pitting depth could serve as an indicator of the fatigue effect, which competed against the corrosion effect. At the C-F crack initiation stage, the pit could be regarded as an equivalent initial flaw that only grew under the corrosion. Once the flaw reached the critical size, the fatigue effect joined as a parallel driving force in crack propagation. The two effects then competed with each other, and the C-F process was dominated by the one with the higher growth rate. As a result, the fatigue effect gradually replaced the corrosion as the major driving force, which was the symbol of the C-F crack propagation stage, and the crack then grew under the cyclic stress until the final failure. In the study, the pitting corrosion process was considered through Faraday’s law, while fracture mechanics was employed to describe the propagation of fatigue cracks.
(3) The model proposed for the initiation stage and the whole C-F process was validated using the experimental data in the existing literatures. The result shows that the prediction curve matched well with the test data, indicating the effectiveness of the proposed method in predicting the C-F life.
(4) A case study was carried out on the bridge respectively constructed of two brands of steel, i.e., the normal steel 14MnNbq and the high-performance weathering steel HPS 70W. The result shows that when considering the coupled C-F process, the bridge with the HPS 70W had a remarkably higher service life than the one with the 14MnNbq. Besides, it also suggests that the C-F crack initiation stage accounted for the largest part in the whole C-F life, i.e., around 61.6%–80.3%.
(5) A sensitive analysis was conducted on various C-F parameters, including the stress range, stress ratio, corrosive environment and ADTT, on the C-F life of normal steel 14MnNbq and HPS 70W. The investigation was performed with respect to the influence on both the initiation life and propagation life. The result shows that stress range and stress ratio both had dramatic impacts on C-F life. Moreover, the C-F life decreased with the increase in the stress range and stress ratio. As an index of the corrosive environment, the pitting current only affected the C-F crack initiation life. Besides, the ADTT had a significant impact on the propagation life while its effect on the initiation life was just limited.

Author Contributions

Data collection, simulation, methodology, and writing—Original draft preparation, Y.Z.; supervision, project administration and funding acquisition, K.Z.; conceptualization, methodology and writing—Review and editing, J.H; writing—Review and editing, J.Z.

Funding

The research was funded by the National Natural Science Foundation of China (grant number: 51778536, 51908472), Doctoral Innovation Fund Program of Southwest Jiaotong University (grant number: D-CX201701), the Zhejiang Department of Transportation (grant number: 10115066), China postdoctoral science foundation (2019TQ0271).

Acknowledgments

The corresponding author gratefully acknowledges financial support from China Scholarship Council and British Council during studying in the UK. Special thanks to Sakdirat at the University of Birmingham, and European Commission for H2020-MSCA-RISE Project No. 691135 “RISEN: Rail Infrastructure Systems Engineering Net-work” (www.risen2rail.eu).

Conflicts of Interest

The authors declare no conflict of interest.

References

  1. Dolling, C.N.; Hudson, R.M. Weathering steel bridges. Proc. Inst. Civ. Eng. Bridge Eng. 2003, 156, 39–44. [Google Scholar] [CrossRef]
  2. Yamashita, M. Structure of protective rust layers formed on weathering steels by long-term exposure in the industrial atmospheres of America. ISIJ Int. 1998, 38, 285–290. [Google Scholar] [CrossRef]
  3. Yamaguchi, E. Assessment method for atmospheric corrosiveness and durability design of weathering steel bridges. In Proceedings of the 23rd US-Japan Bridge Engineering Workshop, Tsukuba, Japan, 5–7 November 2007. [Google Scholar]
  4. Yasumori, F.; Mutsuto, T.; Hiroshi, K.; Kazumi, M. Corrosion risk management methods to realize long-term durability of weathering steel bridges. Nippon Steel Tech. Rep. 2008, 387, 53. (In Japanese) [Google Scholar]
  5. Liu, Q.; Wang, B.; Wang, X. Research, application and prospect of weathering steel. In China Steel Structure Association Building Steel Structure Branch; Steel Construction: Guiyang, China, 2011; pp. 110–118. [Google Scholar]
  6. Horii, S.; Mishima, Y.; Hashimoto, M. Steel bridge quality management and weathering steel application technologies in Japan. In Proceedings of the IABSE-JSCE Joint Conference on Advances in Bridge Engineering-II, At Dhaka, Bangladesh, 21–22 August 2015; pp. 476–484. [Google Scholar]
  7. Kodur, V.K.R.; Naser, M.Z. Designing steel bridges for fire safety. J. Constr. Steel Res. 2019, 156, 46–53. [Google Scholar] [CrossRef]
  8. Wan, R.; Feng, S.; Zhang, L.; Shan, A. Effects of Mo on high-temperature strength of fire-resistant steel. Mater. Des. 2012, 35, 335–341. [Google Scholar] [CrossRef]
  9. Katherine, K.B. Performance of Weathering Steel in Highway Bridges; A Third Phase Report; American Iron and Steel Institute: Pittsburgh, PA, USA, 1995. [Google Scholar]
  10. Wu, Q.; Chen, X.; Fan, Z.; Nie, D.; Wei, R. Corrosion fatigue behavior of FV520B steel in water and salt-spray environments. Eng. Fail. Anal. 2017, 79, 422–430. [Google Scholar] [CrossRef]
  11. Jones, R. Fatigue crack growth and damage tolerance. Fatigue Fract. Eng. Mater. Struct. 2014, 37, 463–483. [Google Scholar] [CrossRef]
  12. Ali, K.; Peng, D.; Jones, R.; Singh, R.R.K.; Zhao, X.; Mcmillan, A.J.; Berto, F. Crack growth in a naturally corroded bridge steel. Fatigue Fract. Eng. Mater. Struct. 2017, 40, 1117–1127. [Google Scholar] [CrossRef]
  13. Jun, H.K.; Seo, J.W.; Kwon, S.J.; Lee, D.H.; Park, S.H. Effect of corrosion on the fatigue life of aged EMU under fatigue loading. Int. J. Precis. Eng. Manuf. 2016, 17, 73–79. [Google Scholar] [CrossRef]
  14. Kunz, L.; Luká, P.; Klusák, J. Fatigue Strength of Weathering steel. Mater. Sci. 2012, 18, 18–22. [Google Scholar] [CrossRef]
  15. Albrecht, P.; Lenwari, A. Fatigue strength of weathered A588 steel beams. J. Bridge Eng. 2009, 14, 436–443. [Google Scholar] [CrossRef]
  16. Kondo, Y. Prediction of fatigue crack initiation life based on pit growth. Corrosion 1989, 45, 7–11. [Google Scholar] [CrossRef]
  17. Zampieri, P.; Curtarello, A.; Maiorana, E.; Pellegrino, C. A Review of the Fatigue Strength of Shear Bolted Connections. Int. J. Steel Struct. 2019, 19, 1084–1098. [Google Scholar] [CrossRef]
  18. Zampieri, P.; Curtarello, A.; Maiorana, E.; Pellegrino, C. Fatigue strength of corrode bolted connection. Frat. Integrità Strutt. 2018, 43, 90–95. [Google Scholar]
  19. Zampieri, P.; Curtarello, A.; Maiorana, E.; Pellegrino, C. Numerical analyses of corroded bolted connections. Procedia Struct. Integr. 2017, 5, 592–599. [Google Scholar] [CrossRef]
  20. Xu, S.H.; Qiu, B. Experimental study on fatigue behavior of corroded steel. Mater. Sci. Eng. A 2013, 584, 163–169. [Google Scholar] [CrossRef]
  21. Garbatov, Y.; Guedes, S.C.; Parunov, J. Fatigue strength experiments of corroded small scale steel specimens. Int. J. Fatigue 2014, 59, 137–144. [Google Scholar] [CrossRef]
  22. Ebara, R. Corrosion fatigue crack initiation in 12% chromium stainless steel. Mater. Sci. Eng. A 2007, 468, 109–113. [Google Scholar] [CrossRef]
  23. Ishihara, S.; Saka, S.; Nan, Z.; Goshima, T.; Sunada, S. Prediction of corrosion fatigue lives of aluminium alloy on the basis of corrosion pit growth law. Fatigue Fract. Eng. Mater. Struct. 2010, 29, 472–480. [Google Scholar] [CrossRef]
  24. Li, S.; Akid, R. Corrosion fatigue life prediction of a steel shaft material in seawater. Eng. Fail. Anal. 2013, 34, 324–334. [Google Scholar] [CrossRef]
  25. Peng, D.; Jones, R. Effect of corrosion and fatigue on the remaining life of structure and its implication to additive manufacturing. Frat. Integrità Strutt. 2018, 45, 33–44. [Google Scholar]
  26. Peng, D.; Jones, R.; Singh, R.R.K.; Berto, F.; McMillan, A.J. On the interaction between corrosion and fatigue which determines the remaining life of bridges. Fatigue Fract. Eng. Mater. Struct. 2017, 41, 314–322. [Google Scholar] [CrossRef]
  27. Tamaki, Y.; Shimozato, T.; Arizumi, Y. Evaluation of corrosion deterioration of weathering steel bridge under the environment corrosiveness. In Proceedings of the 5th International Conference on Bridge. Maintenance, Safety, Management and Life-Cycle Optimization, Philadelphia, PA, USA, 11–15 July 2010; pp. 3563–3569. [Google Scholar]
  28. Jyoti, B.; Faisal, K.; Rouzbeh, A.; Vikram, G.; Roberto, O. Modelling of pitting corrosion in marine and offshore steel structures—A technical review. J. Loss Prev. Process Ind. 2015, 37, 39–62. [Google Scholar]
  29. Mazánová, V.; Polák, J. Initiation and growth of short fatigue cracks in austenitic sanicro 25 steel. Fatigue Fract. Eng. Mater. Struct. 2018, 26, 1529–1545. [Google Scholar] [CrossRef]
  30. Polak, J.; Liskutin, P. Nucleation and short crack growth in fatigued polycrystalline copper. Fatigue Fract. Eng. Mater. Struct. 1990, 13, 119–133. [Google Scholar] [CrossRef]
  31. Zaya, P.G.R. Evaluation of Theiores for the Initial Stages of Pitting Corrosion. Ph.D. Thesis, McMaster University, Hamilton, ON, Canada, 1984. [Google Scholar]
  32. Melchers, R.E. Pitting Corrosion in Marine Environments: A Review; Department of Civil Engineering and Surveying, University of Newcastle, Australia: Newcastle, Australia, 1994. [Google Scholar]
  33. Abood, T.H. The Influence of Various Parameters on Pitting Corrosion of 316L and 202 Stainless Steel; Department of Chemical Engineering of the University of Technology: Baghdad, Iraq, 2008. [Google Scholar]
  34. Agar, J.N.; Hoar, T.P. The influence of change of size in electrochemical systems. Discuss. Faraday Soc. 1947, 1, 158–162. [Google Scholar] [CrossRef]
  35. Sriraman, M.R.; Pidaparti, R.M. Crack initiation life of materials under combined pitting corrosion and cyclic loading. J. Mater. Eng. Perform. 2010, 19, 7–12. [Google Scholar] [CrossRef]
  36. Albrecht, P.; Naeemi, A.H. Performance of Weathering Steel in Bridges; NCHRP Report; NCHRP: Washington, DC, USA, 1984. [Google Scholar]
  37. McKenzie, M. The corrosion performance of weathering steel in highway bridges. In Atmospheric Corrosion, The Electrochemical Society; Ailor, W.H., Ed.; John Wiley and Sons: New York, NY, USA, 1982; pp. 717–736. [Google Scholar]
  38. Huang, X.-G.; Xu, J.-Q. Pit morphology characterization and corrosion fatigue crack nucleation analysis based on energy principle. Fatigue Fract. Eng. Mater. Struct. 2012, 35, 606–613. [Google Scholar]
  39. Harlow, D.G.; Wei, R.P. Probabilities of occurrence and detection of damage in airframe materials. Fatigue Fract. Eng. Mater. Struct. 2010, 22, 427–436. [Google Scholar] [CrossRef]
  40. Newman, J.C.; Raju, I.S. An empirical stress-intensity factor equation for the surface crack. Eng. Fract. Mech. 1976, 15, 185–192. [Google Scholar] [CrossRef]
  41. ISO 9223. Corrosion of Metals and Alloys-Corrosion of Atmospheres-Classification, Determination and Estimation; International Organization for Standardization: Geneva, Switzerland, 2012. [Google Scholar]
  42. China Gateway to Corrosion and Protection. Available online: http://www.ecorr.org/ (accessed on 10 April 2019).
  43. Paris, P.; Erdogan, F. A Critical analysis of crack propagation laws. Trans. ASME 1963, 85, 528–533. [Google Scholar] [CrossRef]
  44. Chen, H.; Grondin, G.; Driver, R.G. Fatigue Resistance of High Performance Steel; University of Alberta Department of Civil Environmental Engineering: Edmonton, AB, Canada, 2005. [Google Scholar]
  45. Chen, G.; Wan, K.; Gao, M.; Wei, R.; Flournoy, T.H. Transition from pitting to fatigue crack growth—Modeling of corrosion fatigue crack nucleation in a 2024-T3 aluminum alloy. Mater. Sci. Eng. A 1996, 219, 126–132. [Google Scholar] [CrossRef]
  46. Harlow, D.G.; Wei, R.P. Probability approach for prediction of corrosion and corrosion fatigue life. AIAA J. 1994, 32, 2073–2079. [Google Scholar]
  47. Mao, M.; Zhang, X.; Tu, S.; Xuan, F. Prediction of crack initiation life due to corrosion pits. J. Aircr. 2014, 51, 805–810. [Google Scholar] [CrossRef]
  48. Kaynak, C.; Ankara, A.; Baker, T.J. A comparison of short and long fatigue crack growth in steel. Int. J. Fatigue 1996, 18, 17–23. [Google Scholar] [CrossRef]
  49. American Society for Testing Materials. Standard Specification for Structural Steel for Bridges; Designation: A709/A709M; American Society for Testing Materials: West Conshohocken, PA, USA, 2013. [Google Scholar]
  50. Liu, Y.; Chen, C.; Li, G.Q. Fatigue crack growth and control of 14MnNbq welding plates used for bridges. J. Eng. Mech. 2012, 138, 30–35. [Google Scholar] [CrossRef]
  51. Wang, C.; Duan, L.; Li, Z.; Hu, J. Fatigue crack growth rate tests of high performance steel HPS 485W for bridges. Eng. Mech. 2013, 30, 212–216. [Google Scholar]
  52. Liu, Y.; Chen, C.; Li, G. Study on the surface crack growth behavior in 14MnNbq bridge steel. Acta Mech. Solida Sin. 2010, 23, 361–369. [Google Scholar] [CrossRef]
  53. Phillips, E.P.; Newman, J.C. Impact of small-crack effects on design life calculations. Exp. Mech. 1989, 29, 221–225. [Google Scholar] [CrossRef]
  54. Ahmed, T.M.; Tromans, D. Fatigue threshold behavior of α-phase copper alloys in desiccated air: Modulus effects. Int. J. Fatigue 2004, 26, 641–649. [Google Scholar] [CrossRef]
  55. Sobieck, T.; Atadero, R.A.; Mahmoud, H.N. Fatigue crack propagation of notched steel rebar in RC beams repaired with externally bonded CFRP. J. Compos. Constr. 2015, 19, 04014076. [Google Scholar] [CrossRef]
  56. Newman, J.C., Jr.; Raju, I.S. Analyses of Surface Cracks in Finite Plates Under Tension or Bending Loads; NASA TP-1578; NASA: Washington, DC, USA, 1979.
  57. Albrecht, P. Fatigue Strength of A588 Steel Beams; Department of Civil Engineering, University of Maryland: College Park, MD, USA, 1988. [Google Scholar]
  58. Standardization Administration of the People’s Republic of China (SAC). Specifications for Design of Highway Steel Bridge; JTG D64-2015; Standards Press of China: Beijing, China, 2015. (In Chinese) [Google Scholar]
  59. European Committee for Standardization (CEN). Eurocode 1: Actions on Structures—Part2: Traffic Loads on Bridges; BS EN 1991-2:2003; CEN: Brussels, Belgium, 2003. [Google Scholar]
  60. Thierry, P.L.; Rubén, P.M.; Claude, B.; Gonzalo, D. Fatigue crack initiation and growth on a steel in the very high cycle regime with sea water corrosion. Eng. Fract. Mech. 2010, 77, 1953–1962. [Google Scholar]
Figure 1. Typical fatigue crack in uncoated weathering steel bridges.
Applsci 09 03461 g001
Figure 2. Illustration of the pitting corrosion.
Applsci 09 03461 g002
Figure 3. Pitting current in different corrosivity categories.
Applsci 09 03461 g003
Figure 4. Schematic stages of corrosion-fatigue (C-F).
Applsci 09 03461 g004
Figure 5. C-F initiation life of selected materials under various stress ranges: (a) 2014-T3 aluminum alloy and (b) 12% Cr stainless steel.
Applsci 09 03461 g005
Figure 6. C-F life of the selected precipitation hardening steel.
Applsci 09 03461 g006
Figure 7. Critical pitting depth of the steel 14MnNbq with different plate thicknesses: (a) 20 mm; (b) 30 mm; (c) 40 mm and (d) 50 mm.
Applsci 09 03461 g007
Figure 8. Critical pitting depth of the steel HPS 70W with different plate thicknesses: (a) 20 mm; (b) 30 mm; (c) 40 mm and (d) 50 mm.
Applsci 09 03461 g008aApplsci 09 03461 g008b
Figure 9. Crack development in the C-F process: (a) 20 mm and (b) 50 mm.
Applsci 09 03461 g009
Figure 10. Crack development under various stress ranges: (a) HPS 70W and (b) 14MnNbq.
Applsci 09 03461 g010
Figure 11. Impact of stress range on the C-F life: (a) Initiation life and (b) propagation life.
Applsci 09 03461 g011
Figure 12. Crack development under various stress ratios: (a) HPS 70W and (b) 14MnNbq.
Applsci 09 03461 g012
Figure 13. Impact of the stress ratio on the C-F life: (a) Initiation life and (b) propagation life.
Applsci 09 03461 g013
Figure 14. Crack development under various pitting currents: (a) HPS 70W and (b) 14MnNbq.
Applsci 09 03461 g014
Figure 15. Impact of pitting current on the C-F life: (a) Initiation life and (b) propagation life.
Applsci 09 03461 g015
Figure 16. Crack development under different average daily truck traffic (ADTT): (a) HPS 70W and (b) 14MnNbq.
Applsci 09 03461 g016aApplsci 09 03461 g016b
Figure 17. Impact of stress ADTT on C-F life: (a) Initiation life and (b) propagation life.
Applsci 09 03461 g017
Table 1. Pitting corrosion data of weathering steel collected for 8 years.
Location (Category)Average Corrosion Rate (μm/a)Average Pit Depth (μm)Maximal Pit Depth (μm)Average Pitting Current (C/s)Maximal Pitting Current (C/s)
Wuhan (C4)91301504.93 × 10−107.58 × 10⁻¹⁰
Beijing (C3)81401806.16 × 10−101.31 × 10⁻⁹
Jiangjin (C5)182803904.93 × 10−91.33 × 10⁻⁸
Lhasa (C1)120301.80 × 10−126.06 × 10⁻¹²
Mohe (C2)3.520401.80 × 10−121.44 × 10⁻¹¹
Xishuangbanna (C2)9701107.70 × 10−115.48 × 10⁻⁹
Shenyang (C2)81001802.25 × 10−103.51 × 10⁻⁹
Qingdao (C4)182403603.10 × 10−91.05 × 10⁻⁸
Guangzhou (C4)15.52302902.73 × 10−95.48 × 10⁻⁹
Qionghai (C3)102102502.08 × 10−93.51 × 10⁻⁹
Table 2. Parameters for the selected aluminum alloy and stainless steel.
MaterialBCpIp (C/s) m a s p Δ K t h   ( M P a m )
Aluminum alloy2.55 × 10−41.001–1.021.83 × 10−91.02.32
Stainless steel2.61 × 10−41.005–1.011.51 × 10−101.08.14
Table 3. Parameters for the selected steel material.
BCp m a s p Δ K t h   ( M P a m )
2.60 × 10−41.011.01.2
Table 4. Chemical composition of the selected steel.
ElementHPS 70W14MnNbq
C0.11 max0.11–0.17
Mn1.10–1.501.20–1.60
P0.020 max0.025 max
S0.006 max0.015 max
Si0.30–0.500.20–0.60
Cu0.25–0.40-
Ni0.25–0.40-
Cr0.45–0.70-
Mo0.02–0.08-
V0.04–0.08-
Al0.010–0.040-
N0.015 max-
Table 5. Fatigue limit for long cracks in the selected steel.
SteelStress Ratio Δ K t h   ( M P a m )
HPS 70W0.107.22
14MnNbq0.056.67
0.255.14
0.503.32
Table 6. Decreased fatigue limits and fracture toughness of the selected steel.
SteelStress Ratio Δ K t h r   ( M P a m ) A   ( M P a m )
HPS 70W0.05.5120
0.83.8120
14MnNbq0.055.5100
Table 7. Stress intensity factor (SIF) threshold for fatigue crack propagation and initiation and their material parameter α.
MaterialStage Δ K t h , 0   ( M P a m ) α
HPS 70WPropagation7.510.386
Initiation5.500.386
14MnNbqPropagation7.031.060
Initiation5.801.060

