Surface Erosion Analysis for Thermal Insulation Materials of Graphite and Carbon–Carbon Composite


Abstract
1. Introduction
2. Materials and Methods
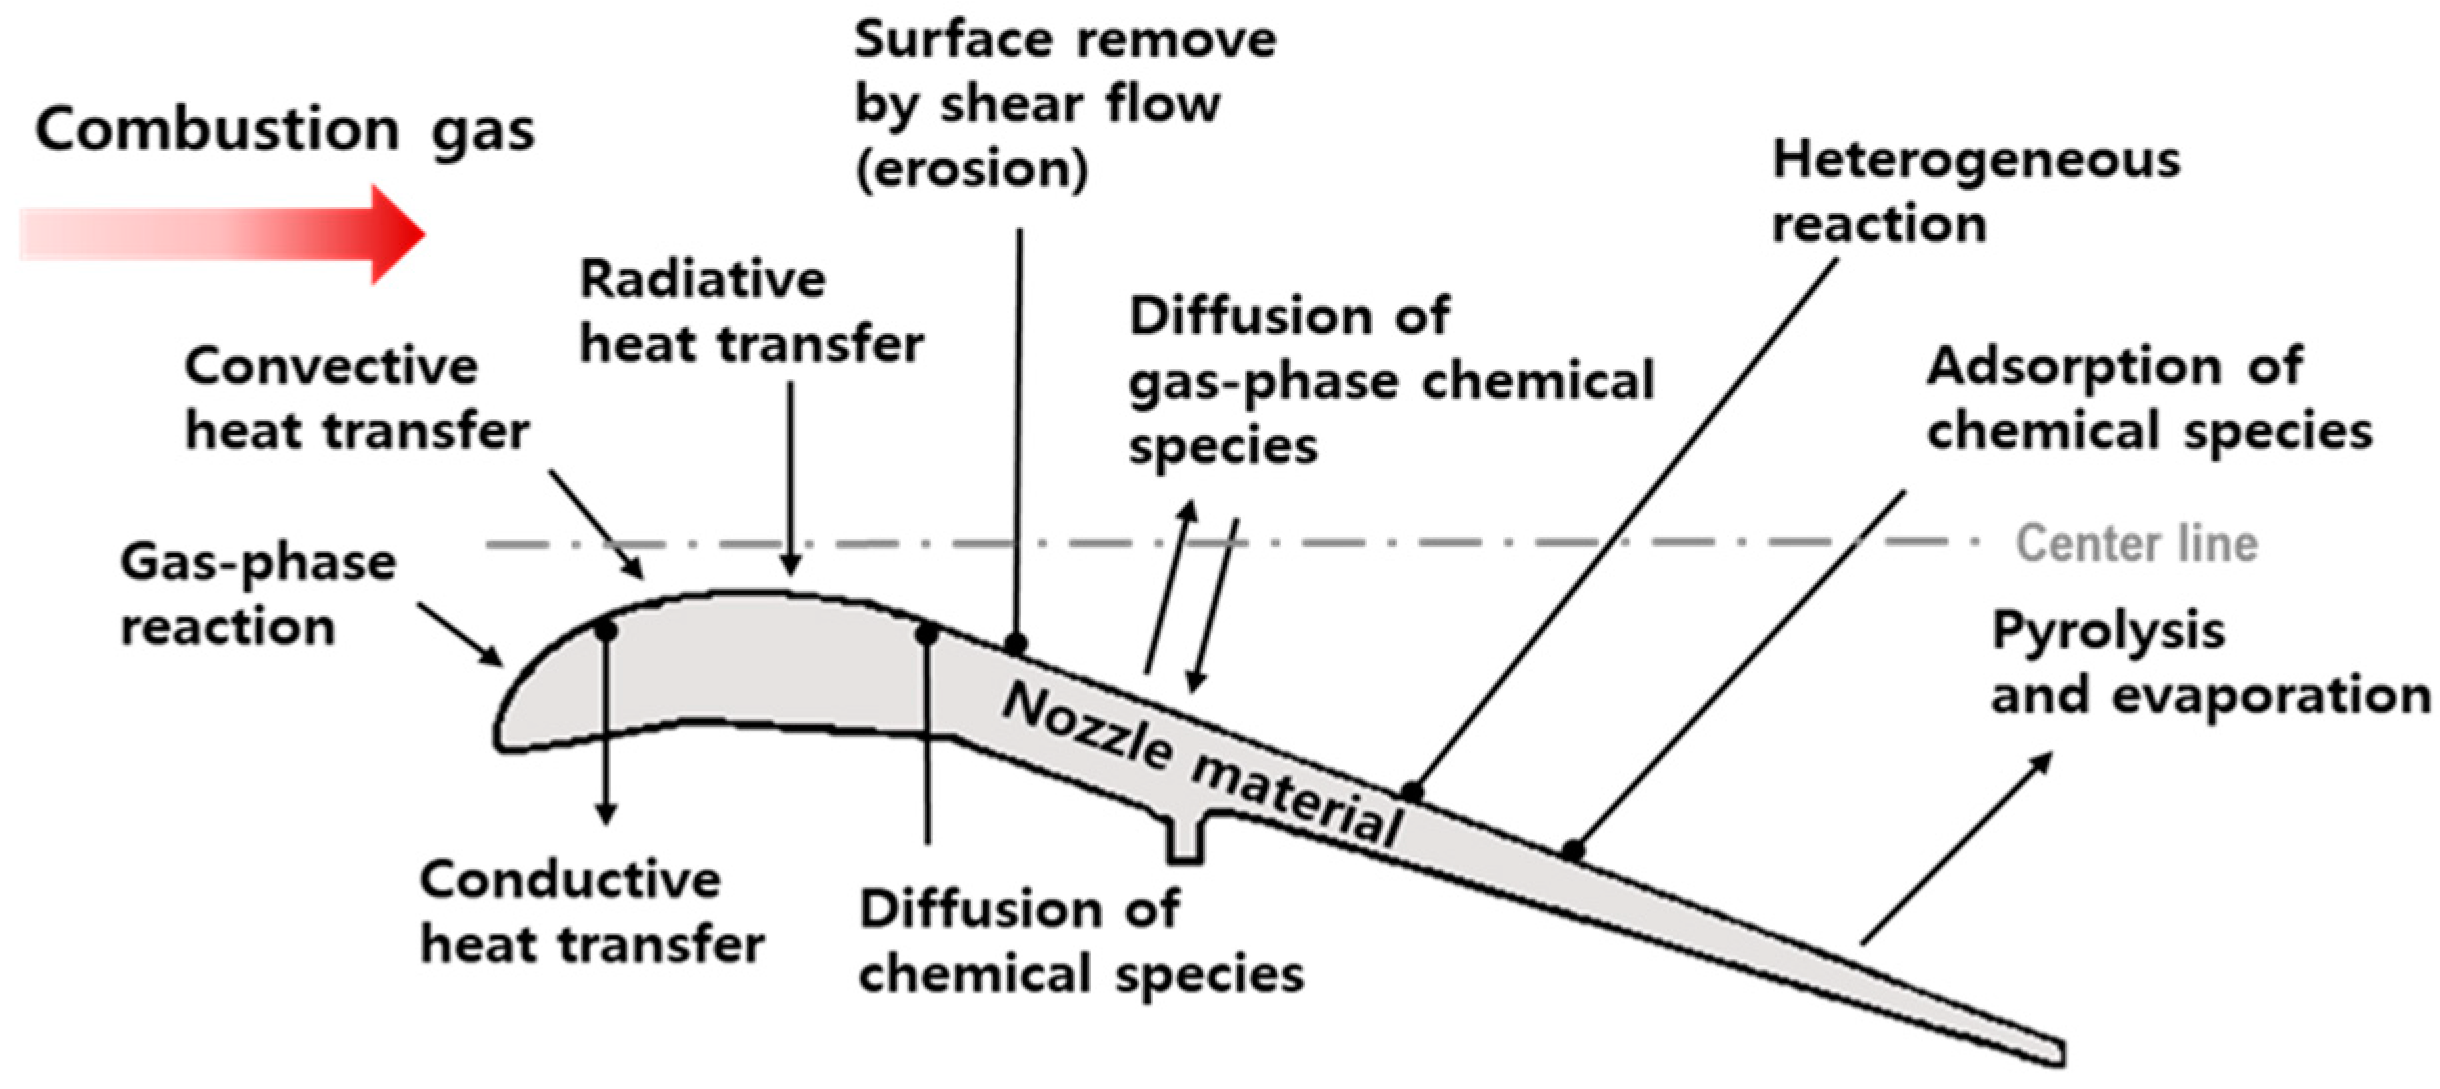
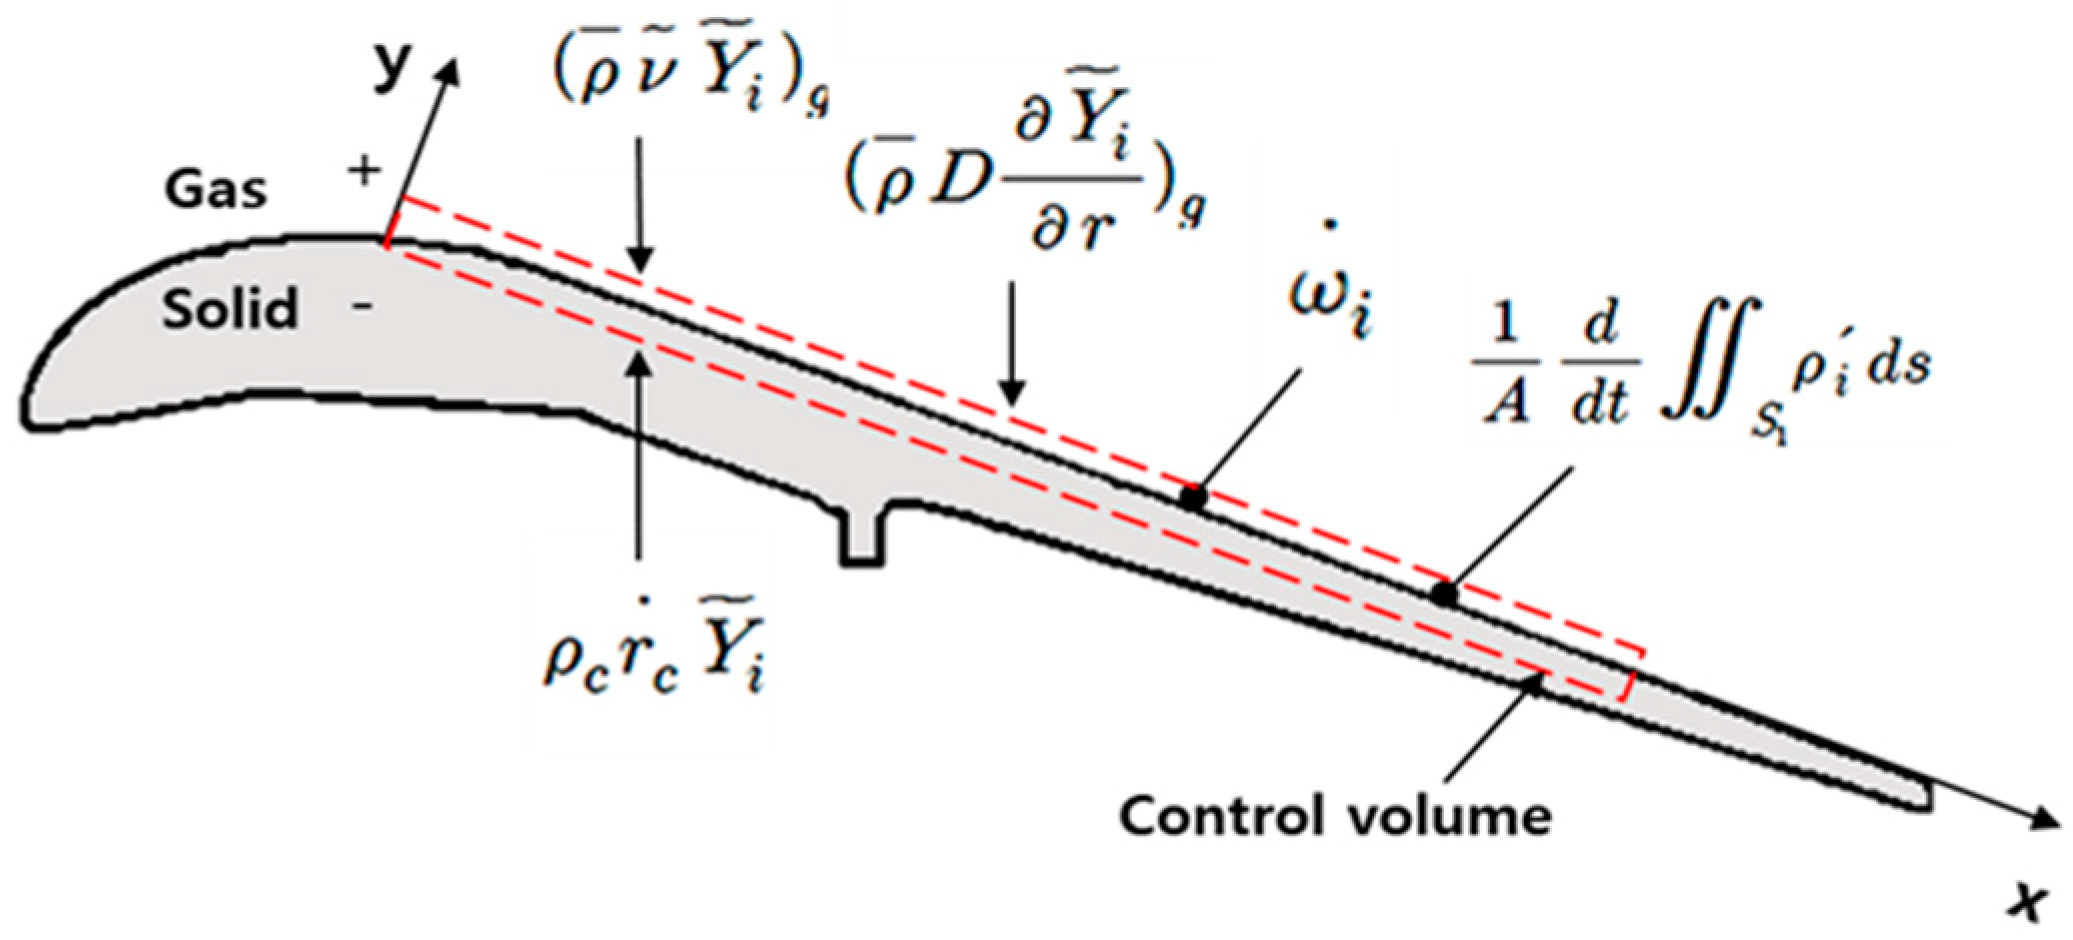
2.1. Theoretical Erosion Model
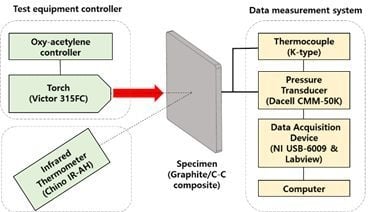
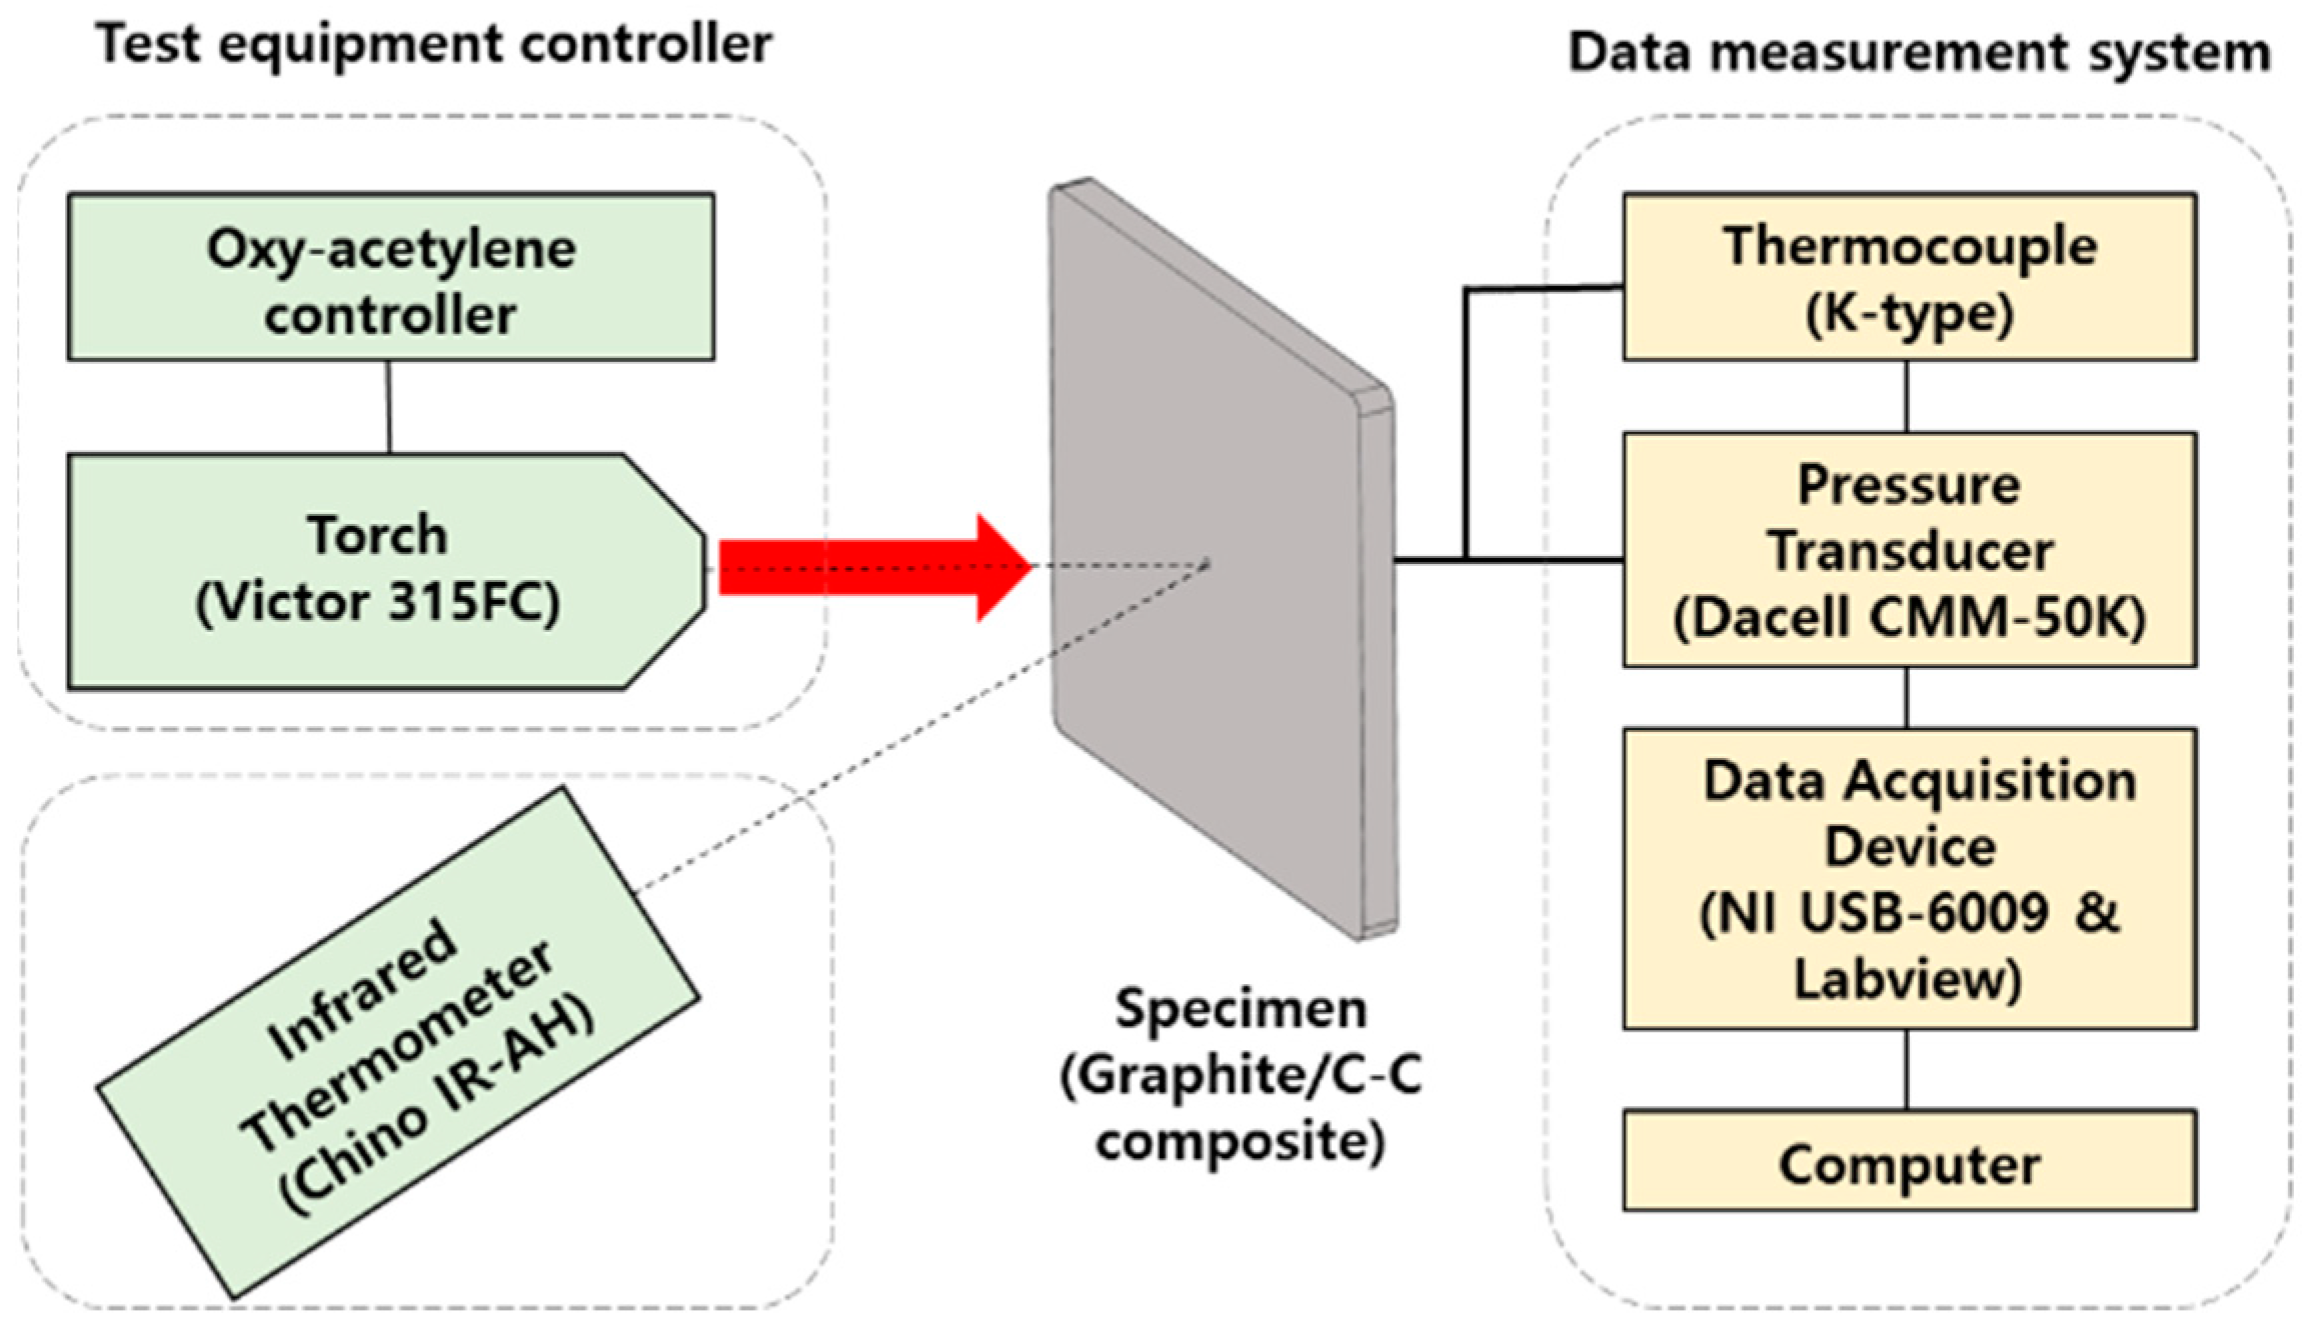
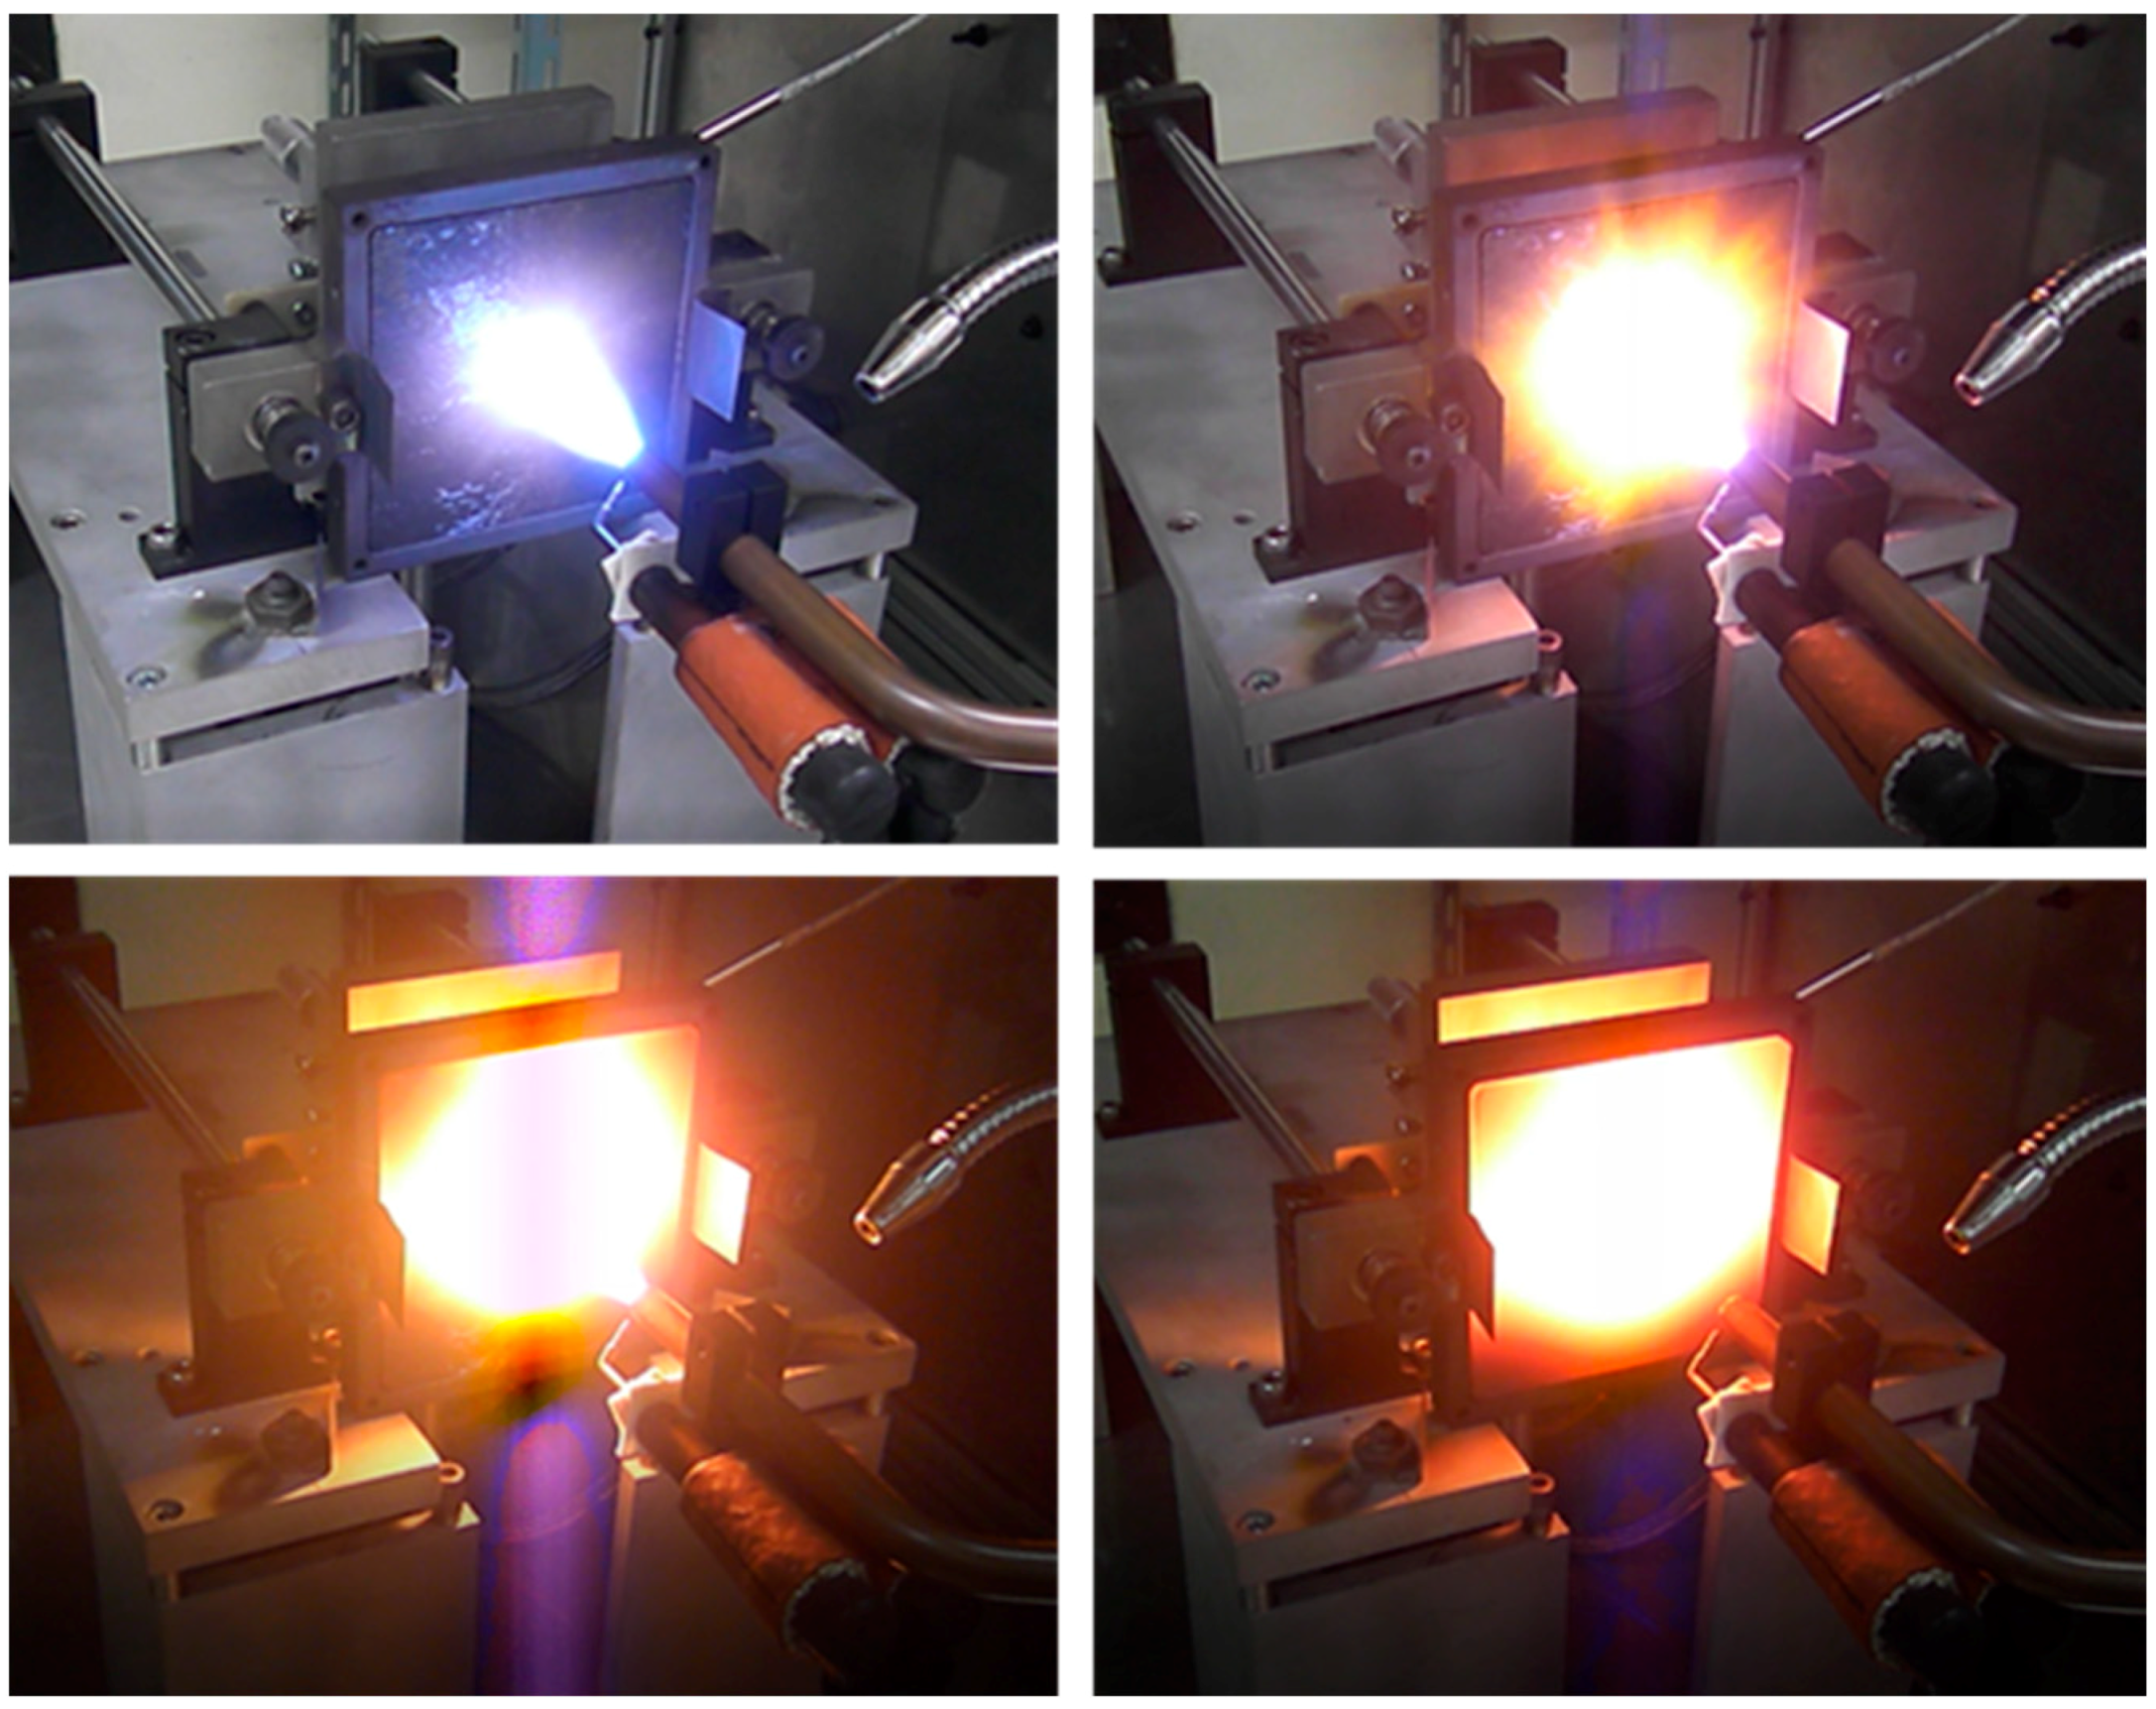
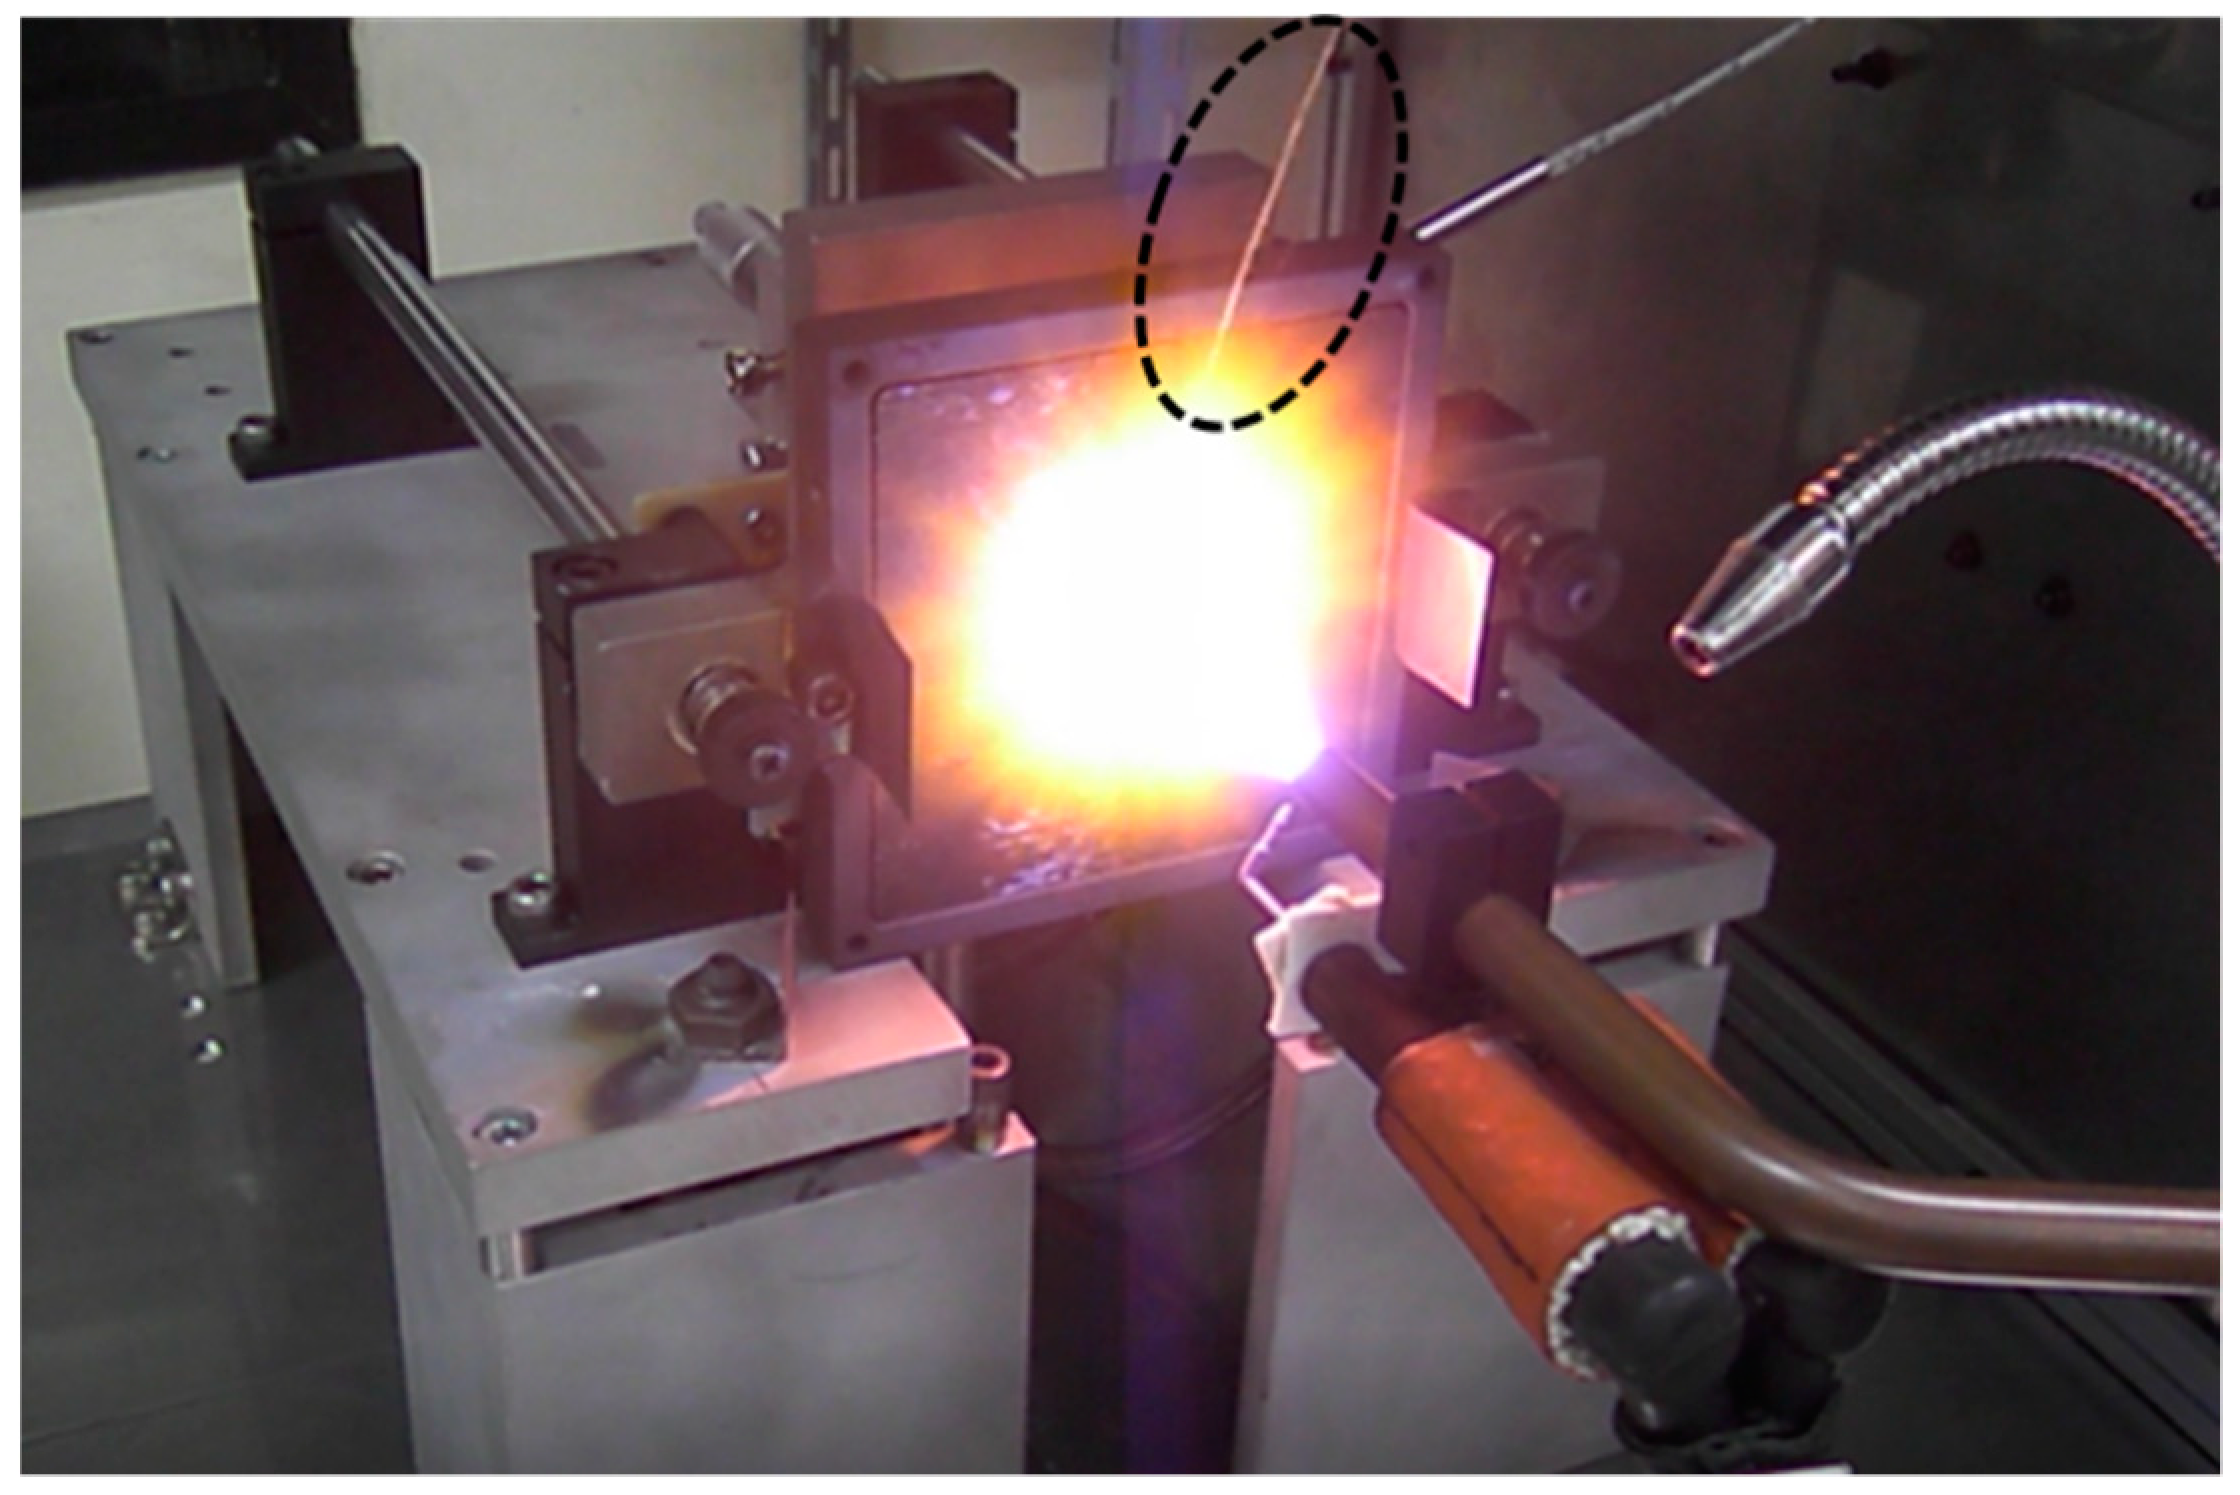
2.2. Design of Experiments
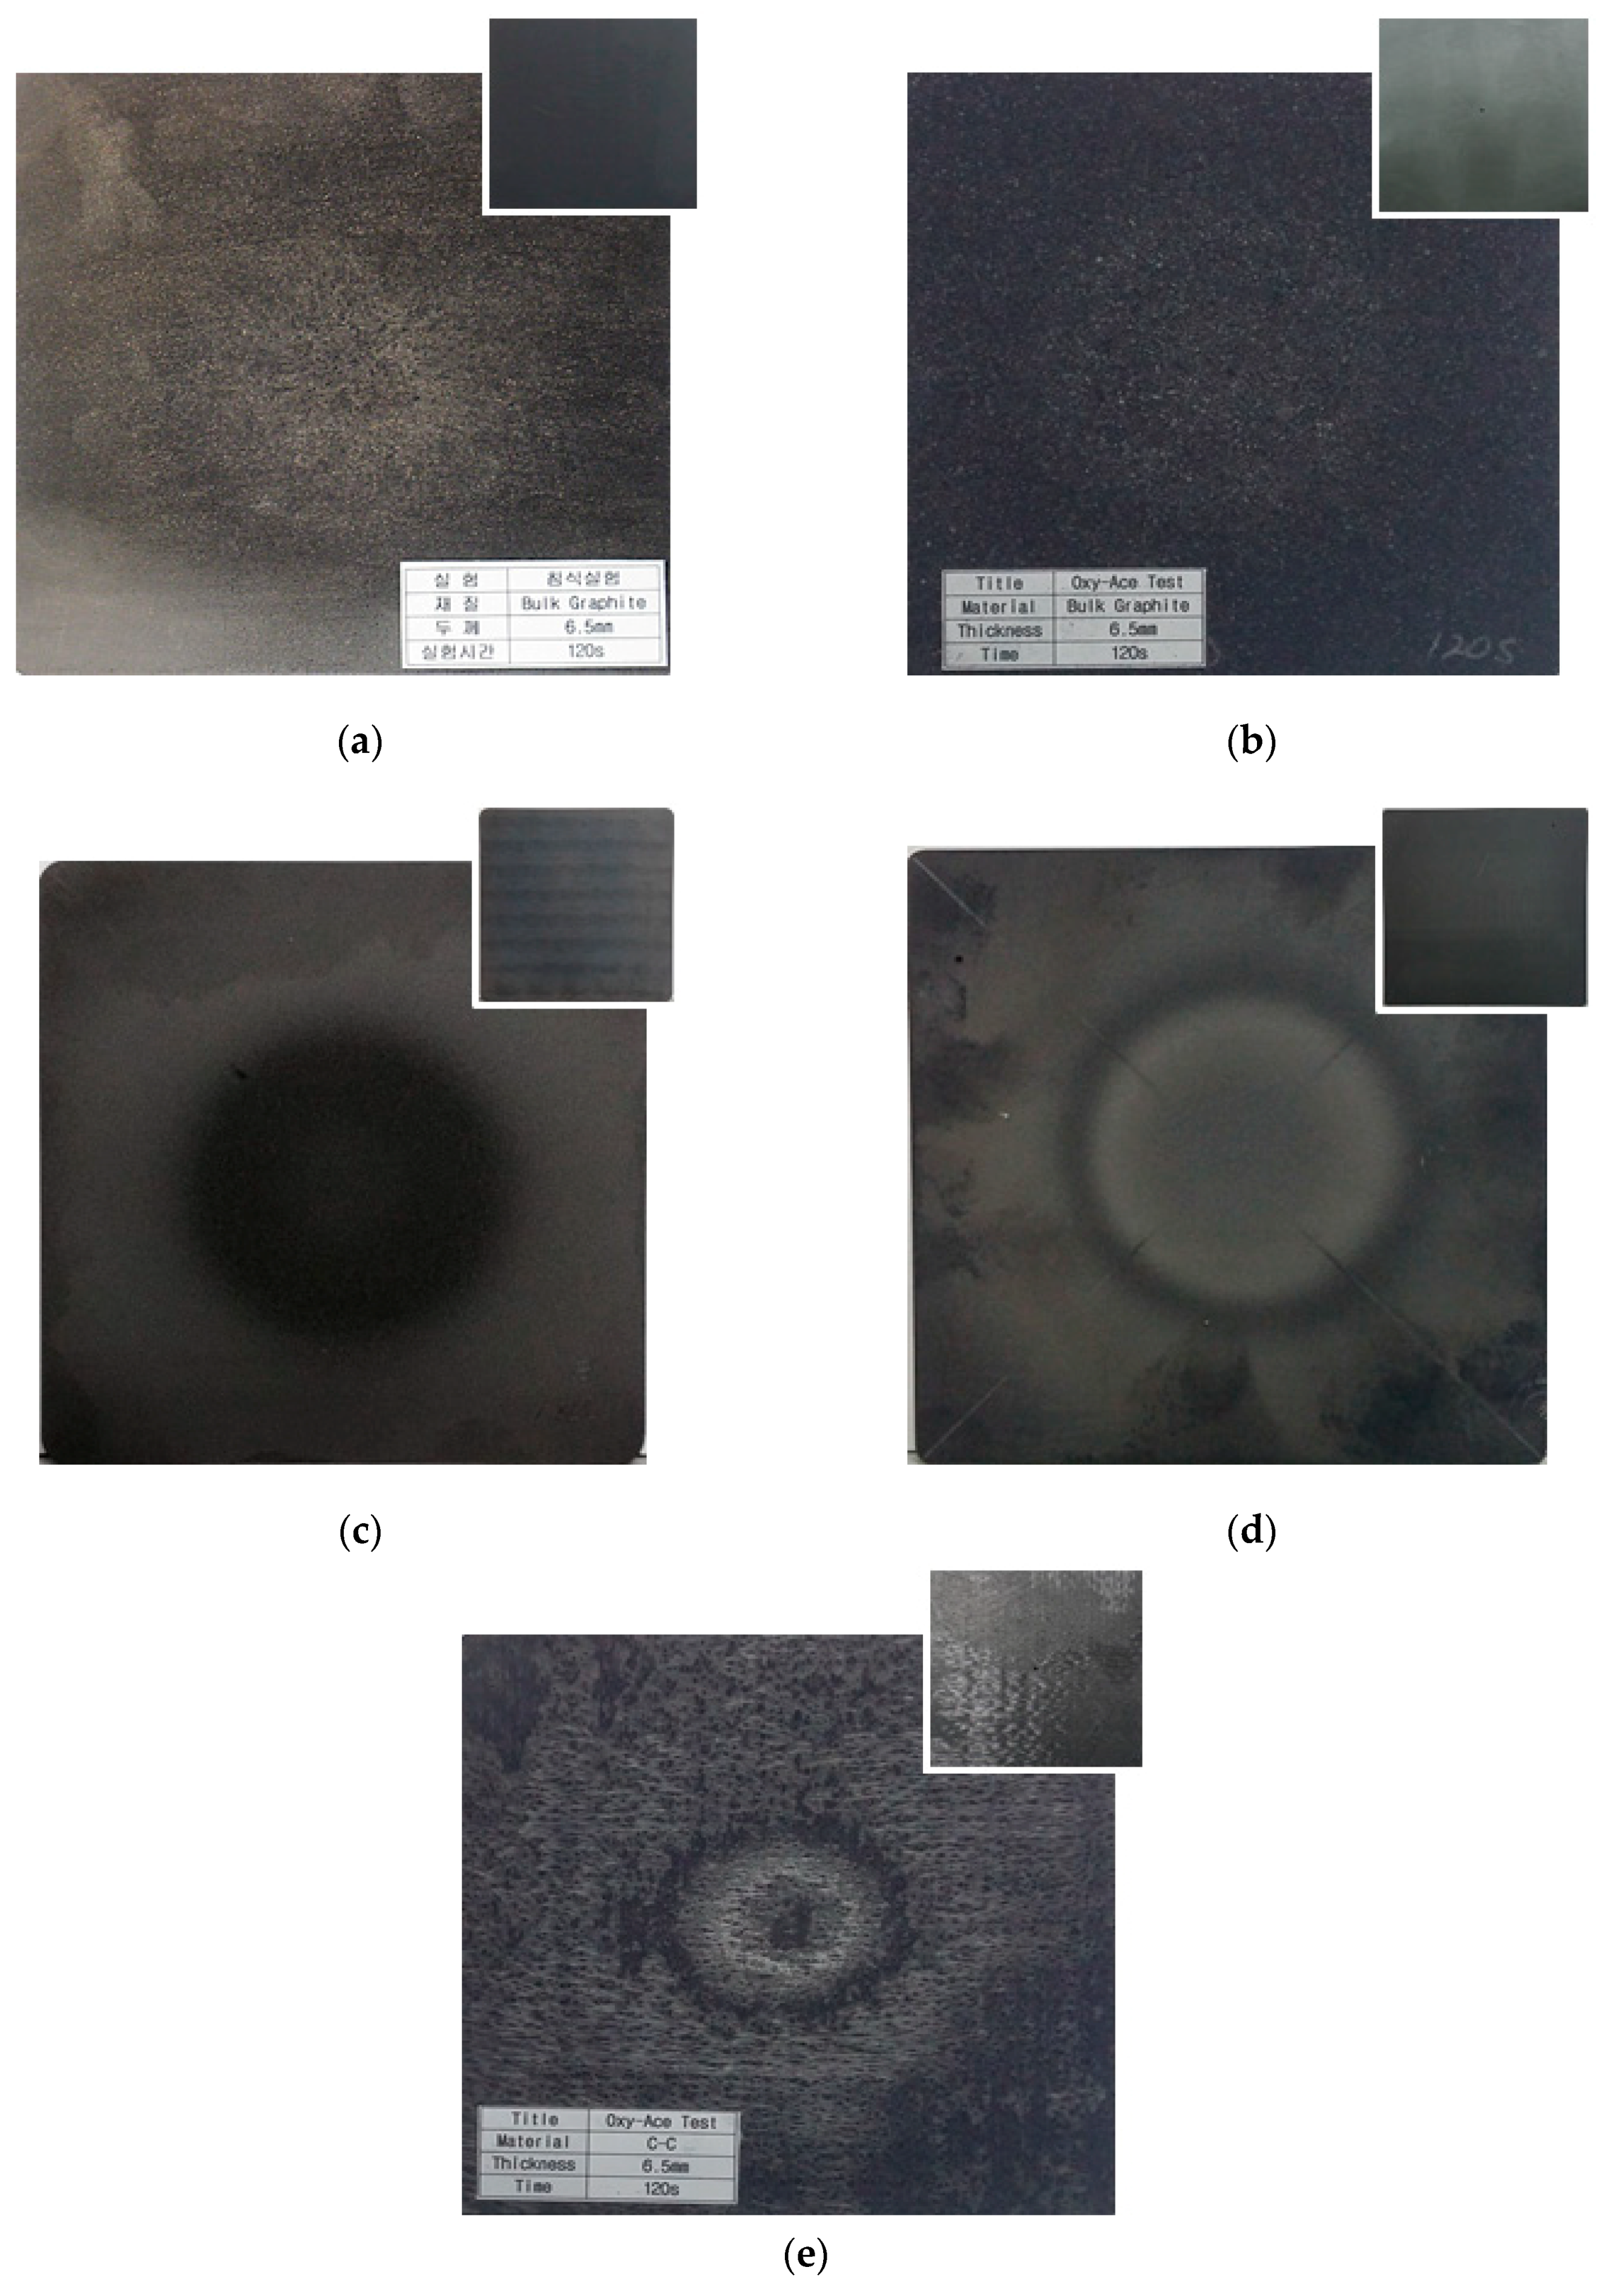
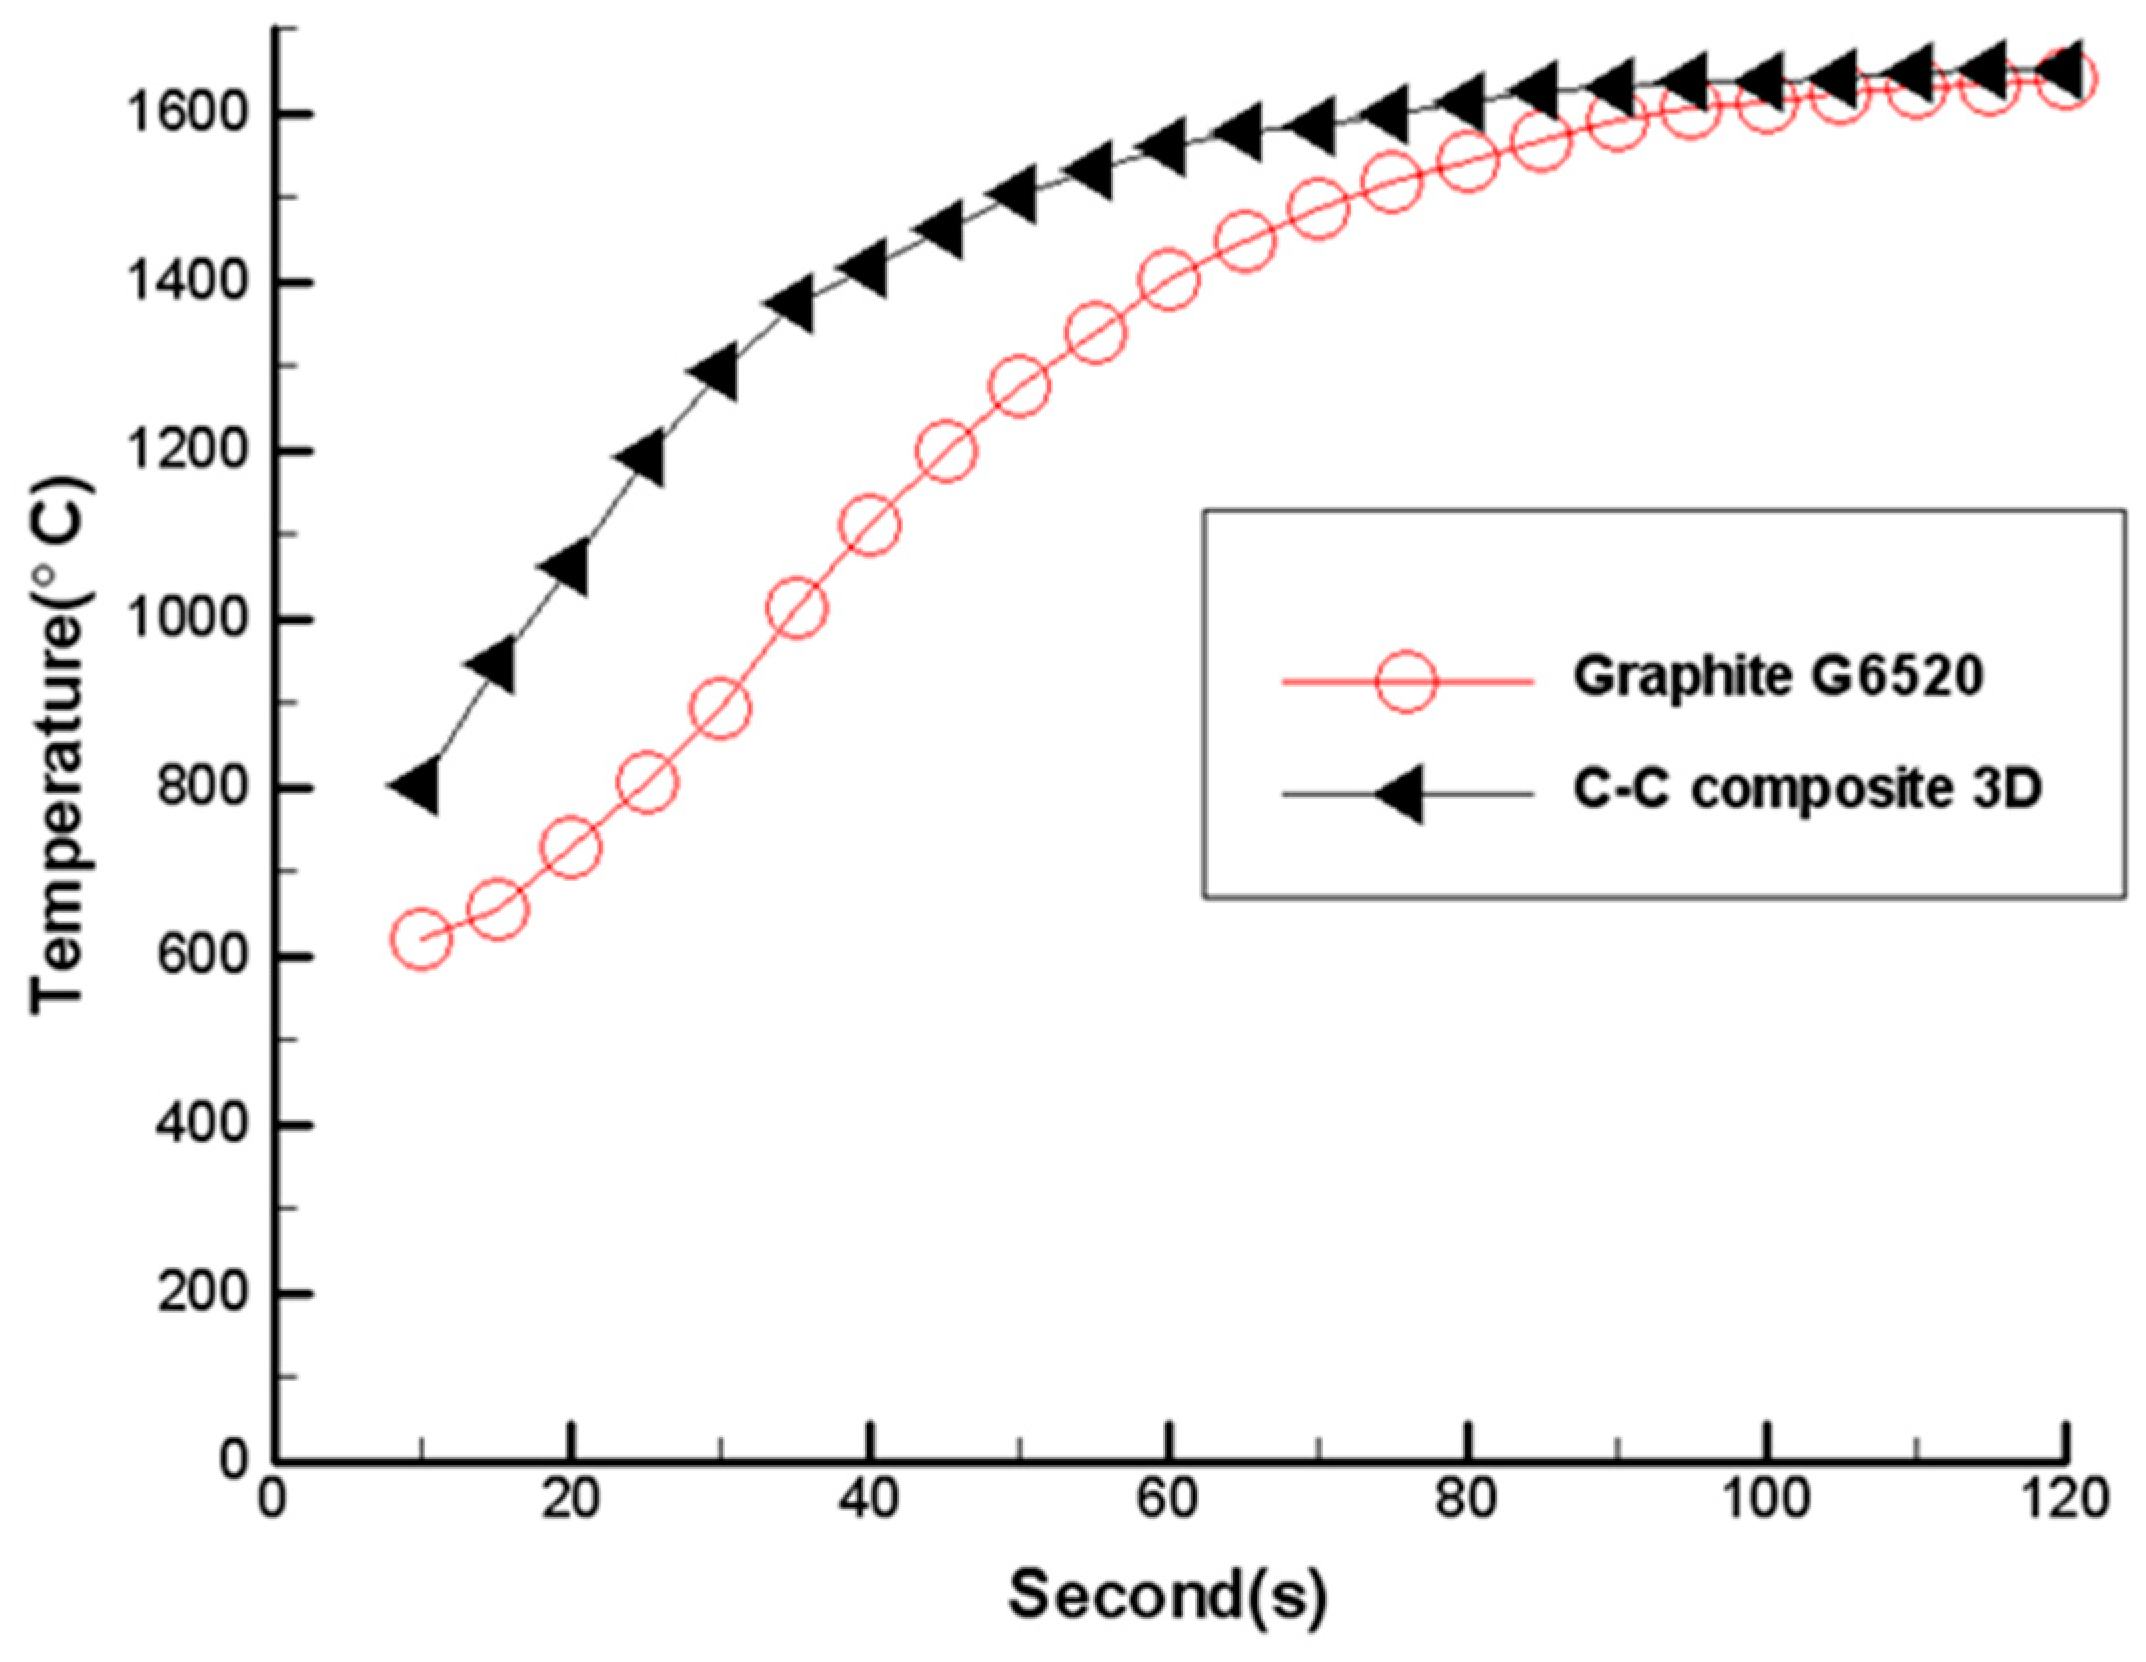
3. Experimental Results and Discussion
4. Conclusions
Author Contributions
Funding
Acknowledgments
Conflicts of Interest
References
- Hong, Y.S. Artificial Satellite and Space Lanunch Vehicle; Cheong-Moon-Gak: Seoul, Korea, 2005; pp. 66–81. [Google Scholar]
- Park, I.S.; Oh, I.S.; Joo, H.J. Ablation Characteristics of 4D-Carbon/Carbon Composites. Korean J. Mater. Res. 1997, 7, 687–693. [Google Scholar]
- Kuo, K.K.; Keswani, S.T. A Comprehensive Theoretical Model for Carbon-Carbon Composite Nozzle Recession. J. Combust. Sci. Technol. 1985, 42, 145–164. [Google Scholar]
- Bianchi, D.; Nasuti, F. Thermochemical Erosion Analysis of Carbon-Carbon Nozzles in Solid-Propellant Rocket Motors. In Proceedings of the 46th AIAA/ASME/SAE/ASEE Joint Propulsion Conference & Exhibit, Nashville, TN, USA, 25–28 July 2010. [Google Scholar]
- Gowariker, V.R. Mechanical and Chemical Contribution to The Erosion Rates of Graphite Throats in Rocket Motor Nozzle. J. Spacecr. 1966, 3, 1490–1494. [Google Scholar] [CrossRef]
- Acharya, R.; Kuo, K.K. Effect of Pressure and Propellant Composition on Graphite Rocket Nozzle Erosion Rate. J. Propuls. Power 2007, 23, 1242–1254. [Google Scholar] [CrossRef]
- Ham, H.C. The Effect of Pressure and Oxidation Mole Fraction on Ablation Rate of Graphite for Nozzle Throat Insert. J. Korean Soc. Propuls. Eng. 2014, 18, 8–15. [Google Scholar] [CrossRef][Green Version]
- Ham, H.C. A Study on the Thermal Response Characteristics of Carbon/Carbon Composites for Nozzle Throat Insert. J. Korean Soc. Propul. Eng. 2006, 10, 30–37. [Google Scholar]
- Keswani, S.T.; Andiroglu, E.; Campbell, J.D.; Kuo, K.K. Recession Behavior of Graphitic Nozzles in Simulated Rocket Motors. In Proceedings of the 19th Joint Propulsion Conference/Joint Propulsion Conferences, Seattle, WA, USA, 27–29 June 1983. [Google Scholar]
- George, P.S. Rocket Propulsion Elements; John Wiley Sons, Inc.: New York, NY, USA, 1992; p. 31. [Google Scholar]
- Bianchi, D.; Nasuti, F.; Onofri, M. Thermochemical Erosion Analysis for Carbon-Carbon Rocket Nozzles. In Proceedings of the 45th AIAA/ASME/SAE/ASEE Joint Propulsion Conference & Exhibit, Denver, CO, USA, 2–5 August 2009. [Google Scholar]
- Acharya, R.; Kuo, K.K. Numerical Simulation of Graphite Nozzle Erosion with Parametric Analysis. In Proceedings of the 46th AIAA/ASME/SAE/ASEE Joint Propulsion Conference & Exhibit, Nashville, TN, USA, 25–28 July 2010. [Google Scholar]
- Kuo, K.K.; Acharya, R. Applications of Turbulent and Multi-Phase Combustion; Wiley: Hoboken, NJ, USA, 2012; p. 292. [Google Scholar]
- Bianchi, D. Modeling of Ablation Phenomena in Space Applications. Ph.D. Thesis, Sapienza University of Rome, Roma, Italy, 2007. [Google Scholar]
- Acharya, R.; Kuo, K.K. Effect of Chamber Pressure & Propellant Composition on Erosion Rate of Graphite Rocket Nozzle. In Proceedings of the 44th AIAA Aerospace Sciences Meeting and Exhibit, Reno, NV, USA, 9–12 January 2006. [Google Scholar]
- Joo, H.J.; Kim, Y. A Study of Ablative Behavior on Carbon/Carbon Composites. Korea Sci. Eng. Found. 2002, 1, 11–14. [Google Scholar]
- ASTM. Standard Test Method for Oxyacetylene Ablation Testing of Thermal Insulation Materials, E285-08; ASTM International: West Conshohocken, PA, USA, 2015. [Google Scholar]
- Winya, N.; Chankapoe, S.; Kiriratnikom, C. Ablation, Mechanical and Thermal Properties of Fiber/Phenolic Matrix Composites. World Acad. Sci. Eng. Technol. 2012, 6, 556–559. [Google Scholar]
- Chino Corporation, Portable Digital Radiation Thermometer Instructions, INE-374-P10CE; Chino Corporation: Tokyo, Japan, 2017.
- National Instruments. Users Guide and Spec. NI USB-6008/6009; National Instruments: Austin, TX, USA, 2013. [Google Scholar]
- Gordon, S.; McBride, B.J. Computer Program for Calculation of Complex Chemical Equilibrium Compositions and Applications. Part 1: Analysis, NASA Lewis Research Center, NASA Reference Publication 1311: Cleveland, OH, USA, 1994.


| Surface Reactions | Ai | Ei (Kcal/mol) | β | N | Remarks |
|---|---|---|---|---|---|
| CS + H2O → CO + H2 | 4.8 × 10⁵ (kg/m2 s atm0.5) | 68.8 | 0.0 | 0.5 | |
| CS + CO2 → 2CO | 9.0 × 10³ (kg/m2 s atm0.5) | 68.1 | 0.0 | 0.5 | |
| CS + OH → CO + H | 3.61 × 10² (kg K0.5/m2 s atm) | 0.0 | −0.5 | 1.0 | MOS |
| 100 (kg K0.5/m2 s atm) | 0.0 | −0.62 | 1.0 | MMOS |
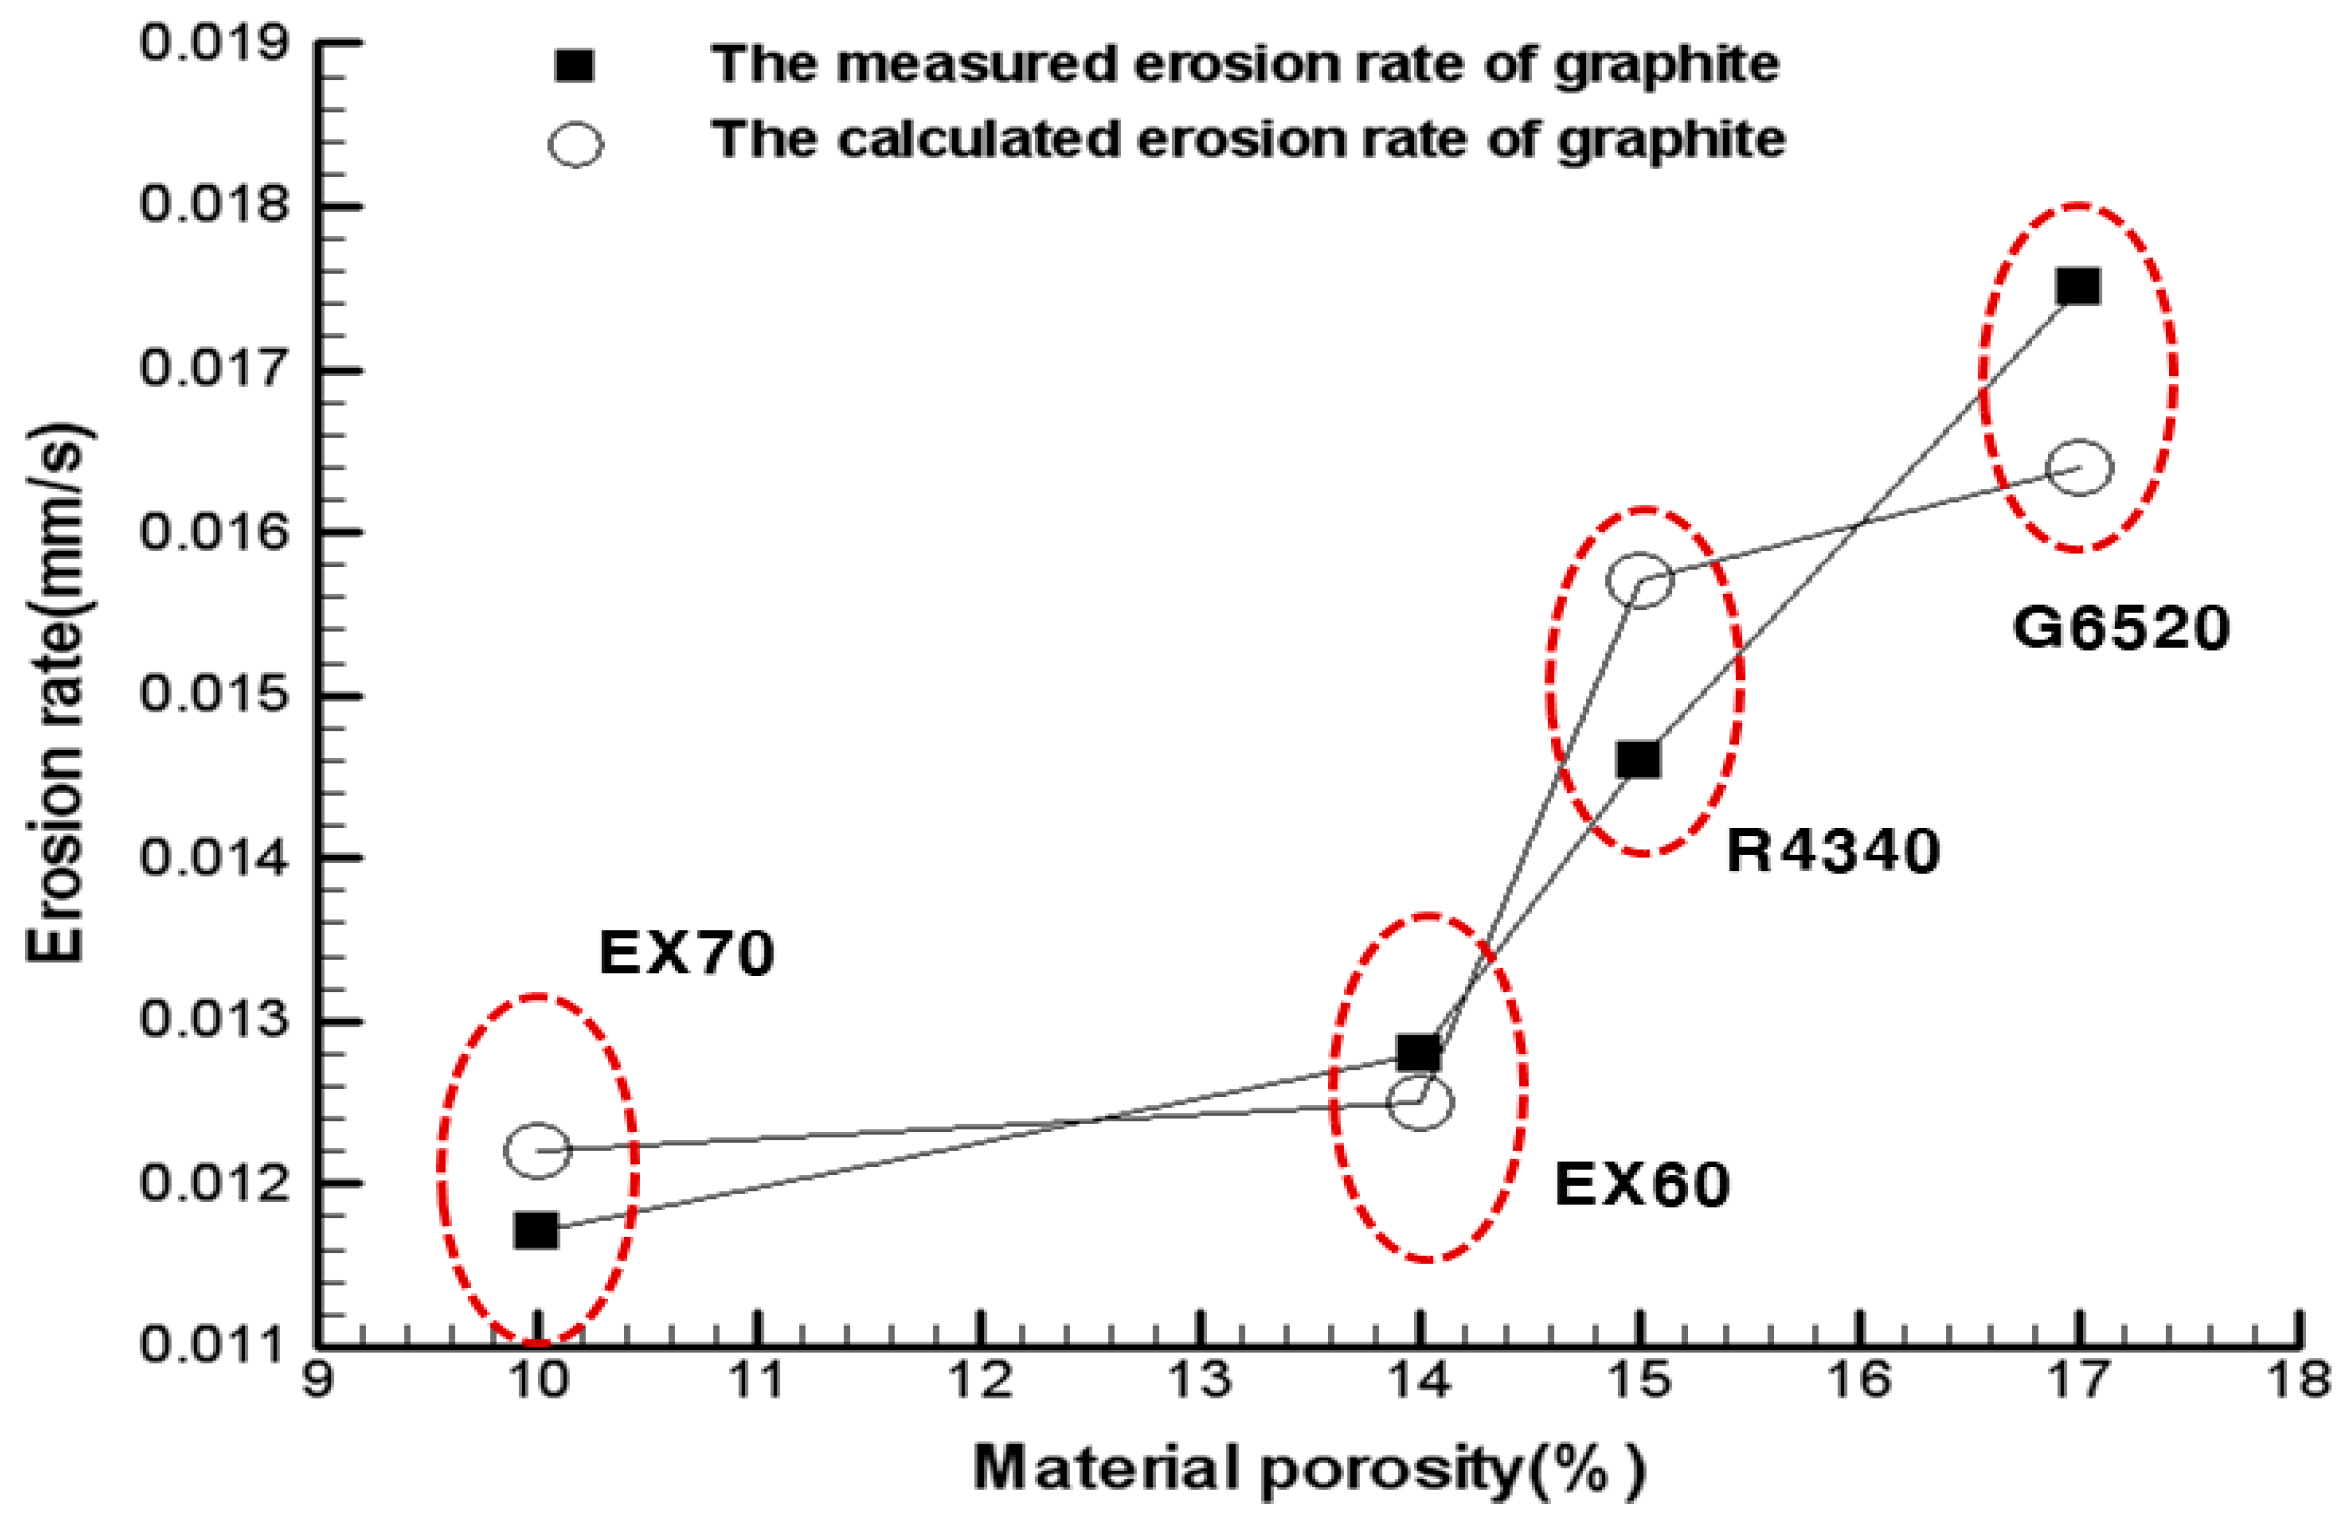
| Graphite | C–C | ||||
|---|---|---|---|---|---|
| G6520 | R4340 | EX60 | EX70 | 3D | |
| Density (kg/m3) | 1750 | 1770 | 1800 | 1850 | 1700 |
| Porosity (%) | 17 | 15 | 14 | 10 | 12 |
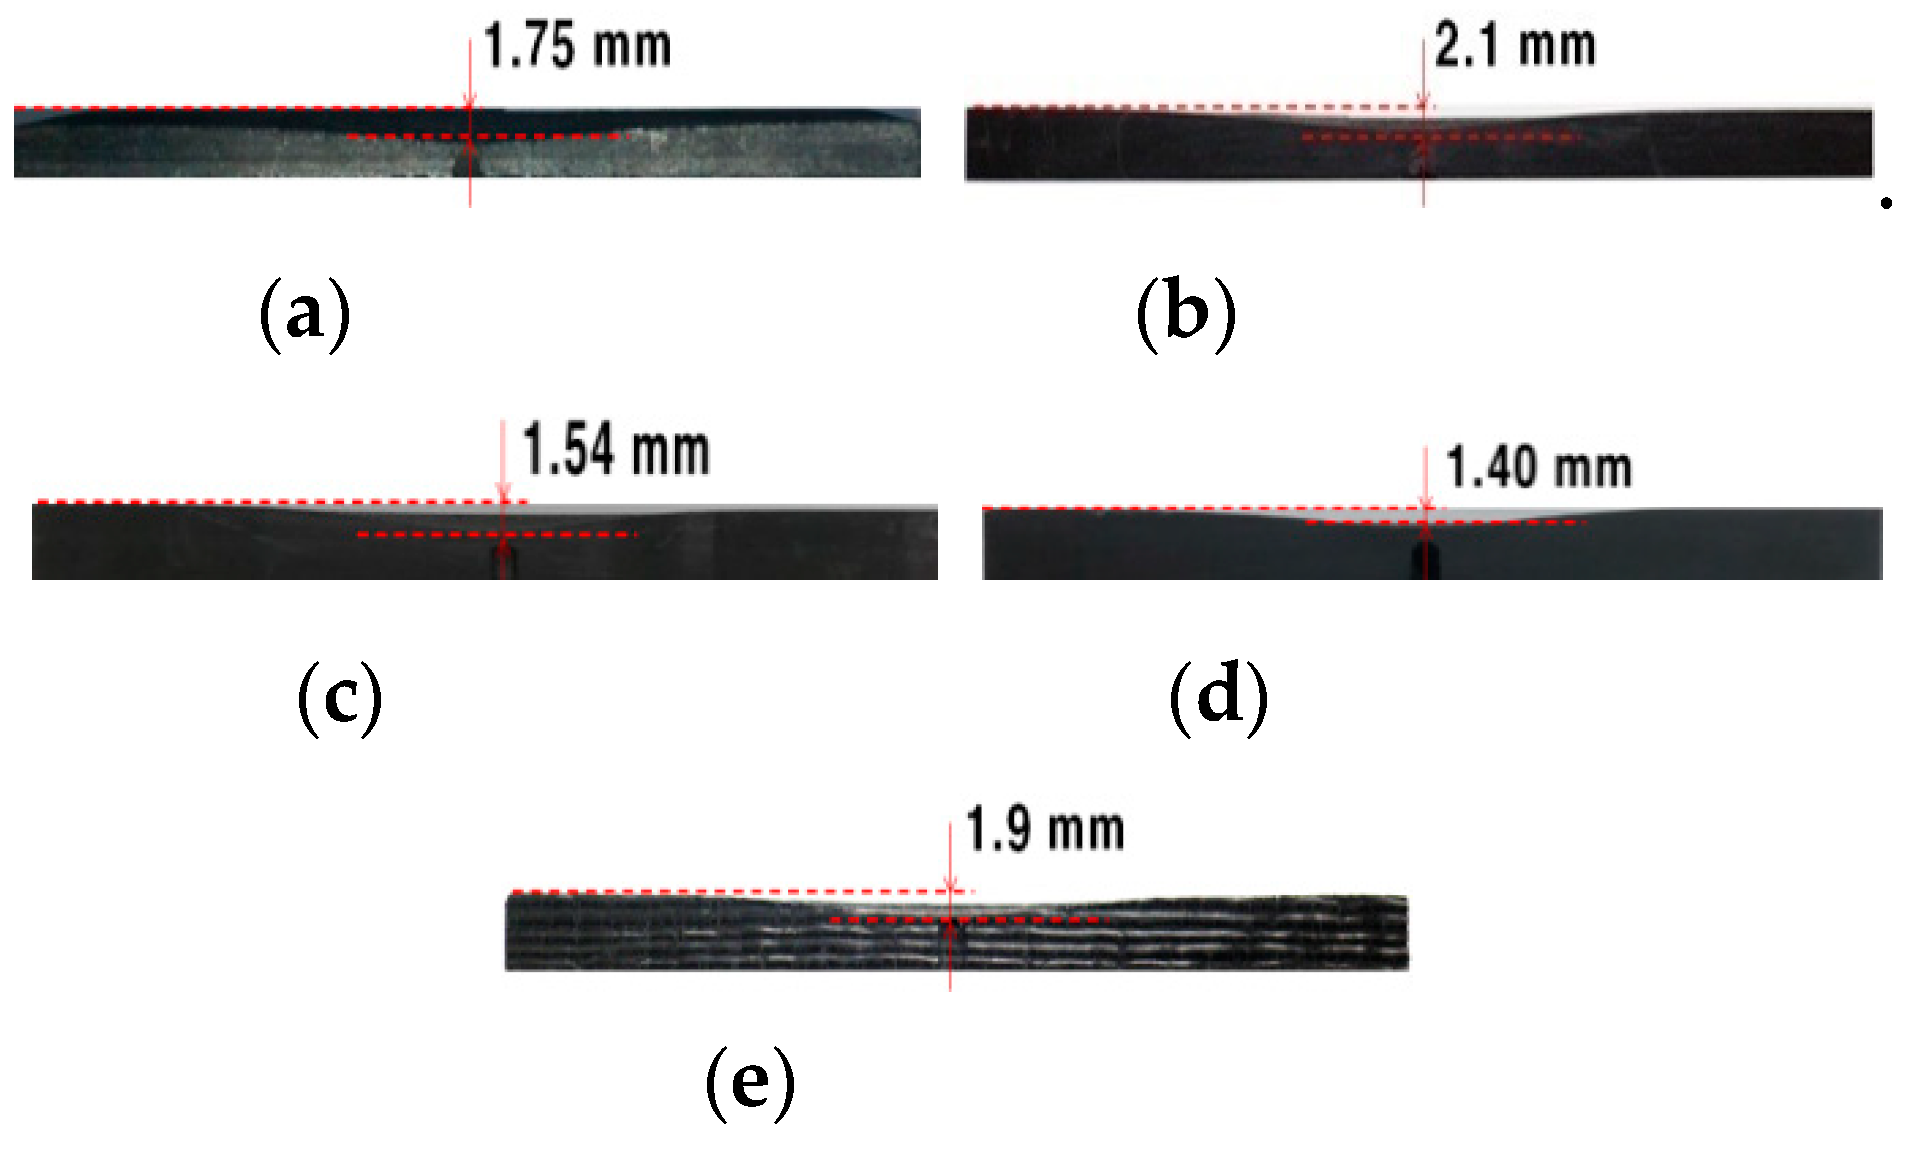
| Graphite | C–C | ||||
|---|---|---|---|---|---|
| R4340 | G6520 | EX60 | EX70 | 3D | |
| Test time (s) | 120 | 120 | 120 | 120 | 120 |
| Total erosion (mm) | 1.75 | 2.10 | 1.54 | 1.40 | 1.90 |
| Erosion rate (mm/s) | 0.0146 | 0.0175 | 0.0128 | 0.0117 | 0.0158 |
| Graphite | C–C | ||||
|---|---|---|---|---|---|
| R4340 | G6520 | EX60 | EX70 | 3D | |
| (mm/s) | 0.0305 | 0.0308 | 0.0218 | 0.0251 | 0.0339 |
| (mm/s) | 0.0130 | 0.0131 | 0.0092 | 0.0106 | 0.0145 |
| (mm/s) | 0.0183 | 0.0184 | 0.0130 | 0.0149 | 0.0203 |
| Error (%) | 25.34 | 5.14 | 1.56 | 27.35 | 28.48 |
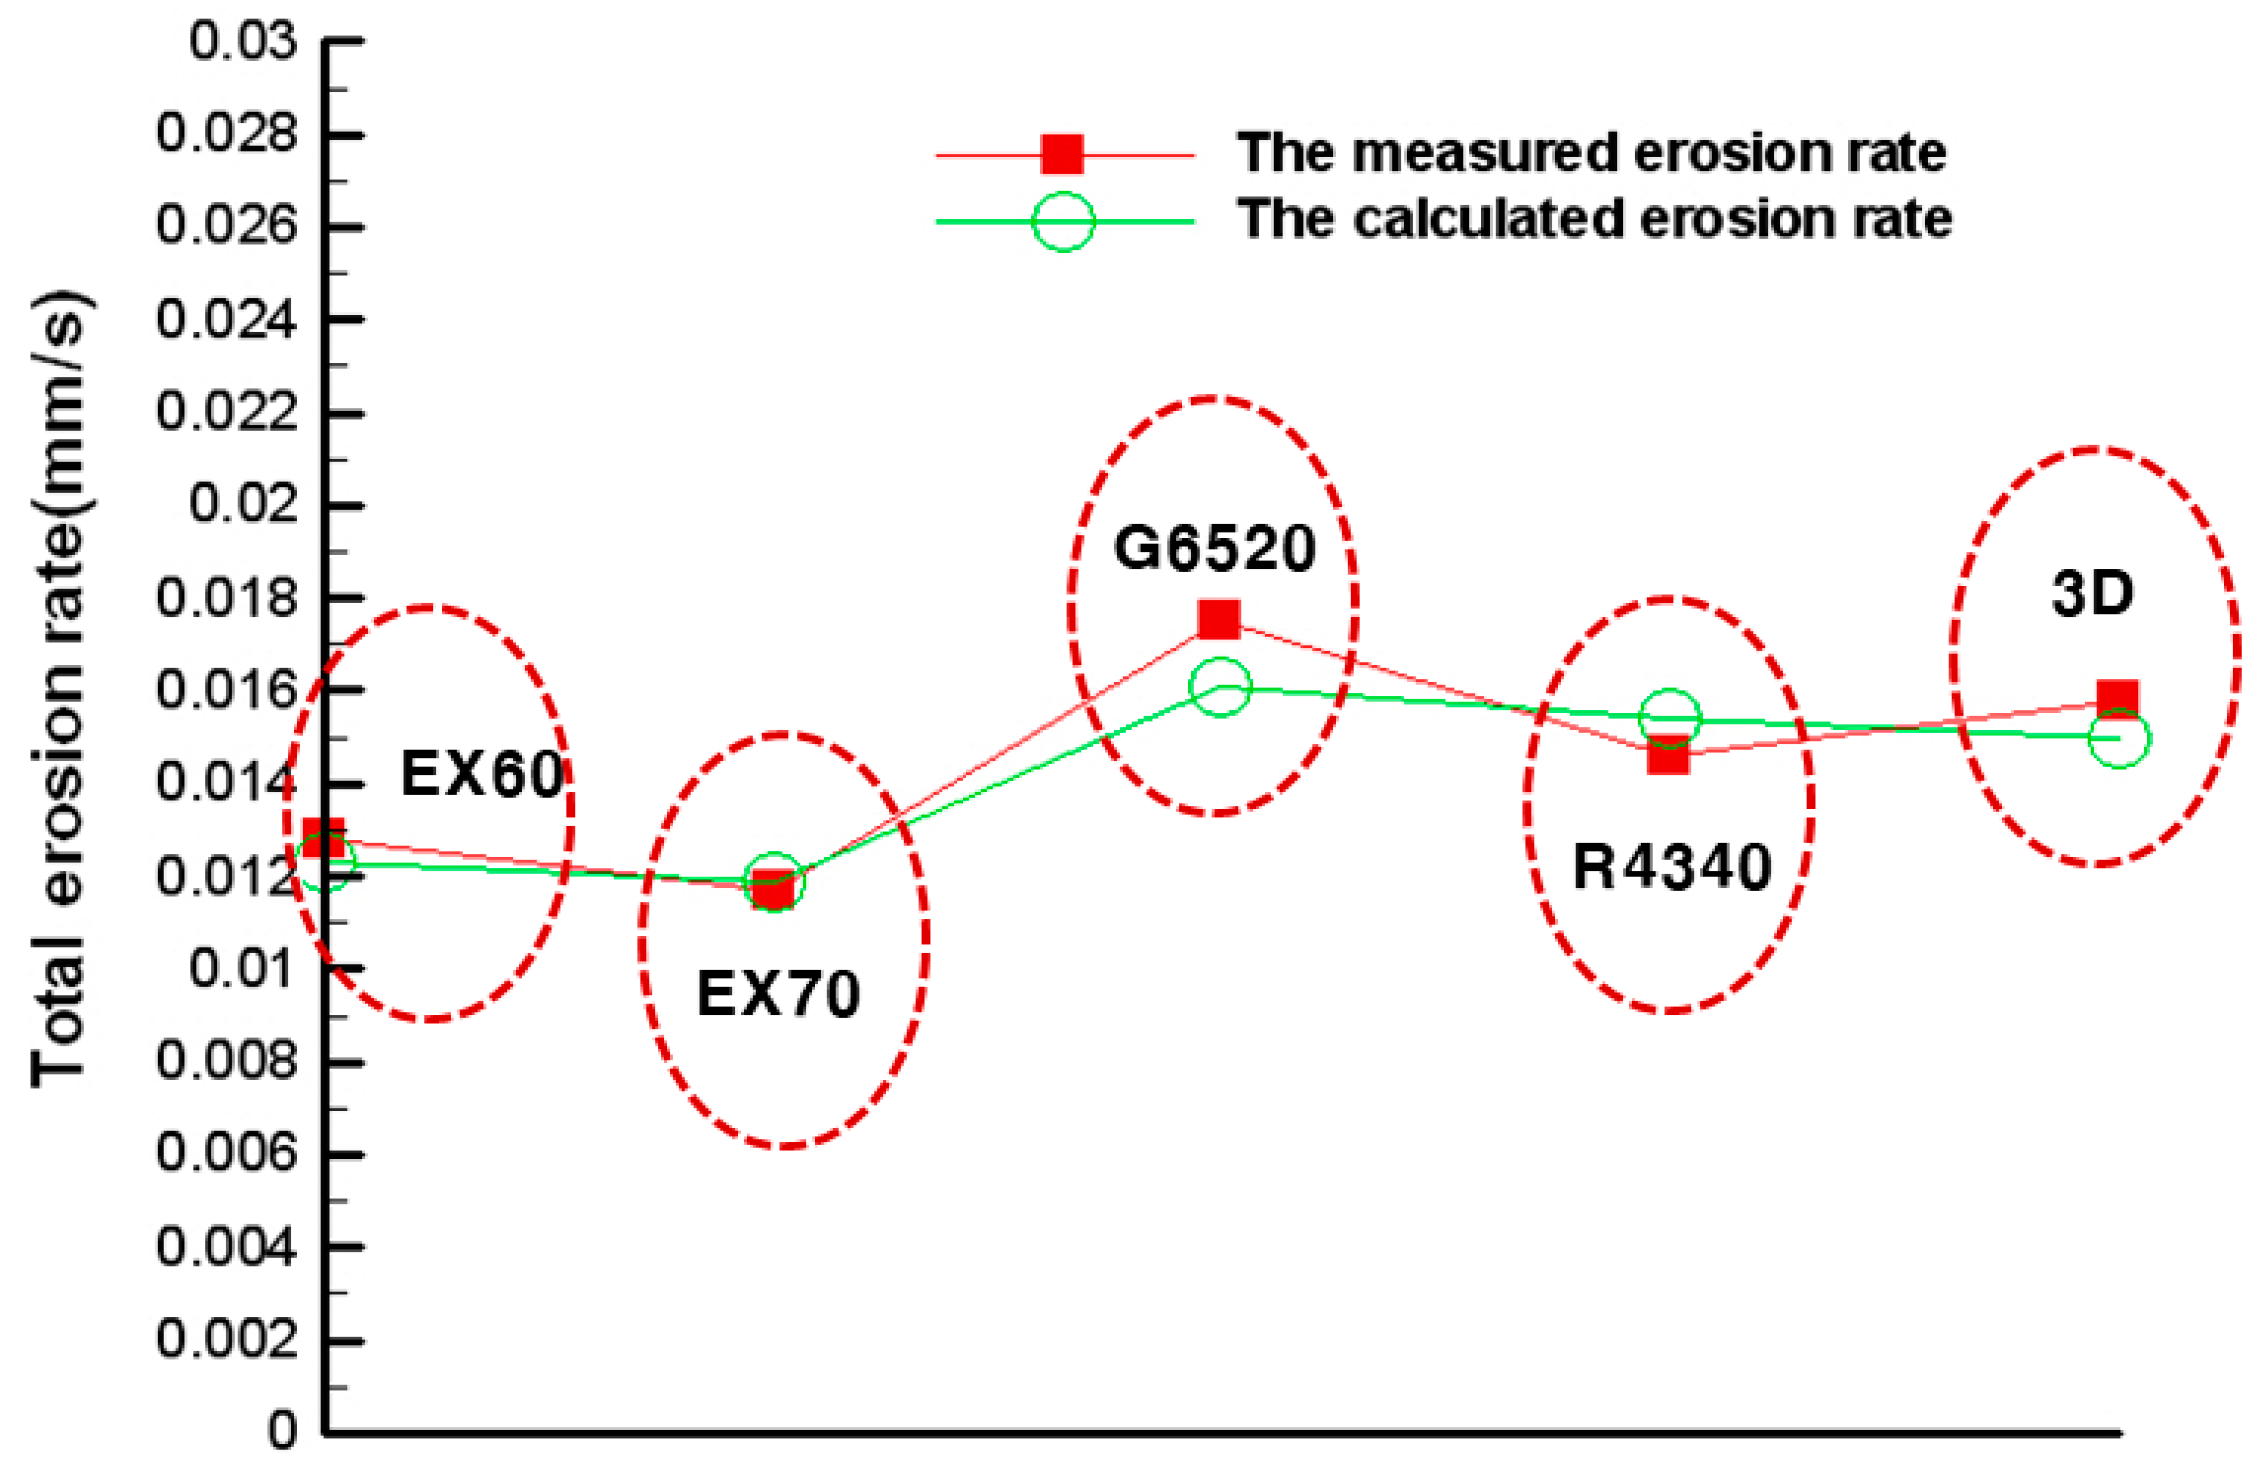
| Graphite | C–C | ||||
|---|---|---|---|---|---|
| R4340 | G6520 | EX60 | EX70 | 3D | |
| Measured erosion rate (mm/s) | 0.0146 | 0.0175 | 0.0128 | 0.0117 | 0.0158 |
| Calculated erosion rate (mm/s) | 0.0157 | 0.0164 | 0.0125 | 0.0122 | 0.0154 |
| Error (%) | 7.53 | 6.29 | 2.34 | 4.27 | 2.53 |
© 2019 by the authors. Licensee MDPI, Basel, Switzerland. This article is an open access article distributed under the terms and conditions of the Creative Commons Attribution (CC BY) license (http://creativecommons.org/licenses/by/4.0/).
Share and Cite
Kim, Y.; Cho, J. Surface Erosion Analysis for Thermal Insulation Materials of Graphite and Carbon–Carbon Composite. Appl. Sci. 2019, 9, 3323. https://doi.org/10.3390/app9163323
Kim Y, Cho J. Surface Erosion Analysis for Thermal Insulation Materials of Graphite and Carbon–Carbon Composite. Applied Sciences. 2019; 9(16):3323. https://doi.org/10.3390/app9163323
Chicago/Turabian StyleKim, Youngin, and Jeongho Cho. 2019. "Surface Erosion Analysis for Thermal Insulation Materials of Graphite and Carbon–Carbon Composite" Applied Sciences 9, no. 16: 3323. https://doi.org/10.3390/app9163323
APA StyleKim, Y., & Cho, J. (2019). Surface Erosion Analysis for Thermal Insulation Materials of Graphite and Carbon–Carbon Composite. Applied Sciences, 9(16), 3323. https://doi.org/10.3390/app9163323