1. Introduction
Spectrometers and spectroscopy have been widely used in the field of material measurement and analysis, such as in food inspection, industrial production, agricultural production, safety testing, and environmental monitoring, due to their advantages of rapid and non-destructive detection [
1,
2]. However, traditional spectrometers have the disadvantages of occupying a large volume, single function, a limited range of use, and the requirement of high operator skill. In contrast, although portable spectrometers have lower accuracy, they have the advantages of compactness, low power consumption, flexibility, good portability, etc. [
3,
4]. In addition to the general use, portable spectrometers have a certain market in the fields of food inspection and environmental monitoring. However, in recent years, there has been no new development in the design of miniature and portable spectrometers, despite the disparity between traditional and portable spectrometers. Spectrometers for professional use have been developed over the years; however, non-specialist and smart spectrometers still need to be studied. Rather than the complex spectra, non-professional operators focus on the interpretation of spectra, the price of the spectrometer, whether the spectrometer can be operated easily, whether the spectral data can be reused, whether spectral data has other uses and the reliability of spectral data.
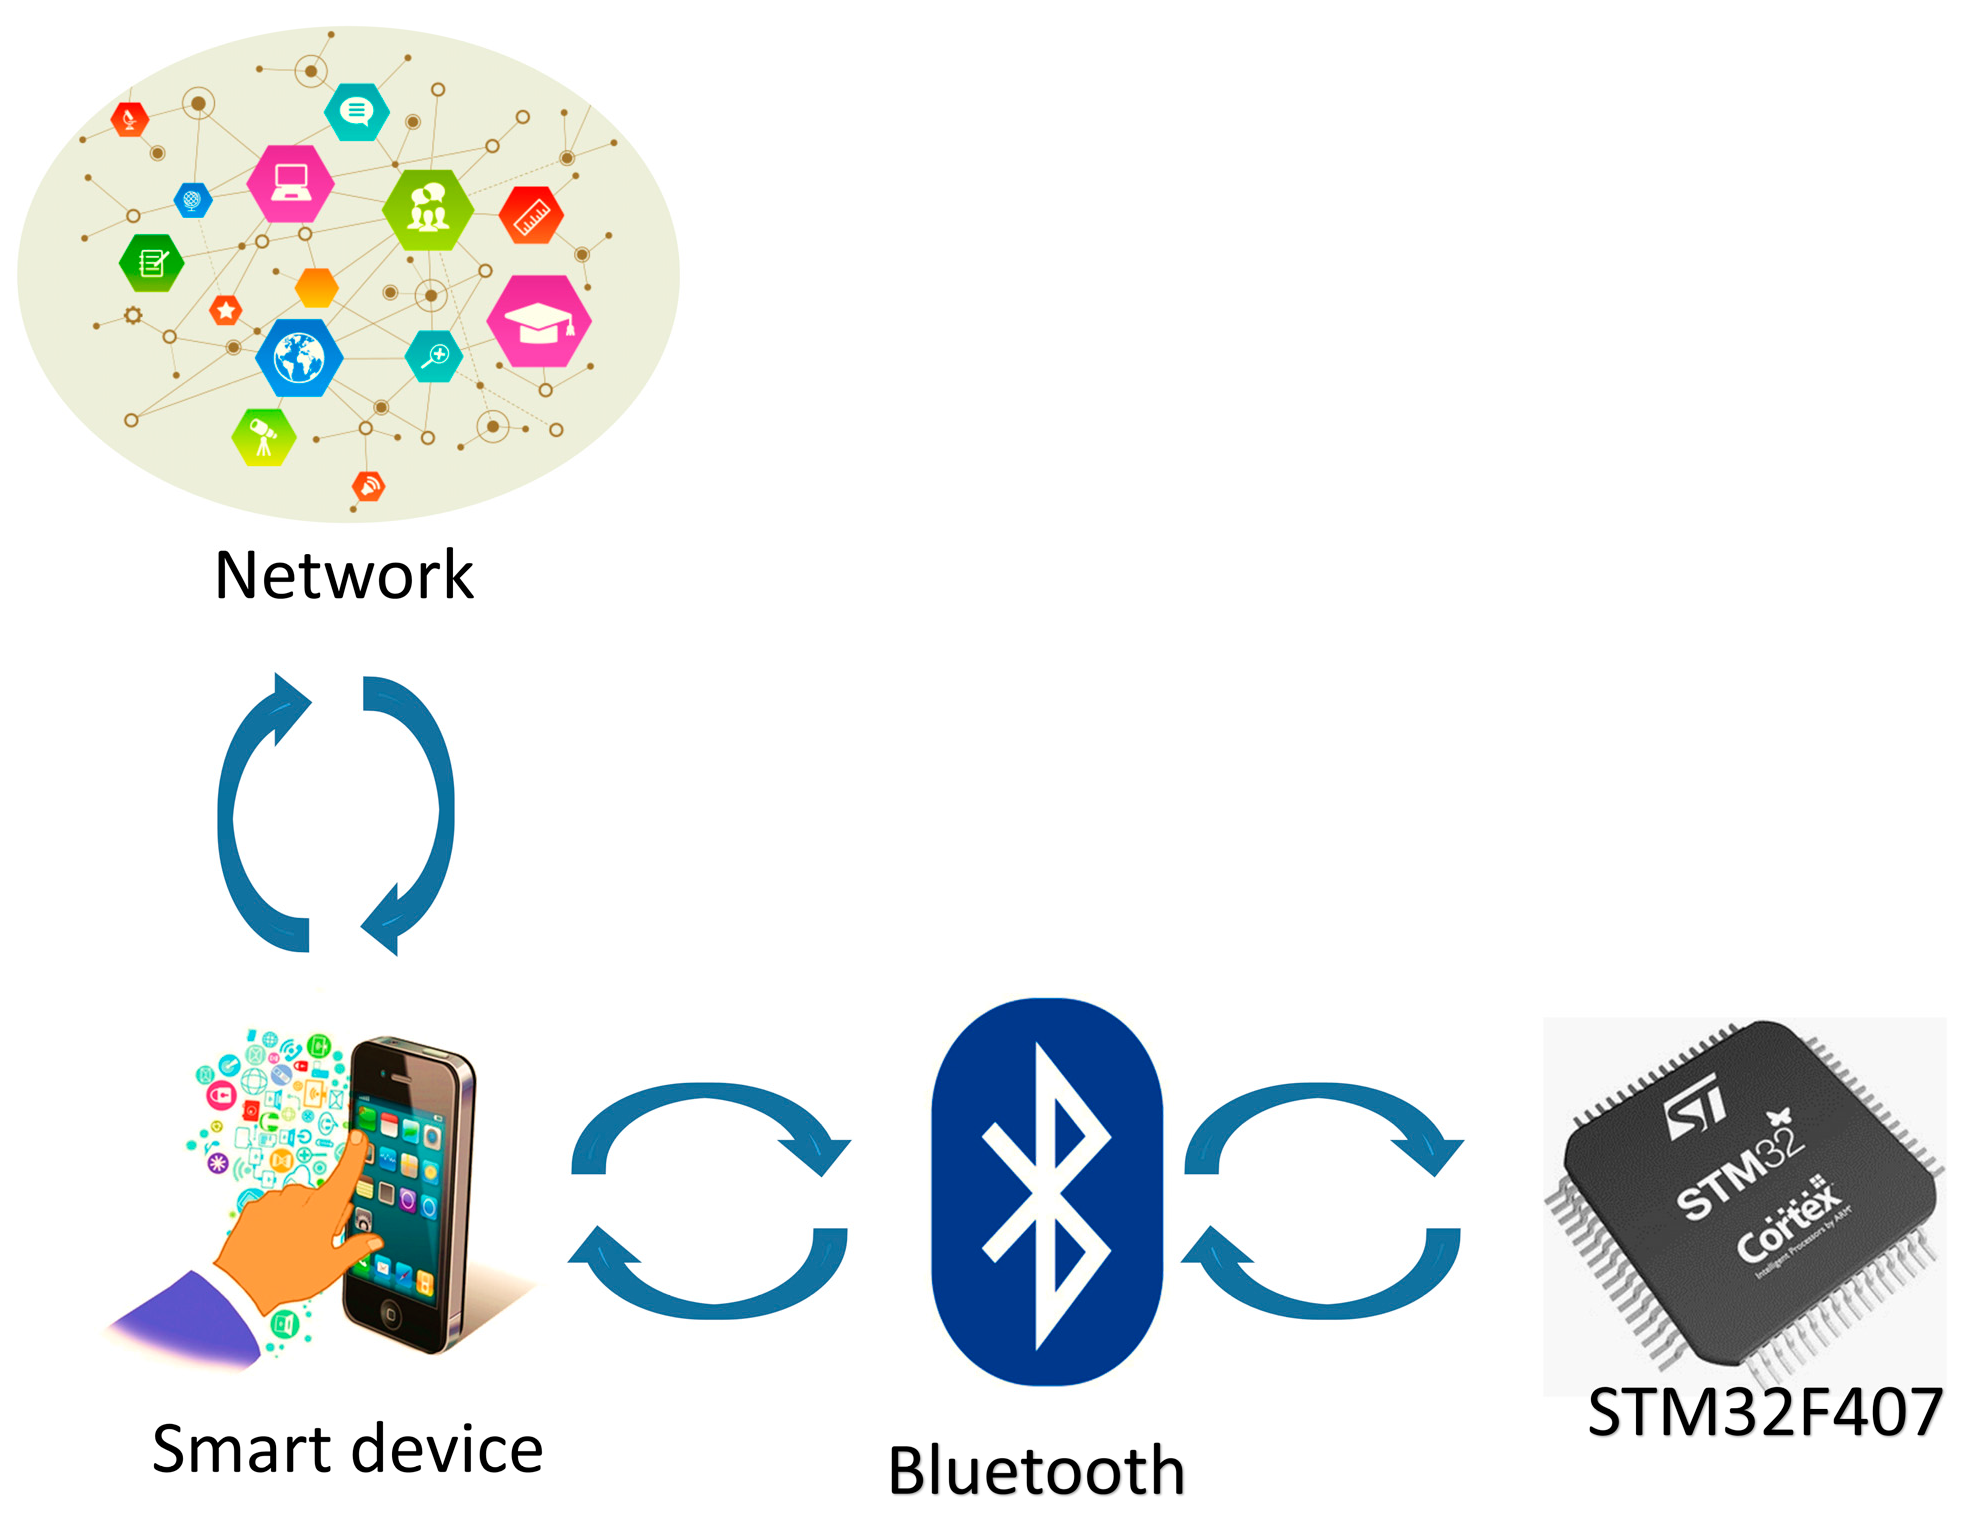
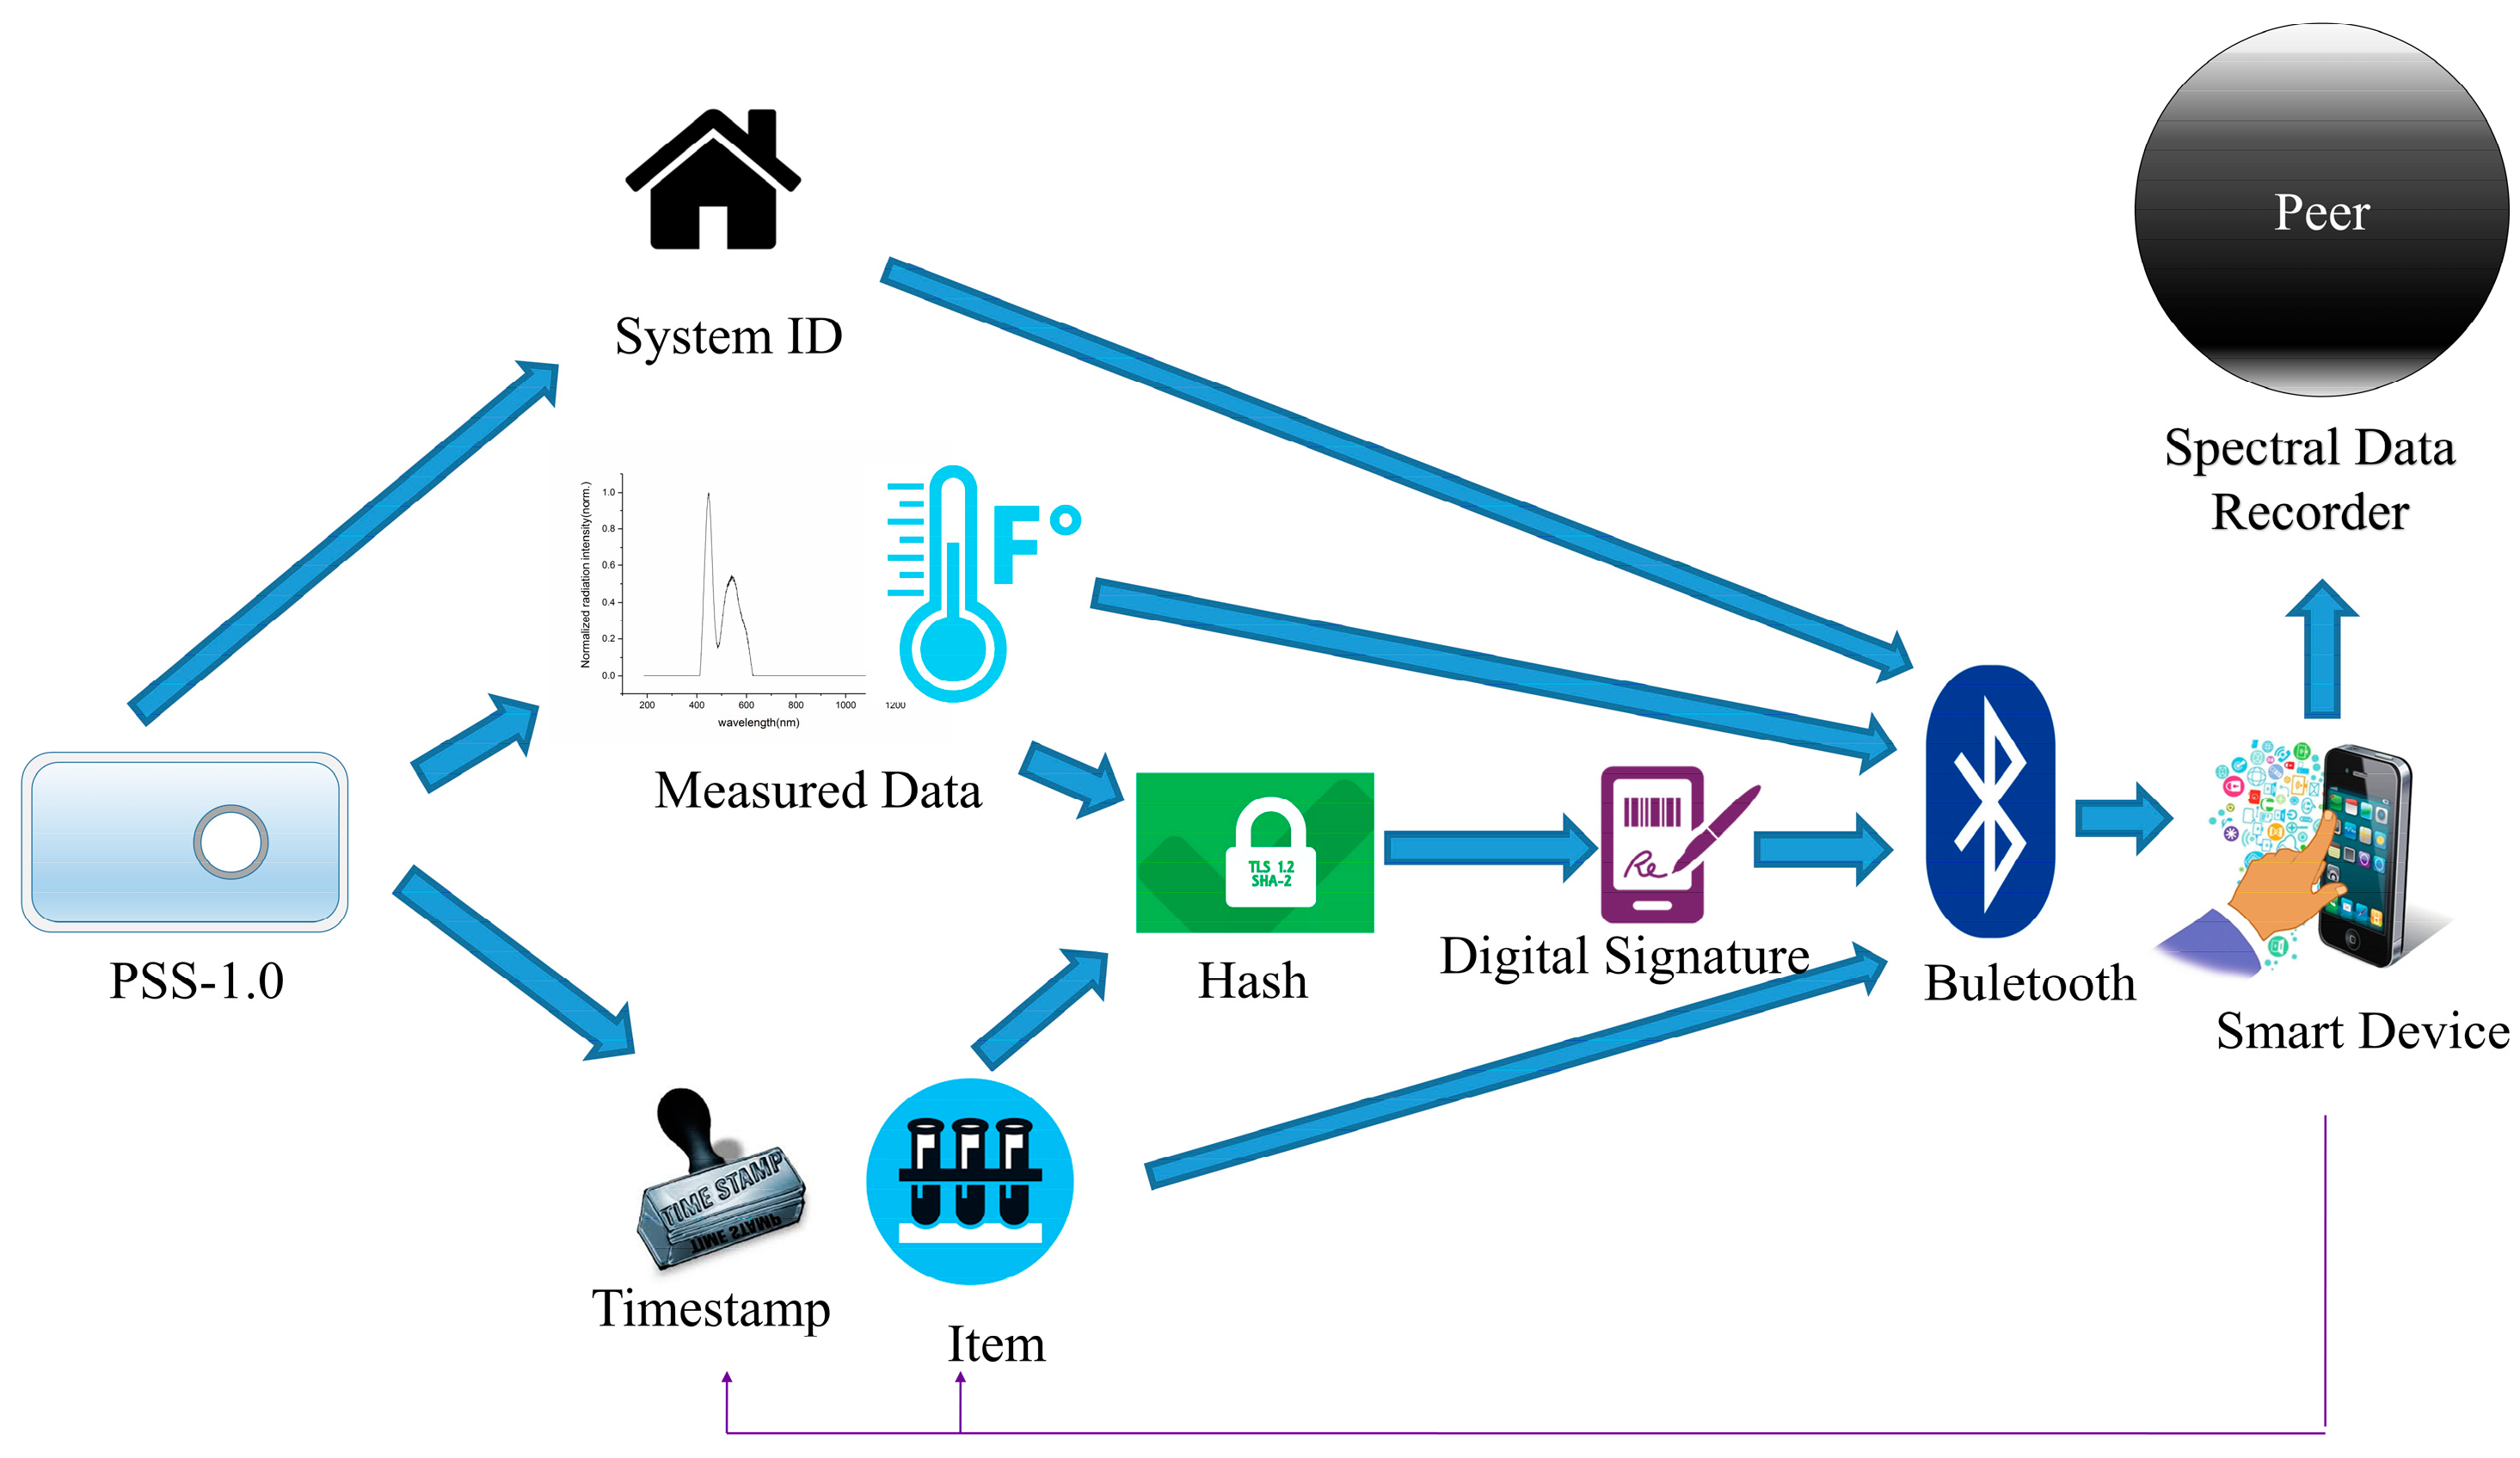
Traditional portable spectrometers can provide rapid on-site spectra in real time; however, the spectra can only be analyzed and processed by those with the relevant knowledge. The application threshold is still relatively high, and such spectrometers cannot be popularized. When spectral data is applied to food inspection and environmental monitoring, its review costs are high because it may be tampered with. After being analyzed and processed, spectra are generally discarded; thus, the data value is low. Hence, this paper proposes a portable smart spectrometer PSS-1.0 and related systems based on the PSS-1.0. In this system, the PSS-1.0 can connect to smart devices and use technologies such as spectral analysis, big data, and blockchain to lower the use threshold for use and achieve functions, such as data rapid analysis, storage, reuse, and tamper-proofing. As shown in
Figure 1, the PSS-1.0 can measure spectral data and perform on-site analysis using the downloaded spectral analysis models. Blockchain technology can be used to prevent data from being tampered [
5]. Big data technology can be used for data analysis, data storage, and data calls [
6]. This paper uses the techniques of deep learning, big data and blockchain to intelligentize the spectrometer, which is one of the main directions for the development of spectroscopic detection technology. We hope to design an easy-to-use smart spectrometer and enhance the quality of spectral data for civil use, production, monitoring, and safety testing.
2. Structure of the Portable Smart Spectrometer
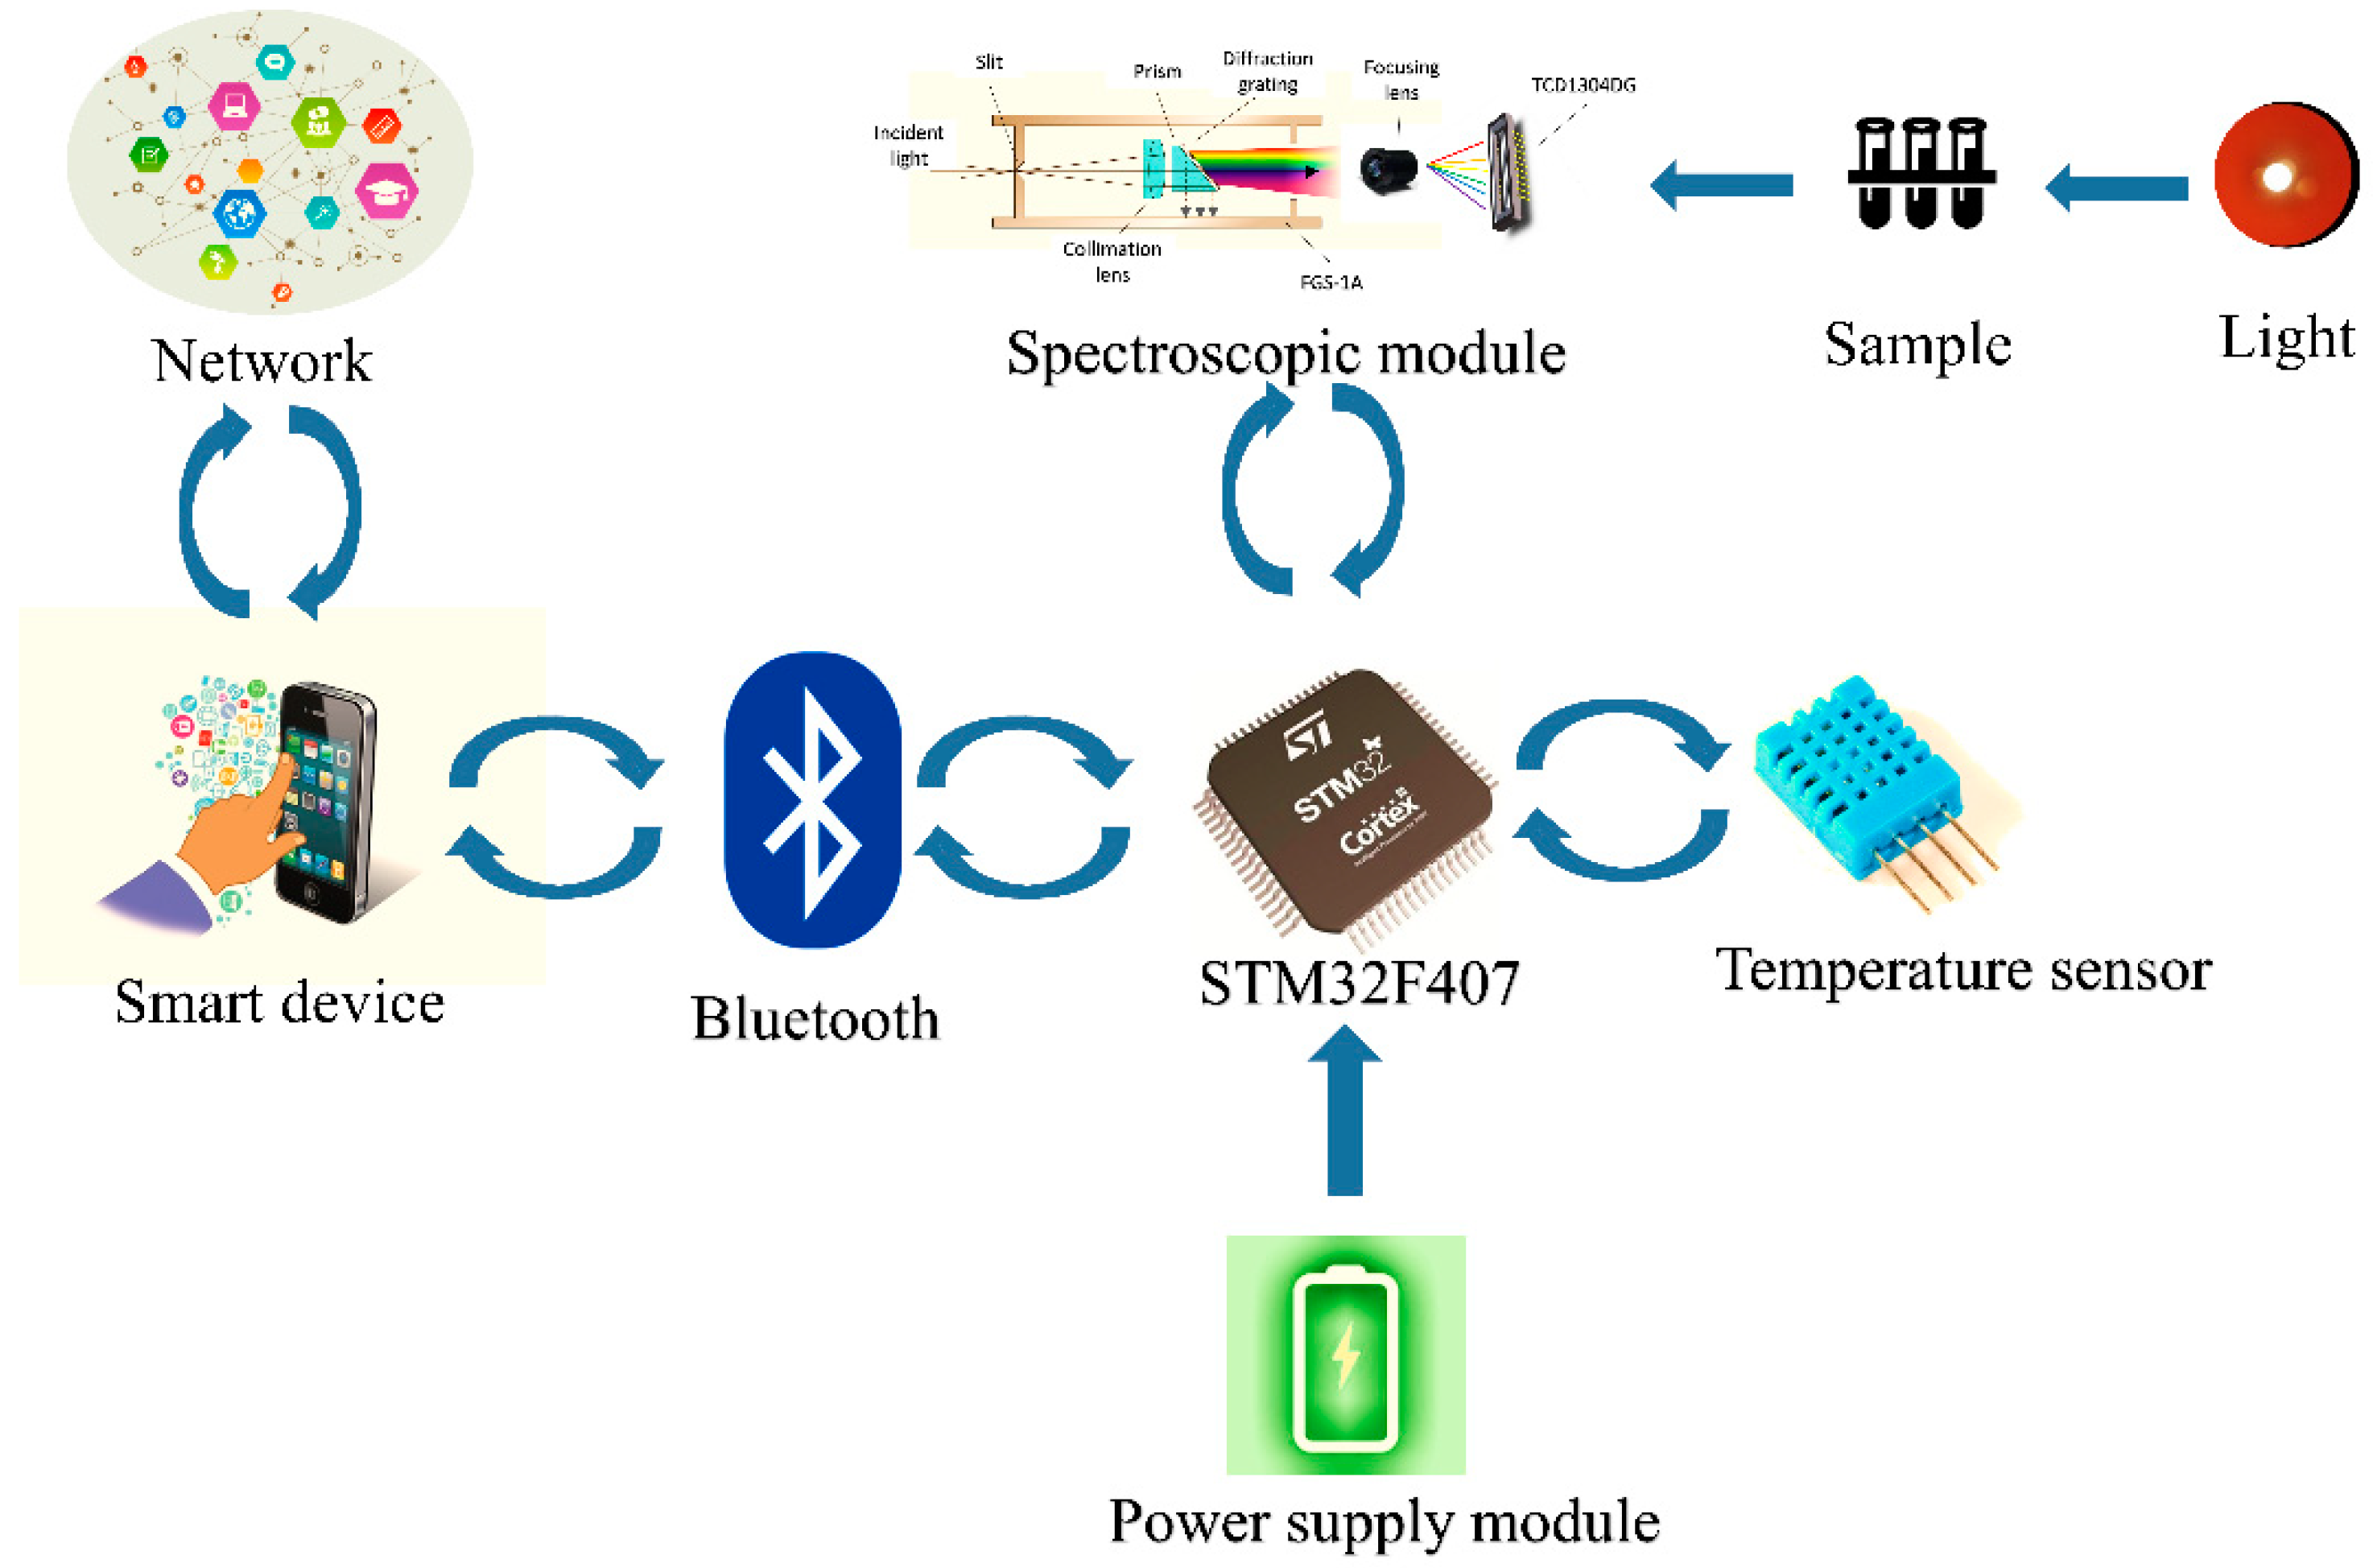
PSS-1.0 consists of seven parts: a light source, a spectroscopic module, a photoelectric detection module, a temperature measurement module, a data transmission module, a digital signature module, and a power supply module. It is a small-volume visible-near infrared spectrometer. It adds digital signatures to spectral data, and transmits the data to smart devices for uploading to the network and performing rapid on-site spectral analysis.
Figure 2 shows the structure of PSS-1.0. It uses a 32-bit microcontroller STM32F407 as a central processor to drive a charge-coupled device (CCD), temperature sensor, and Bluetooth. In addition, the chosen microcontroller supports analog-to-digital conversion and encryption [
7].
2.1. Spectroscopic Module
The majority of portable spectrometers are Czerny-Turner (CZ) spectrometers or variants such as the Schmidt-Czerny-Turner. The spectroscopic system of the CZ spectrometer consists of a collimating mirror, a condensing mirror, and a grating. A common problem with the portable CZ spectrometer is that the incident and exit beams are not co-axial [
8]. The CZ spectrometer represents a typical off-axis system, with problems such as increased size, difficult alignment adjustment, and poor stability. If prisms are exclusively used as the dispersive elements, the dispersion of the spectrometer becomes inhomogeneous, limiting the spectral resolution of some bands. Moreover, the use of diffraction gratings or prisms alone can cause spectrum bending. Prism-grating is a combination of prism and diffraction grating. Since the direction of the spectrum bending caused by the prism is opposite to that of the diffraction grating, the prism-grating can be used to eliminate the spectrum bending. The use of prism-gratings can not only mitigate the problems of off-axis systems, but can also contribute to reducing the size of the spectrometer without compromising uniform dispersion and spectrum bending [
9,
10,
11].
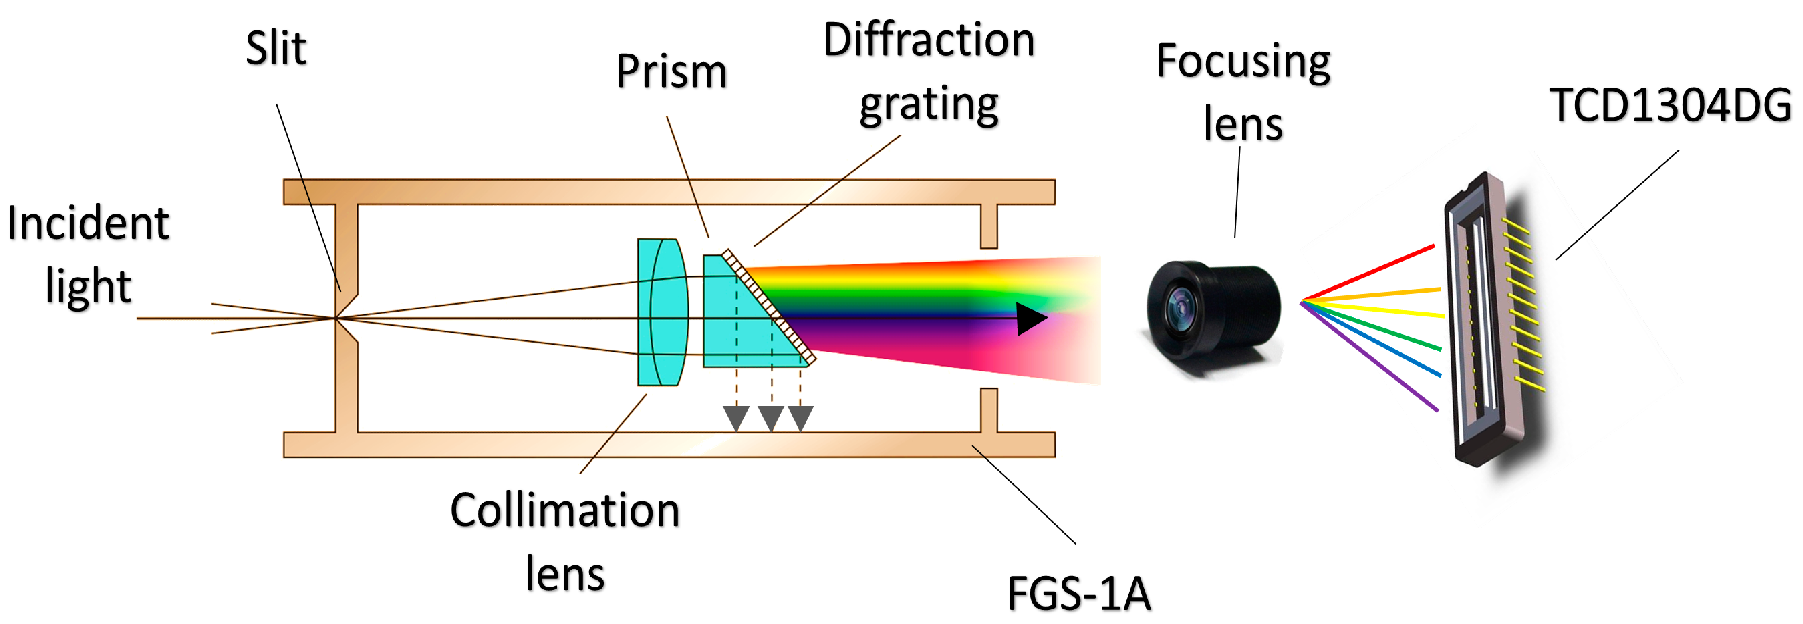
Figure 3 shows the spectroscopic module of the PSS-1.0. It consists of a spectroscope, (FGS-1A, Shenzhen Fable Jewellery Technology Co., Ltd., Shenzhen, China) and a focusing lens. The FGS-1A is a compact spectroscope, integrating optical elements including a slit, collimating lens, and a prism-grating. It has a diameter of 15 mm and a length of 55 mm [
12]. The image focal length of the focusing lens is 16 mm. The length of the PSS-1.0 is limited to 120 mm. As shown in
Figure 3, the incident light enters the slit of the PSS-1.0. After passing through the collimator lens, it is split by the prism-grating and focused on the CCD (TCD1304DG) by the focusing lens. The spectrum output by the spectroscopic module is finally imaged on the receiving surface of the CCD.
2.2. Photoelectric Detection Module
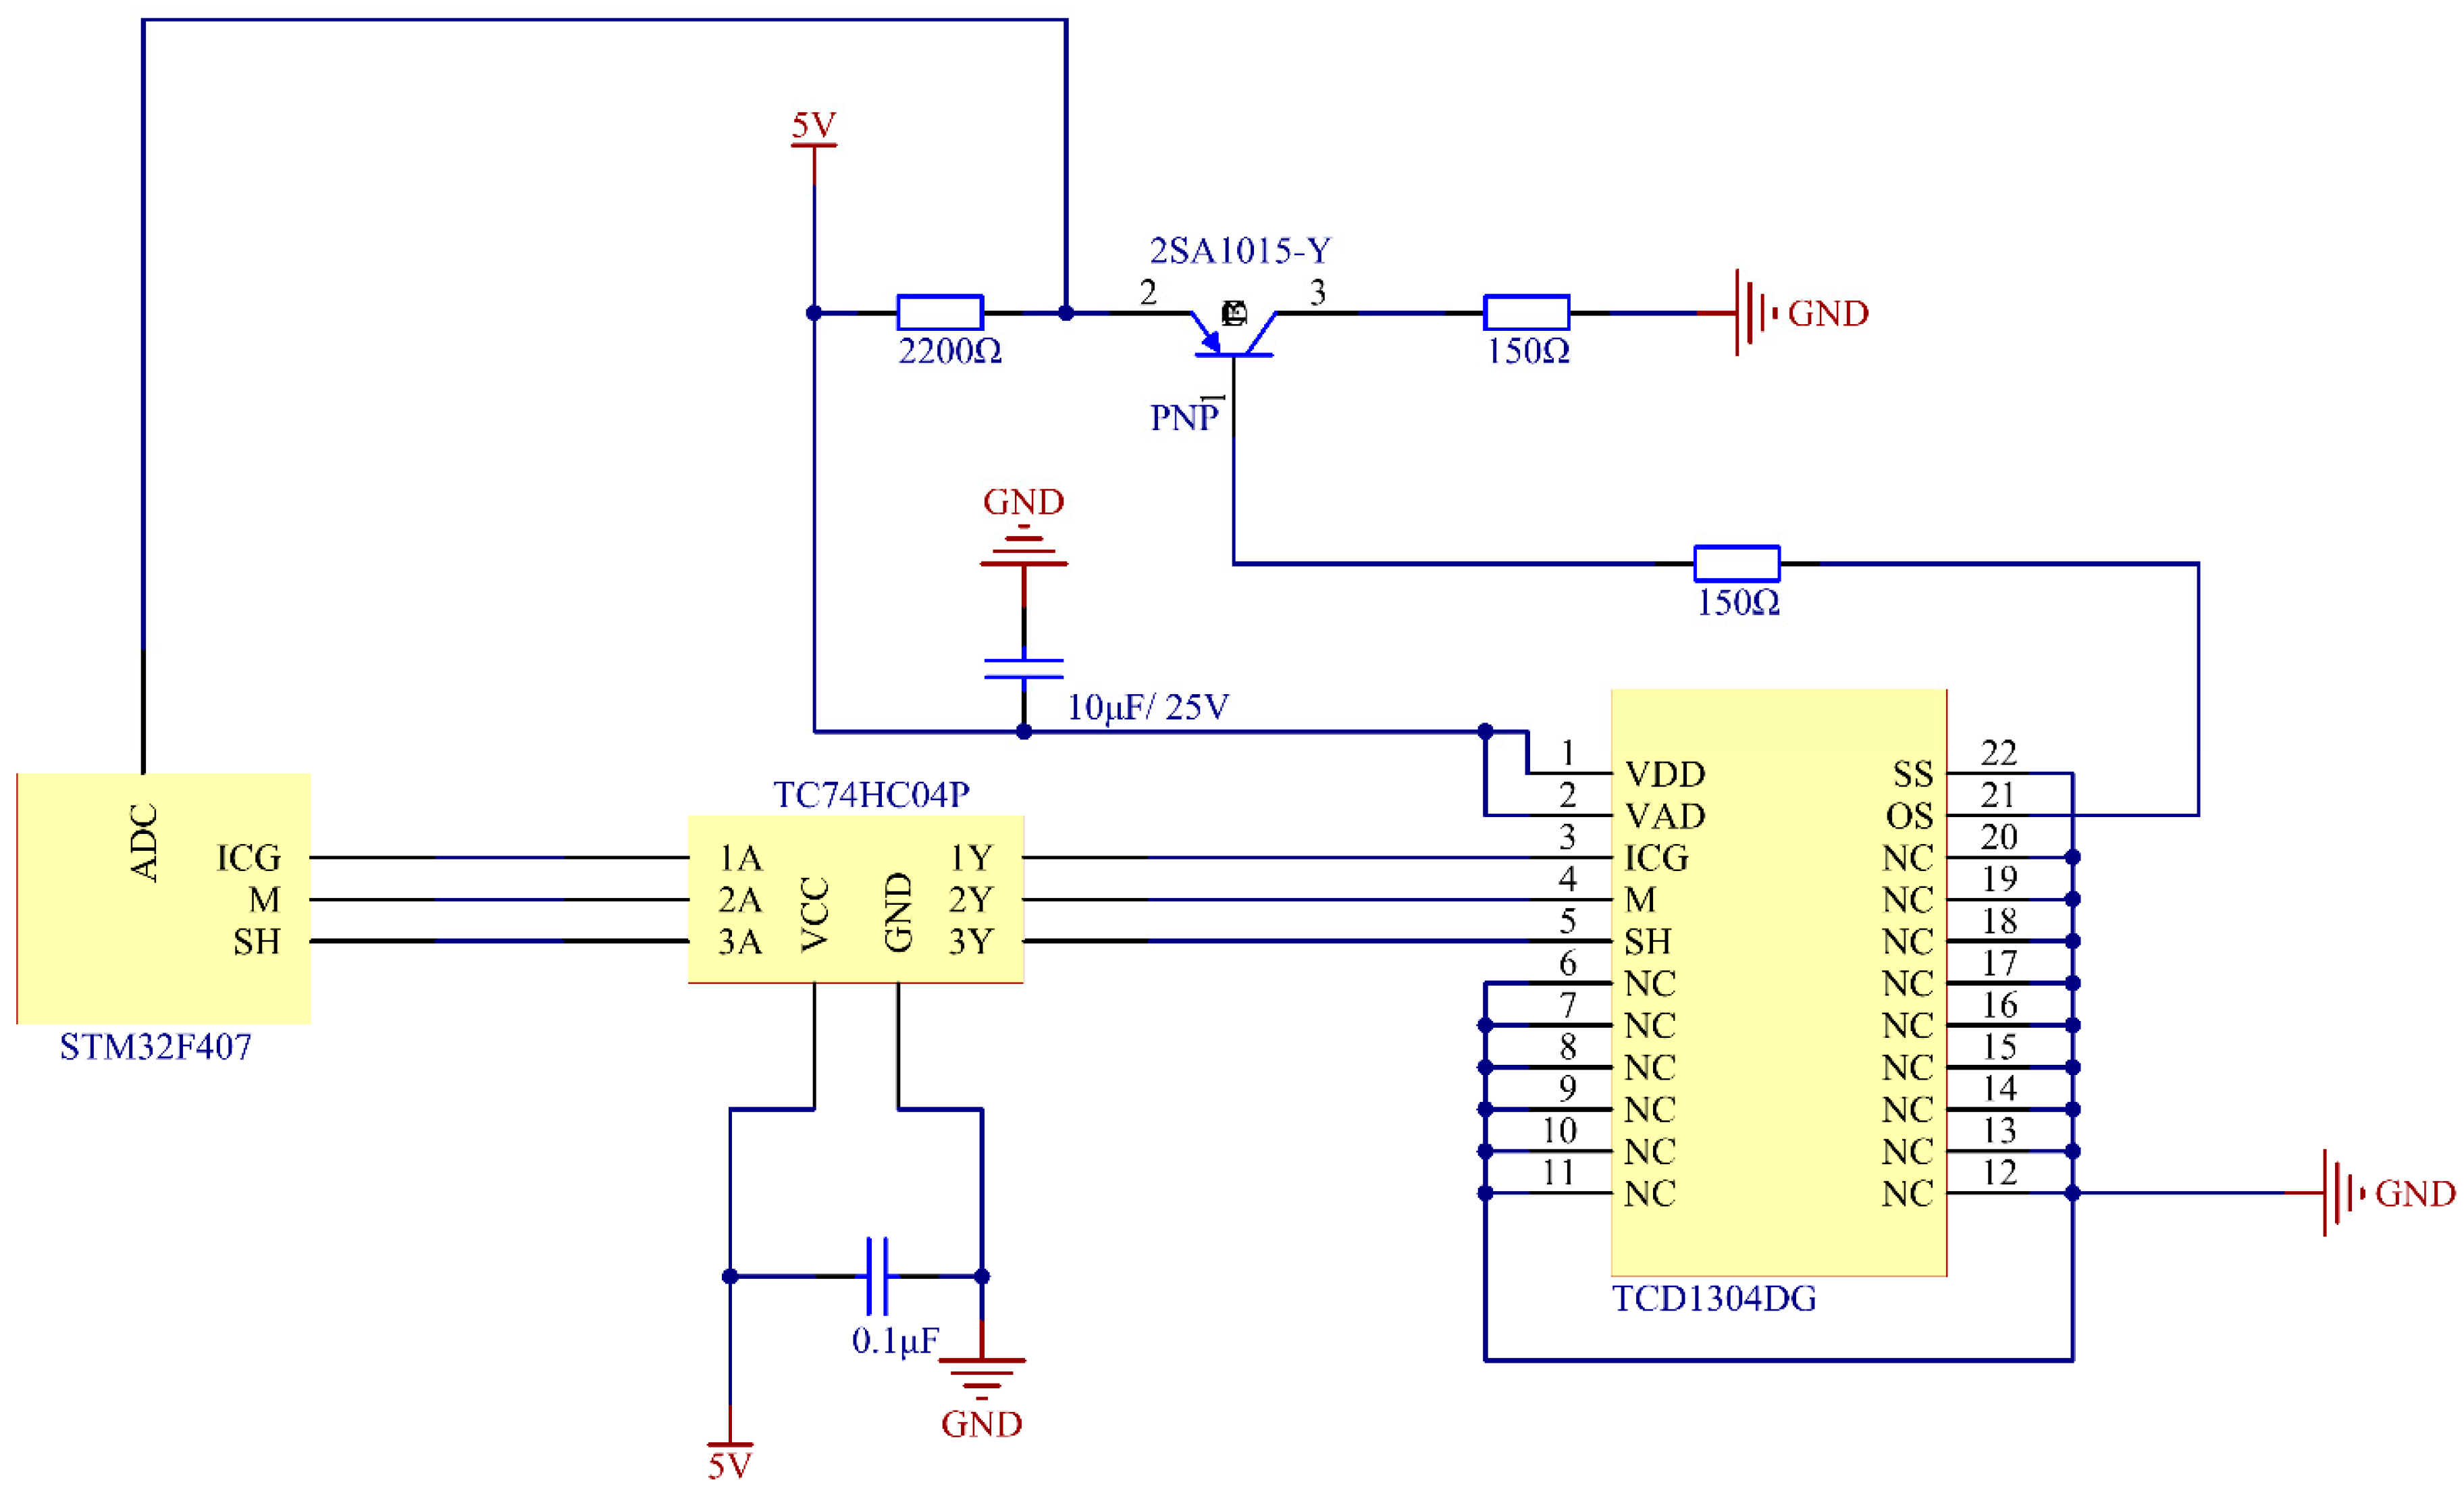
Photodetectors are employed for spectral imaging. The PSS-1.0 employs a TCD1304DG linear CCD (Toshiba) as a photodetector. The TCD1304DG is a low-priced, high-sensitivity, and low dark current CCD, with a spectral range of 400–1100 nm [
13]. The CCD collects the spectral signals output by the spectroscopic module and converts them into analog voltage signals, and then outputs the analog voltage signals to the OS pin.
Figure 4 shows the circuit diagram for driving the TCD1304DG CCD with the STM32F407 microcontroller. The microcontroller increases the drive voltage from 3.3 to 5 V through the TC74HC04P and provides an appropriate timing signal to drive the CCD, then uses the built-in analog to digital converter (ADC) to measure the analog signal output amplified by the 2SA1015-Y from the OS pin. In detail, first, the microcontroller provides a default timing signal for the CCD. The CCD measures the optical signal and outputs an analog signal to the ADC of the microcontroller, which converts the analog signal to the corresponding digital signal. Then, the microcontroller adjusts the integration time of the CCD by changing the timing signal according to the digital signal, so that the integration time is as long as possible without saturating the CCD. Finally, the CCD remeasures the optical signal and the microcontroller obtains the appropriate digital signal as spectral data. That is to say, the photoelectric detection module finally outputs the spectral data.
2.3. Temperature Measurement Module
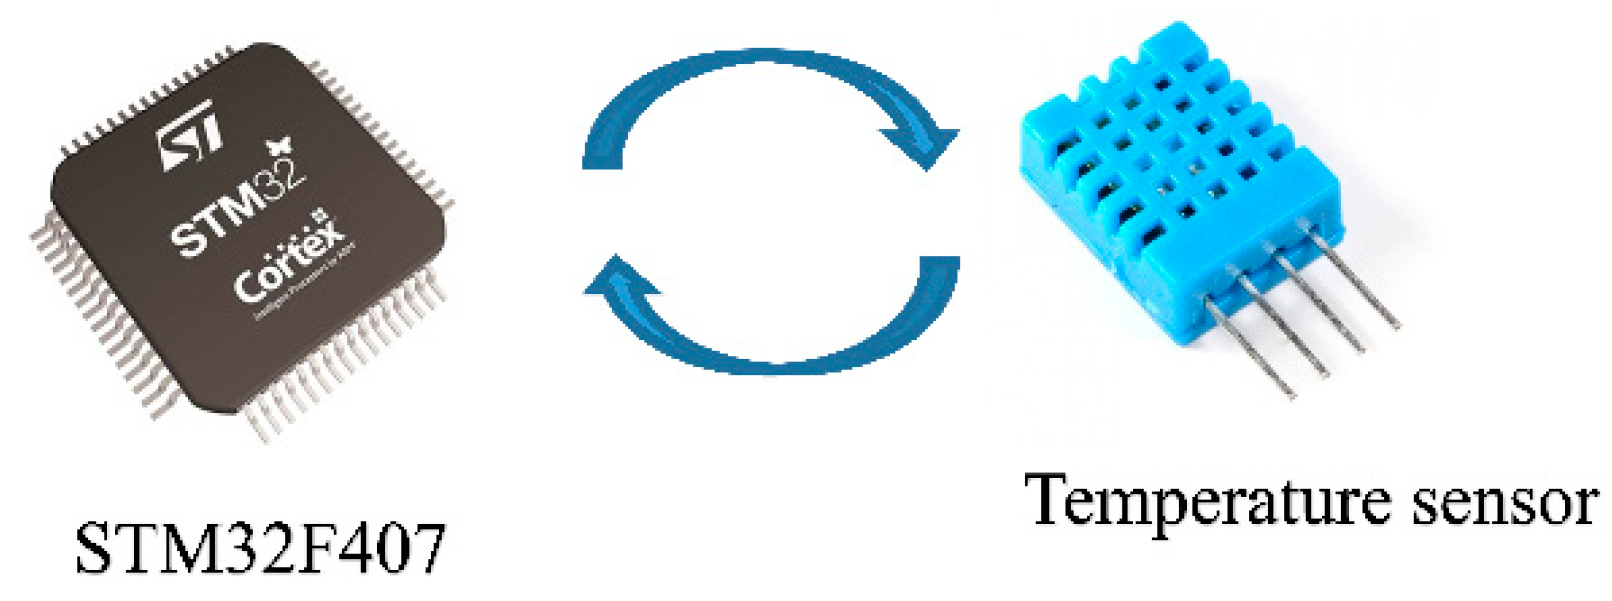
Because the temperature of the spectroscope may affect the measurement of the spectrum [
14], the PSS-1.0 is equipped with a temperature sensor, DHT11 (Guangzhou Aosong Electronics Co., Ltd., Guangzhou, China) [
15].
Figure 5 shows the temperature measurement module of the PSS-1.0. The temperature data are measured by the DHT11 driven by the microcontroller. The temperature data are integrated into the spectral data.
2.4. Data Transmission Module
To make full use of the measured spectral data, it is uploaded to a smart device and the network for sharing and further use. The most commonly used data transmission methods are Bluetooth and USB; however, Bluetooth is more convenient for portable design than USB. Bluetooth 5.0 has low power consumption and a data transmission speed of up to 2 Mbps, which is sufficient to transmit spectral data [
16].
Figure 6 shows the data transmission module of the PSS-1.0. To extend the functionality of the PSS-1.0, the PSS-1.0 is connected to the smart device via Bluetooth 5.0, then uploads the spectral data to a cloud network through the smart device. The result is displayed on the smart device.
2.5. Digital Signature Module
Digital signatures are mainly used to sign digital messages in case of impersonation or falsification of messages, and can also be used for identity authentication of both parties. Applying digital signatures to spectral data can prevent it from being tampered with. The digital signature module is applied to digitally sign the measured spectral data. The CPU speed of the STM32F407 is up to 168 MHz; sufficient to act as a cryptographic module for PSS-1.0. The microcontroller supports the SHA512 encryption algorithm and the Ed25519 digital signature algorithm. They are used to generate public and private keys and to digitally sign data. SHA512 is a kind of hash function. A hash function is any function that can be used to map data of arbitrary size onto data of a fixed size [
17]. Ed25519 is currently the fastest elliptic curve signature algorithm with better performance than the NIST series and higher security than NIST P-256 [
18]. Digital signatures generated by Ed25519 only account for 64 bytes, making it well-suited to embedded devices [
19]. Digitally signing the measured data directly makes the signing take too long and the generated signature data is too large, because the private key can only encrypt a certain length of data at a time. However, the PSS-1.0 first hashes the spectral data with SHA512 and then signs the hash value with Ed25519, which shortens the signing time and reduces the amount of signature data.
3. Spectral Analysis System
Spectral analysis refers to the method of identifying a substance and determining its chemical composition and relative content based on its spectrum. Since PSS-1.0 is a spectrometer for non-professionals, appropriate mathematical models should be built in advance for their use. The labeled spectral data can be pre-collected for building various spectral analysis models.
Spectrometers may be affected by environmental noise and instrument errors when measuring spectral data. In order to reduce the measurement error, the spectral data should be pre-processed. Pre-processing methods include normalization, smoothing, Standard Normal Variate, Multiplicative Scatter Correction and so on [
20]. The spectral analysis model can then be built using deep learning techniques such as convolutional neural network (CNN) and autoencoder [
21,
22]. For example, CNN can be used to build models for the classification of spectral data [
23], such as distinguishing whether a food contains a certain composition.
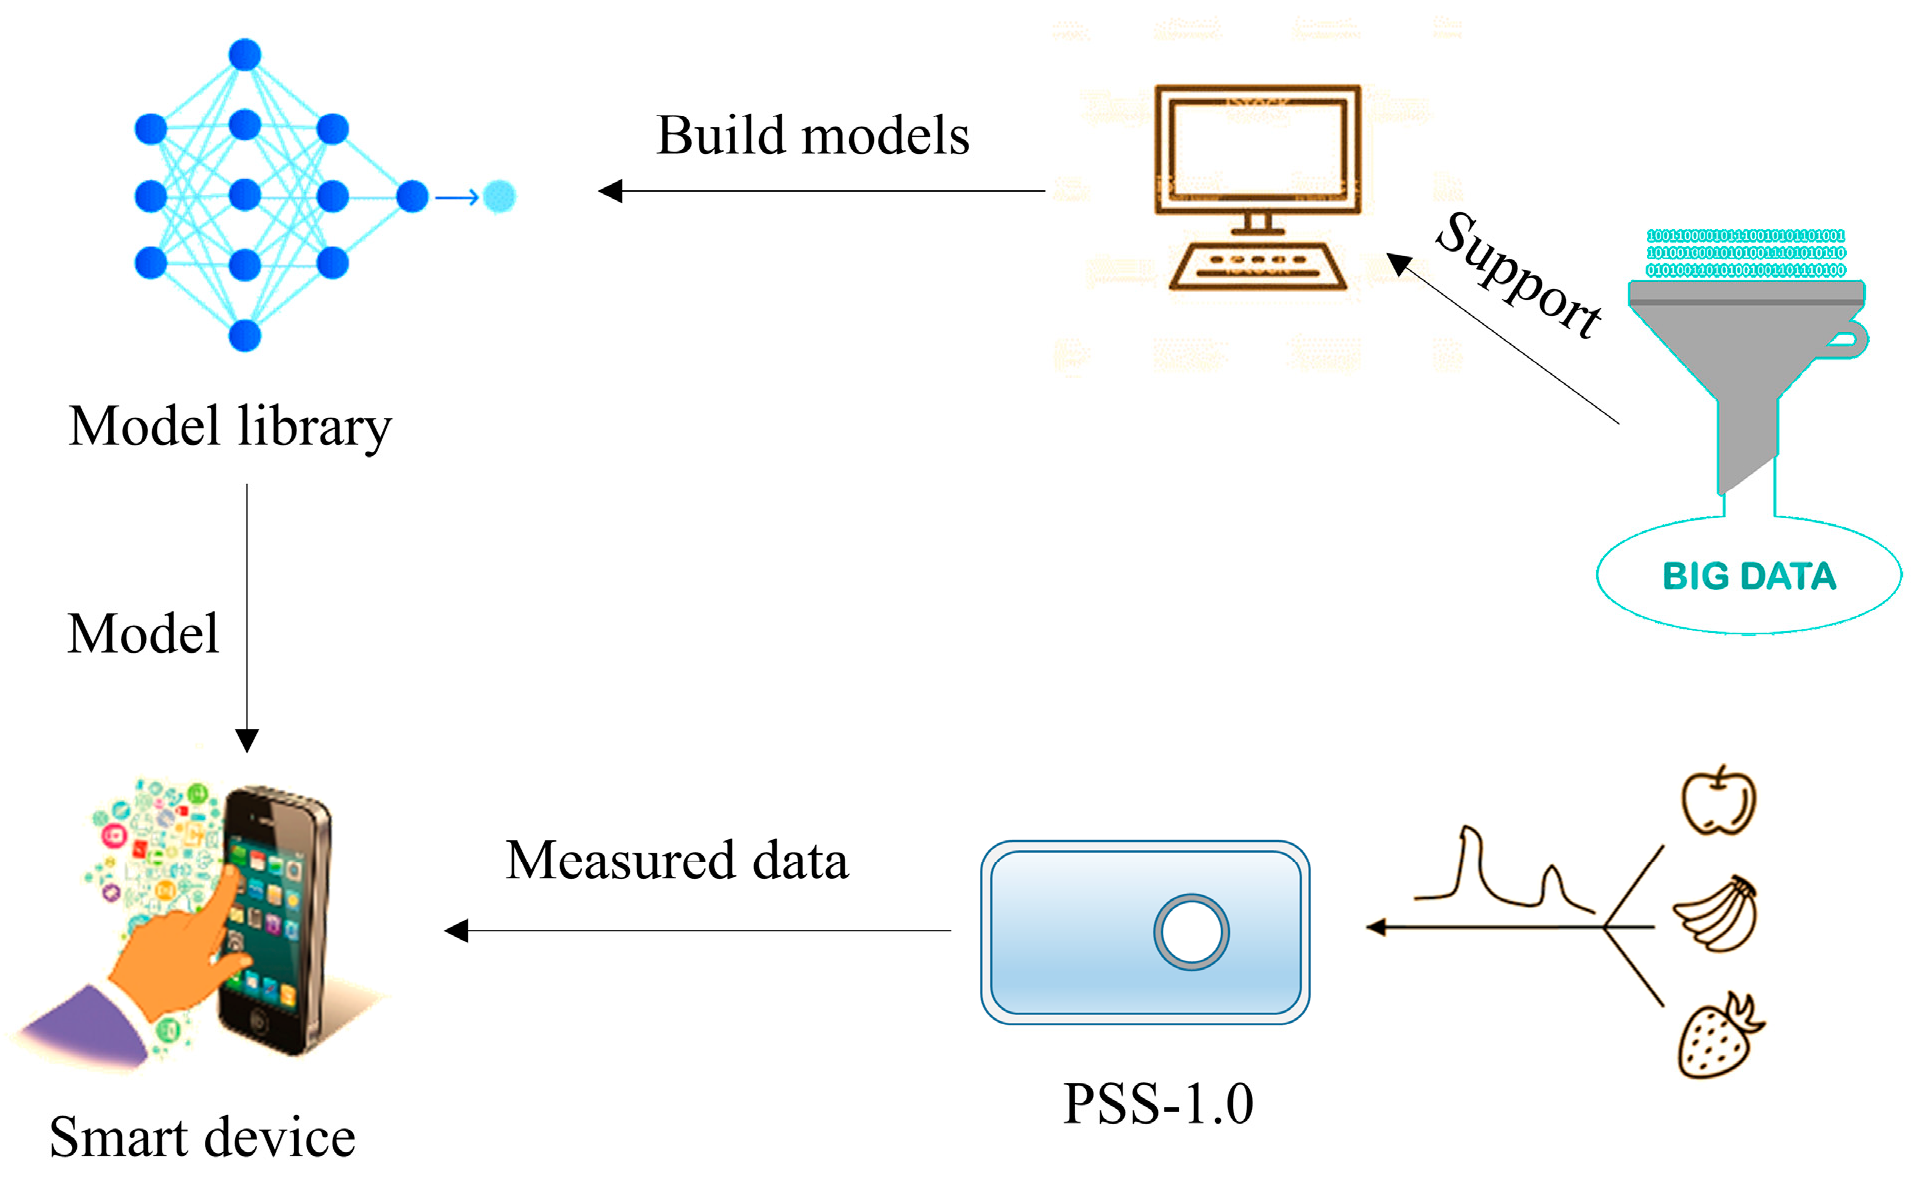
Since online spectral analysis requires spectral data to be uploaded to the cloud and calculation in the cloud, when there are many requests for spectral analysis, the pressure on cloud computing can be large. Moreover, these spectral data may involve privacy and users do not necessarily want to upload them to the network. Therefore, the spectral data should be offline analyzed. Nowadays, most smart devices are sufficient for a small amount of spectral analysis.
Figure 7 shows the spectral analysis system. The spectral analysis system is used to train models and provide model downloads. Spectral analysis models can be refined with the help of big data. The models should be versatile and can be applied to spectral data collected by different specifications of spectrometers. The smart device can download an appropriate spectral analysis model, according to the default or selected item type, to analyze the measured data and obtain the result.
4. Big Data Technologies
With the popularity of portable spectrometers, the scale of future spectral data will show rapid growth, thus it is of great significance to address the storage and management of spectral files. Due to such large size of data, it is difficult to effectively process using the existing traditional techniques [
23,
24]. It is necessary to build a big data management system, which not only facilitates the management of spectral data, but also supports the spectral analysis and blockchain systems. The storage and analysis of spectral big data facilitates the analysis of changes in the production environment, the creation of better models and the understanding of preference data, such as the extent to which users care about a certain attribute of a product. The Hadoop distributed file system (HDFS) can be used to build such a system. The HDFS is a distributed file system suitable for running on commodity hardware, with the characteristics of high fault tolerance, high throughput, and low equipment cost. The HDFS stores data on multiple nodes in a cluster and allows multiple users to access data, making it suitable for distributed storage and distributed computing [
25].
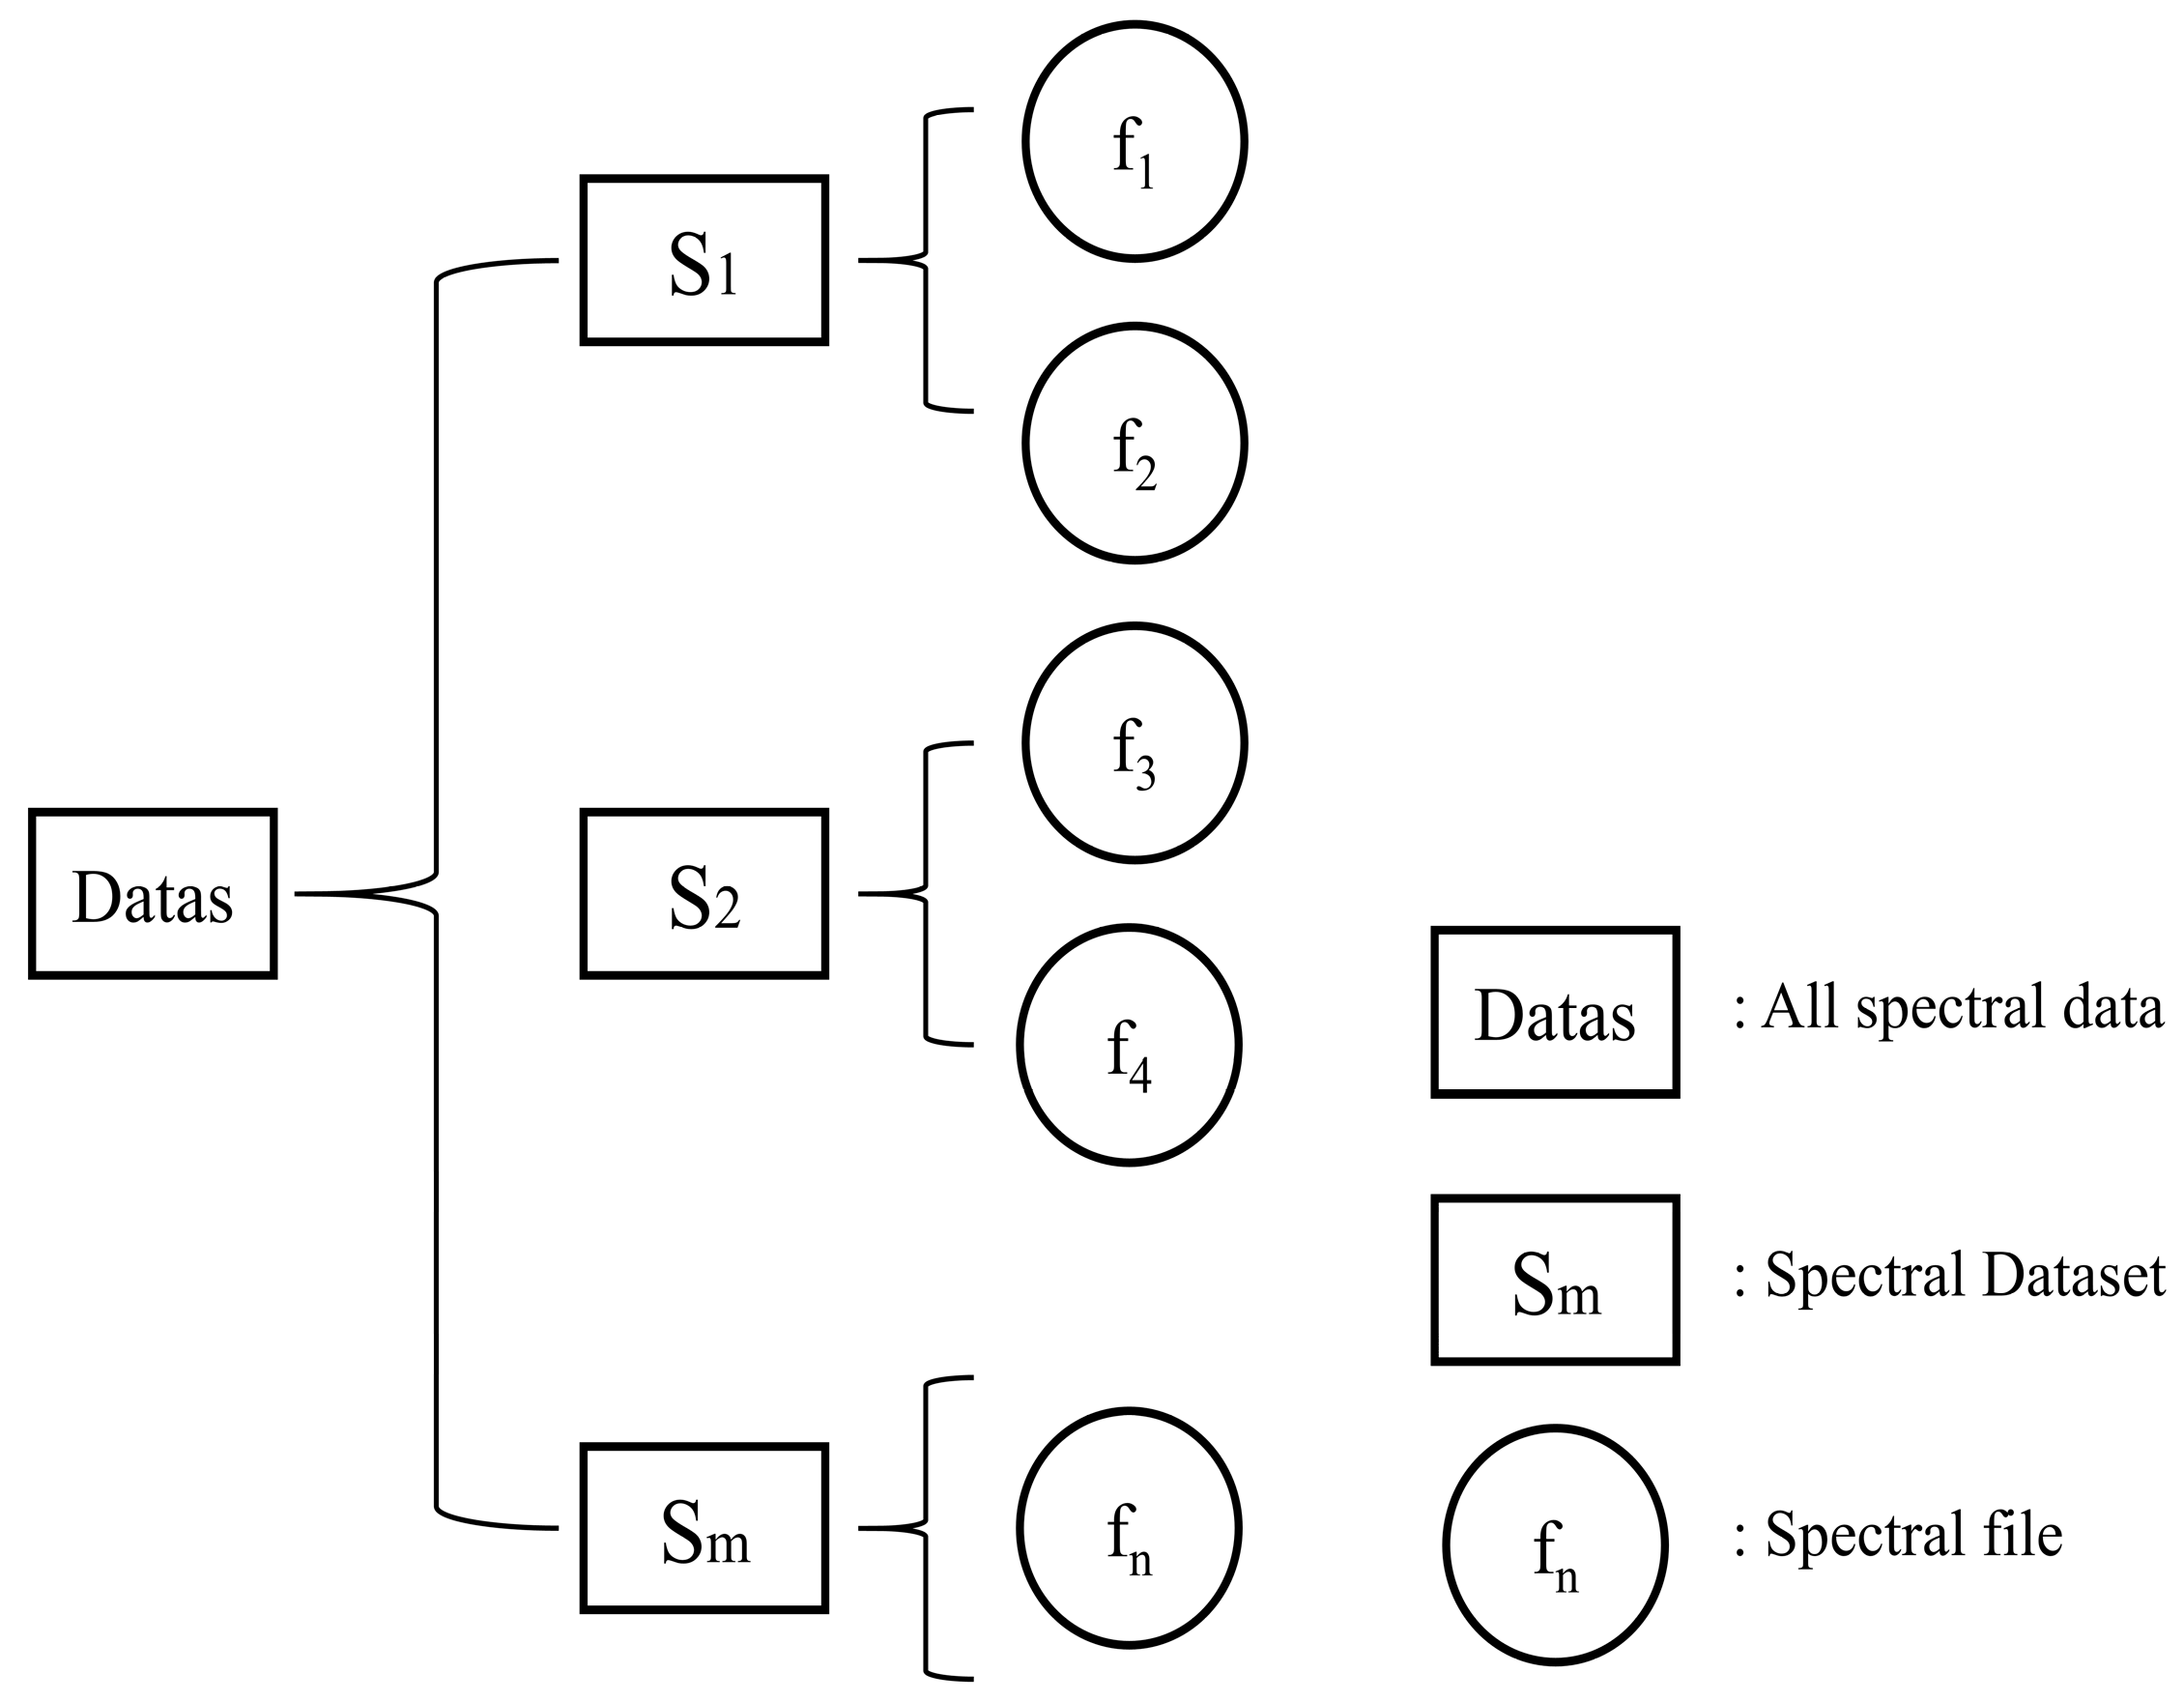
4.1. Management of Spectral Files
Figure 8 shows how to manage spectral files in a big data management system. Spectral files are managed in units of one spectral dataset. Different file directories represent different datasets, distinguished by dataset ID. Spectral datasets can be distinguished according to different application scenarios. For example, dataset A is used for red wine testing and dataset B is used for white spirits testing. The spectral files under a given dataset are at the same level. When creating a new spectral dataset, the system generates a dataset ID, then creates a directory in the data node to represent the dataset and saves all the spectral files to the appropriate spectral dataset directory. When reading a file, the system firstly determines the dataset ID and then reads the file from the directory. In this manner, the spectral files are managed separately according to the dataset to which they belong. In contrast, if spectral data is managed in a single spectral file, all spectral files are at the same level. Although this method results in a simpler file hierarchy, it is less efficient to read and write.
4.2. File Processing of Spectral Datasets
The HDFS is designed to store large files, and the typical size of its file blocks is 64 MB or 128 MB. If it is used to store small files, on the one hand, the storage space of the blocks is wasted. On the other hand, each file must maintain a certain amount of metadata, which will result in inefficient storage [
26]. The collected spectral data has the characteristics of high data dimension and small single files. If no additional processing is performed, the management efficiency will be low. Therefore, small spectral files should be combined in a certain format in advance of storing the spectral data.
Different models of portable smart spectrometers have different spectral ranges and resolutions, so they output different data formats. However, for the same spectrometers, spectral files have the same spectral range and resolution. When merging spectral files, it is only necessary to retain the spectral range once, thus a large amount of information redundancy can be eliminated.
Table 1 shows an example of the spectral file format. “P” represents the item type of spectral measurement. For example, alcohol concentration detection and sugar concentration detection for wine are two different item types. “P” can also represent a combination of multiple item types, such as the combination of alcohol concentration detection, sugar concentration detection and the authenticity of wine. “m” represents the case of the mth measurement. “H” represents the hash value of the data. The hash value can be used as a unique label for the data and its use can be seen in
Section 5. “λ
1” to “λ
n” represents the range of wavelengths. “λ
n” represents the nth spectral component of “P.” “T” represents the temperature value at the time of spectral measurement. “TS” represents the timestamp and “ID” represents the identity of the spectrometer, equivalent to the system ID in the blockchain system.
With the help of big data analysis technology and spectral analysis technology, the recorded spectral data can be used to analyze the relationship between various detection results. For example, the relationship between the alcohol concentration and the authenticity of a certain wine. Moreover, the recorded spectral data can also be used to build spectral analysis models. For example, the content of a chemical constituent in the wine can be obtained by spectral analysis according to the spectral data, and then based on a large number of analysis results, a spectral analysis model for detecting the content of this chemical constituent in the wine can be built.
5. Blockchain System
Blockchain is a public database that records data as chained blocks. It is essentially a decentralized architecture built on a multi-party consensus which based on multiple peers. Peers in the blockchain are primarily used to endorse legitimate transactions and record legitimate transactions on blockchain ledgers. Blockchain records data through transactions and ensures data consistency through cryptography. It involves computer technologies such as distributed data storage, peer-to-peer transmission, consensus mechanisms, and encryption algorithms, and is increasingly often used for preventing data from being tampered with, data traced and trusted transaction [
5,
27,
28].
The data acquired by conventional spectrometers can be tampered with; thus, the reliability of data from other spectrometers is low and the data credit is very low. This problem can be solved by blockchain technology. Specifically, each spectral data is bound to the spectrometer used by digital signature. Further, the uploaded spectral data is only recorded by the peers of the organization that produces, purchases, uses or represents the PSS-1.0, and blockchain records tag information related to the spectral data, such as hash value, signature, timestamp, and system ID. Only if each spectral data has a specific identity and each data recorder stores the spectral data or its digest, can historical spectral data be trusted by users, in which case historical spectral data becomes valuable. Therefore, blockchain technology can reduce the cost of reviewing spectral data.
5.1. Blockchain Platform Selection
Hyperledger Fabric is suitable for implementation of the blockchain network [
29]. Hyperledger Fabric is a consortium blockchain development platform in which participants have a known identity and access to it requires a license. It is a scalable architecture with convenient functional plug-in attribution and does not require mining, which reduces the cost of computing [
30]. Different data record peers and data request peers jointly build a blockchain network based on the Hyperledger Fabric. The data recorder records the identity information of the measured spectral data in the blockchain network which prevents data from being tampered with, so that the other participants can call the data recorders’ data and trust its authenticity.
5.2. System Architecture
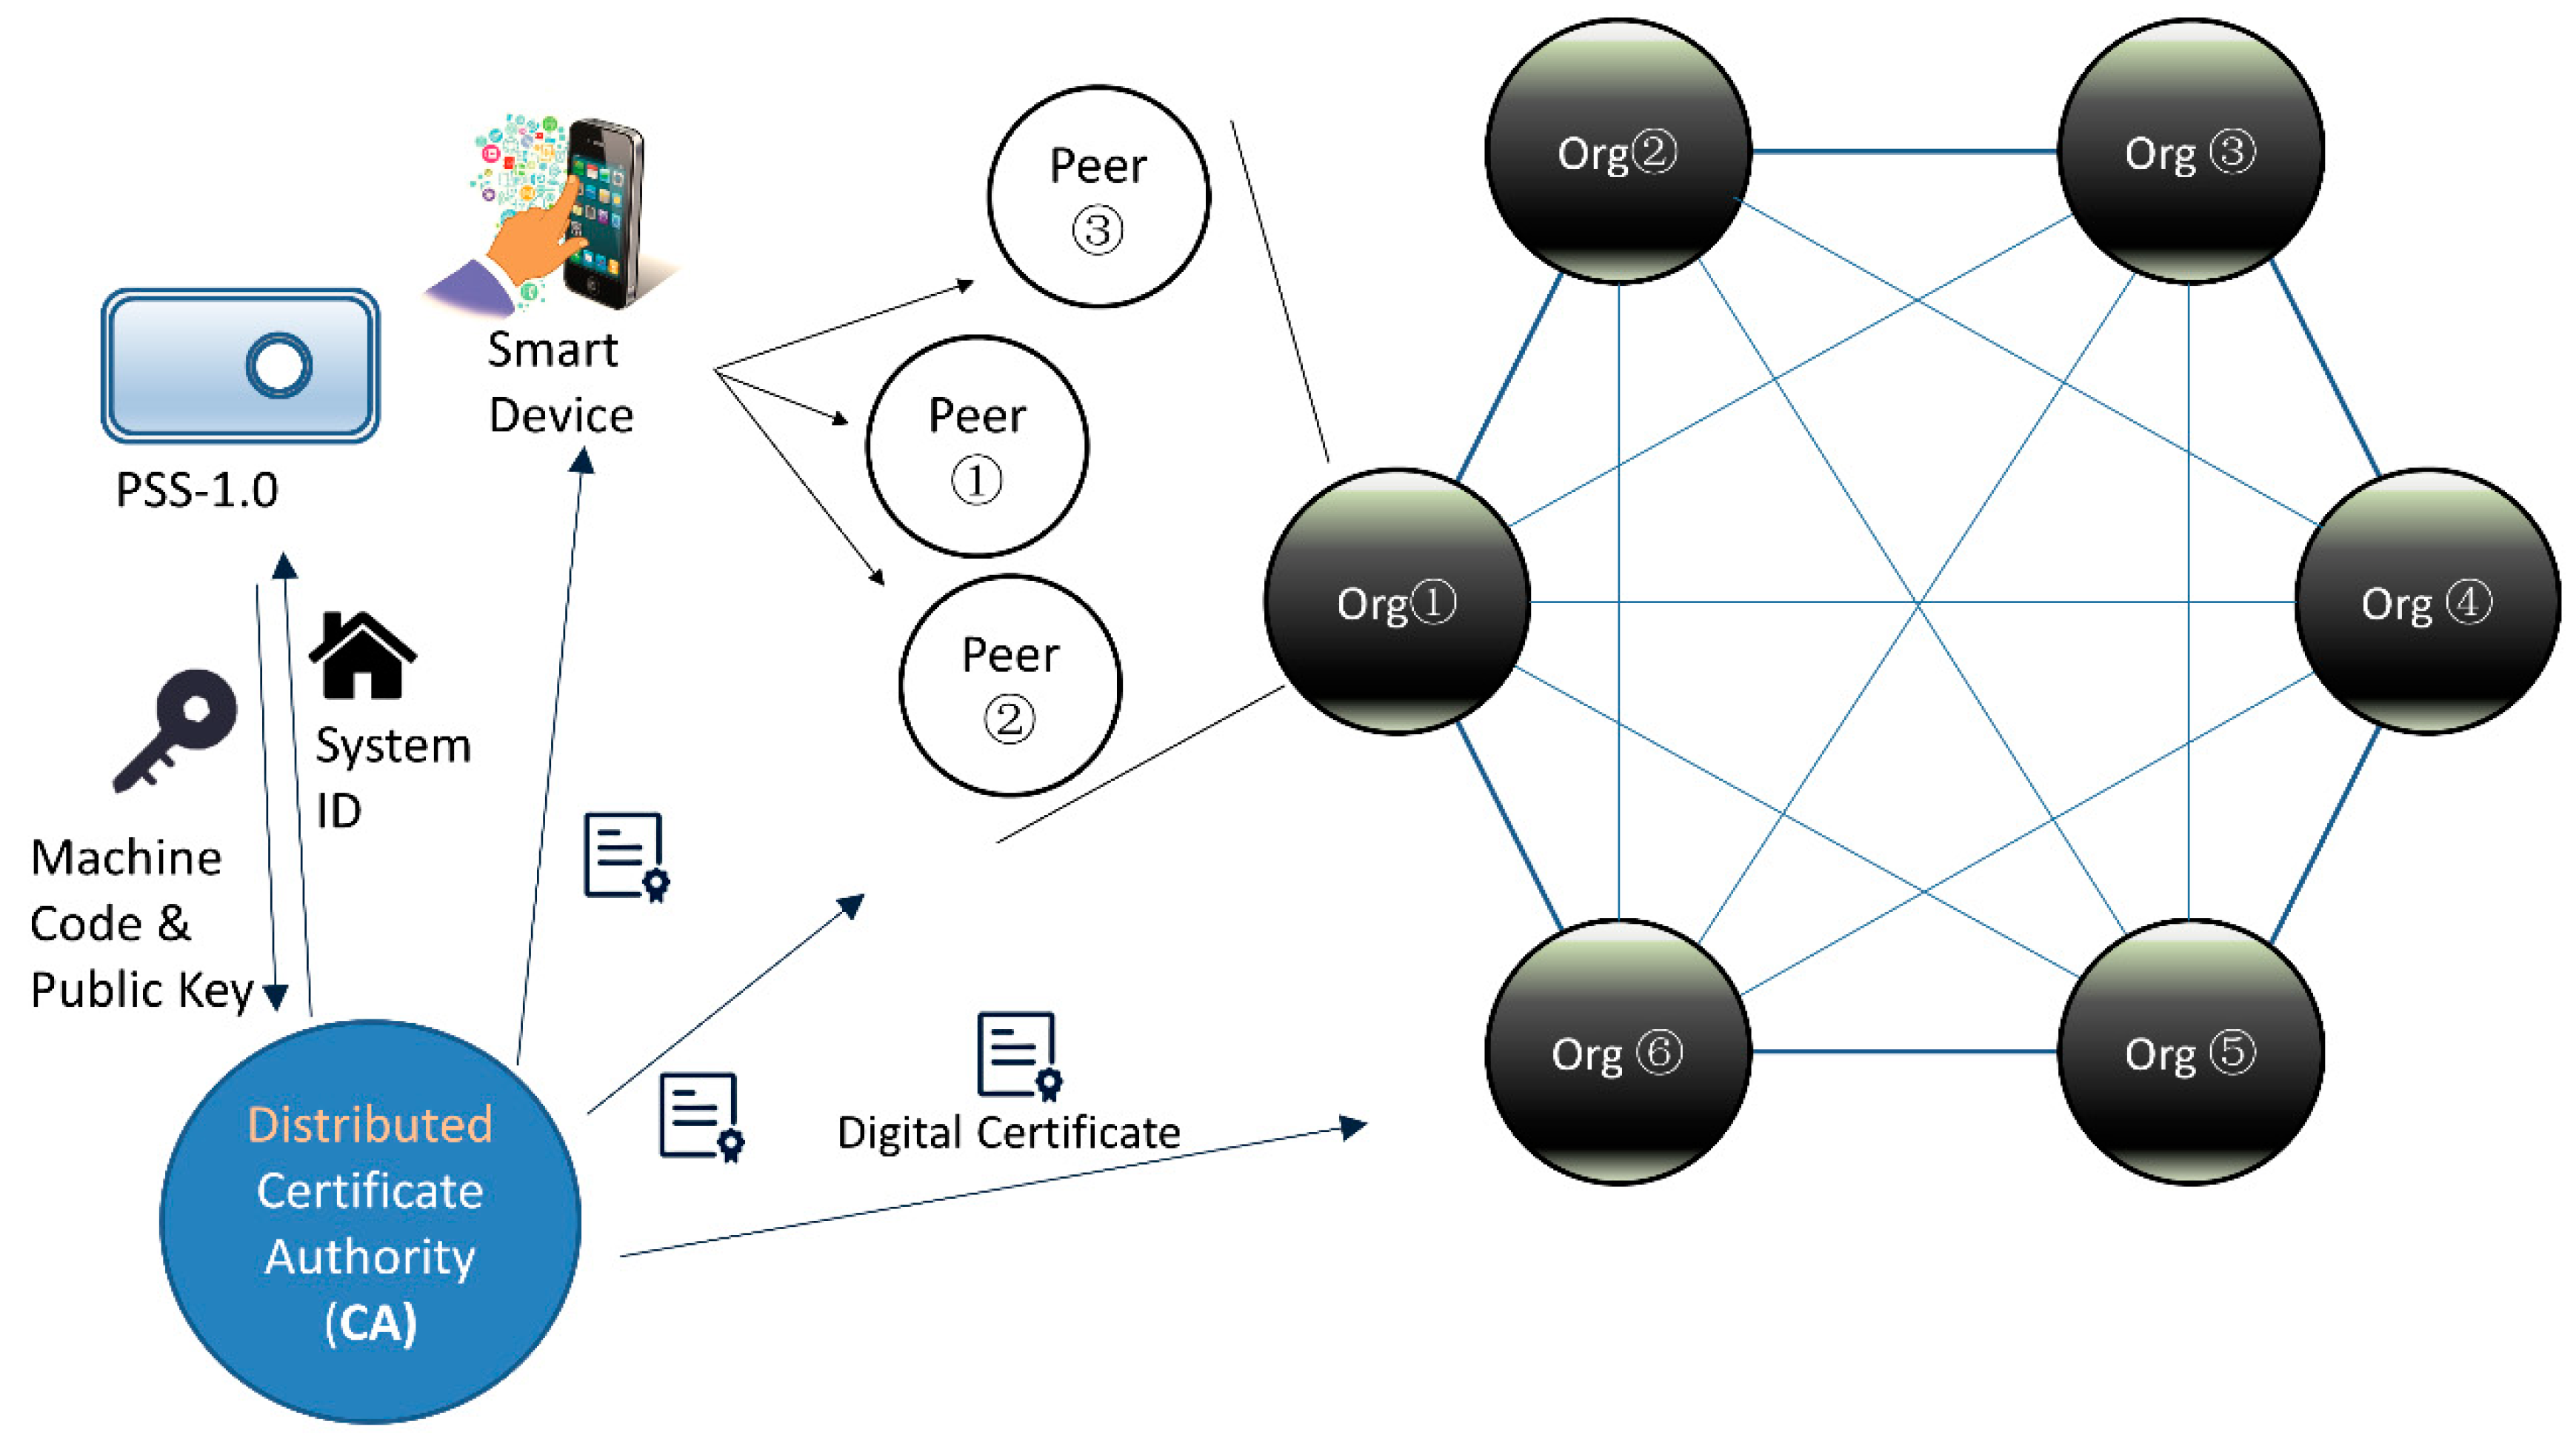
The overall blockchain system model is shown in
Figure 9. The blockchain system is constructed on a decentralized network, which connects all organizations that can provide peers for recording spectral data, including data requesters and data recorders. Each organization has one to several peers. The Certificate Authority (CA) in the blockchain is employed to manage, distribute, and revoke digital certificates and distributed across every organization, so the authenticity of data and digital signatures does not depend on the authority of the CA.
5.3. Account Creation
Access to the blockchain network is provided by an ID card (digital signature). It can be used to create transactions.
The blockchain network records the unique machine code (microcontroller machine code) of each PSS-1.0. When a PSS-1.0 is used for the first time, it is connected to the smart device via Bluetooth. Then, it uses the Ed25519 algorithm to generate a pair of public and private keys and write them into flash memory for saving. The PSS-1.0 sends the machine code and the public key through the smart device to the CA of the blockchain network to create an account. If the blockchain network has a record of the machine code, it records the public key and returns a system ID to the PSS-1.0. Finally, the PSS-1.0 records the system ID to flash memory.
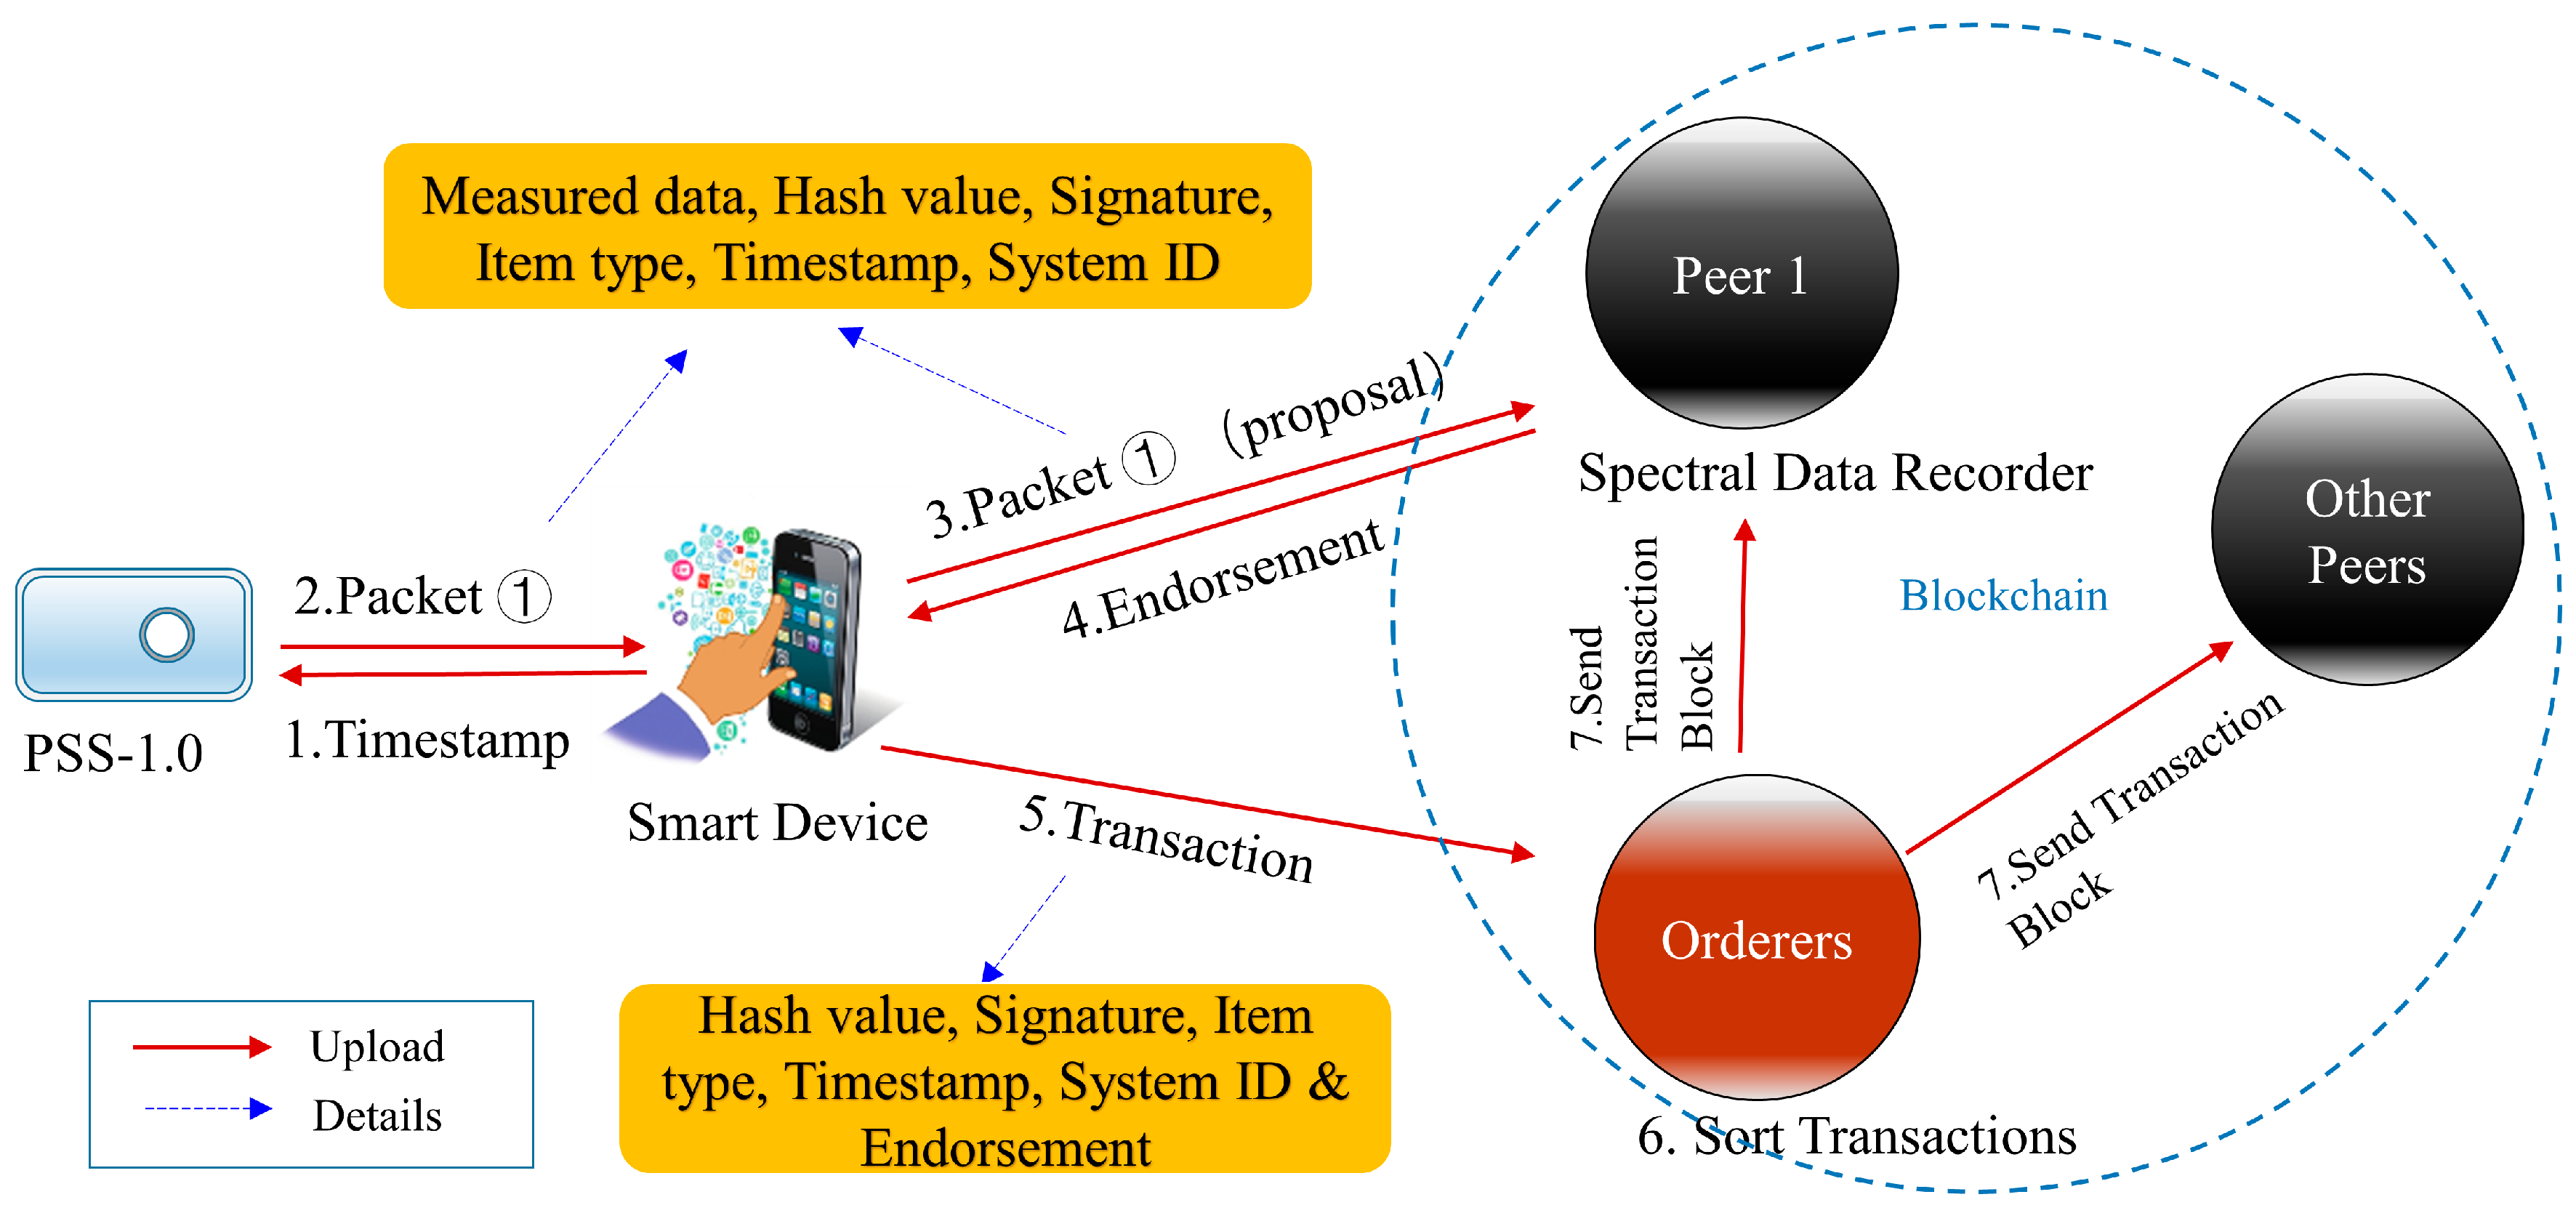
5.4. Transaction Process
A transaction is a carrier of information to be exchanged in a blockchain.
Figure 10 and
Figure 11 show how the PSS-1.0 processes measured data and uploads it to the blockchain network as a transaction:
After the PSS-1.0 measures the spectrum, it connects to the smart device via Bluetooth.
The user selects an item type and the smart device downloads a spectral analysis model according to the item type.
After measuring the spectrum, the user can set the PSS-1.0 to save the measured data to local storage or upload it to share it.
If upload is selected, the PSS-1.0 obtains the timestamp through the smart device.
The PSS-1.0 hashes the item type, measured data, and timestamp with SHA512 to obtain a hash value.
The PSS-1.0 signs the hash value with the private key stored in flash and packs the hash value, the item type, measured data, timestamp, signature, and system ID into packet ①.
The PSS-1.0 sends packet ① to the smart device via Bluetooth.
The smart device sends the packet ① as a proposal to the peers to which the PSS-1.0 belongs (e.g., the peers of the organization that produces, purchases, uses or represents this PSS-1.0.).
The above peers receive the proposal, verify the signature using the public key corresponding to the system ID, and check the data format.
If the verification is passed and the data format is correct, the peers save the data in the big data management system according to
Table 1, then provide endorsements and send them to the smart device. If the verification fails, the data cannot be recorded into the blockchain.
The smart device receives the endorsements, checks their legitimacy, and sends the hash value, signature, item type, timestamp, system ID, and endorsements to the orderer nodes of the blockchain network as a transaction for recording. The orderer nodes sort and package transactions into a block and send it to all peers. After peers update the ledger status according to the transactions in the block, the blockchain completes the record of the relevant data.
To encourage individual users to upload data, the organization that records the spectral data may reward the account based on the record of the uploaded data.
The data requester can select the required data through the item type, timestamp, or system ID recorded in the blockchain network, and request data from the data recorder through the hash value. The data recorder can query the data based on the hash value through the big data management system and provide the corresponding data to the requester. The requester can authenticate the authenticity of the data by calculating the hash value of the data. These operations are also recorded as transactions on the blockchain so that data recorders can charge accordingly. Because no device stores the private key except the PSS-1.0 itself, no data recorder can change the data without being discovered. Real data guarantees the feasibility of data reuse and increases the value of the data.
5.5. Related Applications
The authenticity of spectral data is especially important if spectroscopy is applied to regulatory uses such as food inspection. For traditional IoT-based regulation methods, the regulated organizations may tamper with the measured spectral data and results in order to deceive the regulators, or the regulators may modify the measured spectral data and results themselves. The authenticity of the data is then questionable. Applying blockchain technology to regulatory uses can increase the credit of the data.
Blockchain technology uses decentralized public ledgers to ensure reliable data and reduce the cost of data review, making it possible to make trusted transactions of spectral data possible, and the regulators can easily apply spectroscopy to the regulation of certain industries. Industries such as food production and industrial wastewater treatment can be effectively regulated using spectroscopy and blockchain technology. The regulators can work with the relevant regulated organizations to build a blockchain network, and the regulators install a smart spectrometer with blockchain technology like the PSS-1.0 in a specific area of the regulated organizations. The regulated organization must upload relevant spectral data to the blockchain network in real time, and the regulators and this regulated organization have the authority to record spectral data, or to record only the results of the spectral analysis. Other regulated organizations only record digest of the spectral data, including hash values, digital signatures, system IDs, time stamps. Then, no one can tamper with the spectral data, and it can protect the privacy of the regulated organization to some extent.
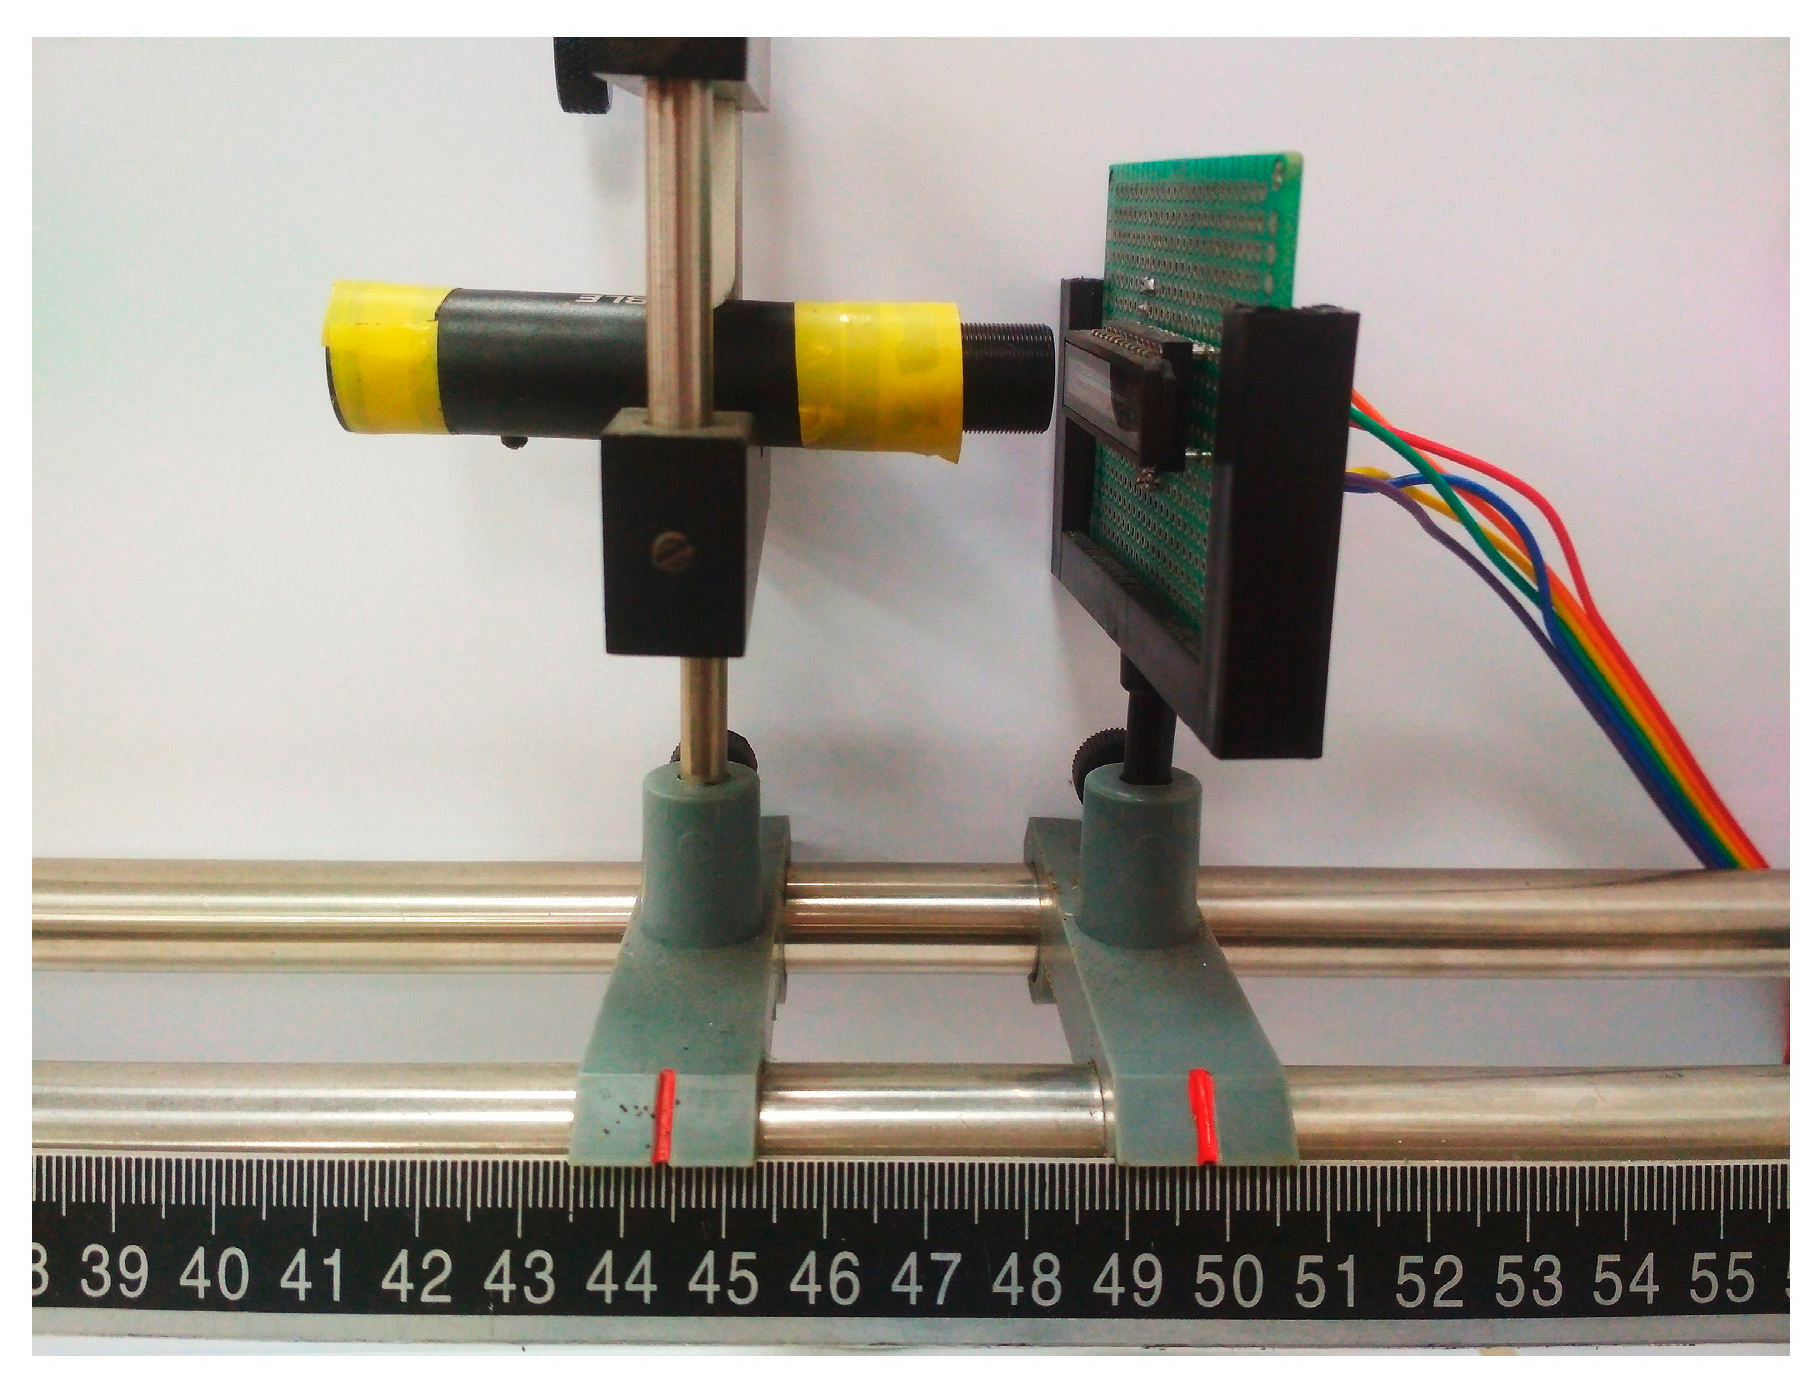
6. Results and Discussion
Figure 12 shows the prototype PSS-1.0. The PSS-1.0 was tested and compared with a commercial spectrometer (HR2000, Ocean Optics, Inc., Largo, FL, USA) [
31].
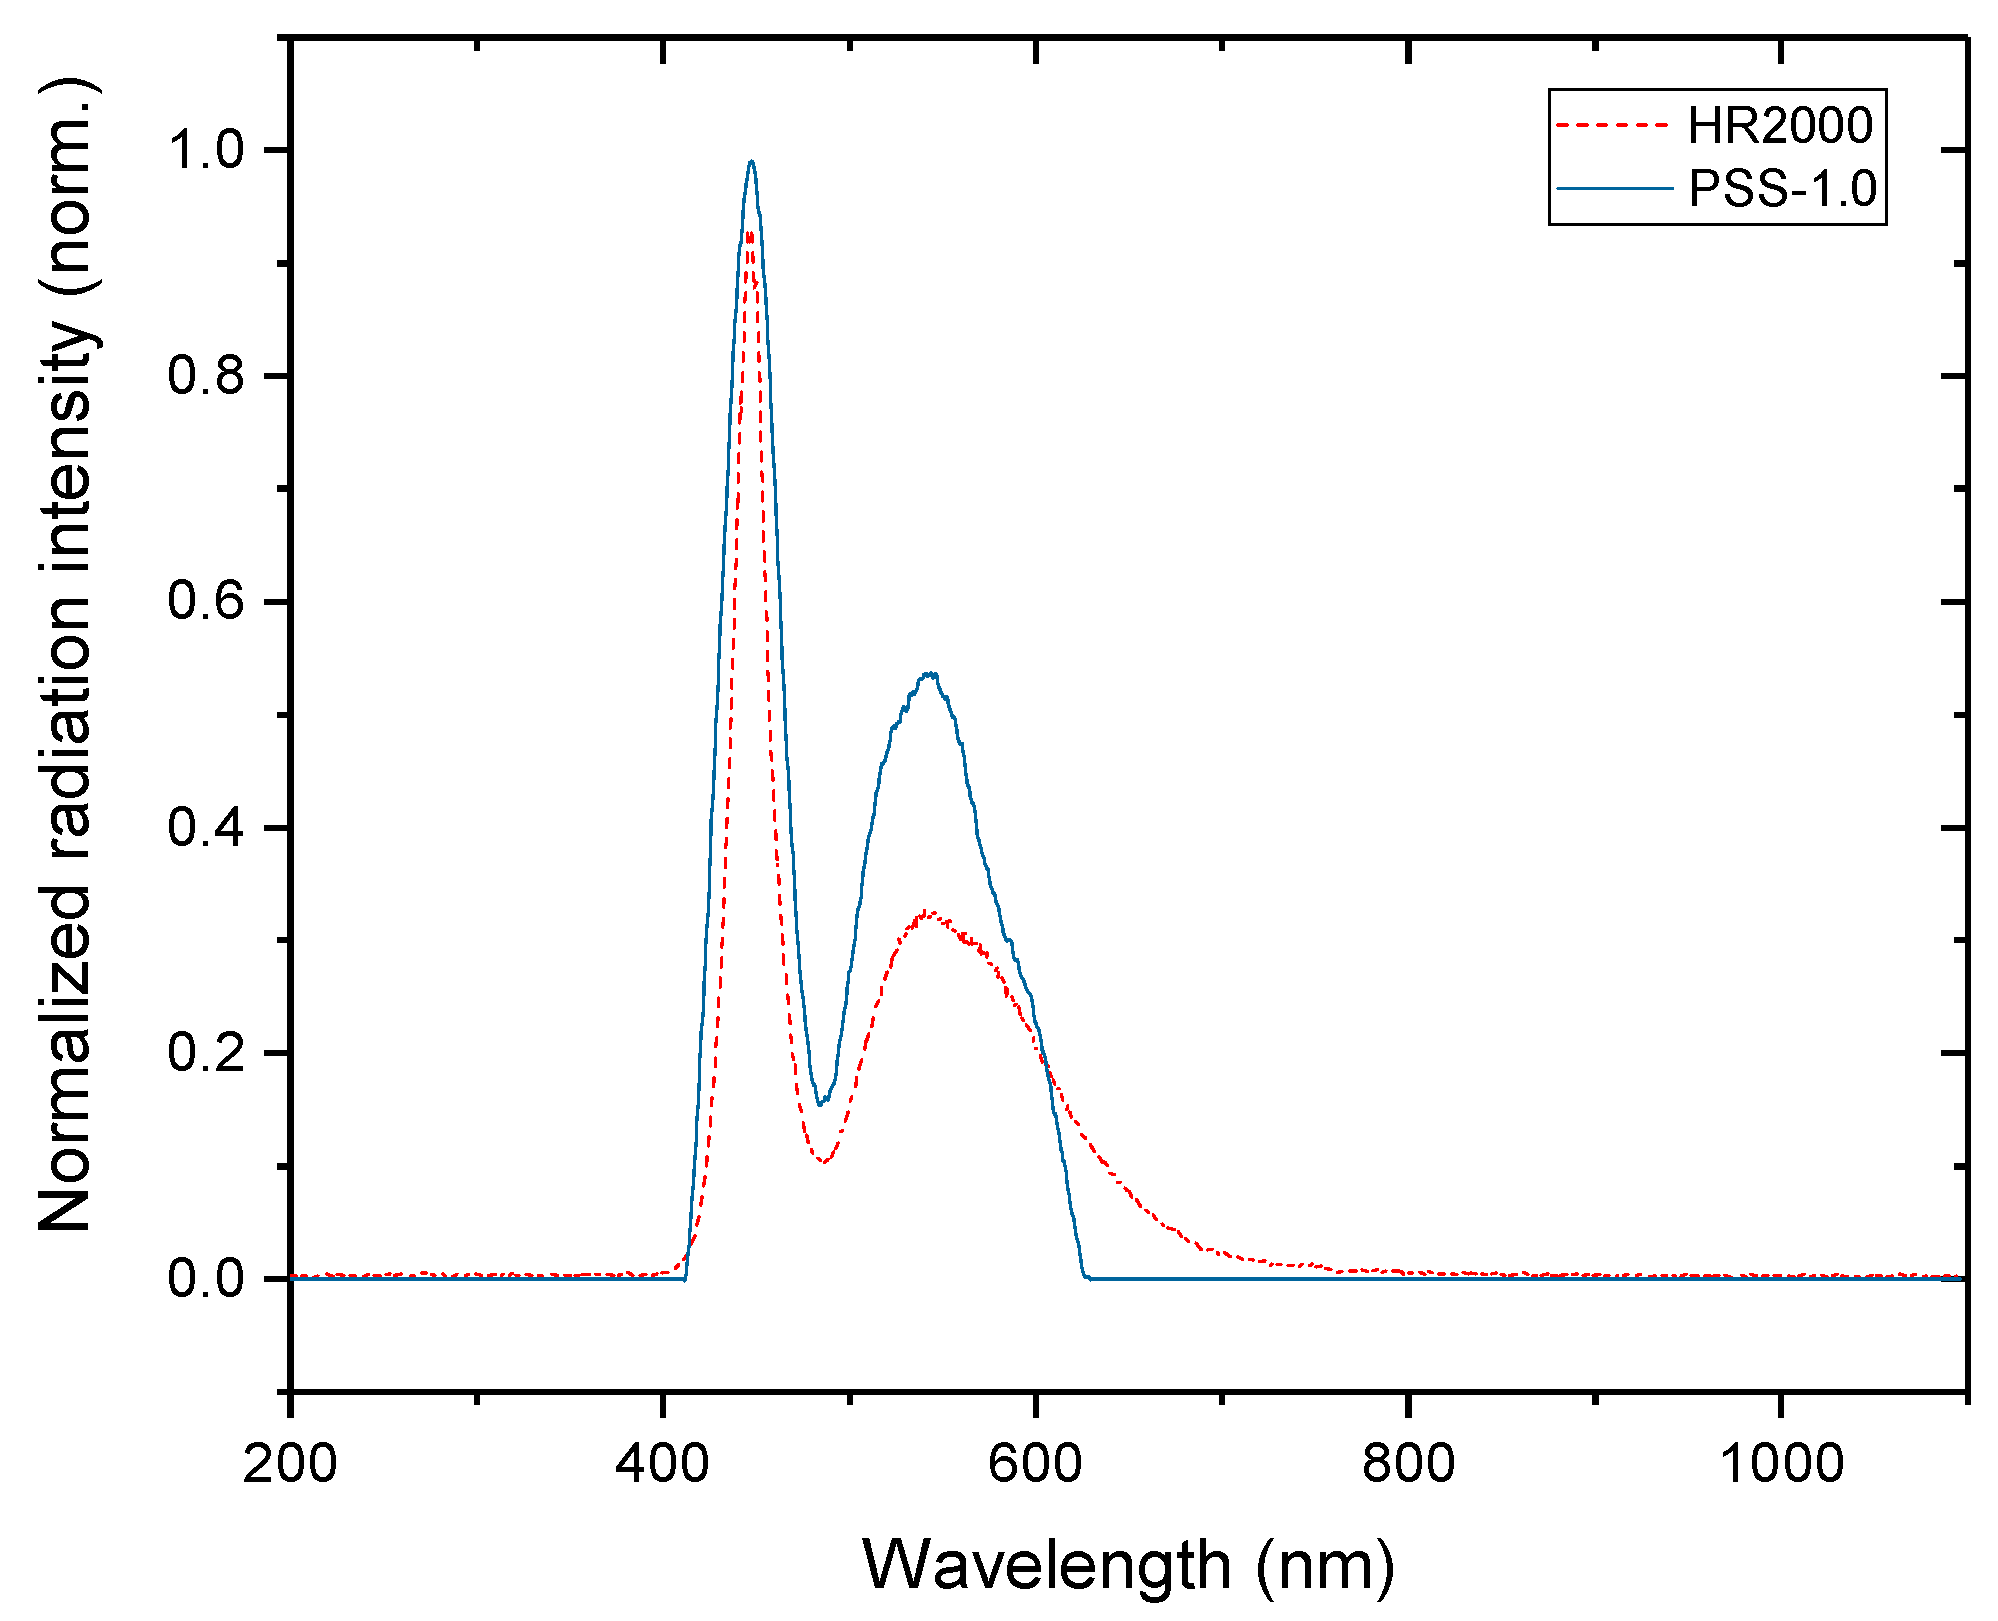
Figure 13 shows measurement of a white LED by each spectrometer. The PSS-1.0 was not radiometrically calibrated. The spectral data of both spectrometers is normalized. It can be seen that the envelope of the PSS-1.0 and the HR2000 are similar and the characteristic peak positions are essentially the same. Therefore, the design of the PSS-1.0 is feasible.
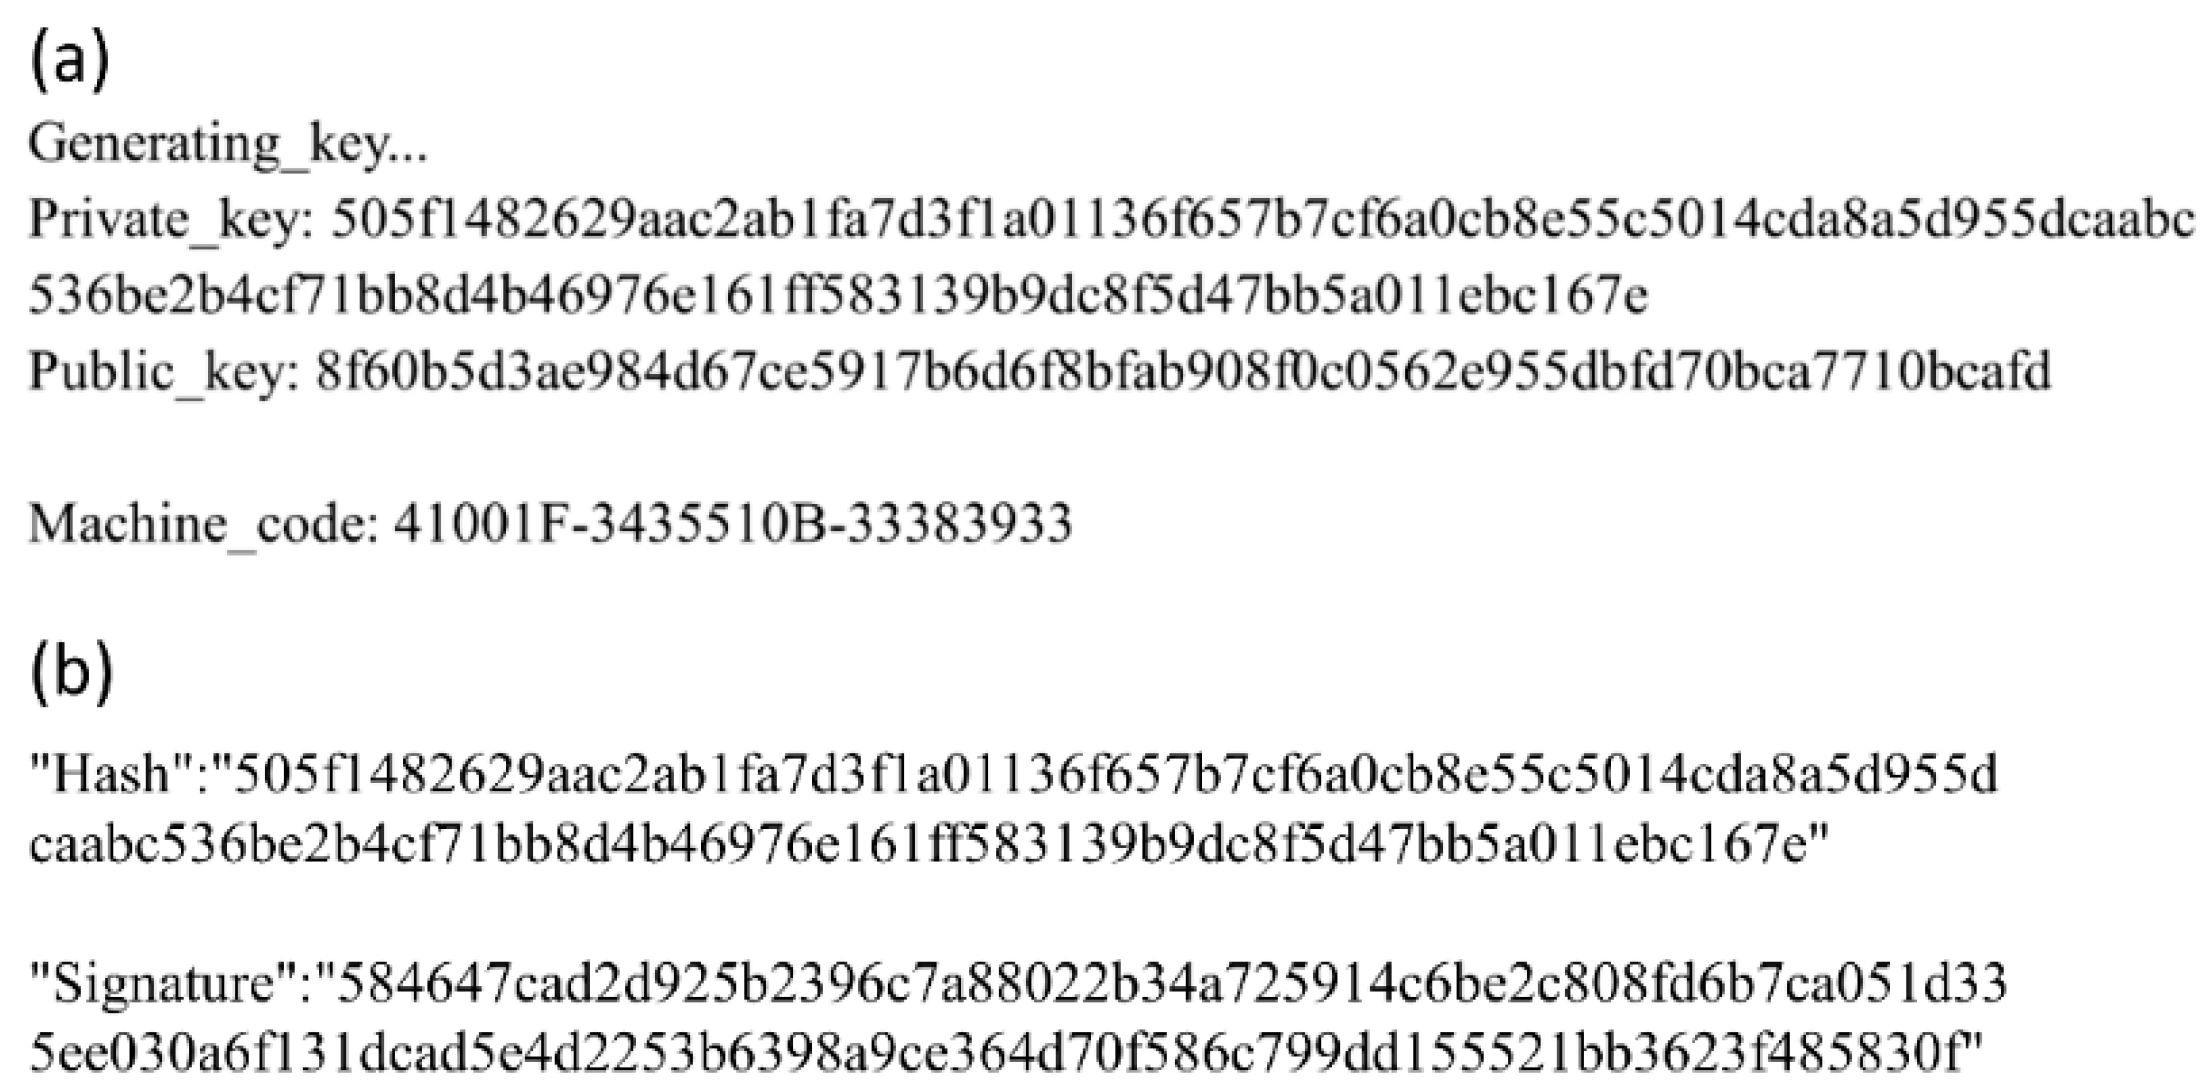
Figure 14a shows the private key and the public key generated by the PSS-1.0 and the PSS-1.0 machine code. The keys are randomly generated, and the machine code is the unique identification code of the microcontroller. They are referred to the system ID in
Section 4.2.
Figure 14b shows the hash value of the measured data and the digital signature of this hash value. The “Signature” in
Figure 14b is generated by digitally signing “Hash” by “Private_key” in
Figure 14a. If there is no the correct “Public_key,” then “Signature” is invalid. “Hash” and “Signature” each take up only 64 bytes, which saves the storage space of the blockchain to some extent.
7. Conclusions
The PSS-1.0 has a spectral response over the range 400 nm to 1100 nm. Different spectral response ranges can be supported by changing its spectroscopic and photoelectric detection modules. After downloading the appropriate spectral analysis model from the spectral analysis system, the PSS-1.0 enables rapid on-site spectral analysis, and the results can be presented to the user through the smart device. The big data management system is used to save measured data per the users’ preferences. This improves data reuse and provide resources for data analysis of spectral data. To prevent data from being tampered with, blockchain technology is used to provide each PPS-1.0 with a specific pair of private and public keys. Different spectral data record peers establish a consensus mechanism to record transaction data together. Peers can call the spectral data from each other by a transaction in the blockchain network. Combined with Internet technologies, this spectrometer provides a new way to utilize data and the credit of spectral data is increased. The design of this spectrometer and related systems can be used for the fields of production, monitoring and safety testing that require spectroscopic detection. The intelligence of spectroscopic detection facilitates automation and intelligence in production and monitoring. In a future work, we can focus on the radiometric calibration, and more accurate spectral calibration of the PSS-1.0, the optimization of spectrometer and user interaction, the analysis and processing of spectral big data, and the optimization of the blockchain system.
Author Contributions
Conceptualization, J.Y., W.H., and X.Y.; methodology, J.Y., W.H., and X.Y.; software, J.Y.; validation, J.Y. and Y.Y.; writing—original draft preparation, J.Y.; writing—review and editing, Y.Y.; supervision, Y.C.; project administration, X.Y.
Funding
This research was funded by National Natural Science Foundation of China NSFC (grant number 11274398) and Fundamental Research Funds for the Central Universities (grant number 17lgjc39).
Conflicts of Interest
The authors declare no conflict of interest.
References
- Washington, R.; Todd, M.; Middleton, N.J.; Goudie, A.S. Dust-storm source areas determined by the total ozone monitoring spectrometer and surface observations. Ann. Assoc. Am. Geogr. 2003, 93, 297–313. [Google Scholar] [CrossRef]
- Lin, L.; He, Y.; Xiao, Z.; Zhao, K.; Dong, T.; Nie, P. Rapid-Detection Sensor for Rice Grain MoistureBased on NIR Spectroscopy. Appl. Sci. 2019, 9, 1654. [Google Scholar] [CrossRef]
- Crowley, R.J. Miniature Spectrometer. U.S. Patent No. 6,119,031, 12 September 2000. [Google Scholar]
- Crowley, R.J.; Mark, H. Miniature Spectrometer System and Method. U.S. Patent No. 6,405,073, 11 June 2002. [Google Scholar]
- Nakamoto, S. Bitcoin: A Peer-to-Peer Electronic Cash System. Available online: https://static.coinpaprika.com/storage/cdn/whitepapers/215.pdf (accessed on 28 April 2019).
- Chen, H.; Chiang, R.H.; Storey, V.C. Business intelligence and analytics: From big data to big impact. MIS Q. 2012, 36, 1165–1188. [Google Scholar] [CrossRef]
- STMicroelectronics. STM32F407VE Datasheet. Available online: https://www.st.com/resource/en/datasheet/stm32f407ve.pdf (accessed on 28 April 2019).
- Shafer, A.B.; Megill, L.R.; Droppleman, L. Optimization of the Czerny–Turner spectrometer. JOSA 1964, 54, 879–887. [Google Scholar] [CrossRef]
- Chen, C.W.; Gossett, E.W. Grism (Grating-Prism Combination). U.S. Patent No. 5,652,681, 29 July 1997. [Google Scholar]
- Traub, W.A. Constant-dispersion grism spectrometer for channeled spectra. JOSA 1990, 7, 1779–1791. [Google Scholar] [CrossRef]
- James, J. Spectrograph Design Fundamentals; Cambridge University Press: Cambridge, UK, 2007. [Google Scholar]
- Fable. FSG-1A. Available online: http://www.szfable.cn/product/235.html (accessed on 28 April 2019).
- Toshiba. TCD1304DG. Available online: http://toshiba.semicon-storage.com/info/docget.jsp?did=13709&prodName=TCD1304DG (accessed on 28 April 2019).
- MacBride, D.M.; Malone, C.G.; Hebb, J.P.; Cravalho, E.G. Effect of Temperature Variation on FT-IR Spectrometer Stability. Appl. Spectrosc. 1997, 51, 43–50. [Google Scholar] [CrossRef]
- ASAIR. DHT11/CHT11. Available online: http://www.aosong.com/en/products-21.html (accessed on 28 April 2019).
- Collotta, M.; Pau, G.; Talty, T.; Tonguz, O.K. Bluetooth 5: A concrete step forward toward the IoT. IEEE Commun. Mag. 2018, 56, 125–131. [Google Scholar] [CrossRef]
- Gueron, S.; Johnson, S.; Walker, J. SHA-512/256. In Proceedings of the 2011 Eighth International Conference on Information Technology: New Generations, Las Vegas, NV, USA, 11–13 April 2011. [Google Scholar]
- Bernstein, D.J.; Lange, T. SafeCurves: Choosing Safe Curves for Elliptic-Curve Cryptography. 2013. Available online: http://safecurves.cr.yp.to (accessed on 28 April 2019).
- Bernstein, D.J.; Duif, N.; Lange, T.; Schwabe, P.; Yang, B.Y. High-speed high-security signatures. J. Cryptogr. Eng. 2012, 2, 77–89. [Google Scholar] [CrossRef]
- Rinnan, A.; Van Den Berg, F.; Engelsen, S.B. Review of the most common pre-processing techniques for near-infrared spectra. TrAC Trends Anal. Chem. 2009, 28, 1201–1222. [Google Scholar] [CrossRef]
- Chen, Y.; Lin, Z.; Zhao, X.; Wang, G.; Gu, Y. Deep learning-based classification of hyperspectral data. IEEE J. Sel. Top. Appl. Earth Obs. Remote Sens. 2014, 7, 2094–2107. [Google Scholar] [CrossRef]
- Tao, C.; Pan, H.; Li, Y.; Zou, Z. Unsupervised spectral–spatial feature learning with stacked sparse autoencoder for hyperspectral imagery classification. IEEE Geosci. Remote Sens. Lett. 2015, 12, 2438–2442. [Google Scholar]
- Makantasis, K.; Karantzalos, K.; Doulamis, A.; Doulamis, N. Deep supervised learning for hyperspectral data classification through convolutional neural networks. In Proceedings of the 2015 IEEE International Geoscience and Remote Sensing Symposium (IGARSS), Milan, Italy, 26–31 July 2015. [Google Scholar]
- Katal, A.; Wazid, M.; Goudar, R.H. Big data: Issues, challenges, tools and good practices. In Proceedings of the 2013 Sixth International Conference on Contemporary Computing (IC3), Noida, India, 8–10 August 2013. [Google Scholar]
- Borthakur, D. HDFS architecture guide. Hadoop Apache Proj. 2008, 53, 1–13. [Google Scholar]
- Mackey, G.; Sehrish, S.; Wang, J. Improving metadata management for small files in HDFS. In Proceedings of the 2009 IEEE International Conference on Cluster Computing and Workshops, New Orleans, LA, USA, 31 August–4 September 2009. [Google Scholar]
- Zheng, Z.; Xie, S.; Dai, H.; Chen, X.; Wang, H. An overview of blockchain technology: Architecture, consensus, and future trends. In Proceedings of the 2017 IEEE International Congress on Big Data (BigData Congress), Honolulu, HI, USA, 25–30 June 2017. [Google Scholar]
- Shetty, S.; Red, V.; Kamhoua, C.; Kwiat, K.; Njilla, L. Data provenance assurance in the cloud using blockchain. In Proceedings of the Disruptive Technologies in Sensors and Sensor Systems, Anaheim, CA, USA, 11–12 April 2017. [Google Scholar]
- Cachin, C. Architecture of the hyperledger blockchain fabric. In Proceedings of the Workshop on Distributed Cryptocurrencies and Consensus Ledgers, Chicago, IL, USA, 25 July 2016. [Google Scholar]
- Androulaki, E.; Barger, A.; Bortnikov, V.; Cachin, C.; Christidis, K.; De Caro, A.; Enyeart, D.; Ferris, C.; Murthy, C.; Muralidharan, S.; et al. Hyperledger fabric: A distributed operating system for permissioned blockchains. In Proceedings of the Thirteenth EuroSys Conference, Porto, Portugal, 23–26 April 2018. [Google Scholar]
- Ocean Optics. HR2000+ Spectrometer. Available online: http://www.oceanoptics.cn/download/1791 (accessed on 28 April 2019).
© 2019 by the authors. Licensee MDPI, Basel, Switzerland. This article is an open access article distributed under the terms and conditions of the Creative Commons Attribution (CC BY) license (http://creativecommons.org/licenses/by/4.0/).


