Article

An Intelligent Event-Sentiment-Based Daily Foreign Exchange Rate Forecasting System

1
Department of Management Sciences, COMSATS University Islamabad, Attock Campus, Attock 43600, Pakistan
2
Department of Computer Science, COMSATS University Islamabad, Attock Campus, Attock 43600, Pakistan
3
Department of Media Design and Technology, Faculty of Engineering & Informatics, University of Bradford, Bradford BD7 1DP, UK
4
Department of Software, Sejong University, Seoul 05006, Korea
*
Authors to whom correspondence should be addressed.
Appl. Sci. 2019, 9(15), 2980; https://doi.org/10.3390/app9152980
Submission received: 17 June 2019 / Revised: 18 July 2019 / Accepted: 20 July 2019 / Published: 25 July 2019
(This article belongs to the Special Issue Actionable Pattern-Driven Analytics and Prediction)

Abstract

:
Financial time series analysis is an important research area that can predict various economic indicators such as the foreign currency exchange rate. In this paper, a deep-learning-based model is proposed to forecast the foreign exchange rate. Since the currency market is volatile and susceptible to ongoing social and political events, the proposed model incorporates event sentiments to accurately predict the exchange rate. Moreover, as the currency market is heavily dependent upon highly volatile factors such as gold and crude oil prices, we considered these sensitive factors for exchange rate forecasting. The validity of the model is tested over three currency exchange rates, which are Pak Rupee to US dollar (PKR/USD), British pound sterling to US dollar (GBP/USD), and Hong Kong Dollar to US dollar (HKD/USD). The study also shows the importance of incorporating investor sentiment of local and foreign macro-level events for accurate forecasting of the exchange rate. We processed approximately 5.9 million tweets to extract major events’ sentiment. The results show that this deep-learning-based model is a better predictor of foreign currency exchange rate in comparison with statistical techniques normally employed for prediction. The results present evidence that the exchange rate of all the three countries is more exposed to events happening in the US.

1. Introduction

The foreign exchange rate remains one of the important economic indicators for any country. Any investment decision by multinational corporations or governments is based on the exchange rates. Therefore, foreign exchange prediction is an important factor for investors and businesses. However, foreign exchange forecasting is a very difficult task due to the nonlinear and volatile nature of this problem. This notion is largely supported due to the research work published in [1,2]. In fact, the papers [1,2] advocate that the forecast can only be predicted through the simple random walk.
Technically the currency exchange rate data are time series data, which are affected by various socioeconomic and political factors. This makes it very difficult to predict the exchange rate. At the same time, accurate currency forecasting has important economic benefits and, thus, it is the focus of active economic research for many decades [3]. Normally, financial analysis is categorized into fundamental and technical analysis, where the former deals with macroeconomic issues and the later with historical data for prediction. Stock prices can be overestimated or underestimated when models that consider optimistic and pessimistic fundamentals are used because stock markets are ambiguous [4]. The result of technical analysis is well-known statistical models such as autoregressive moving average and generalized auto regressive conditional heteroscedasticity (GARCH) [5,6]. However, both these methods do not deal with the nonlinearity of time series data.
In recent times, different advanced computing methods yield better results for time series forecasting [7]. The success of artificial neural networks (ANNs) is largely due to the discovery of a nonlinear relationship without prior knowledge of the information and self-training and self-prediction ability. ANN is a mathematical technique intended for use in solving optimization problems. ANN is a technique that works well with few assumptions and can tolerate noisy and nonlinear data [8], making it an ideal candidate for financial time series data. ANN mimics the behavior of the human brain, which utilizes previous knowledge for solving unseen problems. ANN is basically a network of nodes arranged in different layers interconnected with some links with associated weights. The network is trained by feeding some training data. This training helps in deciding about a decision function, which is chosen from a group of functions represented by the structure of the ANN. This decision function can be determined by assigning proper weights to the network. If the weights are chosen optimally, the error is minimized [9]. A common technique for minimizing the error is known as backpropagation Neural Network (NN), in which the error is fed backward to adjust the weights resulting in minimizing the error [10]. High accuracy can be achieved using good features and a suitable network pattern, i.e., forward or backward pattern. Various types of ANNs are employed for financial forecasting as well as currency rate prediction. These include functional link ANN [11], quantile regression ANN [12], backpropagation ANN [13], and radial basis function ANN [10] to name a few.
Recently, deep learning has seen immense growth in the field of pattern recognition and time series analysis. This study focuses on designing a deep-learning-based model to forecast the exchange rates. The main objective is to design an intelligent model by considering important factors such as crude oil rate and gold price index. In this study, we intend to check the importance of these factors for foreign exchange rates of any country. This study also focuses on checking the impact of important global and local events on the foreign exchange rate of a country. For this purpose, some important local and global events are considered for each country and sentiment analysis is performed. The sentiment values are then used to train the deep learning model along with gold price index and crude oil prices. The paper has the following contributions:
  • Since time series models such as Auto regressive conditional heteroscedasticity (ARCH) and GARCH do not yield significant prediction results, we use a deep learning approach that also deals with nonlinear patterns of time series datasets.
  • The exchange rate is considered as a highly volatile variable and can be affected by any information floated in the market such as social media sentiments based on events at the macro level, therefore, we also consider investor sentiment while making exchange rate predictions which is a significant contribution to the existing body of knowledge.
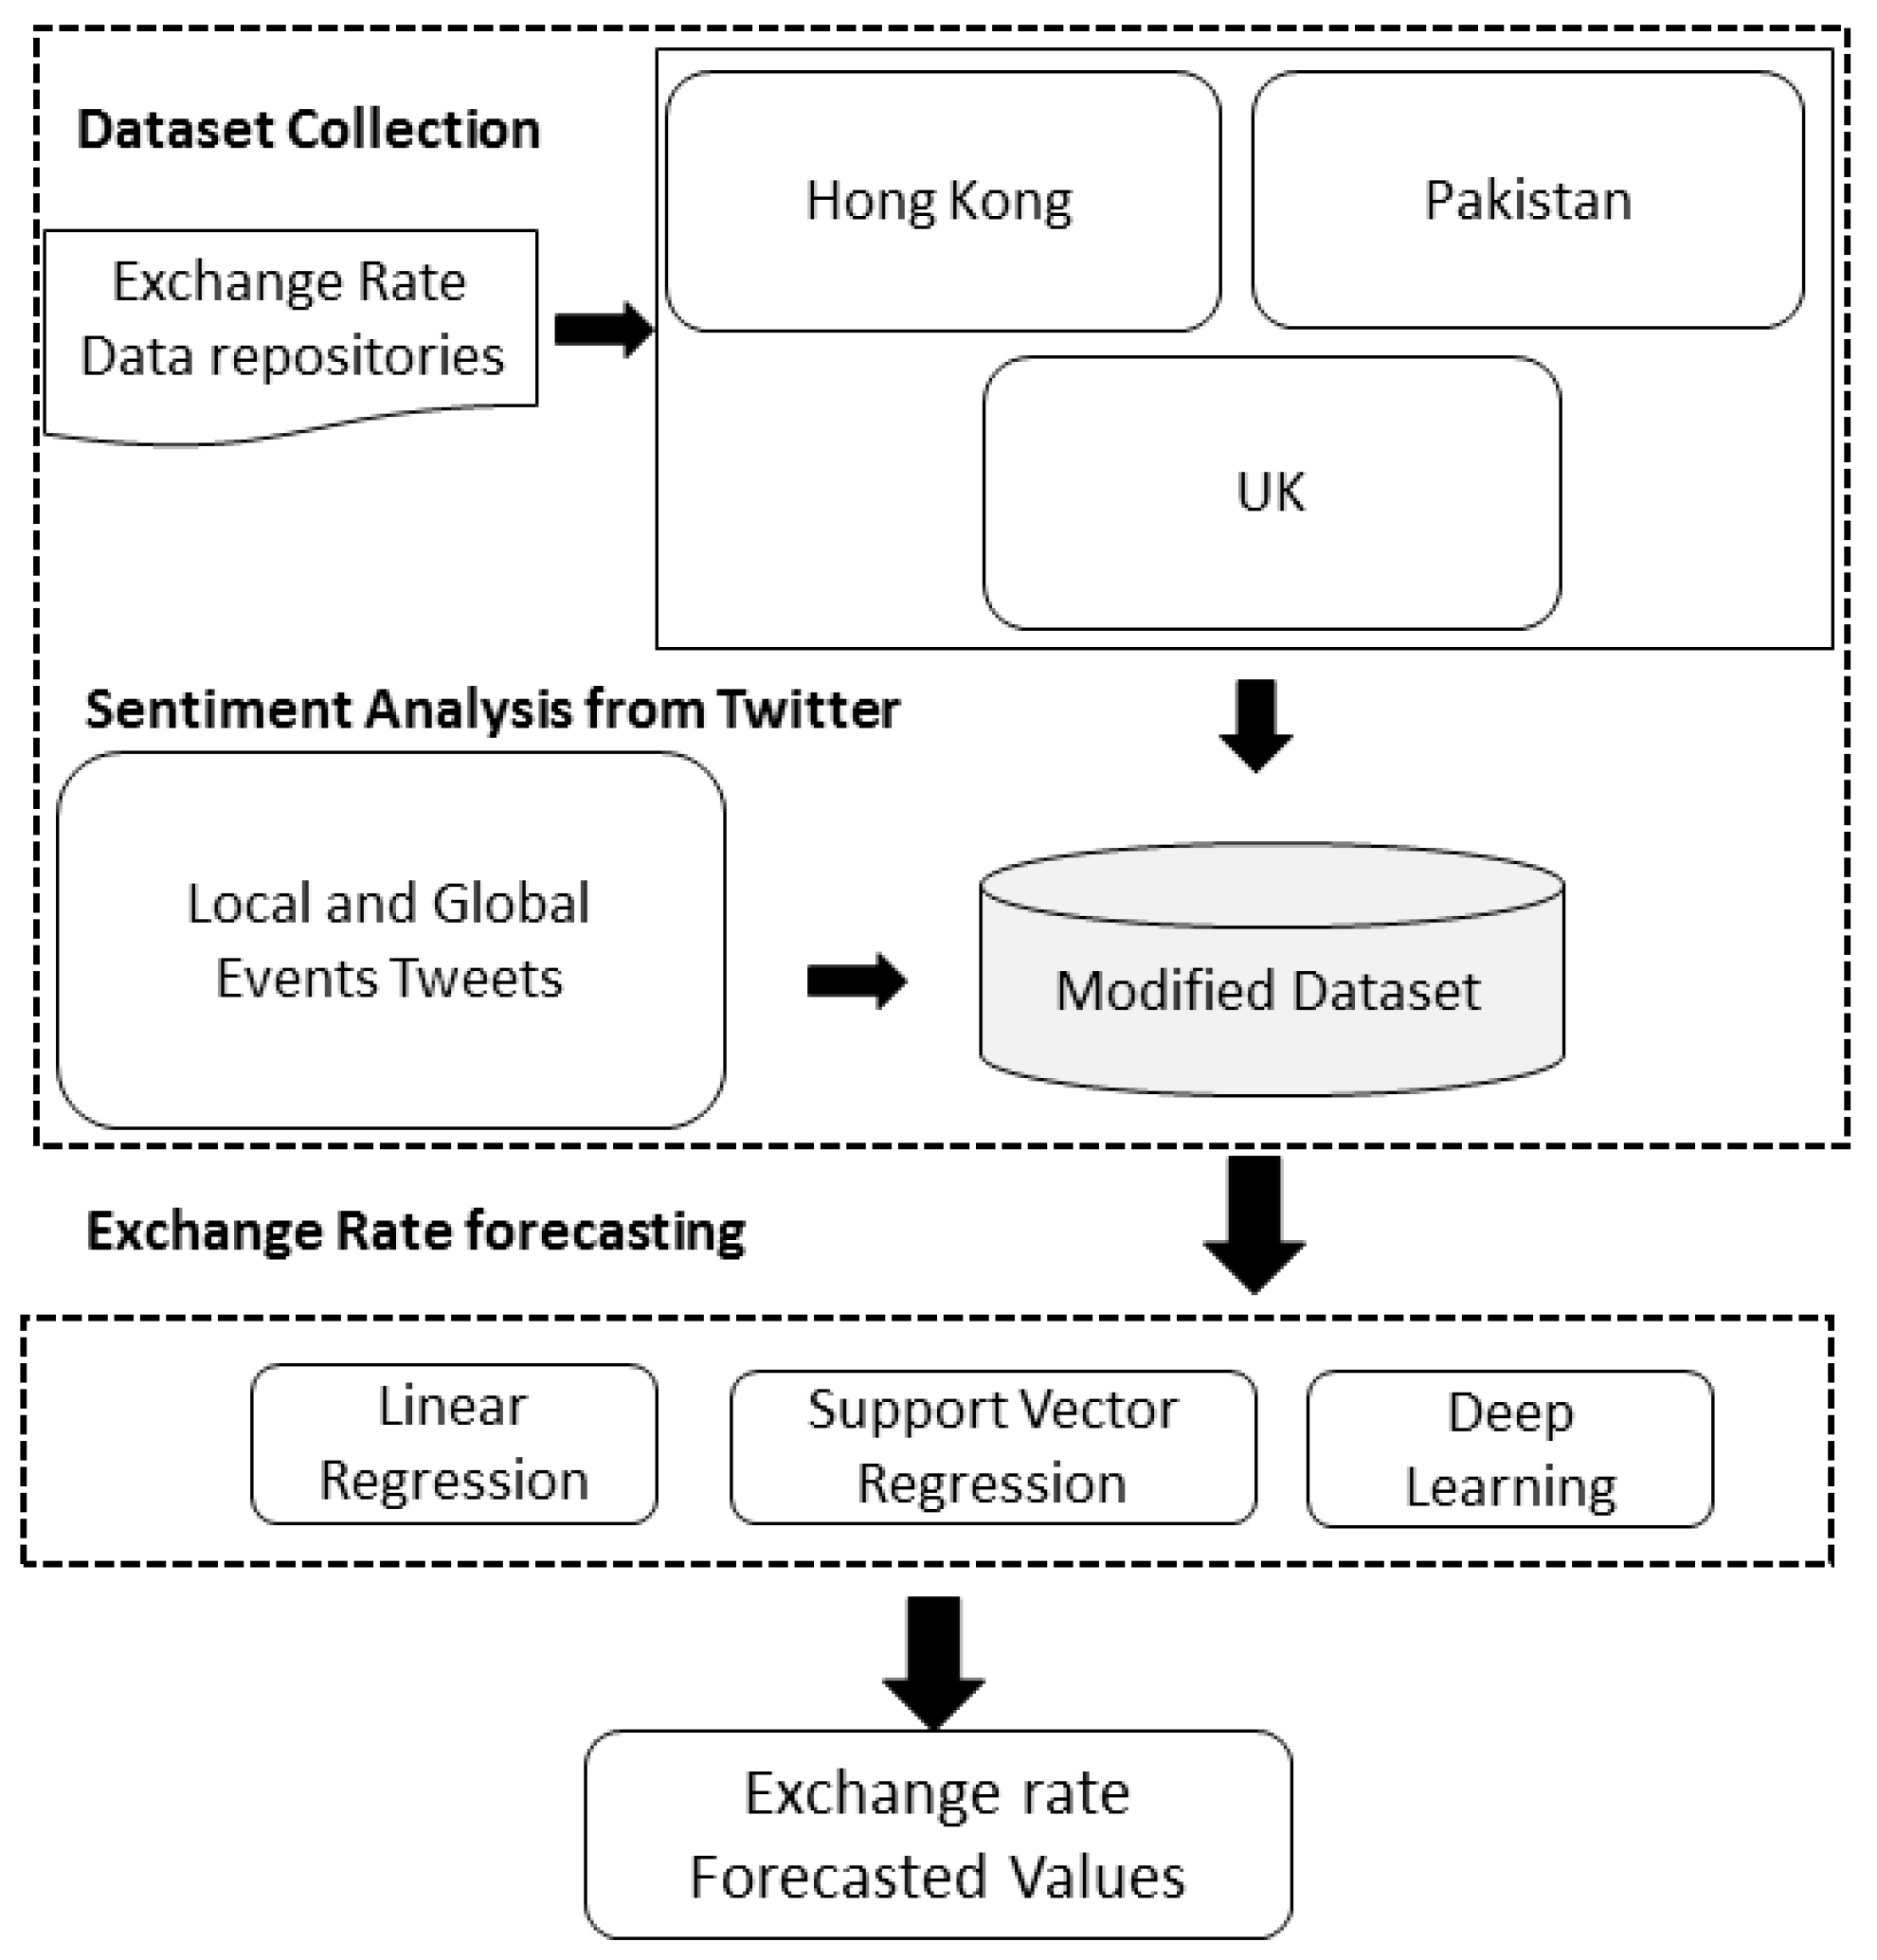
  • We consider three different economies namely, Hong Kong (emerging), Pakistan (developing), and UK (developed) that belong to different regions which exhibit specific characteristics. Such a dataset has remained unexplored in the existing literature.
The rest of the paper is organized as follows: Section 2 explains the related work, Section 3 presents the methodology, and Section 4 explains the results followed by the conclusion.

2. Related Work

The exchange rate predicting techniques can be categorized in three different classes that is time series models, econometric approach, and the last one is machine-learning methods which include artificial neural network (ANN) and deep-learning-based methods.

2.1. Econometric Approach

These models are based on the underlying economic conditions to predict the exchange rate. In comparison with technical analysis, this econometric model ignores the financier’s psychosomatic biases and also assumes that economic fundamentals determine prolonged trends. This econometric model can be further categorized into two different categories. Under the first category of the econometric model, the Mundell–Fleming Model [14], Dornbusch [15] proposed an asset market technique for the exchange rate. The second category of the econometric model emphasizes the effect of the current rate of exchange on the probable future path of the currency supplies and of influences that affect money demands [16]. These econometric models are extensively utilized by numerous central bankers all over the world. Though, empirical research specifies that their effectiveness is still dubious when forecasting the short-term exchange rate [17]. The research by Meese and Rogoff [2] is still a standard in contradiction of all econometric rate-of-exchange predicting frameworks. Meese and Rogoff demonstrated that structural frameworks fail to outperform the random walk in out-of-sample forecast. For the short-term exchange rate prediction, they concluded that the inefficiency of econometric models is still extensively acknowledged.

2.2. Time Series Models

The ARIMA model, i.e., autoregressive integrated moving average, and ETS, i.e., exponential smoothing, are commonly utilized to forecast the exchange rate. The ARIMA models are generally used in the context of the encompassing autoregressive model and moving average model as special cases. By differencing transformation, if needed, ARIMA can deal with non-stationary data. The other time series ETS models can handle trends and seasonality due to their non-stationary nature.
Although the time series models cannot be exactly utilized for classification, researchers utilized ARIMA and ETS as baseline models just for demonstration because these models give acceptable point approximations for the forex rate. Bo et al. [18] proposed a time series model that gives very good results.

2.3. Artificial Neural Network

ANN was not widely used for currency exchange forecasting mainly because the subject was related to economics and majority of economists are not well versed with the working of ANNs. Another reason is the popularity of statistical models for currency exchange forecast. However, over the years, ANN has shown its strength in solving nonlinear problems. The strength of ANN lies in its ability to learn from the data. It does not suffer from noisy and inconsistent data and, thus, is an excellent tool to be used for nonlinear problems. An important feature of ANNs is that they are numeric in nature [19], which makes them an ideal candidate to be used for currency exchange forecast and other financial related matters where we are dealing with numbers. Moreover, ANN accepts input data in the numeric form directly for data mining.
One example of the use of ANN for economic matters is the intelligent trading tool described in [20], which shows that with a more complex ANN the resulting system becomes more specialized, which results in increased profits on the training sets. However, in the real-world scenario the less specialized and less complex ones, i.e., the generalized ones, provided better results and more profit. Another example of the use of ANN for economic issues is discussed in [21]. The study in [21] compares the performance of an ANN with other time-series-based techniques. A quadratic neural network (QNN) created for the prediction of financial time series data from the Gabor–Kolmogorov polynomial function is described in [22]. The QNN evaluates the data collected on a day-to-day basis of a certain stock and it calculates a hypothetical price series of the stock.
The use of ANN for financial forecasting is advocated in [23,24], where ANN is applied to an economic time series. A similar kind of study was carried out for the stock market in [25], and in [26] the ANN is applied to predict currency exchange. Another study was carried out in [27] to determine the Brazilian currency exchange rate with the US dollar and it showed the strength of ANN over other linear models. A similar kind of study was carried out to predict the exchange rate of the Turkish lira with the euro and the US dollar [28], which showed high accuracy in comparison to other models. Another study in [29] predicted the euro to US dollar exchange rate by using a multilevel perceptron (MLP), a specialized ANN, applied to one-day-ahead forecasting of the currency exchange rate collected from European Central Bank (ECB) time series data. The study showed that MLP outperformed other techniques for the said problem. A similar kind of study was carried out in [30], which predicted the exchange rate of the Indian rupee to the US dollar. It created a knowledge guided neural network with integrated features of least mean square as an input. A study of prediction of the Australian dollar against the currency of six other currencies was carried out in [31]. Historical data from over 500 weeks were fed to the ANN and a prediction accuracy of about 87% was recorded. A general regression NN is proposed in [32], which predicts the currency exchange rate on a month-by-month basis.
Dunis [33] utilized an ANN and compared it with three different models including an autoregressive model, moving average technical frameworks, and at the end a logistic regressive model. The artificial neural network outperformed all the standard models. Thinyane and Millin [20] discovered that the greater the performance on the training dataset, the more complex the ANN. Although these models lead to unsatisfactorily high generality errors and are predisposed to overfitting on out-of-sample forecasts. To resolve the outdated artificial neural network model’s limitation, Nag and Mitra [34] proposed an alternative method utilizing artificial neural network and genetic algorithms for constructing predicting models for the rate of exchange. They concluded that in comparison with traditional and statistical time series models, ANN gave considerably better results. Galeshchuk [7] showed that the practical use of the single hidden layer of MLP can give high-enough accuracy for the point estimates for the exchange rates, with 60% accuracy attained for the direction of alteration by applying these predictions. For making cost-effective trading schemes, this renders the technique less valuable as a bias. Therefore, this inspires us to examine the proficiency of the deep learning networks to predict the direction of alteration in the forex rate.

2.4. Deep Neural Network

Deep learning approaches stimulate the researchers over the last decade, this method, initially presented by Hinton [35,36], has exposed a robust and efficient machine-learning (ML) approach in multiple domains, including facial recognition [37,38], speech recognition [39], and NLP, i.e., natural language processing [40]. Deep learning networks are also effective for forecasting-related issues for sequential data [41,42]. In the current research, these deep learning networks have been utilized for financial prediction [43,44,45] and attained 63%–73% accuracy in forecasting the direction of alteration in trade. For forecasting-related issues, restricted Boltzmann machines and different autoencoders have been effectively utilized for the unsupervised removal of abstract input features [46,47]. In financial forecasting, the method was also shown to be very effective [43]. The techniques for pretraining deep neural networks with the SAE and stacked Boltzmann are briefly described in [43,48,49,50,51]. Current improvements in CNN i.e., convolutional neural network, make it more appealing for classification and forecasting-related issues [52] centered on time series data. CNNs are great for financial forecasting because of two main causes: Firstly, noise filters and dimensionality reduction approaches help to select crafted input features. Secondly, the local association amongst successive observations can be suppressed to lessen the number of parameters to be considered in the network by linking just a small number of end-to-end inputs to each hidden layer’s unit. The units in the convolutional neural network get input from the small adjoining subsections of space in the input, known as the respective field, that covers the whole input feature’s set. This lets units act as local kernels and exploit correlation amongst adjoining inputs.

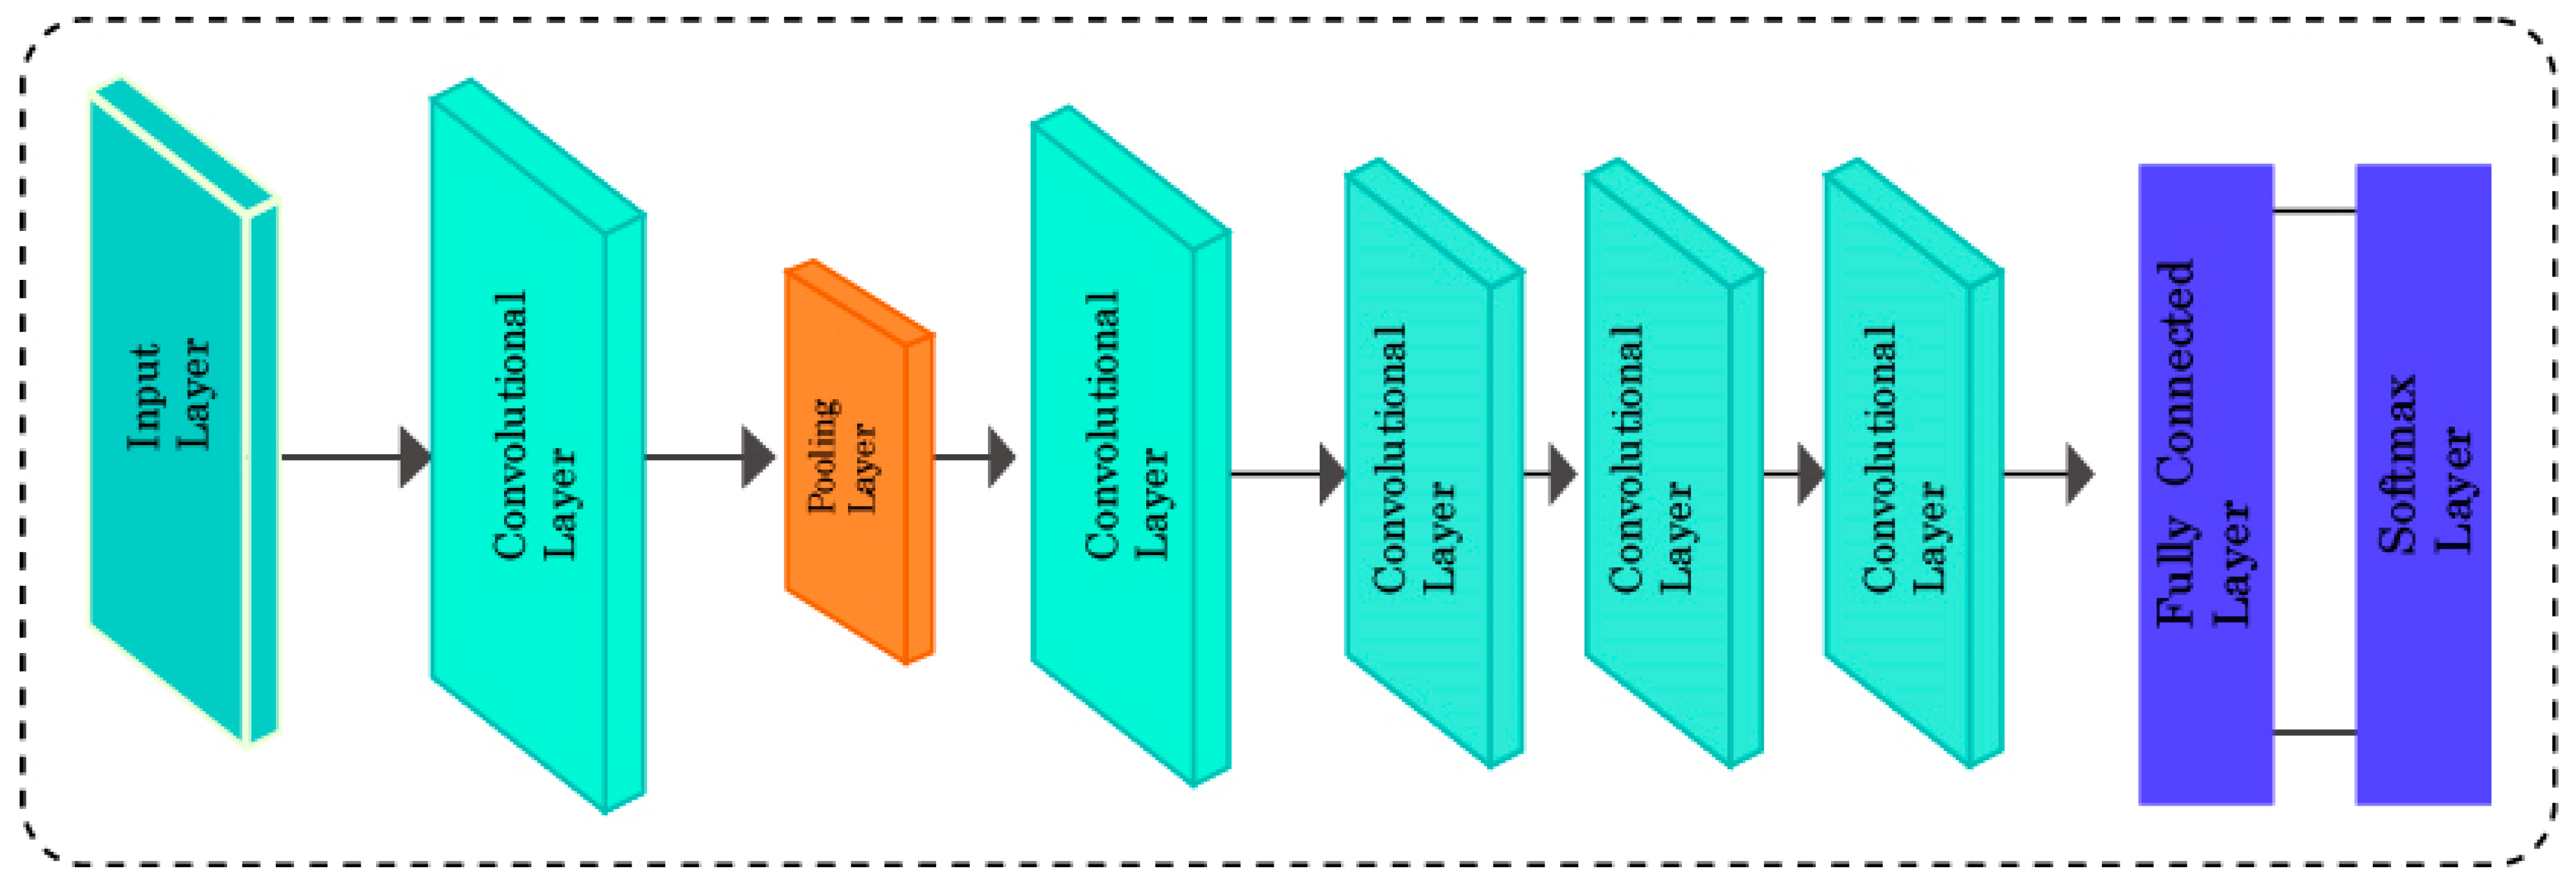
3. Proposed Methodology

The proposed methodology is explained in Figure 1.
The proposed system is based on a deep learning model that incorporates the sentiment of major local and global events. The sentiment analysis is carried out by calculating the percentage of positive and negative tweets rather than only considering the overall impact. This way, neutral tweets are neglected, and the sentiment is presented in a much better way. The details of deep learning architecture are presented below.

3.1. Input Layer/First Layer

This layer has the initial dataset, for this study, to predict stock data without the sentiment analysis, our input parameters were crude oil price, gold price index, and foreign exchange rate. Whereas when we study this stock prediction with respect to sentiment analysis, our input layer’s parameters were augmented by one, i.e., sentiment value.

3.2. Convolutional Layers

In the framework of CNN, the core building layers are the convolutional layers, for extreme computational work is done by these convolutional layers. These layers execute all the convolutional operations on data from the input layer and forward that response to the next layers in the architecture. The convolutional layer’s parameters have learnable kernels also known as ‘filters’, having a slight respective area, but spread over the input data. In the forward pass of layers, every kernel convolved through the input and producing a 1D activation map of that kernel.

3.3. Pooling Layers

In between the convo layers, there are pooling layers. To reduce the computational cost for the next convo layers these layers were utilized. They operate independent of the depth of the output of the convo layers, which is the input for this pooling layer. We utilized a pooling layer with a filter size of two. This pooling layer reduced the computational cost of the input.

3.4. Rectified Linear Unit Layer

This layer is vital in CNN architecture, based on the non-saturation ‘activation function’. Without affecting the fields of the convo layers, it increases the decision function’s nonlinear properties by removing the negative values from the activation map and converting them to zero.

3.5. Fully Connected Layers

Lastly, the high-level reasoning in CNN was done via fully connected layers after numerous convolutional and the pooling layers. The neurons of these layers have connections to all the activation in the previous layers. In our CNN model, we had five convolutional layers having almost the same kernel size, the first convolutional layer had 96 kernels with size 1. The convolutional output was received through a pooling layer of size 2 where it was normalized and sent into the second convolutional layer as i/p and filtered with same kernel size. Similarly, the convolutional output from the second layer was reduced through the pooling layer of size 2 × 1 and connected to the kernel size 1 in the third convolutional layer. The third and fourth convolutional layers comprised 384 kernels whereas the fifth convolutional layer had 256 kernels. A total of 4096 neurons were present in fully connected layers.

3.6. Network Training and Testing

The network contained convolutional layers, fully connected layers, and a softmax layer. We passed 70% of the data to the network with some training options for training the network. These training options mainly contained batch-size, validation frequency, and learning rate. The algorithm appraised the weights and bias parameters by minimizing the loss function. To assess the training procedure’s performance, we passed the remaining 30% of the data as testing data to this trained network. Figure 2 shows the proposed convolutional neural network architecture.

4. Results and Discussion

4.1. Dataset

We used the daily data of exchange rate ranging from early 2008 to late 2018. We also considered crude oil prices and gold price index as explanatory factors in the model for prediction. Daily data of exogenous factors was used for all the countries. We used the same data series of explanatory variables for all the datasets. The variables/features in the dataset were crude oil price, gold price index, and foreign exchange rate. We also added sentiment analysis values along with the aforementioned features. The events were divided into global and local events for each country. The data were collected for each event on a different number of days. The sentiment was collected for each event for each date and the values were added with the dataset against the same date. Table 1 shows the detailed description of the datasets used in our study. The twitter dataset was used to calculate the sentiment of the events [53]. The details of the events are given in Table 2.

4.2. Evaluation Metrics

There have been a lot of evaluation metrics used for foreign exchange prediction but mean absolute error (MAE) and root mean squared error (RMSE) are the most common metrics [54,55,56,57,58]. These metrics can be evaluated as explained below.

4.2.1. Root Mean Squared Error—RMSE

This performance evaluation metric shows the average magnitude of estimation error in predicted values. It can be calculated using the following equation:
R M S E =   t = 1 n ( f o r e c a s t ( t ) a c t u a l ( t ) ) 2 n   .  

4.2.2. Mean Absolute Error—MAE

This error shows the average estimated error without considering the directions of the predicted values. Each of the calculated differences has equal weight and it can be calculated as
M A E =   t = 1 n | f o r e c a s t ( t ) a c t u a l ( t ) | n   .  
In the equations above, n represents the number of estimated values, forecast(t) and actual(t) represent the estimated value and the actual value with reference to time t, respectively.

4.3. Descriptive Statistic

Table 3 shows the descriptive statistics of all the datasets. The mean value of the exchange rate was 7.769, 98.257, and 1.536 for Hong Kong, Pakistan, and the UK, respectively. Similarly, their standard deviation was 0.0261, 14.740, and 0.170. Since the Jarque Bera (JB) test statistic is significant, the distribution of all the variables is non-normal.

Unit Root Test

We tested the problem of stationarity by using the ADF unit root test. The augmented Dickey–Fuller test uses the following hypothesis.
Hypothesis 1.
Unit root exists.
Hypothesis 2.
No unit root exists.
Table 4 shows the results of the ADF unit root test. We found all the data series to be stationary at first difference except gold price index, which was stationary at level.

4.4. Results without Event Sentiments

Here, the results without a sentiment for exchange rate prediction are presented using linear regression, support vector regression, and deep learning model. We considered the exchange rate of the UK, Hong Kong, and Pakistan in terms of US Dollars. Since the exchange rate is highly exposed to global volatile indicators such as crude oil prices and world gold price index, we used crude oil prices and world gold price index as explanatory variables in our models.
Table 5 shows the results of exchange prediction for Hong Kong (HK), Pakistan, and the UK using linear regression, support vector regression, and deep learning approach. The forecasting parameters MAE (absolute error) and RMSE (root mean square error) for HK were 0.018 and 0.025 in the case of linear regression. Contrary to that, MAE and RMSE were minimum when a deep learning approach was considered for HK—MAE was 0.017 and RMSE was 0.024. The results of Pakistan and UK were more accurate in the case of support vector regression and deep learning models. Therefore, these models were more reliable for exchange rate prediction as compared to the linear regression model.
Figure 3 shows the graphical overview of the foreign exchange rate of Hong Kong, Pakistan, and the UK. The plot considers 50 forecasted and actual values of the foreign exchange rate of Hong Kong, Pakistan, and the UK from top to bottom. All the predicted series were calculated using linear regression, support vector regression, and deep learning models. The spread shows that, in the case of Pakistan and Hong Kong, the results of support vector regression and deep learning model are close to the actual line of the exchange rate series.

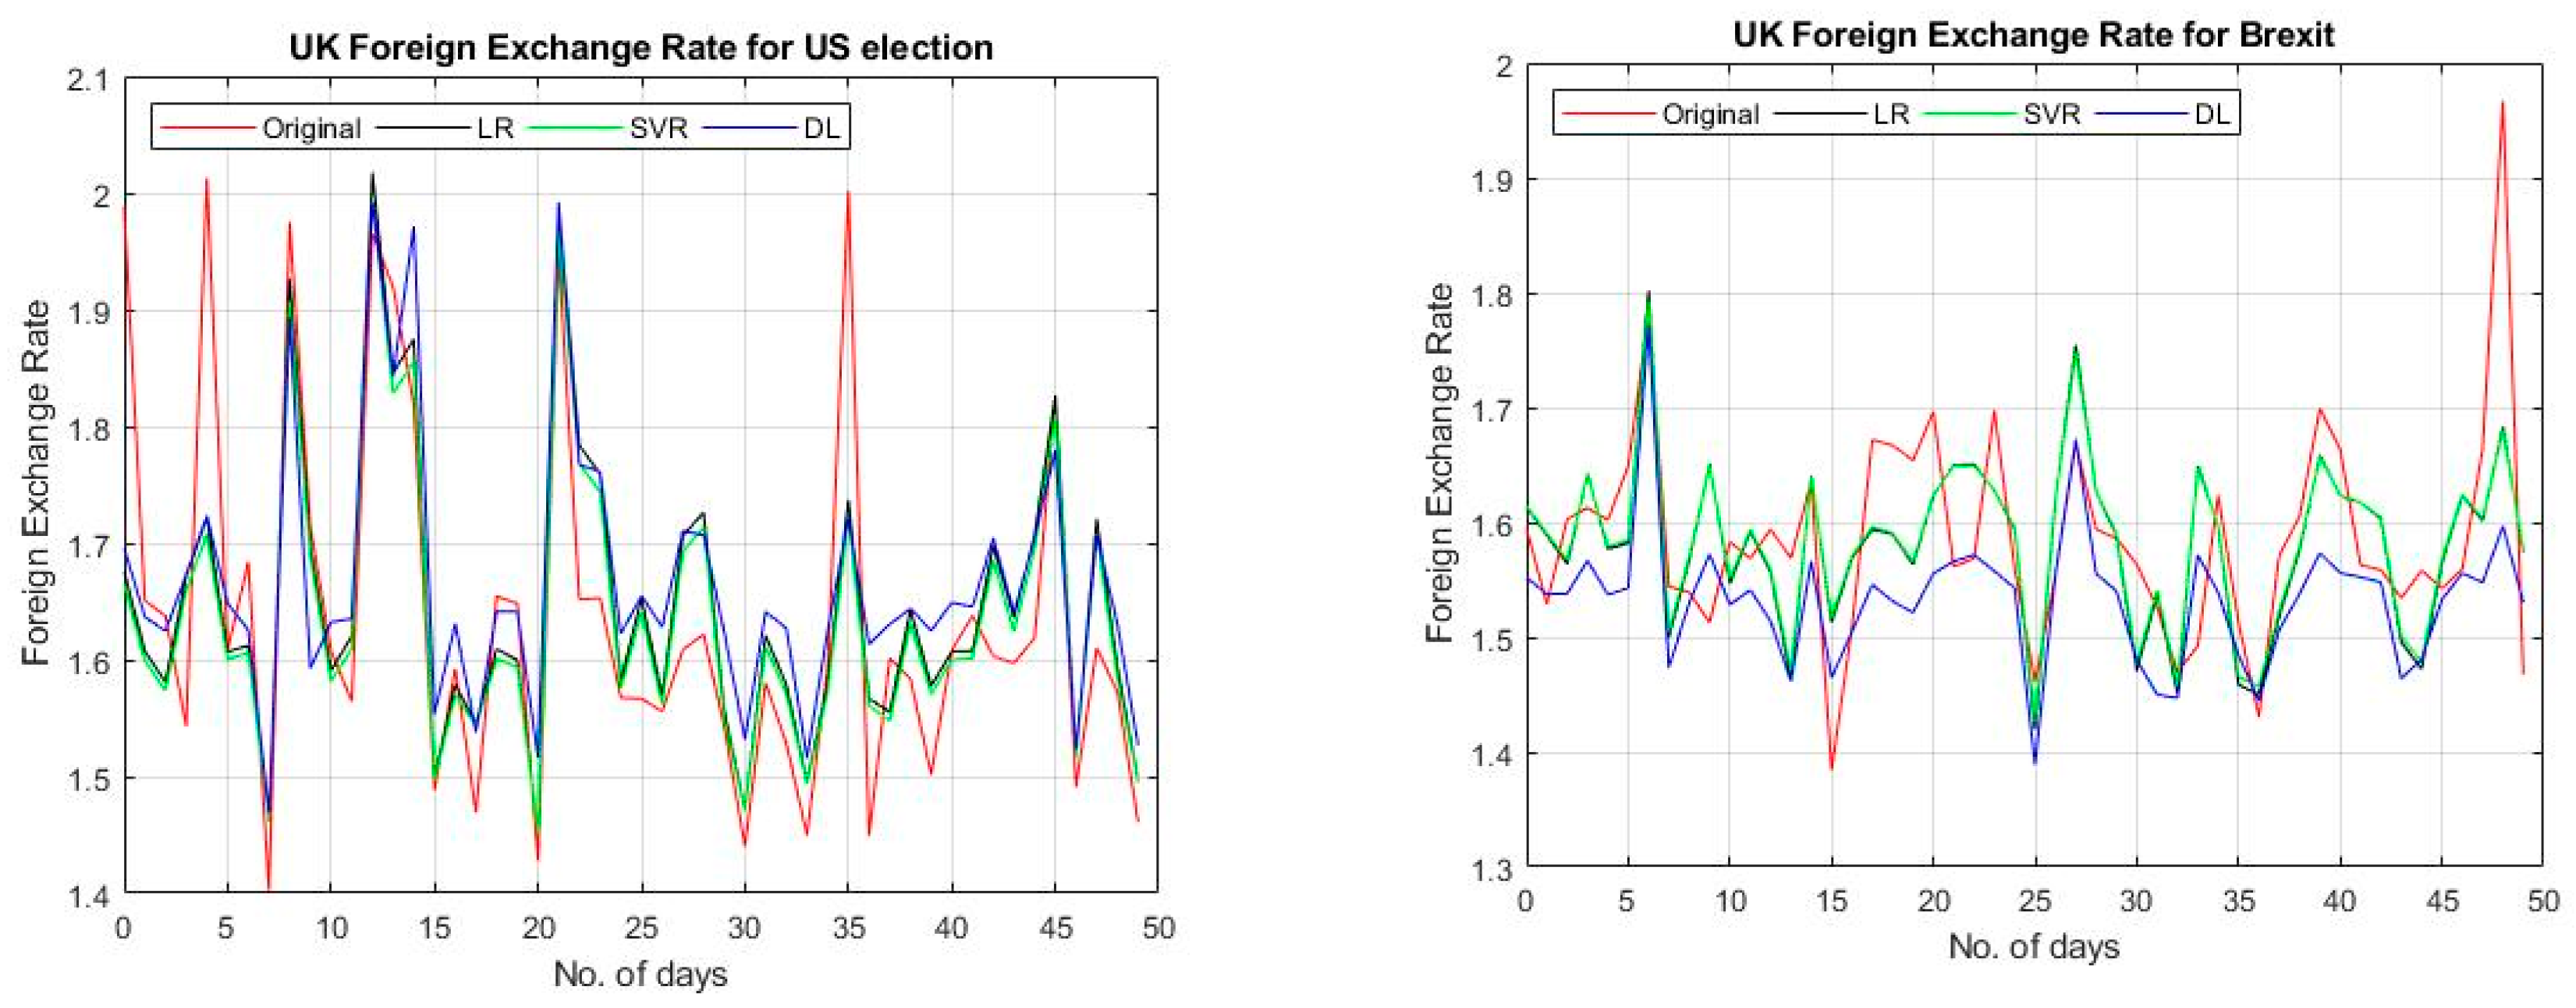
4.5. Results with Event Sentiments

In this section, we discuss the results of exchange rate prediction using linear regression, support vector regression, and deep learning model in the presence of sentiments. We used social media tweets against mega-events in order to calculate the sentiment.
Table 6 presents the results of exchange prediction in the presence of sentiments of mega-events that are related to Hong Kong. We considered the 2014 Hong Kong protest as a local event to predict the Hong Kong exchange rate. The 2012 US election was used as a global event to incorporate sentiment for exchange rate prediction. Results of all the three models show that MAE and RMSE were lower when sentiment was incorporated in the model. Since MAE and RMSE were lower compared to the results calculated without sentiment, as a whole, the accuracy of exchange rate prediction improved because of sentiment. However, the impact of the 2014 Hong Kong protest was higher than that of the 2012 US election. Therefore, it is evident that the exchange rate of Hong Kong is more exposed to the local event. When a comparison is made within the models then support vector regression is more accurate in the case of MAE for both the events. Furthermore, the deep learning model gives more reliable results of RMSE in the case of Hong Kong protest sentiment.
Figure 4 shows the graphical overview of the foreign exchange rate of Hong Kong by incorporating the sentiments of the Hong Kong protest and the US election. The plot considers 50 forecasted and actual values of the foreign exchange rate of Hong Kong with the sentiment of the Hong Kong protest and US election from top to bottom. All the predicted series were calculated using linear regression, support vector regression, and deep learning model. Since the plotted values of deep-learning-forecasted points are close to the actual in both the graphs of Hong Kong protest and US election, in the case of Hong Kong, the results of the deep learning model are more accurate as compared to those of linear regression.
Table 7 presents the results of exchange prediction in the presence of sentiments of mega-events that are related to Pakistan. We considered the 2016 Lahore blast as a local event to predict the Pakistan exchange rate. The 2012 US election was used as a global event to incorporate sentiment for exchange rate prediction. Results of all the three models show that MAE and RMSE were lower when sentiments of mega-events were incorporated in the model. Since MAE and RMSE were lower compared to the results calculated without sentiment, as a whole, the accuracy of exchange rate prediction improved because of sentiment. The results indicate that the deep learning model is more accurate as compared to linear regression and support vector regression when the sentiment of the 2012 US election is considered in the model. The MAE was 3.250, 3.127, and 2.613 for linear, support vector regression, and deep learning model, respectively. Similarly, the RMSE was 4.223, 4.590, and 3.534 for linear, support vector regression, and deep learning model, respectively. The impact of the 2016 Lahore blast was less significant than that of the 2012 US election. Therefore, it is evident that the exchange rate of Pakistan is more exposed to global events.
Figure 5 shows the graphical overview of the foreign exchange rate of Pakistan by incorporating the sentiments of the US election and the Lahore blast. The plot considers 50 forecasted and actual values of the foreign exchange rate of Pakistan with the sentiment of US election and Lahore blast from top to bottom. All the predicted series were calculated using linear regression, support vector regression, and deep learning model. Since the plotted values of deep learning forecasted points are close to the actual when the sentiment of US election was considered, it is evident that the exchange rate of Pakistan is more exposed to the events occurring in the US. However, in the case of the Lahore blast sentiment, support vector regression shows a better forecast pattern.
Table 8 presents the results of exchange prediction in the presence of sentiments of mega-events that are related to the UK. We considered Brexit 2016 as a local event to predict the UK exchange rate. The 2012 US election was used as a global event to incorporate sentiment for exchange rate prediction. Results of all the three models show that MAE and RMSE were lower when sentiments of mega-events were incorporated in the model. Since MAE and RMSE were lower compared to the results calculated without sentiment, as a whole, the accuracy of exchange rate prediction improved because of sentiment.
Figure 6 shows the graphical overview of the foreign exchange rate of the UK by incorporating the sentiments of the US election and Brexit. The plot considers 50 forecasted and actual values of the foreign exchange rate of the UK with the sentiment of the US election and Brexit from top to bottom. All the predicted series are calculated using linear regression, support vector regression, and deep learning model. Since the plotted values of support vector regression and deep learning forecasted points are close to the actual, in the case of the UK, the results of support vector and deep learning model are more accurate as compared to those of linear regression. However, the US election sentiment shows more significant improvement in forecasted plots as compared to Brexit.

5. Conclusions

Foreign currency exchange rate is an economic indicator that indirectly impacts even those businesses which are not directly involved with imports/exports of goods. Hence accurate prediction of the exchange rate is an issue related to a small business as well as the government of a country. The study is based on a dataset providing information about the exchange rate of currencies from April 2008 to January 2019. The paper proposes a deep-learning-based technique for the prediction of foreign currency exchange rate. We have calculated the sentiment of some major local and global events for Hong Kong, UK, and Pakistan. The sentiment analysis values are used as an input along with other parameters. The results show that the currency market is heavily dependent on sociopolitical issues and higher accuracy can only be achieved if these events, known sentiments in this study, are taken into consideration while predicting the exchange rate. The results obtained through the proposed methodology are compared with linear and support regression models, both well-known statistical techniques for the said problem. The results show that deep learning-based methods perform better than other methods. It has also been observed that the proposed model performed better with sentiment analysis. Moreover, events happening in the US have a significant impact on the currency exchange rate of Hong Kong, Pakistan, and the UK when social media sentiment is incorporated. The results of the prediction improved when sentiment was considered in the model, therefore these countries are said to be more exposed to mega-events happening across borders.

Author Contributions

Conceptualization, M.Y. and M.M.; formal analysis, M.Y., S.A., and M.M.; investigation, S.A. and I.M.; methodology, M.M.; project administration, S.R.; visualization, F.A.; writing—original draft, M.Y.D. and M.M.; writing—review and editing, I.M. and S.R.

Funding

This research was supported by the Basic Science Research Program through the National Research Foundation of Korea (NRF) funded by the Ministry of Education (NRF-2016R1D1A1A09919551).

Conflicts of Interest

The authors declare no conflict of interest.

References

  1. Meese, R.A.; Rogoff, K. Empirical exchange rate models of the seventies: Do they fit out of sample? J. Int. Econ. 1983, 14, 3–24. [Google Scholar] [CrossRef]
  2. Meese, R.; Rogoff, K. The out-of-sample failure of empirical exchange rate models: Sampling error or misspecification? In Exchange Rates and International Macroeconomics; University of Chicago Press: Chicago, IL, USA, 1983; pp. 67–112. [Google Scholar]
  3. Štěpnička, M.; Cortez, P.; Donate, J.P.; Štěpničková, L. Forecasting seasonal time series with computational intelligence: On recent methods and the potential of their combinations. Expert Syst. Appl. 2013, 40, 1981–1992. [Google Scholar] [CrossRef] [Green Version]
  4. Cavalli, F.; Naimzada, A.; Pireddu, M. An evolutive financial market model with animal spirits: Imitation and endogenous beliefs. J. Evol. Econ. 2017, 27, 1007–1040. [Google Scholar] [CrossRef]
  5. Contreras, J.; Espinola, R.; Nogales, F.J.; Conejo, A.J. ARIMA models to predict next-day electricity prices. IEEE Trans. Power Syst. 2003, 18, 1014–1020. [Google Scholar] [CrossRef]
  6. Bollerslev, T. Generalized autoregressive conditional heteroskedasticity. J. Econom. 1986, 31, 307–327. [Google Scholar] [CrossRef] [Green Version]
  7. Galeshchuk, S. Neural networks performance in exchange rate prediction. Neurocomputing 2016, 172, 446–452. [Google Scholar] [CrossRef]
  8. Khashei, M.; Bijari, M. An artificial neural network (p, d, q) model for timeseries forecasting. Expert Syst. Appl. 2010, 37, 479–489. [Google Scholar] [CrossRef]
  9. Yadav, A.K.; Chandel, S. Solar radiation prediction using Artificial Neural Network techniques: A review. Renew. Sustain. Energy Rev. 2014, 33, 772–781. [Google Scholar] [CrossRef]
  10. Agatonovic-Kustrin, S.; Beresford, R. Basic concepts of artificial neural network (ANN) modeling and its application in pharmaceutical research. J. Pharm. Biomed. Anal. 2000, 22, 717–727. [Google Scholar] [CrossRef]
  11. Majhi, R.; Panda, G.; Sahoo, G. Efficient prediction of exchange rates with low complexity artificial neural network models. Expert Syst. Appl. 2009, 36, 181–189. [Google Scholar] [CrossRef]
  12. Pradeepkumar, D.; Ravi, V. Forecasting financial time series volatility using particle swarm optimization trained quantile regression neural network. Appl. Soft Comput. 2017, 58, 35–52. [Google Scholar] [CrossRef]
  13. Tang, Z.; Fishwick, P. Back-propagation neural nets as models for time series forecasting. ORSA J. Comput. 1993, 5, 374–385. [Google Scholar] [CrossRef]
  14. Mundell, R.A. Capital mobility and stabilization policy under fixed and flexible exchange rates. Can. J. Econ. Political Sci. 1963, 29, 475–485. [Google Scholar] [CrossRef]
  15. Dornbusch, R. Exchange rate expectations and monetary policy. J. Int. Econ. 1976, 6, 231–244. [Google Scholar] [CrossRef]
  16. Engel, C. Exchange rates and interest parity. In Handbook of International Economics, Vol. 4; Gopinath, G., Helpman, E., Rogoff, K., Eds.; Elsevier: Amsterdam, The Netherlands, 2013. [Google Scholar]
  17. Neely, C.J.; Sarno, L. How well do monetary fundamentals forecast exchange rates? In Federal Reserve Bank of St. Louis Working Paper Series; Federal Reserve Bank of St. Louis: St. Louis, MO, USA, 2002. [Google Scholar]
  18. Box, G.E.; Jenkins, G.M.; Reinsel, G.C.; Ljung, G.M. Time Series Analysis: Forecasting and Control; John Wiley & Sons: Hoboken, NJ, USA, 2015. [Google Scholar]
  19. Lam, M. Neural network techniques for financial performance prediction: Integrating fundamental and technical analysis. Decis. Support Syst. 2004, 37, 567–581. [Google Scholar] [CrossRef]
  20. Thinyane, H.; Millin, J. An investigation into the use of intelligent systems for currency trading. Comput. Econ. 2011, 37, 363–374. [Google Scholar] [CrossRef]
  21. Önder, E.; Bayır, F.; Hepsen, A. Forecasting macroeconomic variables using artificial neural network and traditional smoothing techniques. J. Appl. Financ. Bank. 2013, 3, 73–104. [Google Scholar]
  22. Ahmad, J.; Fatmi, H. Quadric neural network for the prediction of financial time series data. In Proceedings of the 1994 IEEE International Conference on Neural Networks (ICNN’94), Orlando, FL, USA, 28 June–2 July 1994; pp. 3667–3670. [Google Scholar]
  23. Swanson, N.R.; White, H. Forecasting economic time series using flexible versus fixed specification and linear versus nonlinear econometric models. Int. J. Forecast. 1997, 13, 439–461. [Google Scholar] [CrossRef] [Green Version]
  24. Kuan, C.-M.; White, H. Artificial neural networks: An econometric perspective. Econom. Rev. 1994, 13, 1–91. [Google Scholar] [CrossRef]
  25. Qi, M.; Maddala, G. Economic factors and the stock market: A new perspective. J. Forecast. 1999, 18, 151–166. [Google Scholar] [CrossRef]
  26. Gencay, R. Linear, non-linear and essential foreign exchange rate prediction with simple technical trading rules. J. Int. Econ. 1999, 47, 91–107. [Google Scholar] [CrossRef]
  27. Santos, A.A.P.; da Costa, N.C.A., Jr.; dos Santos Coelho, L. Computational intelligence approaches and linear models in case studies of forecasting exchange rates. Expert Syst. Appl. 2007, 33, 816–823. [Google Scholar] [CrossRef]
  28. Ozkan, F. A comparison of the monetary model and artificial neural networks in exchange rate forecasting. Bus. Econ. Res. J. 2012, 3, 1–27. [Google Scholar]
  29. Dunis, C.L.; Huang, X. Forecasting and trading currency volatility: An application of recurrent neural regression and model combination. J. Forecast. 2002, 21, 317–354. [Google Scholar] [CrossRef]
  30. Jena, P.R.; Majhi, R.; Majhi, B. Development and performance evaluation of a novel knowledge guided artificial neural network (KGANN) model for exchange rate prediction. J. King Saud Univ.-Comput. Inf. Sci. 2015, 27, 450–457. [Google Scholar] [CrossRef] [Green Version]
  31. Kamruzzaman, J.; Sarker, R.A. ANN-based forecasting of foreign currency exchange rates. Neural Inf. Process.-Lett. Rev. 2004, 3, 49–58. [Google Scholar]
  32. Chen, A.-S.; Leung, M.T. Regression neural network for error correction in foreign exchange forecasting and trading. Comput. Oper. Res. 2004, 31, 1049–1068. [Google Scholar] [CrossRef]
  33. Dunis, C.L.; Laws, J.; Sermpinis, G. Higher order and recurrent neural architectures for trading the EUR/USD exchange rate. Quant. Financ. 2011, 11, 615–629. [Google Scholar] [CrossRef]
  34. Nag, A.K.; Mitra, A. Forecasting daily foreign exchange rates using genetically optimized neural networks. J. Forecast. 2002, 21, 501–511. [Google Scholar] [CrossRef]
  35. Hinton, G.E. Training products of experts by minimizing contrastive divergence. Neural Comput. 2002, 14, 1771–1800. [Google Scholar] [CrossRef] [PubMed]
  36. Hinton, G.E.; Osindero, S.; Teh, Y.-W. A fast learning algorithm for deep belief nets. Neural Comput. 2006, 18, 1527–1554. [Google Scholar] [CrossRef] [PubMed]
  37. Nasse, F.; Thurau, C.; Fink, G.A. Face detection using gpu-based convolutional neural networks. In Proceedings of the International Conference on Computer Analysis of Images and Patterns, Münster, Germany, 2–4 September 2009; pp. 83–90. [Google Scholar]
  38. Osadchy, M.; Cun, Y.L.; Miller, M.L. Synergistic face detection and pose estimation with energy-based models. J. Mach. Learn. Res. 2007, 8, 1197–1215. [Google Scholar]
  39. Sukittanon, S.; Surendran, A.C.; Platt, J.C.; Burges, C.J. Convolutional networks for speech detection. In Proceedings of the Eighth International Conference on Spoken Language Processing, Jeju Island, Korea, 4–8 October 2004. [Google Scholar]
  40. Lee, H.; Pham, P.; Largman, Y.; Ng, A.Y. Unsupervised feature learning for audio classification using convolutional deep belief networks. In Proceedings of the Advances in Neural Information Processing Systems, Vancouver, BC, Canada, 7–10 December 2009; pp. 1096–1104. [Google Scholar]
  41. Busseti, E.; Osband, I.; Wong, S. Deep learning for time series modeling. Tech. Rep. Stanf. Univ. 2012, 1–5. [Google Scholar]
  42. Längkvist, M.; Karlsson, L.; Loutfi, A. A review of unsupervised feature learning and deep learning for time-series modeling. Pattern Recognit. Lett. 2014, 42, 11–24. [Google Scholar] [CrossRef] [Green Version]
  43. Ribeiro, B.; Lopes, N. Deep belief networks for financial prediction. In Proceedings of the International Conference on Neural Information Processing, Shanghai, China, 13–17 November 2011; pp. 766–773. [Google Scholar]
  44. Chao, J.; Shen, F.; Zhao, J. Forecasting exchange rate with deep belief networks. In Proceedings of the 2011 International Joint Conference on Neural Networks, San Jose, CA, USA, 31 July–5 August 2011; pp. 1259–1266. [Google Scholar]
  45. Yeh, S.-H.; Wang, C.-J.; Tsai, M.-F. Corporate default prediction via deep learning. In Proceedings of the 34th International Symposium on Forecasting (ISF’14), Rotterdam, The Netherlands, 29 June–2 July 2014. [Google Scholar]
  46. Hinton, G.E.; Salakhutdinov, R.R. Reducing the dimensionality of data with neural networks. Science 2006, 313, 504–507. [Google Scholar] [CrossRef] [PubMed]
  47. Schmidhuber, J. Deep learning in neural networks: An overview. Neural Netw. 2015, 61, 85–117. [Google Scholar] [CrossRef] [PubMed] [Green Version]
  48. Larochelle, H.; Bengio, Y.; Louradour, J.; Lamblin, P. Exploring strategies for training deep neural networks. J. Mach. Learn. Res. 2009, 10, 1–40. [Google Scholar]
  49. Masci, J.; Meier, U.; Cireşan, D.; Schmidhuber, J. Stacked convolutional auto-encoders for hierarchical feature extraction. In Proceedings of the International Conference on Artificial Neural Networks, Espoo, Finland, 14–17 June 2011; pp. 52–59. [Google Scholar]
  50. Ranzato, M.A.; Huang, F.J.; Boureau, Y.-L.; LeCun, Y. Unsupervised learning of invariant feature 7hierarchies with applications to object recognition. In Proceedings of the 2007 IEEE Conference on Computer Vision and Pattern Recognition, Minneapolis, MN, USA, 17–22 June 2007. [Google Scholar]
  51. Vincent, P.; Larochelle, H.; Bengio, Y.; Manzagol, P.-A. Extracting and composing robust features with denoising autoencoders. In Proceedings of the 25th International Conference on Machine Learning, Helsinki, Finland, 5–9 July 2008; pp. 1096–1103. [Google Scholar]
  52. LeCun, Y.; Bengio, Y.; Hinton, G. Deep learning. Nature 2015, 521, 436–444. [Google Scholar] [CrossRef]
  53. Zubiaga, A. A longitudinal assessment of the persistence of twitter datasets. J. Assoc. Inf. Sci. Technol. 2018, 69, 974–984. [Google Scholar] [CrossRef] [Green Version]
  54. Nazir, F.; Ghazanfar, M.A.; Maqsood, M.; Aadil, F.; Rho, S.; Mehmood, I. Social media signal detection using tweets volume, hashtag, and sentiment analysis. Multimed. Tools Appl. 2019, 78, 3553–3586. [Google Scholar] [CrossRef]
  55. Iqbal, M.; Ghazanfar, M.A.; Sattar, A.; Maqsood, M.; Khan, S.; Mehmood, I.; Baik, S.W. Kernel Context Recommender System (KCR): A Scalable Context-Aware Recommender System Algorithm. IEEE Access 2019, 7, 24719–24737. [Google Scholar] [CrossRef]
  56. Khan, S.; Khan, A.; Maqsood, M.; Aadil, F.; Ghazanfar, M.A. Optimized gabor feature extraction for mass classification using cuckoo search for big data e-healthcare. J. Grid Comput. 2018, 17, 239–254. [Google Scholar] [CrossRef]
  57. Kalsoom, A.; Maqsood, M.; Ghazanfar, M.A.; Aadil, F.; Rho, S. A dimensionality reduction-based efficient software fault prediction using Fisher linear discriminant analysis (FLDA). J. Supercomput. 2018, 74, 4568–4602. [Google Scholar] [CrossRef]
  58. Ateeq, T.; Majeed, M.N.; Anwar, S.M.; Maqsood, M.; Rehman, Z.-U.; Lee, J.W.; Muhammad, K.; Wang, S.; Baik, S.W.; Mehmood, I. Ensemble-classifiers-assisted detection of cerebral microbleeds in brain MRI. Comput. Electr. Eng. 2018, 69, 768–781. [Google Scholar] [CrossRef]
Figure 1. The proposed methodology for the foreign exchange rate prediction.
Applsci 09 02980 g001
Figure 2. The deep learning architecture for the foreign exchange rate forecasting.
Applsci 09 02980 g002
Figure 3. The plot of 50 forecasted and actual values of the foreign exchange rate of Hong Kong, Pakistan, and the UK considering linear, support vector, and deep learning model (without sentiment). LR: Linear regression, SVR: Support vector regression, DL: Deep learning.
Applsci 09 02980 g003
Figure 4. The plot of 50 forecasted and actual values of the foreign exchange rate of Hong Kong considering linear, support vector, and deep learning model with the sentiment of Hong Kong protest and US election. LR: Linear regression, SVR: Support vector regression, DL: Deep learning.
Applsci 09 02980 g004
Figure 5. The plot of 50 forecasted and actual values of the foreign exchange rate of Pakistan considering linear, support vector, and deep learning model with the sentiment of US election and Lahore blast. LR: Linear regression, SVR: Support vector regression, DL: Deep learning.
Applsci 09 02980 g005
Figure 6. The plot of 50 forecasted and actual values of the foreign exchange rate of the UK considering linear, support vector, and deep learning model with the sentiment of US election and Brexit. LR: Linear regression, SVR: Support vector regression, DL: Deep learning.
Applsci 09 02980 g006
Table 1. Data description.
Variables/CountriesHong KongPakistanUK
Exchange rate, crude oil prices, gold price index.From 26 April 2008 to 31 May 2018From 29 March 2008 to 31 January 2019From 2 January 2008 to 28 November 2018
2123 observations 2132 observations2633 observations
Table 2. Dataset details along with local and global events for each country.
CountryLocal EventsNumber of TweetsGlobal EventNumber of Tweets
Hong KongHong Kong Protest (2014)1,188,372US Election 20121,740,258
PakistanLahore Blast 20161,149,253US Election 20121,740,258
UKBrexit1,826,290US Election 20121,740,258
The date is taken from http://data.imf.org/regular.aspx.
Table 3. Descriptive statistic.
Exchange RateOther Variables
Hong KongPakistanUKOil PricesGold Price Index
Mean7.76998.2571.53674.64521.424
Median7.758101.8561.55479.35019.380
Std. Dev.0.026114.7400.17022.7247.689
Jarque–Bera1729.421 ***24.135 ***164.269 ***186.477 ***4619.799 ***
Observation21212131263221212121
*** shows that test stat is significant at 1%.
Table 4. Augmented Dickey–Fuller (ADF) unit root test.
CountriesVariablesADF Test StatCritical Value (5%)
Level1st Difference
Hong KongExchange rate−1.980−23.610 ***−2.86
Oil prices−1.613−47.594 ***−2.86
Gold price index−3.427 *** −2.86
PakistanExchange rate−0.161−45.311 ***−2.86
Oil prices−1.613−47.594 ***−2.86
Gold price index−3.427 *** −2.86
UKExchange rate−2.231−51.735 ***−2.86
Oil prices−1.613−47.594 ***−2.86
Gold price index−3.427 *** −2.86
*** shows that test stat is significant at 1%. The Phillips–Perron test also yields the same results and can be provided if required.
Table 5. Results for all the countries without event sentiments.
Without SentimentMean Absolute Error (MAE)Root Mean Squared Error (RMSE)
Linear RegressionSupport Vector RegressionDeep LearningLinear RegressionSupport Vector RegressionDeep Learning
Final HK0.018 ± 0.0180.017 ± 0.0240.017 ± 0.0170.025 ± 0.0000.029 ± 0.0000.024 ± 0.000
Final Pak9.042 ± 7.9028.687 ± 8.2857.636 ± 6.95212.008 ± 0.00012.004 ± 0.00010.327 ± 0.000
Final UK0.074 ± 0.0540.074 ± 0.0540.068 ± 0.0600.092 ± 0.0000.092 ± 0.0000.091 ± 0.000
Table 6. Results for Hong Kong (HK) with event sentiments.
With SentimentMean Absolute Error (MAE)Root Mean Squared Error (RMSE)
Final HKLinear RegressionSupport Vector RegressionDeep LearningLinear RegressionSupport Vector RegressionDeep Learning
Hong Kong protest 20140.010 ± 0.0080.009 ± 0.0100.011 ± 0.0070.013 ± 0.0000.014 ± 0.0000.013 ± 0.000
US election 20120.010 ± 0.0080.010 ± 0.0090.013 ± 0.0080.013 ± 0.0000.014 ± 0.0000.015 ± 0.000
Table 7. Results for Pakistan with event sentiments.
With SentimentMean Absolute Error (MAE)Root Mean Squared Error (RMSE)
Final PAKLinear RegressionSupport Vector RegressionDeep LearningLinear RegressionSupport Vector RegressionDeep Learning
Lahore blast 20168.024 ± 5.0417.785 ± 7.21511.466 ± 6.6779.476 ± 0.00010.615 ± 0.00013.268 ± 0.000
US election 20123.250 ± 2.6963.127 ± 3.3602.613 ± 2.3804.223 ± 0.0004.590 ± 0.0003.534 ± 0.000
Table 8. Results for the UK with event sentiments.
With SentimentMean Absolute Error (MAE)Root Mean Squared Error (RMSE)
The Final UKLinear RegressionSupport Vector RegressionDeep LearningLinear RegressionSupport Vector RegressionDeep Learning
Brexit 20160.060 ± 0.0560.060 ± 0.0570.064 ± 0.0690.082 ± 0.0000.082 ± 0.0000.095 ± 0.000
US election 20120.067 ± 0.0700.066 ± 0.0720.078 ± 0.0670.097 ± 0.0000.098 ± 0.0000.102 ± 0.000

