Article

Potential Marker Genes for Predicting Adipogenic Differentiation of Mesenchymal Stromal Cells

1
Natural Science Center for Basic Research and Development, Hiroshima University, Hiroshima 734-8533, Japan
2
Department of Advanced Technology and Development, BML, Inc., Saitama 350-1101, Japan
3
Department of Dental and Medical Biochemistry, Institute of Biomedical & Health Sciences, Hiroshima University, Hiroshima 734-8533, Japan
4
Department of Molecular Biology and Biochemistry, Graduate School of Biomedical & Health Sciences, Hiroshima University, Hiroshima 734-8533, Japan
5
Cancer Research Centre, Institute for Medical Research, Kuala Lumpur 50588, Malaysia
6
Research Center for Radiation Genome Medicine, Research Institute for Radiation Biology and Medicine, Hiroshima 734-8533, Japan
7
Departments of Periodontal Medicine, Graduate School of Biomedical & Health Sciences, Hiroshima University, Hiroshima 734-8533, Japan
8
Writing Center, Hiroshima University, Higashi-Hiroshima 739-8512, Japan
*
Author to whom correspondence should be addressed.
Appl. Sci. 2019, 9(14), 2942; https://doi.org/10.3390/app9142942
Submission received: 24 June 2019 / Revised: 17 July 2019 / Accepted: 19 July 2019 / Published: 23 July 2019
(This article belongs to the Special Issue Biomaterials for Bone Tissue Engineering)

Abstract

:
Mesenchymal stromal cells (MSCs) are a promising source for tissue engineering of soft connective tissues. However, the differentiation capacity of MSCs varies among individual cell lines. Here, we show marker genes to predict the adipogenic potential of MSCs. To clarify the correlation between gene expression patterns before adipogenic induction and the differentiation level of MSCs after differentiation, we compared mRNA levels of 95 genes and glycerol-3-phosphate dehydrogenase (GPDH) activities in 15 MSC lines (five jaw and 10 ilium MSCs) from 15 donors. Expression profiles of 22 genes before differentiation significantly correlated with GPDH activities after differentiation. Expression levels of 11 out of the 22 genes in highly potent ilium MSCs were at least three times higher compared with jaw MSCs, which have limited differentiation potential. Furthermore, three-dimensional scatter plot for mRNA expression of ITGA5, CDKN2D, and CD74 could completely distinguish highly potent MSCs from poorly potent MSCs for adipogenesis. The treatment of MSC cultures with the anti-ITGA5 antibody reduced adipogenic differentiation of MSCs. Collectively, these results suggest that the three genes play a role in adipogenesis before induction and can serve as predictors to select potent MSCs for adipogenic differentiation.

1. Introduction

Mesenchymal stromal cells (MSCs) can be used in regenerative medicine to treat various tissue defects [1,2,3]. Adipose tissue engineering was developed to reconstruct soft tissue with defects caused by trauma or resection of tumors. Since adipose tissue transplantation did not provide promising results, stem cell transplantation is now gaining support as another strategy for restoring soft tissue defects [4]. Although stem cells such as MSCs can proliferate and differentiate into various types of cells, MSCs obtained from different sources may differ in potential or direction of differentiation [5,6,7]. For the reconstruction of soft connective tissues, cells capable of differentiating into adipocytes are essential. Thus, there is an urgent need for effective strategies to select suitable MSCs. Recent studies have described cell surface markers that predict the potential of MSCs to differentiate into chondrocytes or osteoblasts [8,9]. However, prediction markers for the adipogenic potential of MSCs have not yet been identified.
Recently, we identified marker genes to predict the chondrogenic differentiation potential of MSCs [7]. The mRNA levels of the prediction markers before differentiation showed significant correlations with the protein levels of glycosaminoglycan, a chondrogenic marker, in MSC cultures after chondrogenic differentiation. The combined analysis of three marker genes presented an excellent predictive ability for screening MSCs with high differentiation potential for chondrogenesis.
Here we report potential prediction markers for the selection of potent MSCs for adipogenesis. By comparing expression profiles of 95 genes in 15 undifferentiated MSCs with glycerol-3-phosphate dehydrogenase (GPDH) activities in the same MSCs after adipogenic induction, 22 genes were selected for further analysis. Combined three-dimensional (3D) analysis of mRNA expression of these genes showed the complete separation of highly potent ilium MSCs from jaw MSCs with limited differentiation capacity.

2. Materials and Methods

2.1. Cells

Human MSCs were obtained from the iliac crest or jaw bone marrow of 15 patients at Hiroshima University Hospital as described previously [7]. Patient information is listed in Table S1. The protocol was approved by the Hiroshima University Ethics Committee (Permit Number: Epd-D88-4).

2.2. Adipogenic Differentiation of MSCs

After four passages, MSCs were seeded at 3 × 10³ cells per cm2 in 24-well plates and maintained to 90% confluence in Dulbecco’s modified Eagle’s medium (DMEM; Sigma) supplemented with 10% fetal bovine serum (FBS, Hyclone), 100 U/mL penicillin G (Sigma), and 100 mg/mL streptomycin (Sigma). For adipogenic induction, the MSCs were maintained in DMEM (high glucose) (Sigma) containing 10% FBS, 10 mg/mL insulin (Wako), 0.2 mM indomethacin (Wako), 0.5 mM 3-isobutyl-1-methyl-xanthine (Wako), and 1 mM dexamethasone (Sigma) (adipogenic induction medium) for three days, followed by a 4-day incubation with DMEM containing 10% FBS and 10 mg/mL insulin (maintenance medium). The adipogenic treatment was repeated four times. GPDH activities were determined at 28 days using a GPDH activity assay kit (Hokudo), as previously described [10]. GPDH activities were normalized using genomic DNA content, which was determined by the PicoGreen fluorescence assay (Invitrogen).

2.3. Osteogenic Differentiation of MSCs

Confluent MSCs were maintained in DMEM supplemented with 10% FBS, 100 nM dexamethasone, 10 mM β-glycerophosphate (Tokyo-Kasei-Kogyo), 50 mg/mL ascorbic 2-phosphate (Sigma), 100 U/mL penicillin G, and 100 mg/mL streptomycin (osteogenic induction medium) for 28 days. Calcium content was determined using Calcium C Test (Wako) as described previously [11] and normalized to the content of genomic DNA (Figure S1).

2.4. Quantitative RT-PCR

The selection of 95 genes as candidate markers and the measurement of mRNA expression by a TaqMan low-density array (Applied Biosystems) with the ABI Prism 7900 Sequence Detection System (Applied Biosystems) has been described previously [7,10]. Relative mRNA levels were normalized to those of β-actin. The gene names and the probe set IDs for primers, and TaqMan probes are summarized in Table S2.

2.5. 3D Scatter Plot

Scatter plots of the relative mRNA expression of CDKN2D, ITGA5, and CD74 in 15 MSC lines were generated using SPSS 24.0. (IBM Corp.). Distances between the origin and each point were measured to compare differences among the MSC lines.

2.6. Effects of Anti-ITGA5 Antibody on Adipogenesis

To examine the effects of anti-ITGA5 antibody on adipogenic differentiation, anti-ITGA5 (BioLegend, #328004) or control IgG (BioLegend, #400348) was added to the adipogenic induction medium and maintenance medium of ilium MSCs (Riken BRC) for 21 days. Cultures were washed with PBS and incubated with oil red O dye (Wako, 0.3% in isopropanol) for 15 min at 37 °C [12]. The percent of the stained area of cells was quantified using ImageJ software [13].

2.7. Statistical Analysis

Statistical analyses were conducted using SPSS. Correlation between mRNA expression levels and GPDH activities was identified using the Pearson correlation coefficient as described previously [7]. The statistical significance between two groups was determined by Student’s t-test. One-way ANOVA was used for multiple comparisons. A p value of less than 0.05 was considered statistically significant.

3. Results

3.1. Correlational Analysis between Gene Expression before Differentiation and GPDH Activity after Adipogenic Differentiation

The ability of MSCs to differentiate into a distinct type of cells, such as adipocytes, is thought to vary among MSCs isolated from different tissues and/or donors. To confirm this assumption, we measured the activity of GPDH, an adipogenic differentiation marker, in 15 different MSCs (five jaw and 10 ilium MSCs) from 15 donors at 28 days after induction of adipogenesis. As expected, GPDH activities significantly varied across the MSC lines (Figure 1, p < 0.001, one-way ANOVA). However, the GPDH activity of ilium MSCs was 18 times higher than that of jaw MSCs (Figure S1a). On the other hand, after osteogenic differentiation, calcium content, an osteogenic differentiation marker, was not significantly different between jaw and ilium MSCs (Figure S1b).
To screen candidate markers for predicting the adipogenic differentiation ability of MSCs before adipogenic induction, we investigated the correlation between GPDH activities described above and mRNA expression of 95 genes in undifferentiated MSCs using the data from low-density arrays of previous studies [7,10] (Table S2). The expression patterns of 22 out of 95 genes in the 15 MSCs before differentiation significantly positively related to the GPDH activities in the same MSC lines after adipogenic differentiation (Table 1 and Table S2).

3.2. Combined Evaluation of mRNA Expression of Candidate Genes

Since GPDH activity was much higher in ilium MSCs relative to jaw MSCs (Figure S1a), the mRNA expression of the isolated 22 candidates in ilium MSCs was compared with that in jaw MSCs (Table 2). We found that 18 of the 22 genes in ilium MSCs were expressed at significantly higher levels compared with jaw MSCs, whereas the remaining four genes were not significantly higher in ilium MSCs. In addition, mRNA levels of 11 genes in ilium MSCs were at least three times higher than those in jaw MSCs.
The levels of the 11 genes in individual jaw MSCs were lower than those in most, but not all, ilium MSCs (Figure S2), although mean levels of these genes in jaw MSCs were at least three times lower than those in ilium MSCs (Table 2). The highest value of each gene in jaw MSC lines is higher than the lowest value in ilium MSC lines. This inconsistency is because the expression levels of the 11 genes greatly varied across MSC lines even in the same group. To reduce the effect of the inter-individual variation, we performed a combined 3D analysis of gene expression (Figure 2). In this analysis, we chose CD74 and CDKN2D, the expression levels of which were approximately 20 times higher in ilium MSCs compared with jaw MSCs (Table 2). We also chose ITGA5, which showed the highest correlation coefficient of 0.826 in the correlation analysis (Table 1). The 3D scatter plot for CDKN2D, ITGA5, and CD74 mRNA expression showed the complete separation between ilium MSCs and jaw MSCs. The values in all ilium MSC lines were more than three times higher than those in any jaw MSC line (Figure 2b).

3.3. Effects of Anti-ITGA5 Antibody on Adipogenic Differentiation of Ilium MSCs

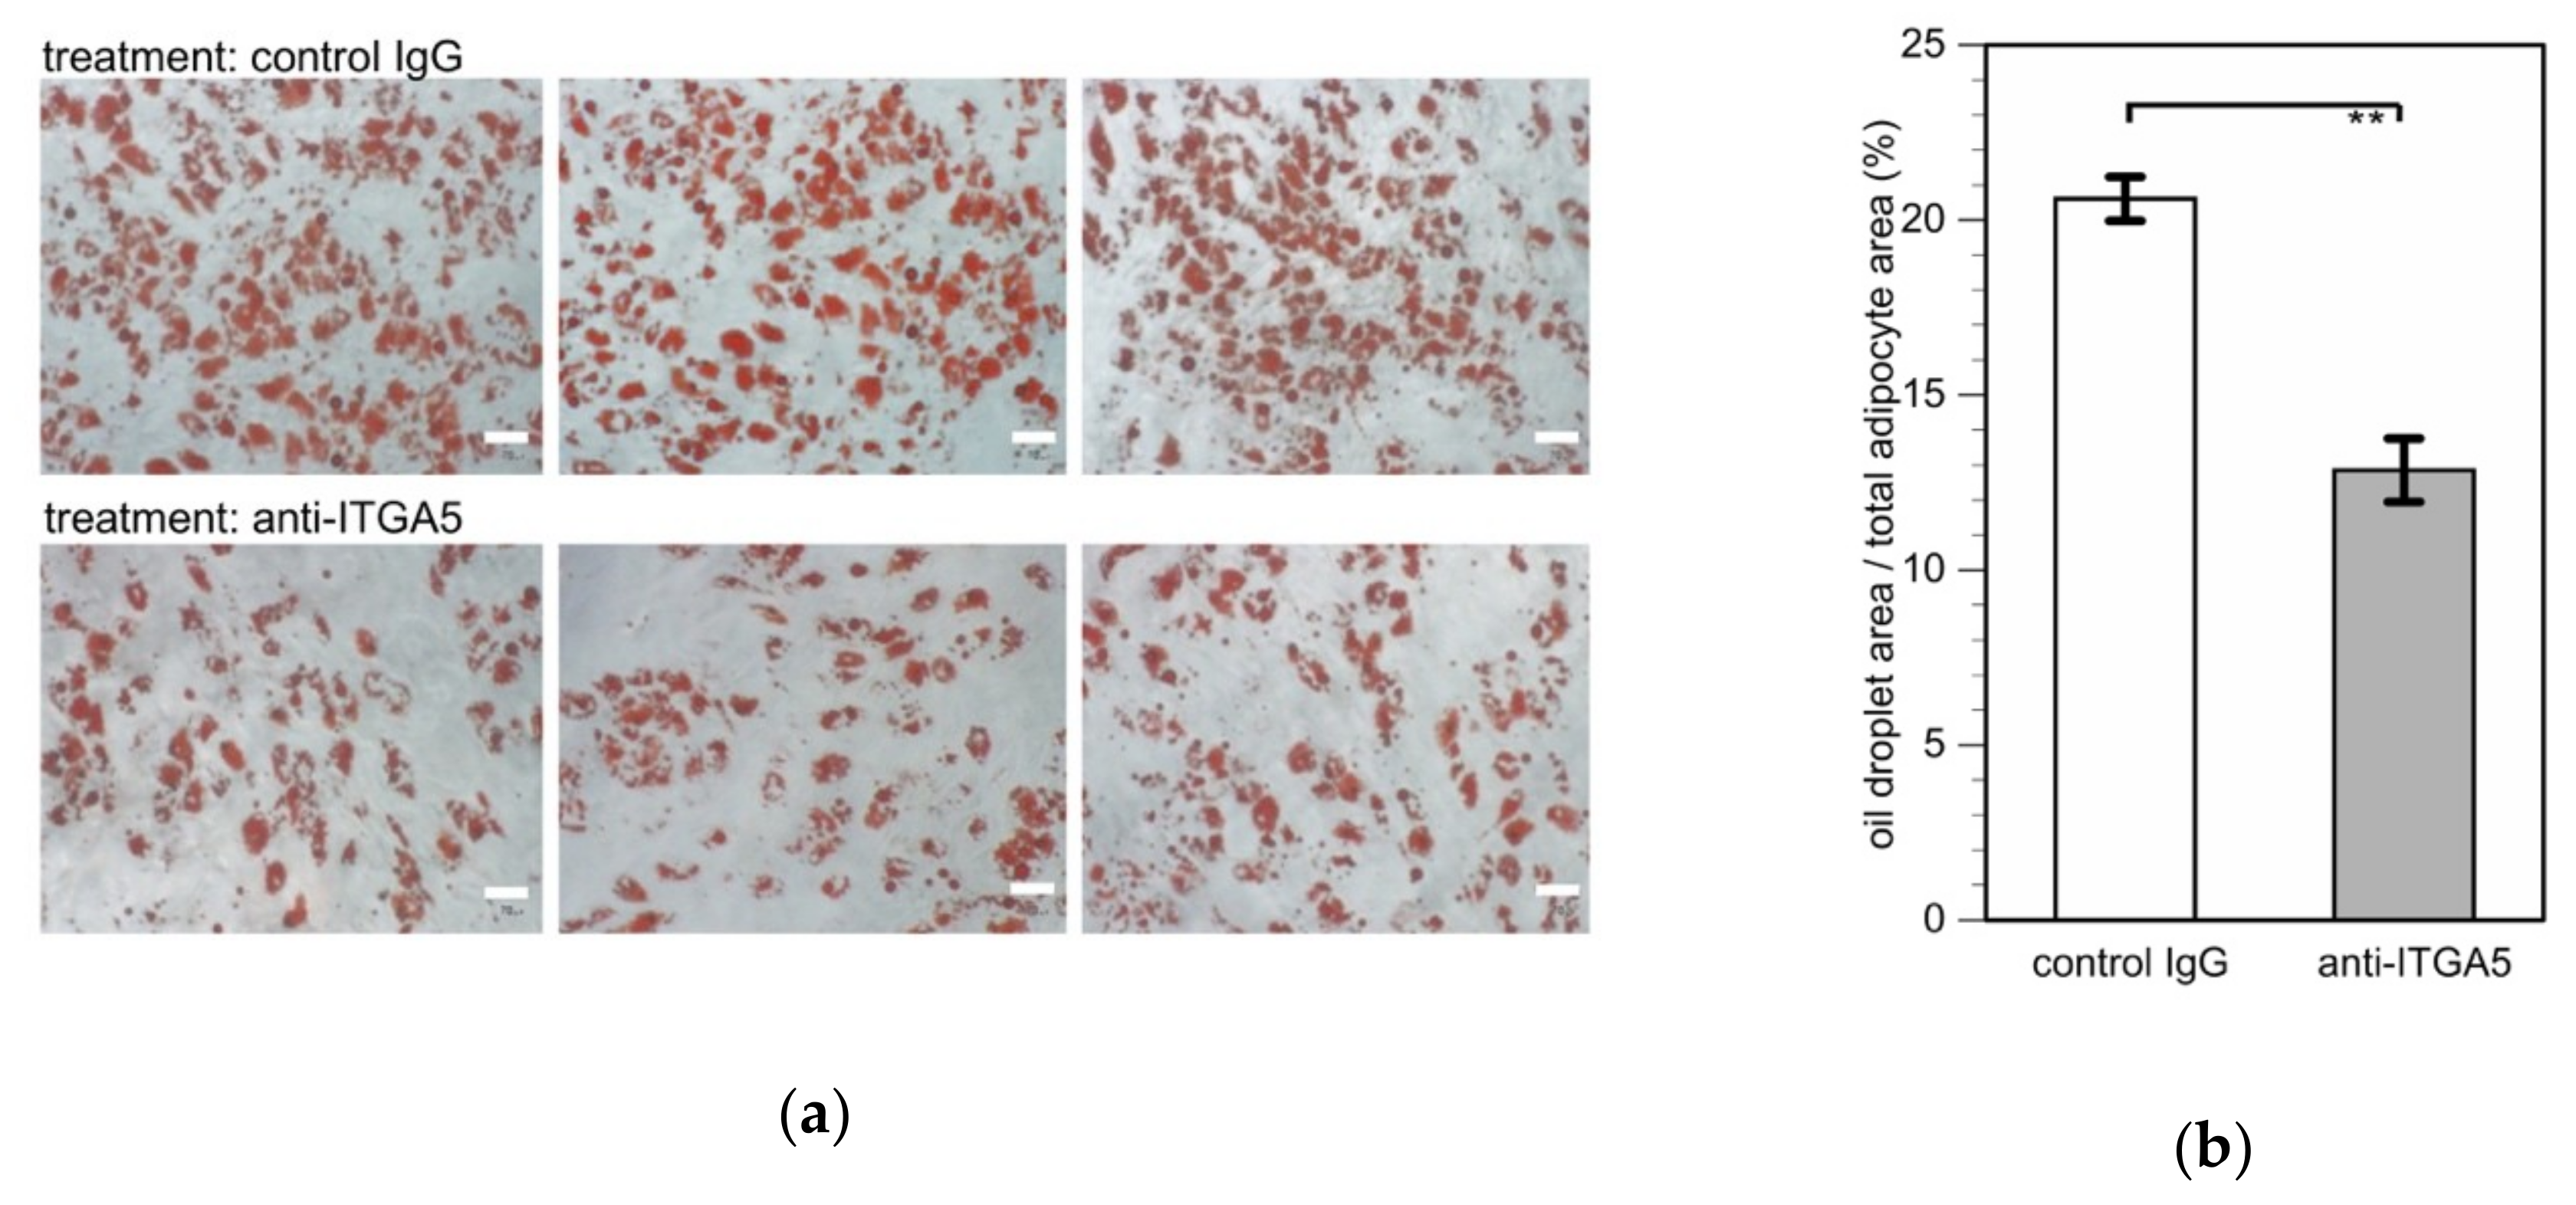
To explore the potential role of ITGA5, whose correlation coefficient was the highest of all 95 genes examined (Table 1), we investigated the effects of the anti-ITGA5 antibody on the adipogenic differentiation of ilium MSCs. Treatment with the anti-ITGA5 antibody significantly suppressed the adipogenic differentiation of MSCs as compared with control IgG (Figure 3).

4. Discussion

In our previous study, we selected 95 genes as candidate MSC marker genes based on microarray analysis data [10]. Although the 95 genes may not be enough to identify useful markers, and other genes may serve as more reliable markers, these 95 genes can be a promising starting point for further analysis. In this study, we correlated mRNA expression levels in MSCs before induction with GPDH activities after adipogenic differentiation in order to identify marker genes for MSCs with high adipogenic potential. Twenty-two out of the 95 genes showed the expression profiles significantly correlated with GPDH activities. Expression levels of 11 out of the 22 genes in ilium MSCs, which show high differentiation potential, were more than three times higher than those in jaw MSCs, which have only limited potential. We selected the 11 genes, ITGA5, MCAM, GPR37, ACLY, DNCI1, P4HA2, LIF, CDKN2D, CD74, AURKB, and SLC2A1, as potential markers. Although none of these genes accurately distinguished ilium MSCs from jaw MSCs, combined 3D analysis of CDKN2D, ITGA5, and CD74 mRNA expression allowed us to completely separate the two types of MSCs. Thus, the 3D analysis can provide an effective strategy to select MSCs with high adipogenic potential.
All 11 genes identified in the present study are involved in cell growth and/or cell cycle regulation [14,15,16,17,18,19,20,21,22,23,24]. ITGA5 codes the important adhesion molecule involved in adipogenesis [14], and ACLY codes a key enzyme in fat synthesis [17,25]. MCAM (CD146) regulates the proliferation and differentiation of MSCs [15] and serves as a cell surface marker for predicting the potential of MSCs to differentiate into chondrocytes [8]. Although our results suggest that ITGA5 plays a role in the differentiation of MSCs at the early stage of adipogenesis, the exact function of these genes in adipogenesis remains to be investigated in future studies.
The differentiation potential and direction of MSCs seems to differ depending on their origins, although MSCs can be obtained from various tissues, including the bone marrow, adipose tissue, synovium, and dental pulp. Matsubara et al. [5] found that MSCs derived from alveolar bone marrow have poor adipogenic or chondrogenic differentiation potential, but high osteogenic differentiation potential similar to ilium MSCs. On the other hand, MSCs from synovium are superior to ilium MSCs in both adipogenesis and chondrogenesis [26]. In this study, we also found bone marrow MSCs obtained from the jaw to have a limited capacity to differentiate into adipocytes as compared with bone marrow MSCs from the ilium, although jaw MSCs have a high ability to become osteoblasts. Furthermore, Mohamed-Ahmed et al. [27] demonstrated that MSCs from adipose tissues have a higher adipogenic ability than MSCs from bone marrow. In contrast, bone marrow MSCs showed a higher ability to differentiate into osteoblasts and chondrocytes than adipose MSCs. However, differentiation levels determined by oil red O staining varied widely among donors of MSCs. In addition, MSCs obtained from adipose tissues have a reduced proliferative capacity [28,29]. Since MSCs from the ilium bone marrow have a high proliferative and multipotent capacity to differentiate into various types of cells, we speculate that ilium bone marrow MSCs have a high adipogenic differentiation potential, and can serve as materials for soft tissue engineering, although their differentiation potential varies among cell lines.
In most previous studies, preadipocytes have been used for tissue engineering of soft connective tissues [30]. However, the precursor cells already committed to certain lineages have only limited proliferative activity [4,31]. MSCs derived from adipose tissues have also been shown to have an ability to differentiate into various types of cells including adipocytes, as described above [27,28,29]. However, the difference between preadipocytes and MSCs is not clear. Further studies are warranted to evaluate the potential of preadipocytes and MSCs.
In our previous study, we found eight gene markers capable of predicting the potential to differentiate into chondrocytes [7]. In this study, five out of the eight genes were also identified as marker genes for predicting adipogenic differentiation. In addition, we identified the gene for MCAM (CD146), a cell surface marker capable of isolating potent MSCs for chondrogenesis [8], as a prediction marker for adipogenesis. These findings suggest the existence of a common genetic basis for chondrogenesis and adipogenesis. Accordingly, a significant correlation of differentiation marker levels after induction was observed between chondrocytes and adipocytes derived from 17 ilium MSCs [11].
In the present study, we selected CDKN2D, ITGA5, and CD74 for 3D analysis. As we described above, the expression levels of CDKN2D and CD74 in ilium MSCs were approximately 20 times higher than those in jaw MSCs (Table 2), making them promising candidates. Although ITGA5 showed the highest correlation coefficient (Table 1), there is another candidate for 3D analysis. When MCAM, whose expression levels were 13.4 times higher in ilium MSCs (Table 2), was used instead of ITGA5, the 3D analysis showed similar results (Figure S3). CDKN2D and CD74 used for the 3D analysis in this study were also used for the 3D analysis for chondrogenic potential in the previous study [7]. However, the third chondrogenic prediction marker gene, TGM2, was not identified even as a candidate gene in this study. Therefore, two types of 3D analysis with different combinations of the four genes (CDKN2D, ITGA5, CD74, and TGM2) can be used to predict the differentiation of MSCs for adipogenesis as well as chondrogenesis.

5. Conclusions

The 3D analysis of CDKN2D, ITGA5, and CD74 mRNA expression may offer a novel strategy to identify MSCs with the potential to differentiate into adipocytes. This strategy could be useful to improve clinical outcomes for soft tissue regeneration using MSCs.

Supplementary Materials

The following are available online at https://www.mdpi.com/2076-3417/9/14/2942/s1, Figure S1: Comparison of differentiation levels between jaw and ilium MSCs, Figure S2: Comparison of expression levels between jaw and ilium MSCs of the predictor genes before adipogenic induction, Figure S3: 3D analysis of CDKN2D, CD74 and MCAM mRNA expression, Table S1: Donor information, Table S2: Correlation between gene expression levels before induction and GPDH activities after adipogenic induction in 15 MSCs.

Author Contributions

Conceptualization, M.K., Y.K. and T.K.; methodology, M.K., A.I., K.F., Y.H., H.K., Y.K. and T.K.; investigation, M.K., A.I. and V.S.R.; resources, Y.H., H.K.; writing—original draft preparation, M.K. and T.K.; writing—review and editing, K.F. and Y.K.; visualization, M.K., A.I. and T.K.; supervision, H.K., Y.K. and T.K.; funding acquisition, M.K.

Funding

This research was funded by JSPS KAKENHI, grant number JP17K11541.

Conflicts of Interest

The authors declare no conflict of interest.

References

  1. Wang, X.; Gao, L.; Han, Y.; Xing, M.; Zhao, C.; Peng, J.; Chang, J. Silicon-Enhanced Adipogenesis and Angiogenesis for Vascularized Adipose Tissue Engineering. Adv. Sci. 2018, 5, 1800776. [Google Scholar] [CrossRef] [PubMed]
  2. Janderova, L.; McNeil, M.; Murrell, A.N.; Mynatt, R.L.; Smith, S.R. Human mesenchymal stem cells as an in vitro model for human adipogenesis. Obes. Res. 2003, 11, 65–74. [Google Scholar] [CrossRef]
  3. Samsonraj, R.M.; Raghunath, M.; Nurcombe, V.; Hui, J.H.; van Wijnen, A.J.; Cool, S.M. Concise Review: Multifaceted Characterization of Human Mesenchymal Stem Cells for Use in Regenerative Medicine. Stem Cells Transl. Med. 2017, 6, 2173–2185. [Google Scholar] [CrossRef] [PubMed] [Green Version]
  4. Choi, Y.S.; Park, S.N.; Suh, H. Adipose tissue engineering using mesenchymal stem cells attached to injectable PLGA spheres. Biomaterials 2005, 26, 5855–5863. [Google Scholar] [CrossRef] [PubMed]
  5. Matsubara, T.; Suardita, K.; Ishii, M.; Sugiyama, M.; Igarashi, A.; Oda, R.; Nishimura, M.; Saito, M.; Nakagawa, K.; Yamanaka, K.; et al. Alveolar bone marrow as a cell source for regenerative medicine: Differences between alveolar and iliac bone marrow stromal cells. J. Bone Miner. Res. 2005, 20, 399–409. [Google Scholar] [CrossRef] [PubMed]
  6. Bearden, R.N.; Huggins, S.S.; Cummings, K.J.; Smith, R.; Gregory, C.A.; Saunders, W.B. In-vitro characterization of canine multipotent stromal cells isolated from synovium, bone marrow, and adipose tissue: A donor-matched comparative study. Stem Cell Res. Ther. 2017, 8, 218. [Google Scholar] [CrossRef] [PubMed]
  7. Kanawa, M.; Igarashi, A.; Fujimoto, K.; Higashi, Y.; Kurihara, H.; Sugiyama, M.; Saskianti, T.; Kato, Y.; Kawamoto, T. Genetic Markers Can Predict Chondrogenic Differentiation Potential in Bone Marrow-Derived Mesenchymal Stromal Cells. Stem Cells Int. 2018, 2018, 9530932. [Google Scholar] [CrossRef] [PubMed]
  8. Wu, C.C.; Liu, F.L.; Sytwu, H.K.; Tsai, C.Y.; Chang, D.M. CD146+ mesenchymal stem cells display greater therapeutic potential than CD146- cells for treating collagen-induced arthritis in mice. Stem Cell Res. Ther. 2016, 7, 23. [Google Scholar] [CrossRef]
  9. Shi, Y.; He, G.; Lee, W.C.; McKenzie, J.A.; Silva, M.J.; Long, F. Gli1 identifies osteogenic progenitors for bone formation and fracture repair. Nat. Commun. 2017, 8, 2043. [Google Scholar] [CrossRef] [PubMed]
  10. Igarashi, A.; Segoshi, K.; Sakai, Y.; Pan, H.; Kanawa, M.; Higashi, Y.; Sugiyama, M.; Nakamura, K.; Kurihara, H.; Yamaguchi, S.; et al. Selection of common markers for bone marrow stromal cells from various bones using real-time RT-PCR: Effects of passage number and donor age. Tissue Eng. 2007, 13, 2405–2417. [Google Scholar] [CrossRef]
  11. Kanawa, M.; Igarashi, A.; Ronald, V.S.; Higashi, Y.; Kurihara, H.; Sugiyama, M.; Saskianti, T.; Pan, H.; Kato, Y. Age-dependent decrease in the chondrogenic potential of human bone marrow mesenchymal stromal cells expanded with fibroblast growth factor-2. Cytotherapy 2013, 15, 1062–1072. [Google Scholar] [CrossRef] [PubMed]
  12. Warnke, I.; Goralczyk, R.; Fuhrer, E.; Schwager, J. Dietary constituents reduce lipid accumulation in murine C3H10 T1/2 adipocytes: A novel fluorescent method to quantify fat droplets. Nutr. Metab. (Lond.) 2011, 8, 30. [Google Scholar] [CrossRef] [PubMed]
  13. Girish, V.; Vijayalakshmi, A. Affordable image analysis using NIH Image/ImageJ. Indian J. Cancer 2004, 41, 47. [Google Scholar] [PubMed]
  14. Wang, H.; Li, J.; Zhang, X.; Ning, T.; Ma, D.; Ge, Y.; Xu, S.; Hao, Y.; Wu, B. Priming integrin alpha 5 promotes the osteogenic differentiation of human periodontal ligament stem cells due to cytoskeleton and cell cycle changes. J. Proteom. 2018, 179, 122–130. [Google Scholar] [CrossRef] [PubMed]
  15. Stopp, S.; Bornhauser, M.; Ugarte, F.; Wobus, M.; Kuhn, M.; Brenner, S.; Thieme, S. Expression of the melanoma cell adhesion molecule in human mesenchymal stromal cells regulates proliferation, differentiation, and maintenance of hematopoietic stem and progenitor cells. Haematologica 2013, 98, 505–513. [Google Scholar] [CrossRef]
  16. Liu, F.; Zhu, C.; Huang, X.; Cai, J.; Wang, H.; Wang, X.; He, S.; Liu, C.; Yang, X.; Zhang, Y.; et al. A low level of GPR37 is associated with human hepatocellular carcinoma progression and poor patient survival. Pathol. Res. Pract. 2014, 210, 885–892. [Google Scholar] [CrossRef]
  17. Granchi, C. ATP citrate lyase (ACLY) inhibitors: An anti-cancer strategy at the crossroads of glucose and lipid metabolism. Eur. J. Med. Chem. 2018, 157, 1276–1291. [Google Scholar] [CrossRef]
  18. Kardon, J.R.; Vale, R.D. Regulators of the cytoplasmic dynein motor. Nat. Rev. Mol. Cell Biol. 2009, 10, 854–865. [Google Scholar] [CrossRef] [Green Version]
  19. Xiong, G.; Deng, L.; Zhu, J.; Rychahou, P.G.; Xu, R. Prolyl-4-hydroxylase alpha subunit 2 promotes breast cancer progression and metastasis by regulating collagen deposition. BMC Cancer 2014, 14, 1. [Google Scholar] [CrossRef]
  20. Li, X.; Yang, Q.; Yu, H.; Wu, L.; Zhao, Y.; Zhang, C.; Yue, X.; Liu, Z.; Wu, H.; Haffty, B.G.; et al. LIF promotes tumorigenesis and metastasis of breast cancer through the AKT-mTOR pathway. Oncotarget 2014, 5, 788–801. [Google Scholar] [CrossRef] [Green Version]
  21. Wang, Y.; Jin, W.; Jia, X.; Luo, R.; Tan, Y.; Zhu, X.; Yang, X.; Wang, X.; Wang, K. Transcriptional repression of CDKN2D by PML/RARalpha contributes to the altered proliferation and differentiation block of acute promyelocytic leukemia cells. Cell Death Dis. 2014, 5, e1431. [Google Scholar] [CrossRef] [PubMed]
  22. Cheng, S.P.; Liu, C.L.; Chen, M.J.; Chien, M.N.; Leung, C.H.; Lin, C.H.; Hsu, Y.C.; Lee, J.J. CD74 expression and its therapeutic potential in thyroid carcinoma. Endocr. Relat. Cancer 2015, 22, 179–190. [Google Scholar] [CrossRef] [PubMed] [Green Version]
  23. Kim, D.S.; Lee, M.W.; Yoo, K.H.; Lee, T.H.; Kim, H.J.; Jang, I.K.; Chun, Y.H.; Kim, H.J.; Park, S.J.; Lee, S.H.; et al. Gene expression profiles of human adipose tissue-derived mesenchymal stem cells are modified by cell culture density. PLoS ONE 2014, 9, e83363. [Google Scholar] [CrossRef] [PubMed]
  24. Xiao, H.; Wang, J.; Yan, W.; Cui, Y.; Chen, Z.; Gao, X.; Wen, X.; Chen, J. GLUT1 regulates cell glycolysis and proliferation in prostate cancer. Prostate 2018, 78, 86–94. [Google Scholar] [CrossRef] [PubMed]
  25. Katsurada, A.; Fukuda, H.; Iritani, N. Effects of dietary nutrients on substrate and effector levels of lipogenic enzymes, and lipogenesis from tritiated water in rat liver. Biochim. Biophys. Acta 1986, 878, 200–208. [Google Scholar] [CrossRef] [PubMed]
  26. Sakaguchi, Y.; Sekiya, I.; Yagishita, K.; Muneta, T. Comparison of human stem cells derived from various mesenchymal tissues: Superiority of synovium as a cell source. Arthritis Rheum. 2005, 52, 2521–2529. [Google Scholar] [CrossRef] [PubMed]
  27. Mohamed-Ahmed, S.; Fristad, I.; Lie, S.A.; Suliman, S.; Mustafa, K.; Vindenes, H.; Idris, S.B. Adipose-derived and bone marrow mesenchymal stem cells: A donor-matched comparison. Stem Cell Res. Ther. 2018, 9, 168. [Google Scholar] [CrossRef] [PubMed]
  28. Woo, D.H.; Hwang, H.S.; Shim, J.H. Comparison of adult stem cells derived from multiple stem cell niches. Biotechnol. Lett. 2016, 38, 751–759. [Google Scholar] [CrossRef] [PubMed]
  29. Secunda, R.; Vennila, R.; Mohanashankar, A.M.; Rajasundari, M.; Jeswanth, S.; Surendran, R. Isolation, expansion and characterisation of mesenchymal stem cells from human bone marrow, adipose tissue, umbilical cord blood and matrix: A comparative study. Cytotechnology 2015, 67, 793–807. [Google Scholar] [CrossRef] [PubMed]
  30. Patrick, C.W., Jr. Adipose tissue engineering: The future of breast and soft tissue reconstruction following tumor resection. Semin. Surg. Oncol. 2000, 19, 302–311. [Google Scholar] [CrossRef]
  31. Entenmann, G.; Hauner, H. Relationship between replication and differentiation in cultured human adipocyte precursor cells. Am. J. Physiol. 1996, 270, C1011–C1016. [Google Scholar] [CrossRef] [PubMed]
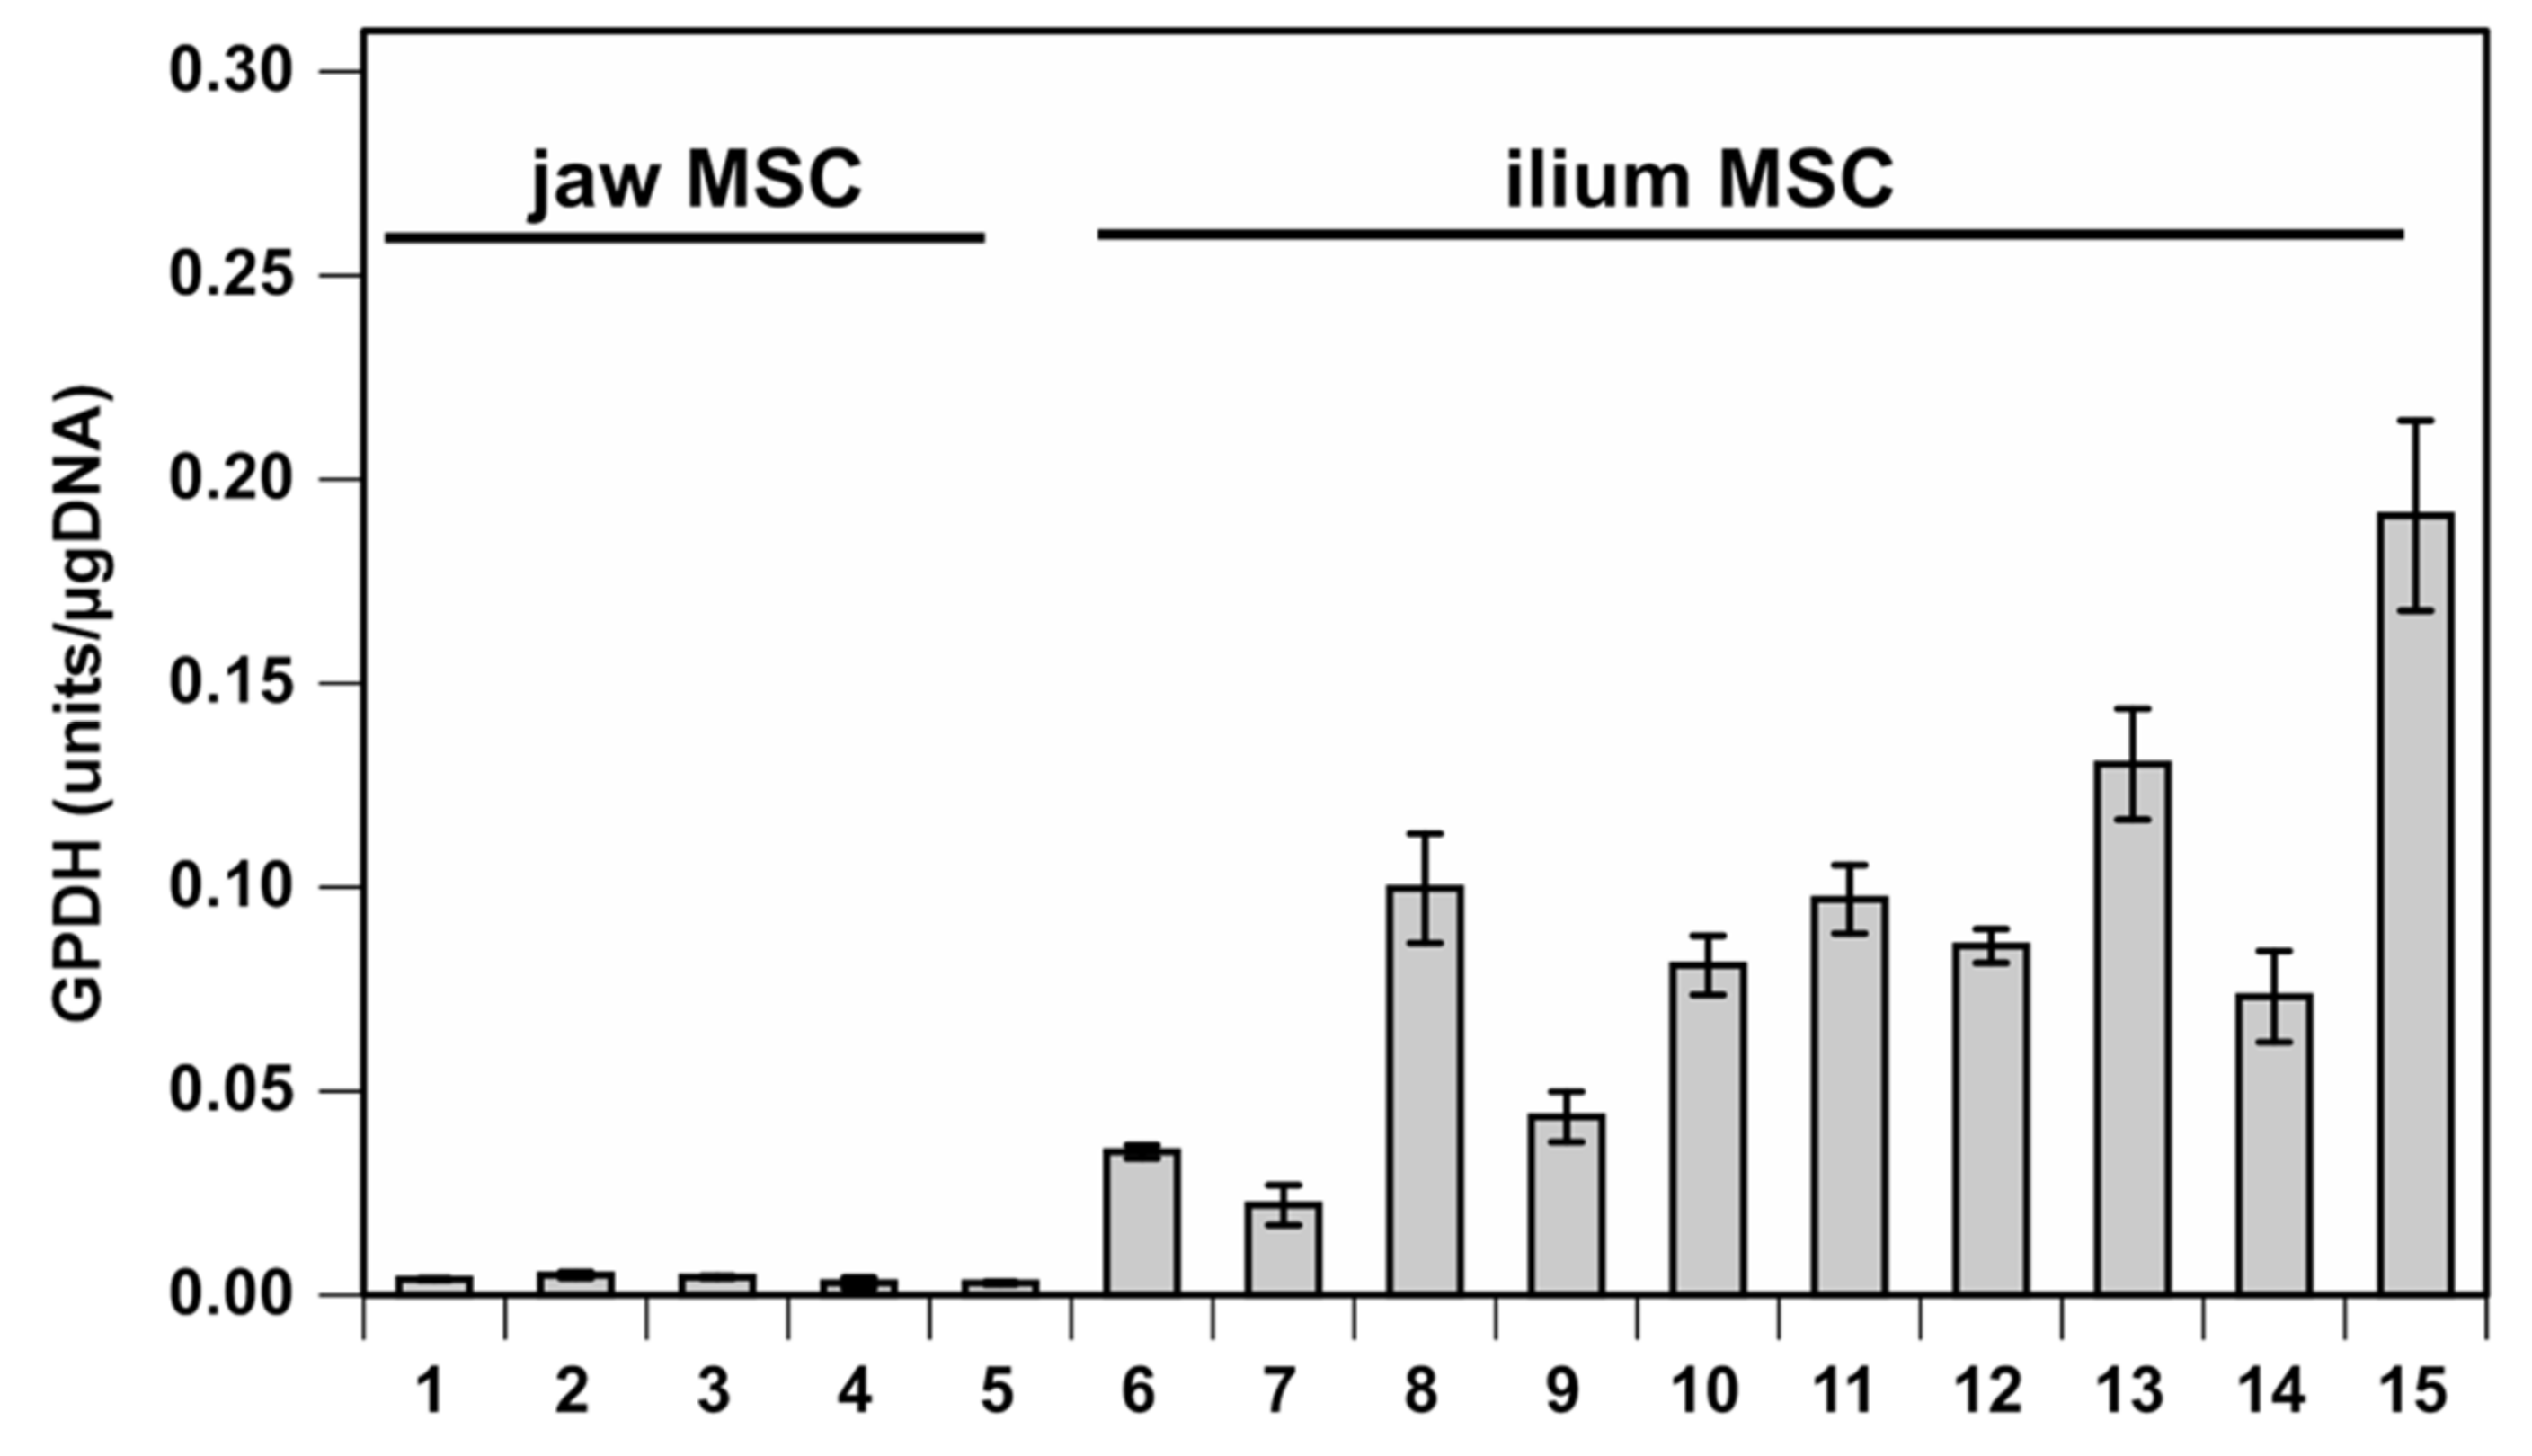
Figure 1. Adipogenic differentiation levels of bone marrow mesenchymal stromal cells (MSCs) evaluated by glycerol-3-phosphate dehydrogenase (GPDH) activity at 28 days after adipogenic induction. The activity was normalized using genomic DNA content to show means ± standard error (n = 3). 1–15, donor ID numbers; 1–5, jaw MSCs; 6–15, ilium MSCs.
Applsci 09 02942 g001
Figure 2. Three-dimensional (3D) scatter plots to analyze CDKN2D, ITGA5, and CD74 mRNA expression. (a) Using SPSS, the scatter plots showing expression levels of CDKN2D (x-axis), ITGA5 (y-axis), and CD74 (z-axis) were drawn. (b) Distances between the origin and each point of ilium MSCs (closed circles, 6–15) were compared with those of jaw MSCs (open circles, 1–5). Mean values are indicated by bars. Student’s t-test, *** p < 0.001.
Applsci 09 02942 g002
Figure 3. Effects of the anti-ITGA5 antibody on adipogenic differentiation of ilium MSCs. (a) MSCs were treated with the anti-ITGA5 or control IgG for 21 days during adipogenic induction and stained with oil red O (scale bar, 70 μm). (b) Oil droplet area was quantified by using ImageJ software. Data are presented as mean percent area ± standard error (n = 3). Student’s t-test, ** p < 0.01.
Applsci 09 02942 g003
Table 1. Candidate genes whose mRNA expression in MSCs before differentiation showing positive correlation with GPDH activities after adipogenic differentiation.
SymbolGene NameCorrelation (r)
ITGA5integrin subunit alpha 50.826 ***
MCAMmelanoma cell adhesion molecule0.812 ***
GPR37G protein-coupled receptor 37 0.782 **
PSMC5proteasome 26S subunit, ATPase 50.769 **
ACLYATP citrate lyase0.737 **
DNCI1dynein cytoplasmic 1 intermediate chain 10.732 **
P4HA2prolyl 4-hydroxylase subunit alpha 20.720 **
LIFleukemia inhibitory factor 0.708 **
ZNF185zinc finger protein 185 with LIM domain0.708 **
CDKN2Dcyclin dependent kinase inhibitor 2D 0.703 **
DPYSL3dihydropyrimidinase like 30.664 **
INPP5Einositol polyphosphate-5-phosphatase E0.650 **
UBE2Cubiquitin conjugating enzyme E2 C0.612 *
E2F1E2F transcription factor 10.608 *
CCNB1cyclin B10.598 *
CD74CD74 antigen0.561 *
COL7A1collagen type VII alpha 1 chain0.561 *
AURKBaurora kinase B0.556 *
AMD1adenosylmethionine decarboxylase 10.545 *
CDC20cell division cycle 200.526 *
SLC2A1solute carrier family 2 member 10.526 *
MCM7minichromosome maintenance complex component 70.517 *
r: Pearson correlation coefficient; * p < 0.05, ** p < 0.01, *** p < 0.001.
Table 2. Comparison of mRNA levels of candidate prediction markers between jaw and ilium MSCs before adipogenic induction. Relative mRNA levels means ± standard errors, n = 5 and n = 10 for jaw and ilium MSCs.
GeneRelative mRNA Levels
JawIlium
CDKN2D1.00 ± 0.1622.09 ± 4.09 **
CD741.00 ± 0.4118.02 ± 5.05 **
MCAM1.00 ± 0.6413.44 ± 2.94 **
DNCI11.00 ± 0.234.52 ± 0.61 ***
GPR371.00 ± 0.654.32 ± 0.83 **
P4HA21.00 ± 0.434.31 ± 0.91 **
ACLY1.00 ± 0.154.14 ± 0.49 ***
SLC2A11.00 ± 0.173.78 ± 0.44 ***
ITGA51.00 ± 0.133.72 ± 0.42 ***
LIF1.00 ± 0.393.66 ± 0.53 **
AURKB1.00 ± 0.263.09 ± 0.70 *
E2F11.00 ± 0.122.38 ± 0.40 **
COL7A11.00 ± 0.232.21 ± 0.42 *
UBE2C1.00 ± 0.202.15 ± 0.45 *
CDC201.00 ± 0.232.02 ± 0.40 *
PSMC51.00 ± 0.081.98 ± 0.31 *
MCM71.00 ± 0.101.81 ± 0.27 *
INPP5E1.00 ± 0.241.79 ± 0.26 *
ZNF1851.00 ± 0.061.79 ± 0.69
CCNB11.00 ± 0.161.69 ± 0.36
DPYSL31.00 ± 0.171.35 ± 0.16
AMD11.00 ± 0.111.22 ± 0.16
Student’s t-test; * p < 0.05, ** p < 0.01, *** p < 0.001.