1. Introduction
There has been a huge change in production systems and, specifically, in sectors such as energy, Information Technology and Communications (ITC), and transport over recent years. The basis of these changes is the development of the silicon industry, which, by introducing electronic components, has made an impressive breakthrough in all sectors, from process control to computing.
These new products are based on the consumption of previously unused material; therefore, new challenges have arisen in the identification, the extraction, and the use of elements that were virtually unknown until now [
1,
2]. The most significant case is the development of the group known as rare-earth elements (REEs), which were virtually unknown and underused until a few decades ago. However, currently, rare earths are a basic element for the development of mobile batteries or vehicles [
3], computers and electronic equipment [
4], energy-efficient lighting [
5], fluorescent lamps [
6], aerospace and military applications [
7], permanent magnets [
8], refined fuels, glasses, eyeglasses, lasers [
9], and even wind turbine blades [
10,
11,
12].
The REEs are sought after in both mature and stable markets, including metallurgy, lighting, glass manufacturing, catalysts, etc., which occupy 41% of global consumption [
13,
14,
15], as well as growing emerging markets (alloys for batteries, permanent magnets, etc.) [
16,
17,
18,
19].
REEs are present over practically the entire globe. Nevertheless, it is very difficult to find them at levels with a sufficient concentration to be technically and commercially exploitable. The rapid growth of this market has created a demand that far exceeds the supply, which is highly centralized in only a few mines and countries and consequently entails a strategic risk as well as a supply shortage [
7,
20,
21,
22,
23]. This risk has already been reflected in serious problems for some of the best-known international companies such as Hitachi, Samsung, and Apple, which have moved their factories to China, the main supplier, causing a bottleneck in the distribution chain. China has limited exports and only allows 39,800 tons, less than 10% of the total. Moving factories to China guarantees the constant supply of rare earths for these companies.
Western countries concerned about this strategic dependence have taken steps to try to solve the problem and to at least identify resources that could be exploited if needed. Among these actions is the search for new sources to obtain these elements. Finding new sources of supply that are widely distributed worldwide will reduce the strategic risk and secure the freedom of opportunities in terms of access to such materials.
On the other hand, in the most developed countries, a strategy of minimizing the extraction of materials in order to ensure sustainability is proposed. The possibility of using waste to obtain this type of material would be a step forward in the commitment of care to the planet adopted in the summits of Rio and Paris [
24,
25] following the concept of the circular economy [
26], which pursues two goals—reducing the generation of waste as far as possible and making efficient use of those wastes for which their generation has not been avoided. In this way, the available resources, both material and energy, are optimized so that they remain in the production process for as long as possible [
27]. According to the International Union of Pure and Applied Chemistry (IUPAC) [
28], the rare earths are a set of 17 elements, 15 of which are transition metals belonging to the lanthanide group (which comprises the chemical elements from lanthanum to lutetium in the periodic table); the two elements left are scandium and yttrium, which have similar physical and chemical characteristics and are usually found together in nature [
7,
14,
29].
Gambogi, J [
15] identified the REEs in two groups:
LREEs are light rare earth elements, also known as the cerium group: scandium (Sc), lanthanum (La), cerium (Ce), praseodymium (Pr), neodymium (Nd), promethium (Pm), samarium (Sm), europium (Eu), and gadolinium (Gd).
HREEs are heavy rare earth elements, also known as the yttrium group: yttrium (Y), terbium (Tb), dysprosium (Dy), holmium (Ho), erbium (Er), thulium (Tm), ytterbium (Yb), and lutetium (Lu).
Occasionally, some of the heavier LREEs and lighter HREEs are placed in a separate group named MREEs (middle rare earth elements) [
30,
31].
In mature markets, lanthanum and cerium represent 80% of the REEs. In the case of new markets, dysprosium, neodymium, and praseodymium make up 85% of the rare earths consumed [
13,
18].
Despite the name, which may suggest that rare earths are rare and scarce, the abundance of REE in the Earth’s crust is high, with the exception of promethium (Pm), which is only found as a by-product of the nuclear fission of uranium. The remaining elements are found in nature, although they can also be obtained synthetically in a laboratory.
The abundance of REEs in the Earth’s crust can be considered to be about 220 ppm, which is higher than the abundance, for example, of carbon (200 ppm) [
32].
Table 1 shows the concentration in ppm of rare earths in the Earth’s crust according to the most representative works [
33,
34,
35,
36,
37,
38,
39].
For comparison, some of the REEs, such as cerium, neodymium, and yttrium, are much more abundant than lead. Thulium, which is the scarcest element of this group, is up to 200 times more abundant (~0.5 ppm) than platinum or gold [
40,
41].
Although their presence in the crust is high, their concentration in the form of deposits is low and less common than most minerals [
42], jthus it is rare to find large enough mineral deposits to make their extraction by conventional mining methods financially feasible [
43,
44]. Rare earths do not occur in nature in an elemental form but are present in four geological environments: carbonates and alluvial deposits, which are the main source of production of LREEs, and alkaline igneous systems and deposits of ionic absorption clay, the main source of production of HREEs [
42]. Their affinity for oxygen makes them appear as oxides, although other combinations are also possible [
33]. The main minerals are monazite, bastnasite, xenotime, gadolinite, apatite, and zircon. Approximately 95% of REEs are found in the first three minerals [
32].
Bastnasite, (La,Ce)CO3F, is a fluorocarbon rich in cerium and low in heavy REEs. It is found in metamorphic zones and pegmatites.
Monazite, (Ce,La, Nd,Y,Th)PO4, is an orthophosphate of REEs and thorium. Approximately 70% of its composition comprises oxides—between 20% and 30% of them are Ce2O3, between 10% and 40% are La2O3, and 5% are Y2O3. The remaining elements comprise a significant presence of Nd, Pr, and Sm, as well as Dy, Er, and Ho in lower amounts. The thorium content ranges from 4% to 12%, and there is often some uranium present. Its deposits are acidic igneous and metamorphic rocks found as detrital mineral deposits in coastal and beach sands.
Xenotime, YPO4, is an yttrium orthophosphate with a concentration between 54% and 65% of HREE oxides, 1% LREEs, 3% ThO2, 3% U3O8, and between 2% and 3% ZrO2. It is present in the same type of deposits as monazite, but it is much less abundant, with mixed deposits in which the content of xenotime between 0.5% and 5%.
Table 2 displays the reserves according to the most reliable sources [
32,
42,
45,
46]. It can be seen that there are differences between sources on similar dates; for example, in data corresponding to China, India, and Russia reserves. These deviations arise since there is no global system of classification of reserves; on the contrary, each country has its own definitions to determine the difference between reserves and contingent reserves, which makes them difficult to compare.
Until the 1970s, the production of REEs was testimonial. However, the development of electronics increased the production of such metals. In the mid-1980s, China started trading rare earths, taking advantage of the fact that they were a by-product in some of its most bulky iron ore deposits [
14]. China’s entry into the market of REEs eventually affected the rest of the world’s production, since the lower wages of their workers and the lower levels of environmental control increased its competitiveness. In 2011, China was producing 97% of world’s REEs [
47,
48,
49]; however, this had decreased to 80% in 2017 [
42].
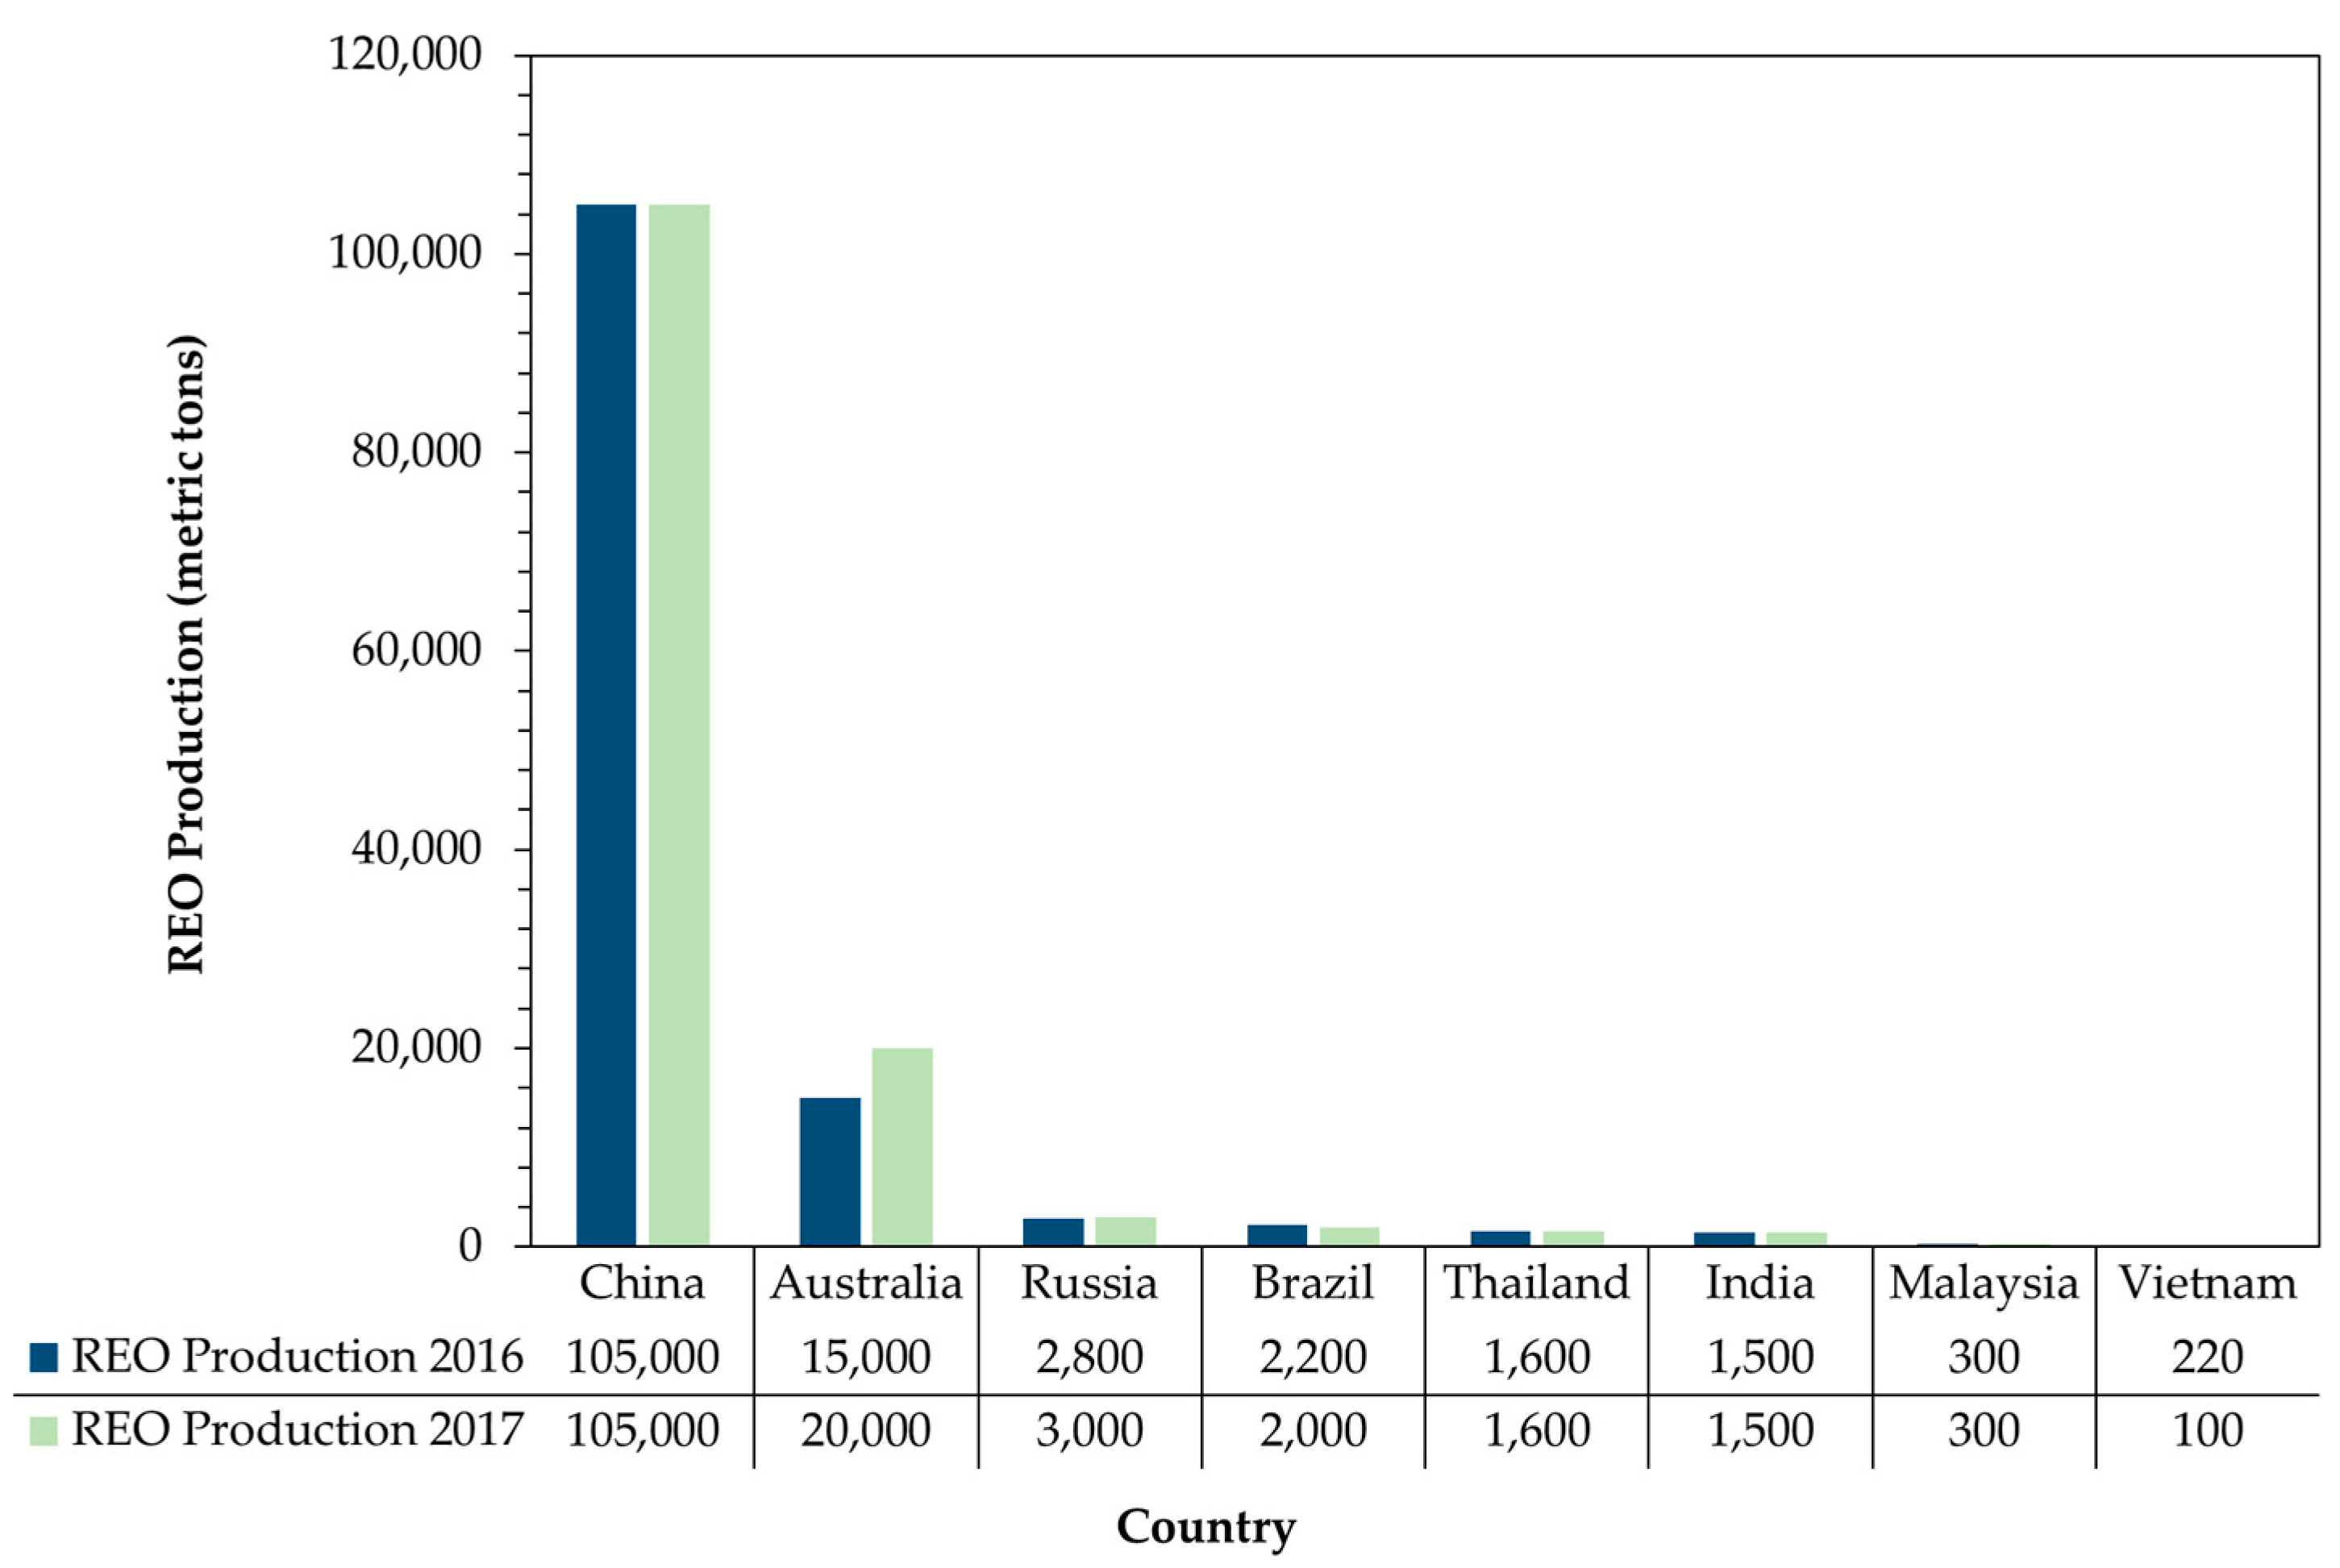
Figure 1 shows the current situation of the market [
42]. China retains the dominant position, and their production levels did not vary between 2016 and 2017; however, Australia and Russia have increased their production of REEs.
By September 2017, Chinese exports had grown 10% compared with the same period in 2016, and its consolidation into the six major industrial entities continued [
32]. Market forecasts imply that the findings of new deposits along with new techniques of recovery, recycling, and reuse of REE will enable world production to continue increasing.
Given the booming market for REEs and the future forecasts that report a significant increase in demand, which is estimated to reach 6% per annum (p.a.) for 2020 [
50], as well as their specific function, alternative sources will be essential in the future [
2,
51,
52,
53,
54,
55,
56,
57,
58,
59]. In particular, waste mining can be an adequate source in many ways. On one hand, they are materials that have already been extracted and concentrated in all elements except in those that were the objects of exploitation, which increases the relative percentage of the rest. On the other hand, they are already separated from their matrix structure and have undergone frequent milling and crushing, meaning that these energy-intensive stages have been previously performed. They are also materials that are accumulated in landfills and are consequently causing harm to the environment. Their use does not create an environmental problem but rather can be part of its solution.
In the case of iron mining, an extra factor is also added—the majority of oxides exist in iron sources with similar structures to those of rare earths. These extremely abundant waste products are difficult to treat [
60,
61].
A very interesting example of REE tailing ponds in the case of iron ore mining is taking place in the Bayan Obo Inner-Mongolia Mine (China). This polymetallic iron–niobium–REE deposit, in addition to other elements of interest [
62], has been in operation since 1927, and the main activity of the mine has been the exploitation of iron ore that contains up to 6% rare earth oxides (REO) and 35% Fe. About 4–7% of the total REEs are disseminated in iron oxides, with 90% occurring as independent REE minerals [
2]. The separation techniques of these REEs carried out in recent decades have been low-intensity magnetic separation and high-intensity flotation and magnetic separation [
63,
64]. Although many studies have been developed into possible recovery techniques [
65,
66,
67,
68], currently, the recovery of REEs in this exploitation is very inefficient. The deposit is mainly exploited for its iron ore, and only about 10% to 15% of the rare earth content is recovered; due to this low percentage, the average REE law of tailing has been increased from 6.8% to 8.85%, close to the grade of raw ore [
63]. The rest are stored in tailing dams as a secondary resource, causing pollution and environmental risks. The generation of tailings from iron mining has been increasing in recent years, reaching an output of more than 500 million tons in 2015 [
69] due to the recent growth of the steel industries that generate this type of waste during the beneficiation process of iron ore concentrate. The same problem that occurs in Bayan Obo is common in other mining facilities. Although a wide range of methods for iron recovery from the iron ore tailings have been developed [
70,
71,
72,
73], in practice, these processes create new waste streams [
70], making these inefficient. In addition to this, some authors have highlighted the low ratio of reuse of tailings, the poor knowledge of treatment technologies, the paucity of supporting data, and the low political and economic support in China’s industry [
71].
The aim of this work is to analyze the effects of iron ore beneficiation on the concentration of rare earths. For this purpose, three samples of iron tailings from different deposits and treated by different technologies were collected. Once its content in REE was known, the feasibility to use its tailings as a strategic reserve of rare earths was evaluated. The effects of the concentration can redistribute the generally low presence of REE in both fractions (ore/tailing), creating an enriched material that has been previously processed. Considering the distribution of iron ore mining and the size of the tailings, this approach would reduce the need for new mines, save energy from crushing, and avoid landfilling new tailings of REE beneficiation.
2. Materials and Methods
For the purpose of assessing the feasibility of iron ore mining as an alternative source of REEs, some representative samples were collected from different origins to increase the generalization. Iron ore and tailings from magnetic separation and flotation were collected from mines with the following iron ore deposits:
Type 1: Skarn deposits in which magnetite and martite ore form the iron mineralization; in some areas, the skarn and the metamorphic rocks are associated with hydrothermal deposits. Mineralization is located in zones of fractures or cracks and filling faults;
Type 2: Sedimentary deposit with a high grade of hematite ore in some areas. The mineralization is composed by grains of quartz and iron in the form of hematite, magnetite, or martite.
In order to consider the influence of the process, tailings from the same iron ore deposit (type 1) treated by flotation and roasting and magnetic separation were evaluated.
The material under study is a mineral with a majority hematite content of around 38.7% with impurities of Al2O3, CaO, MgO, and SiO2. Despite hematite having a wealth of iron (70%) in its pure state, in the samples, this decreased to 58% due to the gangue (formed by silicates and with low phosphorus content).
The process was the following:
Samples were collected according to the UNE EN 932-1:1997 standard [
74]. The minimum mass of the gross sample was calculated according to the following equation:
where
M is the mass of the sample in kilograms,
D is the maximum grain size in millimeters, and
ρb is the apparent density in megagrams per cubic meter.
For the flotation tailings with a maximum diameter of 32 mm, the mass of the sample in kilograms was 58.38 kg. In the case of the magnetic separation of tailings with a maximum diameter of 4 mm, the mass was 20.64 kg.
Samples were piled and excavated with a shovel in three places at different positions to extract fractions of similar size at the deepest point of each hole. Each sample was mixed in a cone three times to guarantee size heterogeneity. Finally, the last cone was quartered alternatively, producing three samples of the weight previously calculated.
Samples were treated by drying for 48 h and milled to levels higher than −10 mesh. Then, they were analyzed by inductively coupled plasma mass spectrometry (ICP-MS) [
75]. The mass spectrometer used consists of inductively coupled plasma (ICP) as the ionization source and a dual-focus mass analyzer. The model used in this work was the ELEMENT 2 (Thermo Elemental, Bremen, Germany) [
76], which offers the possibility of using the equipment in three different resolutions: low m/Dm = 300, medium m/Dm = 4000, and high m/Dm = 10,000. The medium- and the high-resolution allows the elimination of polyatomic interferences that could affect the precision of the results.
A daily adjustment of the instrumental parameters of the equipment was made through the control program, optimizing the torch position in vertical and horizontal directions and the argon flow of the carrier gas in order to reach the maximum signal for Li, In, and U. The values of these parameters are described in
Table 3 and
Table 4.
Table 5 shows the parameters used for the measurement. It is recommended to select at least 10 points per peak to ensure its correct definition, with 20 points being optimal. This increase resulted in the selection of 0.05 s of integration time per peak in order not to lengthen the total measurement time. Measurements were done at a medium-resolution power (R = 3000) to physically separate the ions of interest from possible polyatomic interferences.
For the digestion of the samples, a portion of each was treated with a mixture of HNO3/HCl, and microwave digestion was carried out (ETHOS One, Millestone SRl, Italia). The result of digestion was made up to the volume with ultrapure water.
For the measurement of rare earths in the ICP-MS, the quantification was carried out with acid calibration (HNO
3 1%
v/
v) using indium (In) as the internal standard to compensate possible fluctuations in the plasma during the measurement and possible matrix effects. Rare earth element solutions were prepared in increasing concentrations, and In was added as an internal standard to achieve a final concentration of 10 ppb. This element was chosen because it is relatively close in mass to the elements of interest. Elemental patterns of 1000 µg/mL according to CPAchem [
77] were used.
Table 6 exhibits the codes and the characteristics of each of the samples relating to the type of material, the generation process, and the type of iron ore deposit.
In this way, it was possible to make three comparisons: firstly, studying the efficiency differences between the ore and the tailing; secondly, between the two types of tailing; and finally, considering two types of deposits or origins of the waste.
3. Results and Discussion
Values were obtained from solutions with concentrations in the range of ppm of 14 elements corresponding to REEs: La, Ce, Pr, Nd, Sm, Eu, Gd, Tb, Dy, Ho, Er, Tm, Yb, and Lu. There was no possibility of analyzing Y and Sc, since no patterns of these elements were available, and Pm was discarded since it does not exist in nature but only as results of atomic processes. From the analysis of the five materials, the average values found in the samples are shown in
Table 7.
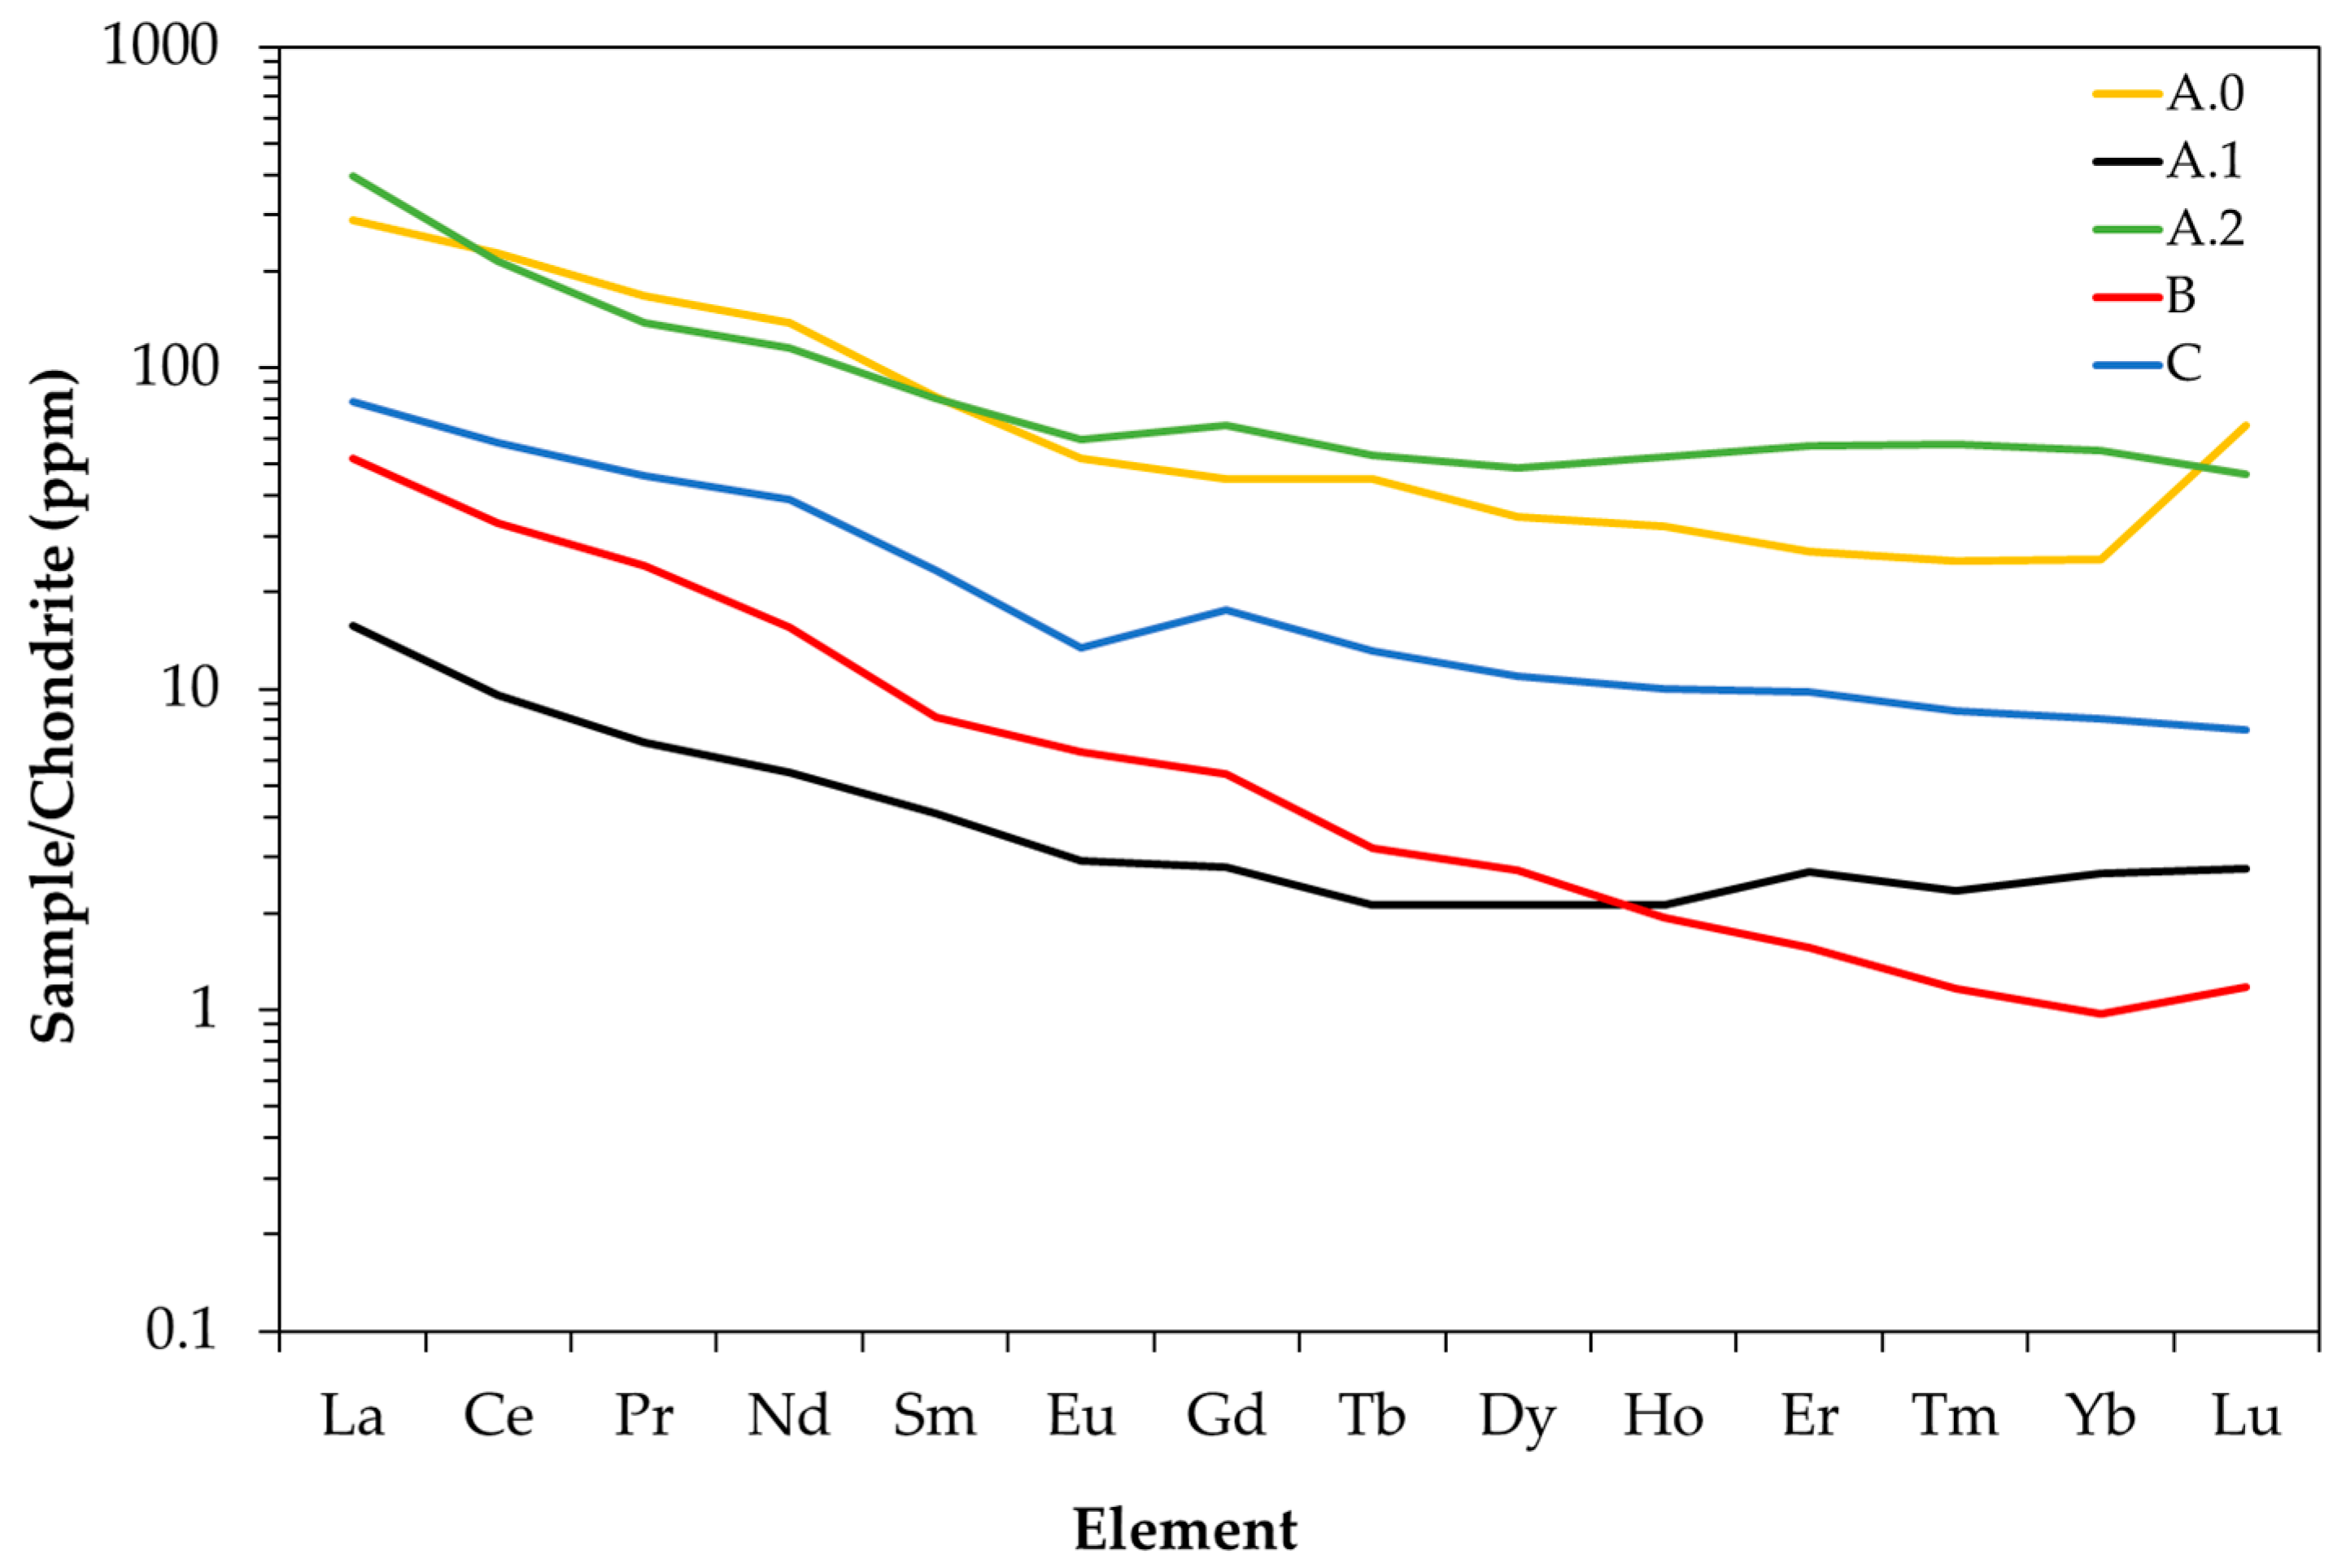
In
Figure 2, a chondrite-normalized plot [
78] indicates enriched light REE patterns in all the samples. Samples had a negative Eu anomaly, with Eu/Eu * < 1 highest in sample C, a depression that often characterizes a reducing environment [
79]. A.2, corresponding to magnetic separation tailings, was always higher in light REEs than A.1, B, and C, and only inferior to A.0 in terms of the amount of HREEs.
Table 8 compares the concentration of each rare metal in the earth crust with the samples of ore (A.0) and the flotation tailing (A.1) from the same treatment. Flotation tailings have lower proportions than the Earth’s crust, indicating that most of the content remains in the concentrated ore. The enrichment factor presents the ppm of the element in the ore relative to the ones present in the Earth’s crust.
As ore concentrates most of the REEs, it could be an alternative as a base element in the production of rare earths, specifically LEEs such as Pr, Ce, and Eu. The use of ore concentrate for the extraction of rare earths must be evaluated, as it has a higher value as a source of iron. However, it would be interesting to monitor the behavior of rare earths throughout the iron and steel process to check their distribution in the liquid steel or the different wastes generated (slag, sludge, etc.).
Table 9 compares concentrations in the different tailing analyses and a mean value in the bastnasite and the monazite minerals of each element. The values in bold indicate the highest content in each element among all the materials collected. In terms of these values, the last column has the proportion of the highest content in each element for the materials studied with respect to the minimum required for bastnasite or monazite to be exploitable; for example, in the case of magnetic separation tailing A.2, the percentage of Eu obtained in the flotation tailings waste ore was 24.65% of the total Eu contained in monazite ores and 11.90% of the total REEs obtained from bastnasite ores.
None of the proportions found in the five cases exceeded the exploitable concentrations in nature for the minerals bastnasite and monazite; therefore, it was not immediately feasible to recover them. However, depending on the cut-off laws and the ore price, the process may be feasible.
Regarding the analyzed samples, tailings A.2 and ore A.0, both from the same iron ore deposit, were the most favorable for possible exploitation, depending on the future REE market development.
Comparing the ore from which the flotation tailings were obtained with magnetic separation tailings, the quantity of REEs was at least 6x greater in the magnetic tailings, which made the quantities of many elements in flotation tailings irrelevant by comparison.
Sample A.2 had approximately a quarter of the concentration of europium and gadolinium in relation to that which was exploitable for monazite. These were the highest concentrations of all the samples in relation to the levels of exploitation. Europium is one of the most critical REEs and is quoted in the markets at
$38.83 per kg in the oxide form. Gadolinium’s price is
$20.31 per kg; it has a large market since it is one of the REEs that has the most applications [
80].
REEs from tailings are not a viable alternative, except for those from magnetic separation tailings, where the recovery of rare earths would not only be technically feasible but would also have a great positive environmental impact by helping to reduce the volume of waste and pollution linked to it. The potential impact of this waste on the market depends on its availability to cover significant shares. In the treatment of iron ore, every ton of iron processed generates an estimated average of 360 kg of tailings. In the last 10 years, approximately 23,590 million tons of iron have been extracted worldwide [
42], thus there are about 8492 million tons of stored tailings available as a possible source of REE recovery [
81]. Taking sample A.2 as a reference of tailing concentrations as the most plausible for commercial exploitation (
Table 10), the total amount of REEs contained in roasting and magnetic separation tailings is estimated to be 3.14 million tons of REEs worldwide over 10 years (an average of over 300,000 tons per year). The estimation implies an amount much higher than the annual production (130,000 tons of REEs in 2017). Proven reserves of REEs in 2017 were 120,000,000 tons, therefore the amount of REOs deposited on these residues is equivalent to 2.62% of world reserves [
42].
Since there are no significant differences in composition between the current ores and the residues covered by this study (beyond the percentages that do not alter the conditions of production of rare metals, which always appear to be associated with such oxidic matrices), there seem to be no technical barriers that restrain their exploitation. Therefore, the technical feasibility of the benefit of iron mining waste is guaranteed, but it is always tempered by the financial viability.
In order to compare economic feasibilities, the cost of mine-opening as well as maintenance and operation must be added to costs related to the handling of the waste produced once the activity of the mine is established, such as storage fees, treatment processes, landfill inertization, etc.
On this basis, and contextualizing the analysis of the waste market, it appears that the chances of obtaining REEs as a by-product of the tailings would bring about a new, profitable business. These tailings ponds must be monitored and controlled for decades due to the high pollution levels they produce, considering the economic cost that this entails. Therefore, if there are more than three million tons of REEs among this debris, the prospect that it contains REEs gives new added value to the businesses that generate them.
With these data, it is evident that waste is a great potential source that is generated continuously and offers enormous potential for exploitation. Therefore, it must be considered, especially in the future context of increases in emerging technology markets.
As a result, the recovery of REEs would not only be technically feasible but would have a substantial positive environmental impact by helping to reduce the volume of waste and pollution associated with them. This recovery would apply the principles of the circular economy, evaluating the opportunities around tailing valorization [
82], since materials and substances are recovered from the waste generated that turn it into a potential raw material [
83].
4. Conclusions
The production of REEs is a problem identified by authorities of every developed country due to its high consumption and monopolistic character. Because of this, industrial waste can be an interesting source for the recovery of the REEs contained within it, given the scarcity of minerals that possess these elements.
Upon analyzing the most suitable materials from iron mining, it was observed that after a flotation process, REEs were found in higher proportions in the ore than in the tailings. Considering that REEs do not appear in the composition of steel, as the major product of the steel industry, this indicates that their presence must be considered in some of the waste from the iron and steel process, such as slag or sludge.
The rest of the tailings analyzed showed that, except in the process of magnetic separation, the tailings resulting from iron mining did not cause a concentration of rare earths; on the contrary, they presented an impoverishment regardless of their origin. Only those from magnetic separation or roasting produced enrichment.
The analysis of the ore concentrate from the deposit showed that the enrichment moved from the ore to the tailings as the materials became heavier, thus the tailings produced over-concentrations of HREEs.
In summary, it was observed that the REE contents in these tailings were, on average, 1/10 ppm below those of the minerals. Although this quantity may seem prohibitive, it must be considered that the tailings are already prepared directly for loading and concentration, while in the exploitation of minerals, the waste/ore ratio must be considered, which in many cases is less than 10%. It is also necessary to consider the grade of the mineral itself. Although it is true that the process of concentration is more complex, it is evident that there is a pre-concentration of certain interest as a strategic reserve. This, combined with the positive environmental viability and the avoidance of the ongoing cost of storage, makes them the largest source of contingent resources of REE, as in the last 10 years, this waste has accumulated an amount of more than three million REEs, equivalent to 2–3% of the world’s proven reserves.
In order to assess its viability, not only must economic and financial aspects be taken into account, but it would be interesting to assess the Life Cycle Analysis (LCA) of the operation of REEs from these wastes in order to ensure that the process is environmentally positive.
For this evaluation, a study of the rare earth cycle would be carried out throughout the steel production process, from the first stage of extraction in the mine until the final product is obtained. In the different phases, thermal, physical, and chemical treatments are produced, causing enrichment and impoverishment of these elements in the streams of materials, including waste, in which it would be necessary to determine the best time for their extraction.
The recovery of REEs from these wastes can be economically feasible if the need for a material as well as its strategic viability allows novel techniques to emerge. If these techniques focus on the recovery of a particular element, extraction would be profitable.

 ,
, 
