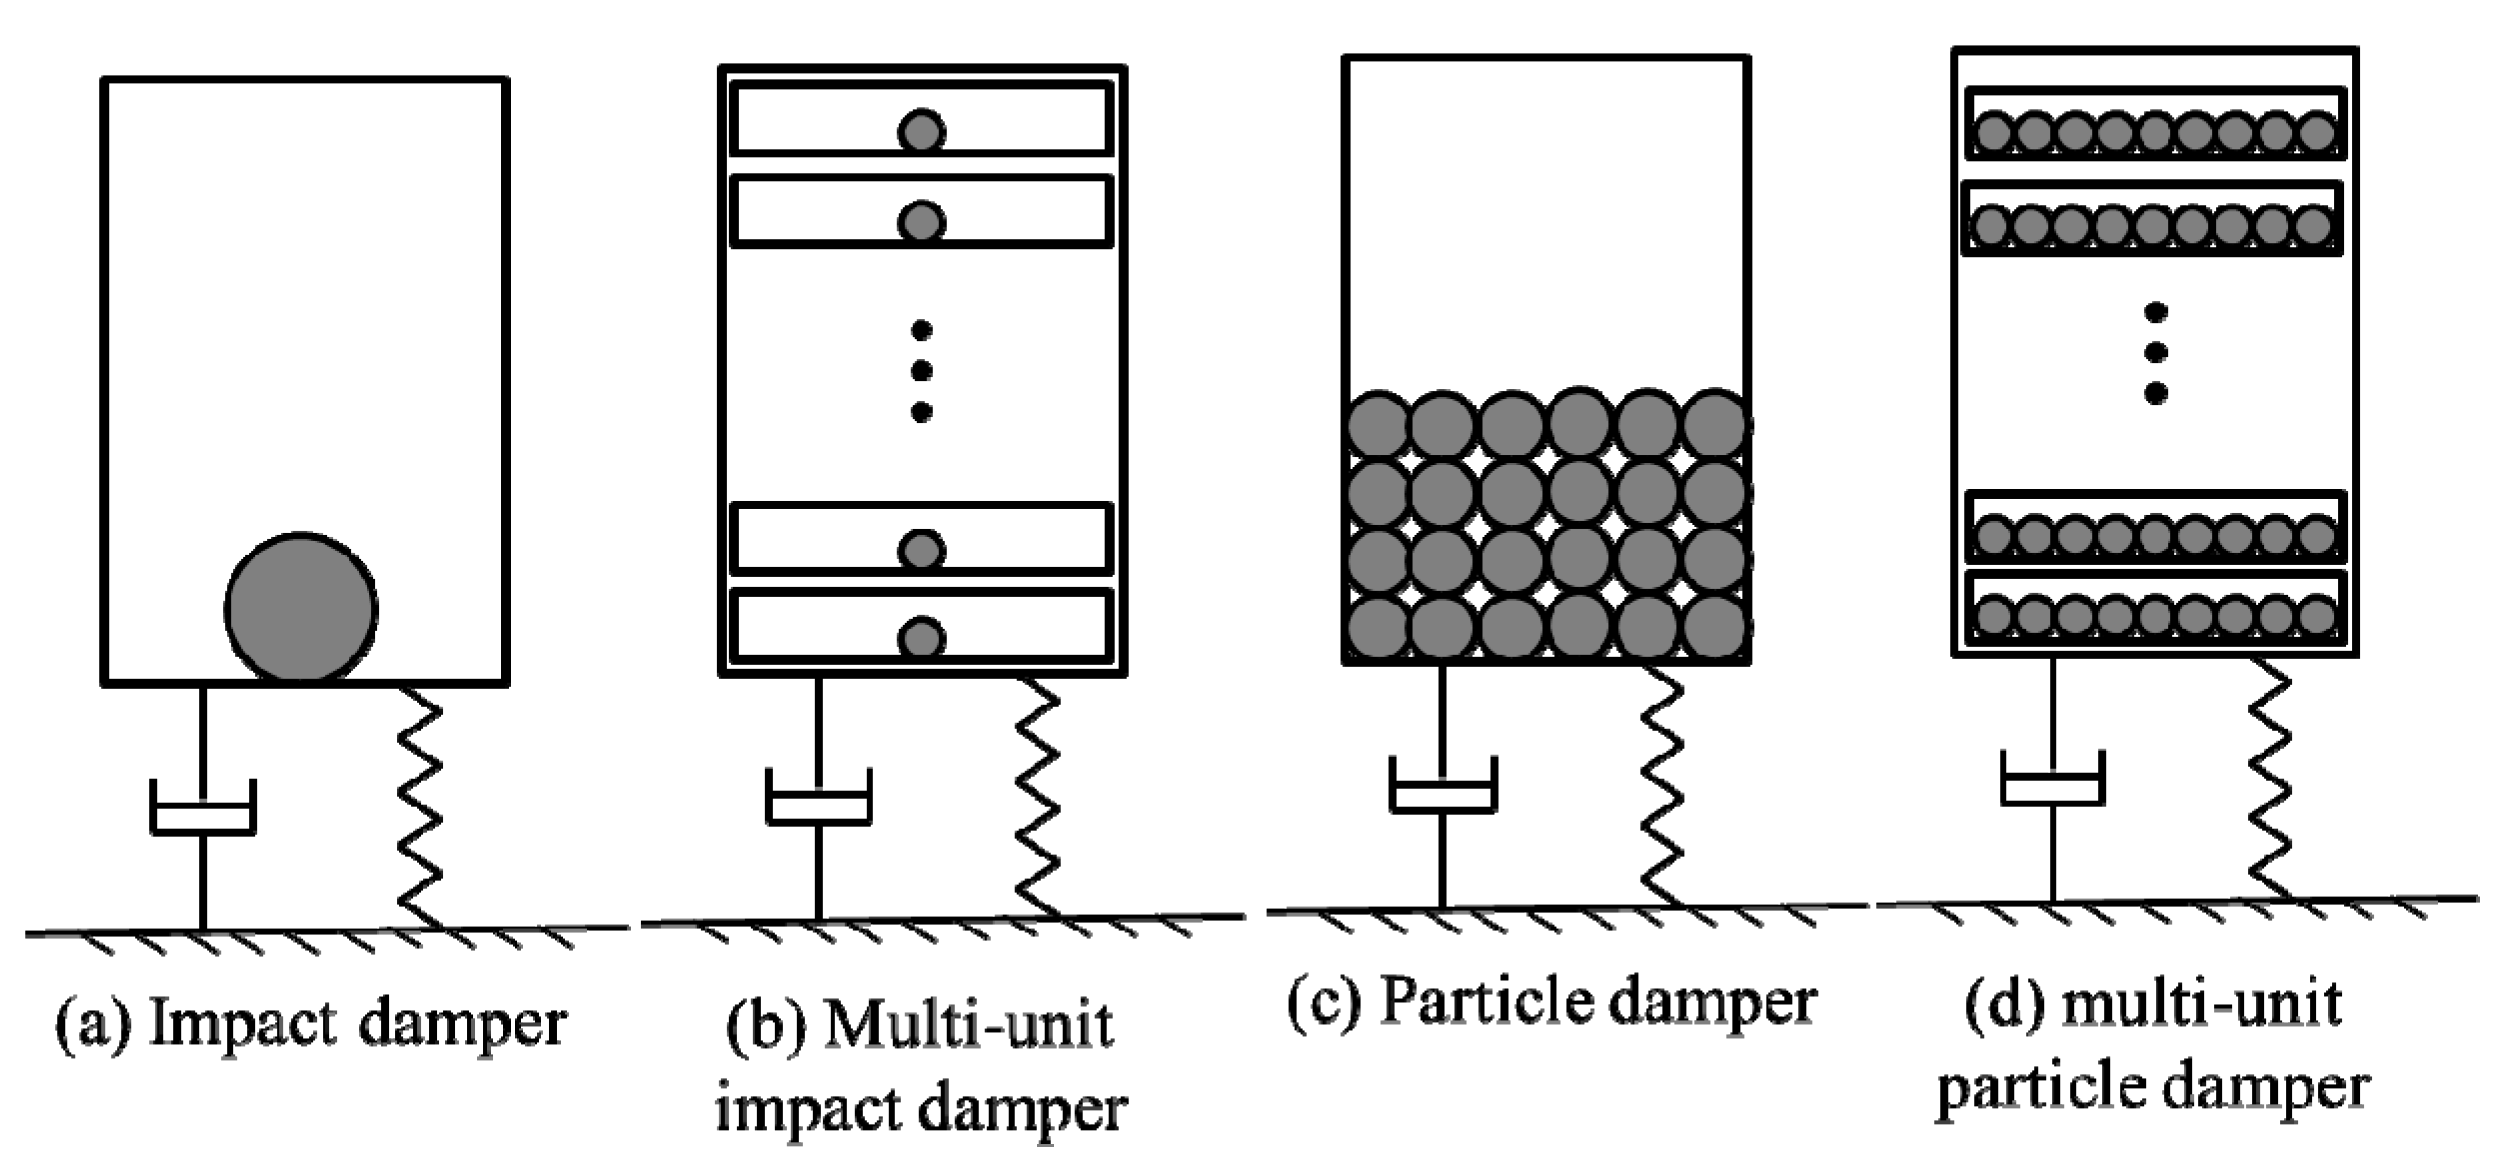
Figure 1.
Classification of particle dampers.
Figure 1.
Classification of particle dampers.
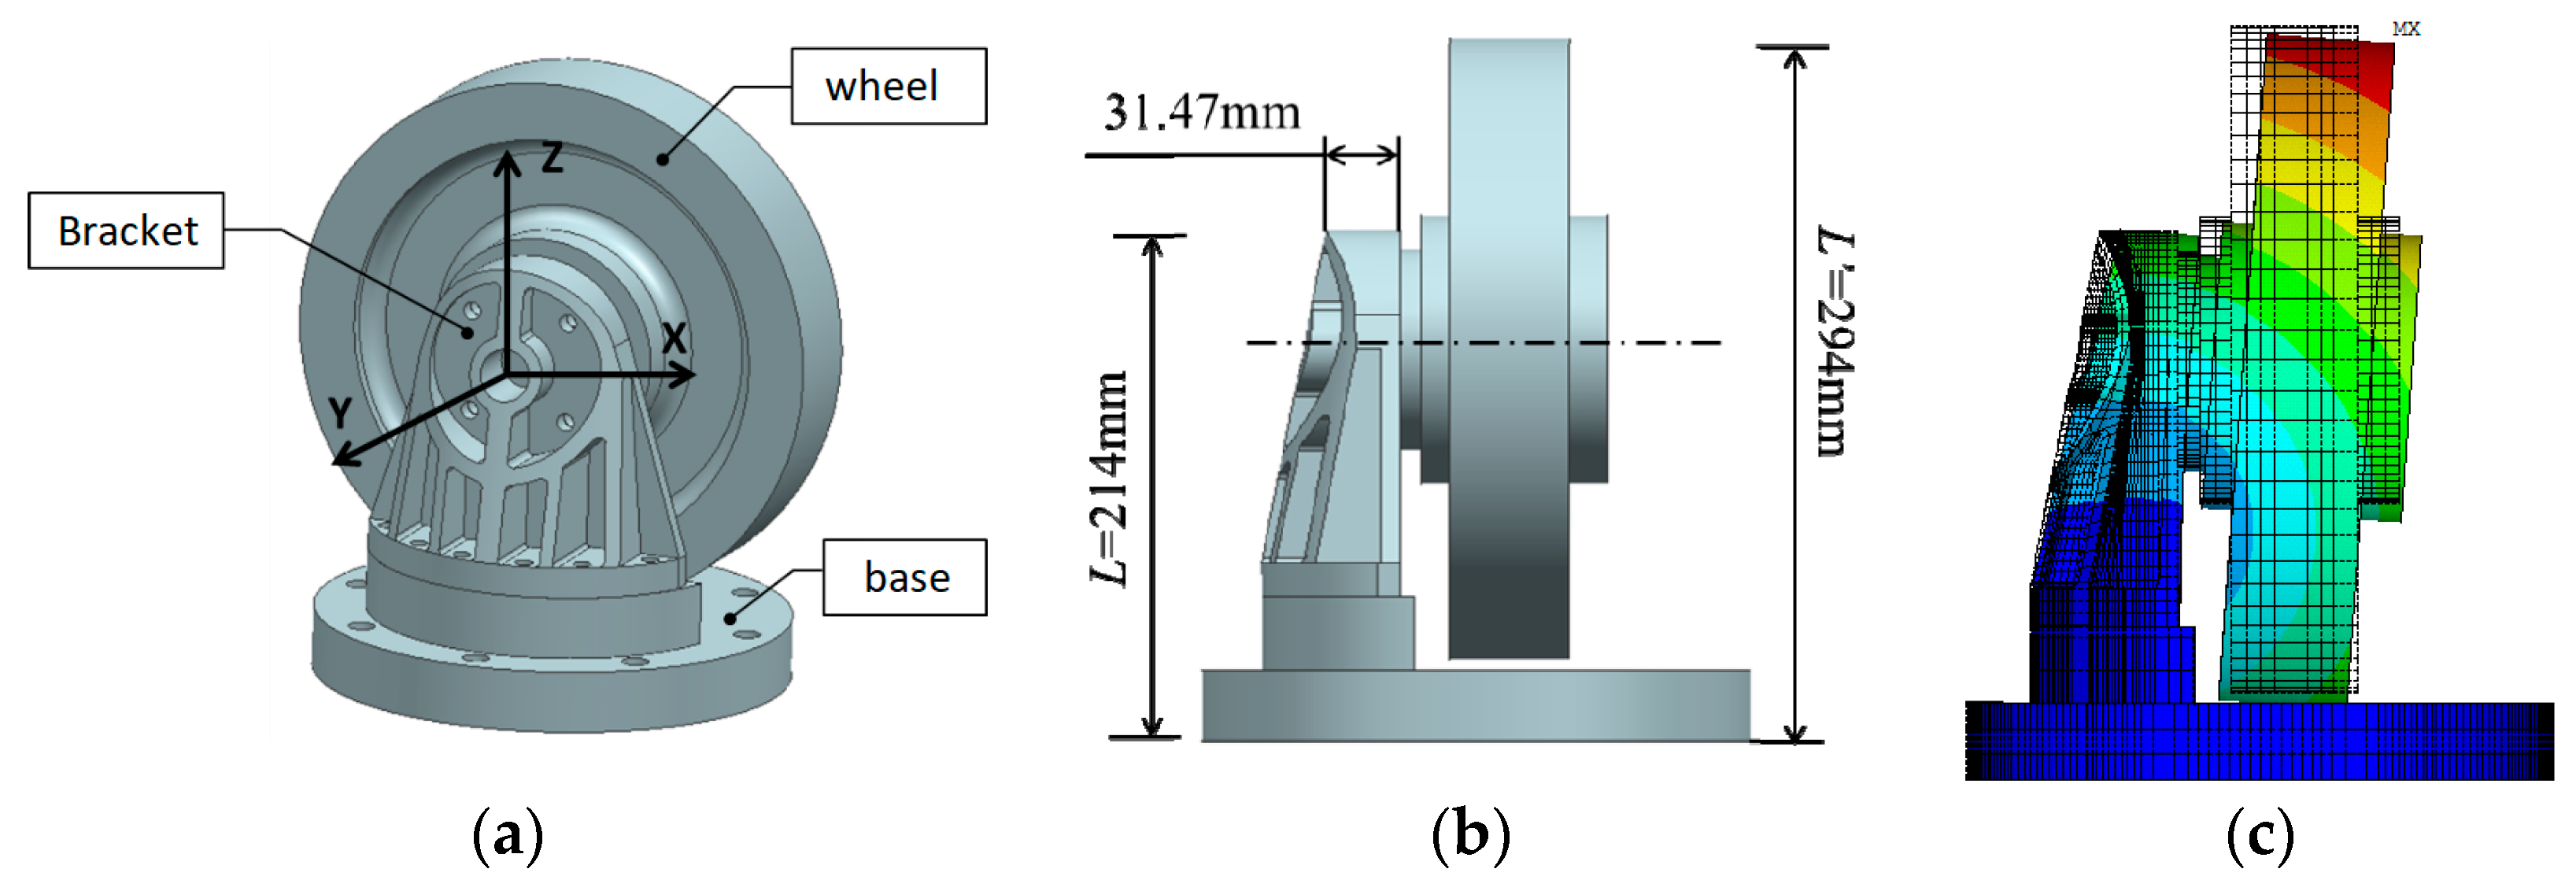
Figure 2.
Test structure (a) coordinate definition and component name; (b) structure size; (c) fundamental mode shape of the primary system.
Figure 2.
Test structure (a) coordinate definition and component name; (b) structure size; (c) fundamental mode shape of the primary system.
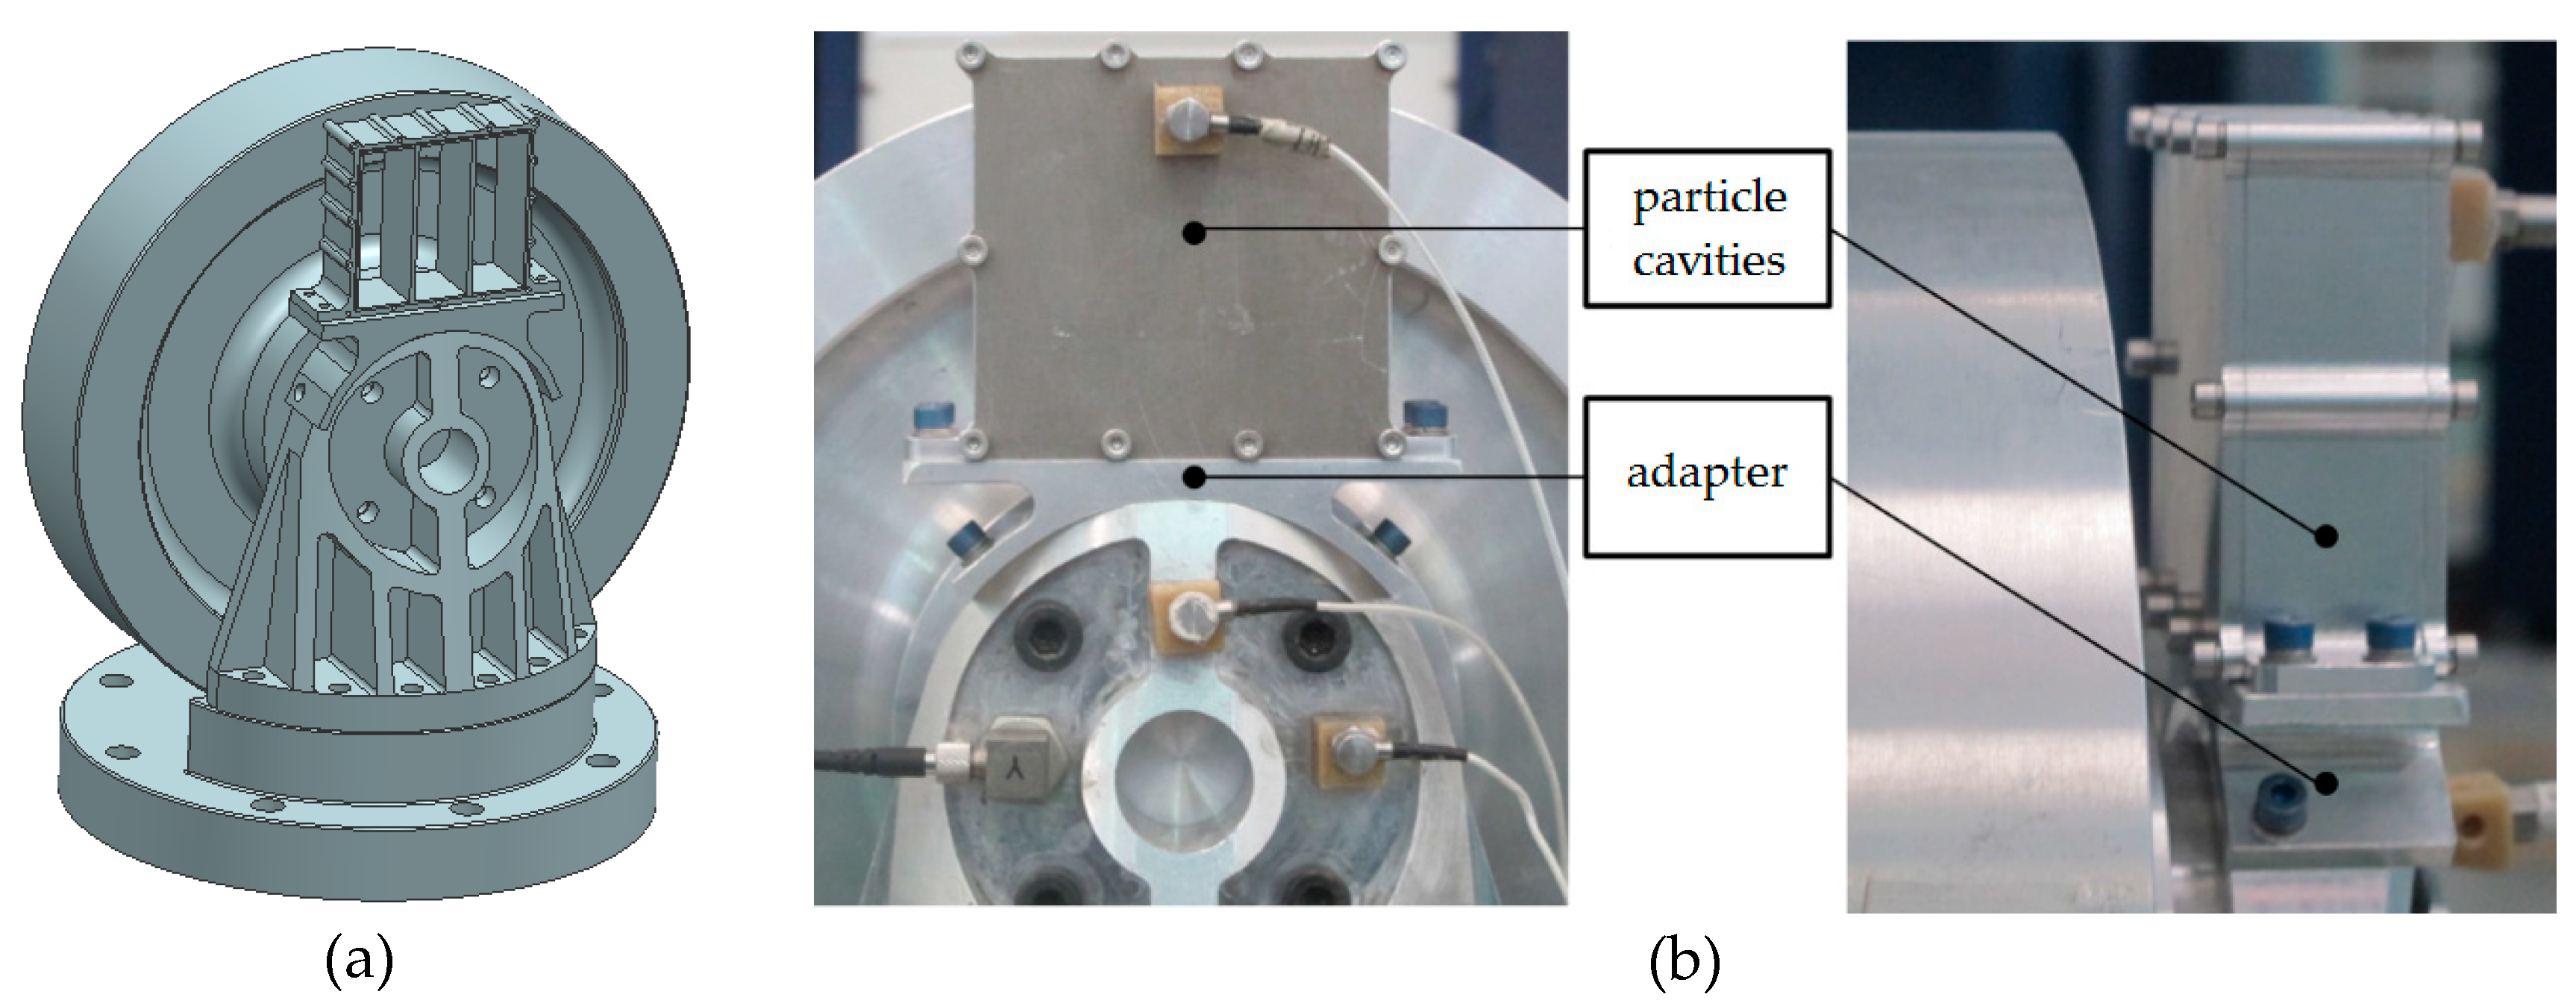
Figure 3.
Connection scheme of particle cavities with the primary structure. (a) bracket structure; (b) test model.
Figure 3.
Connection scheme of particle cavities with the primary structure. (a) bracket structure; (b) test model.
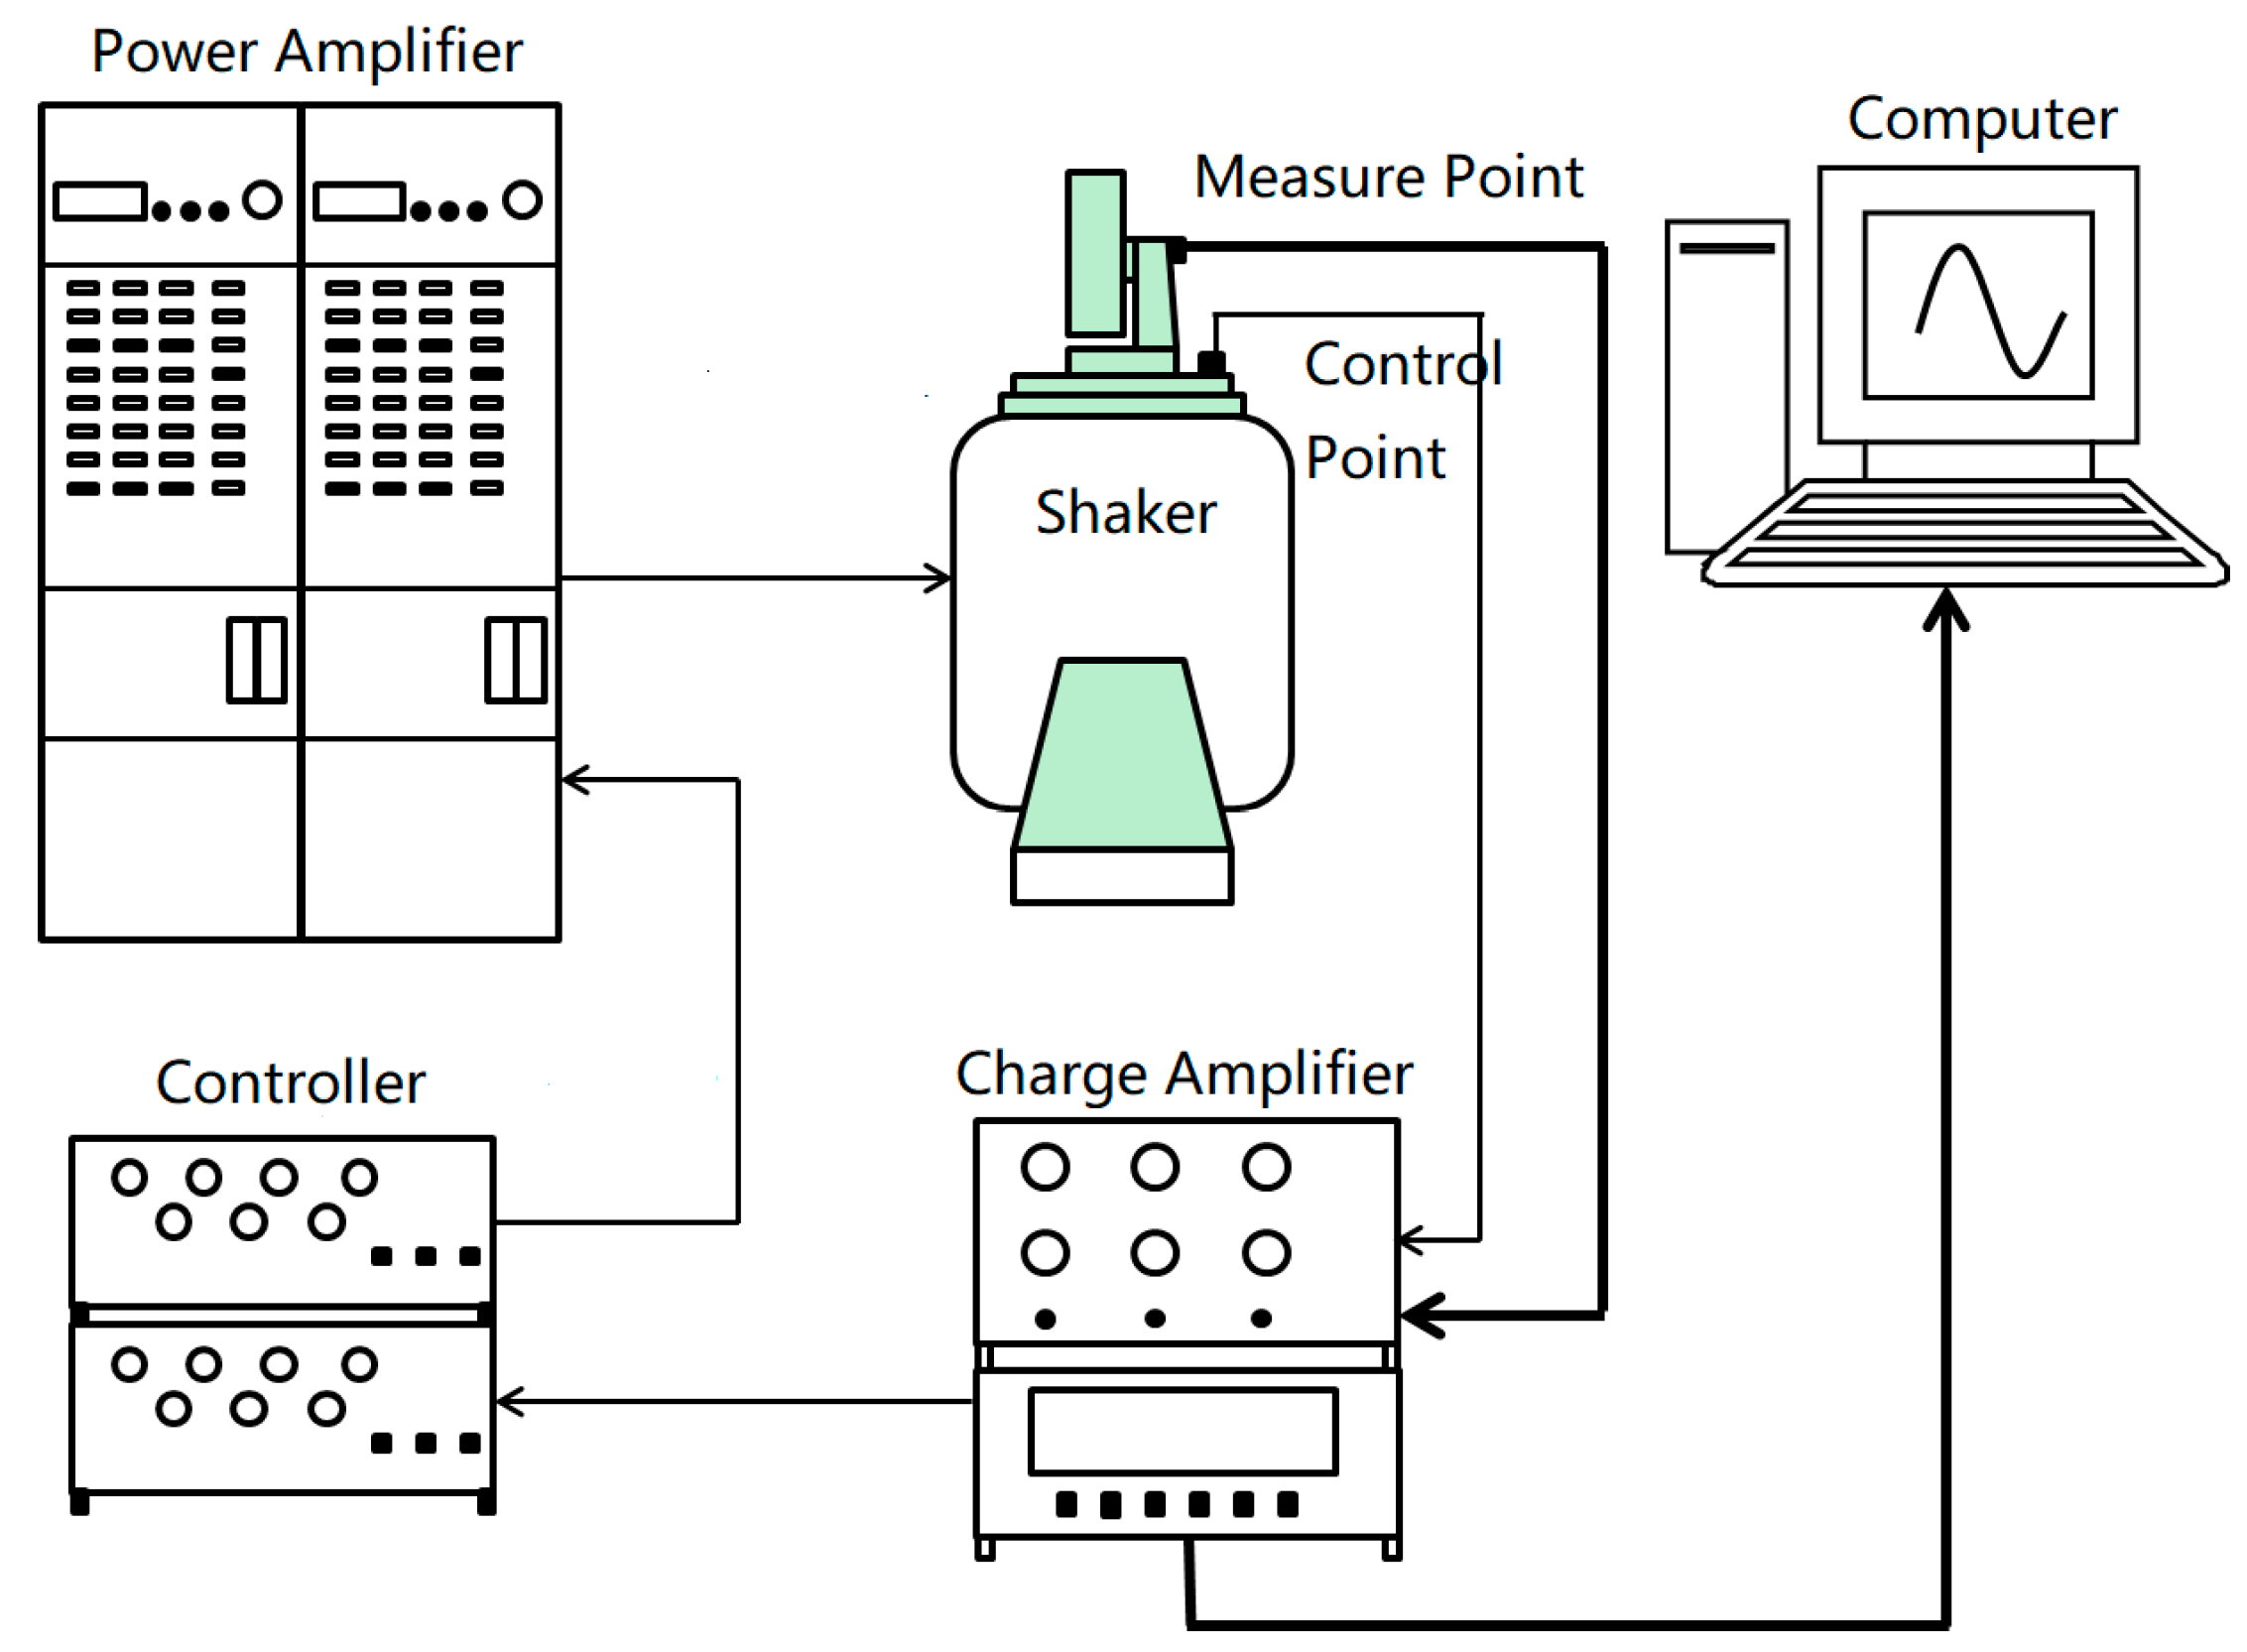
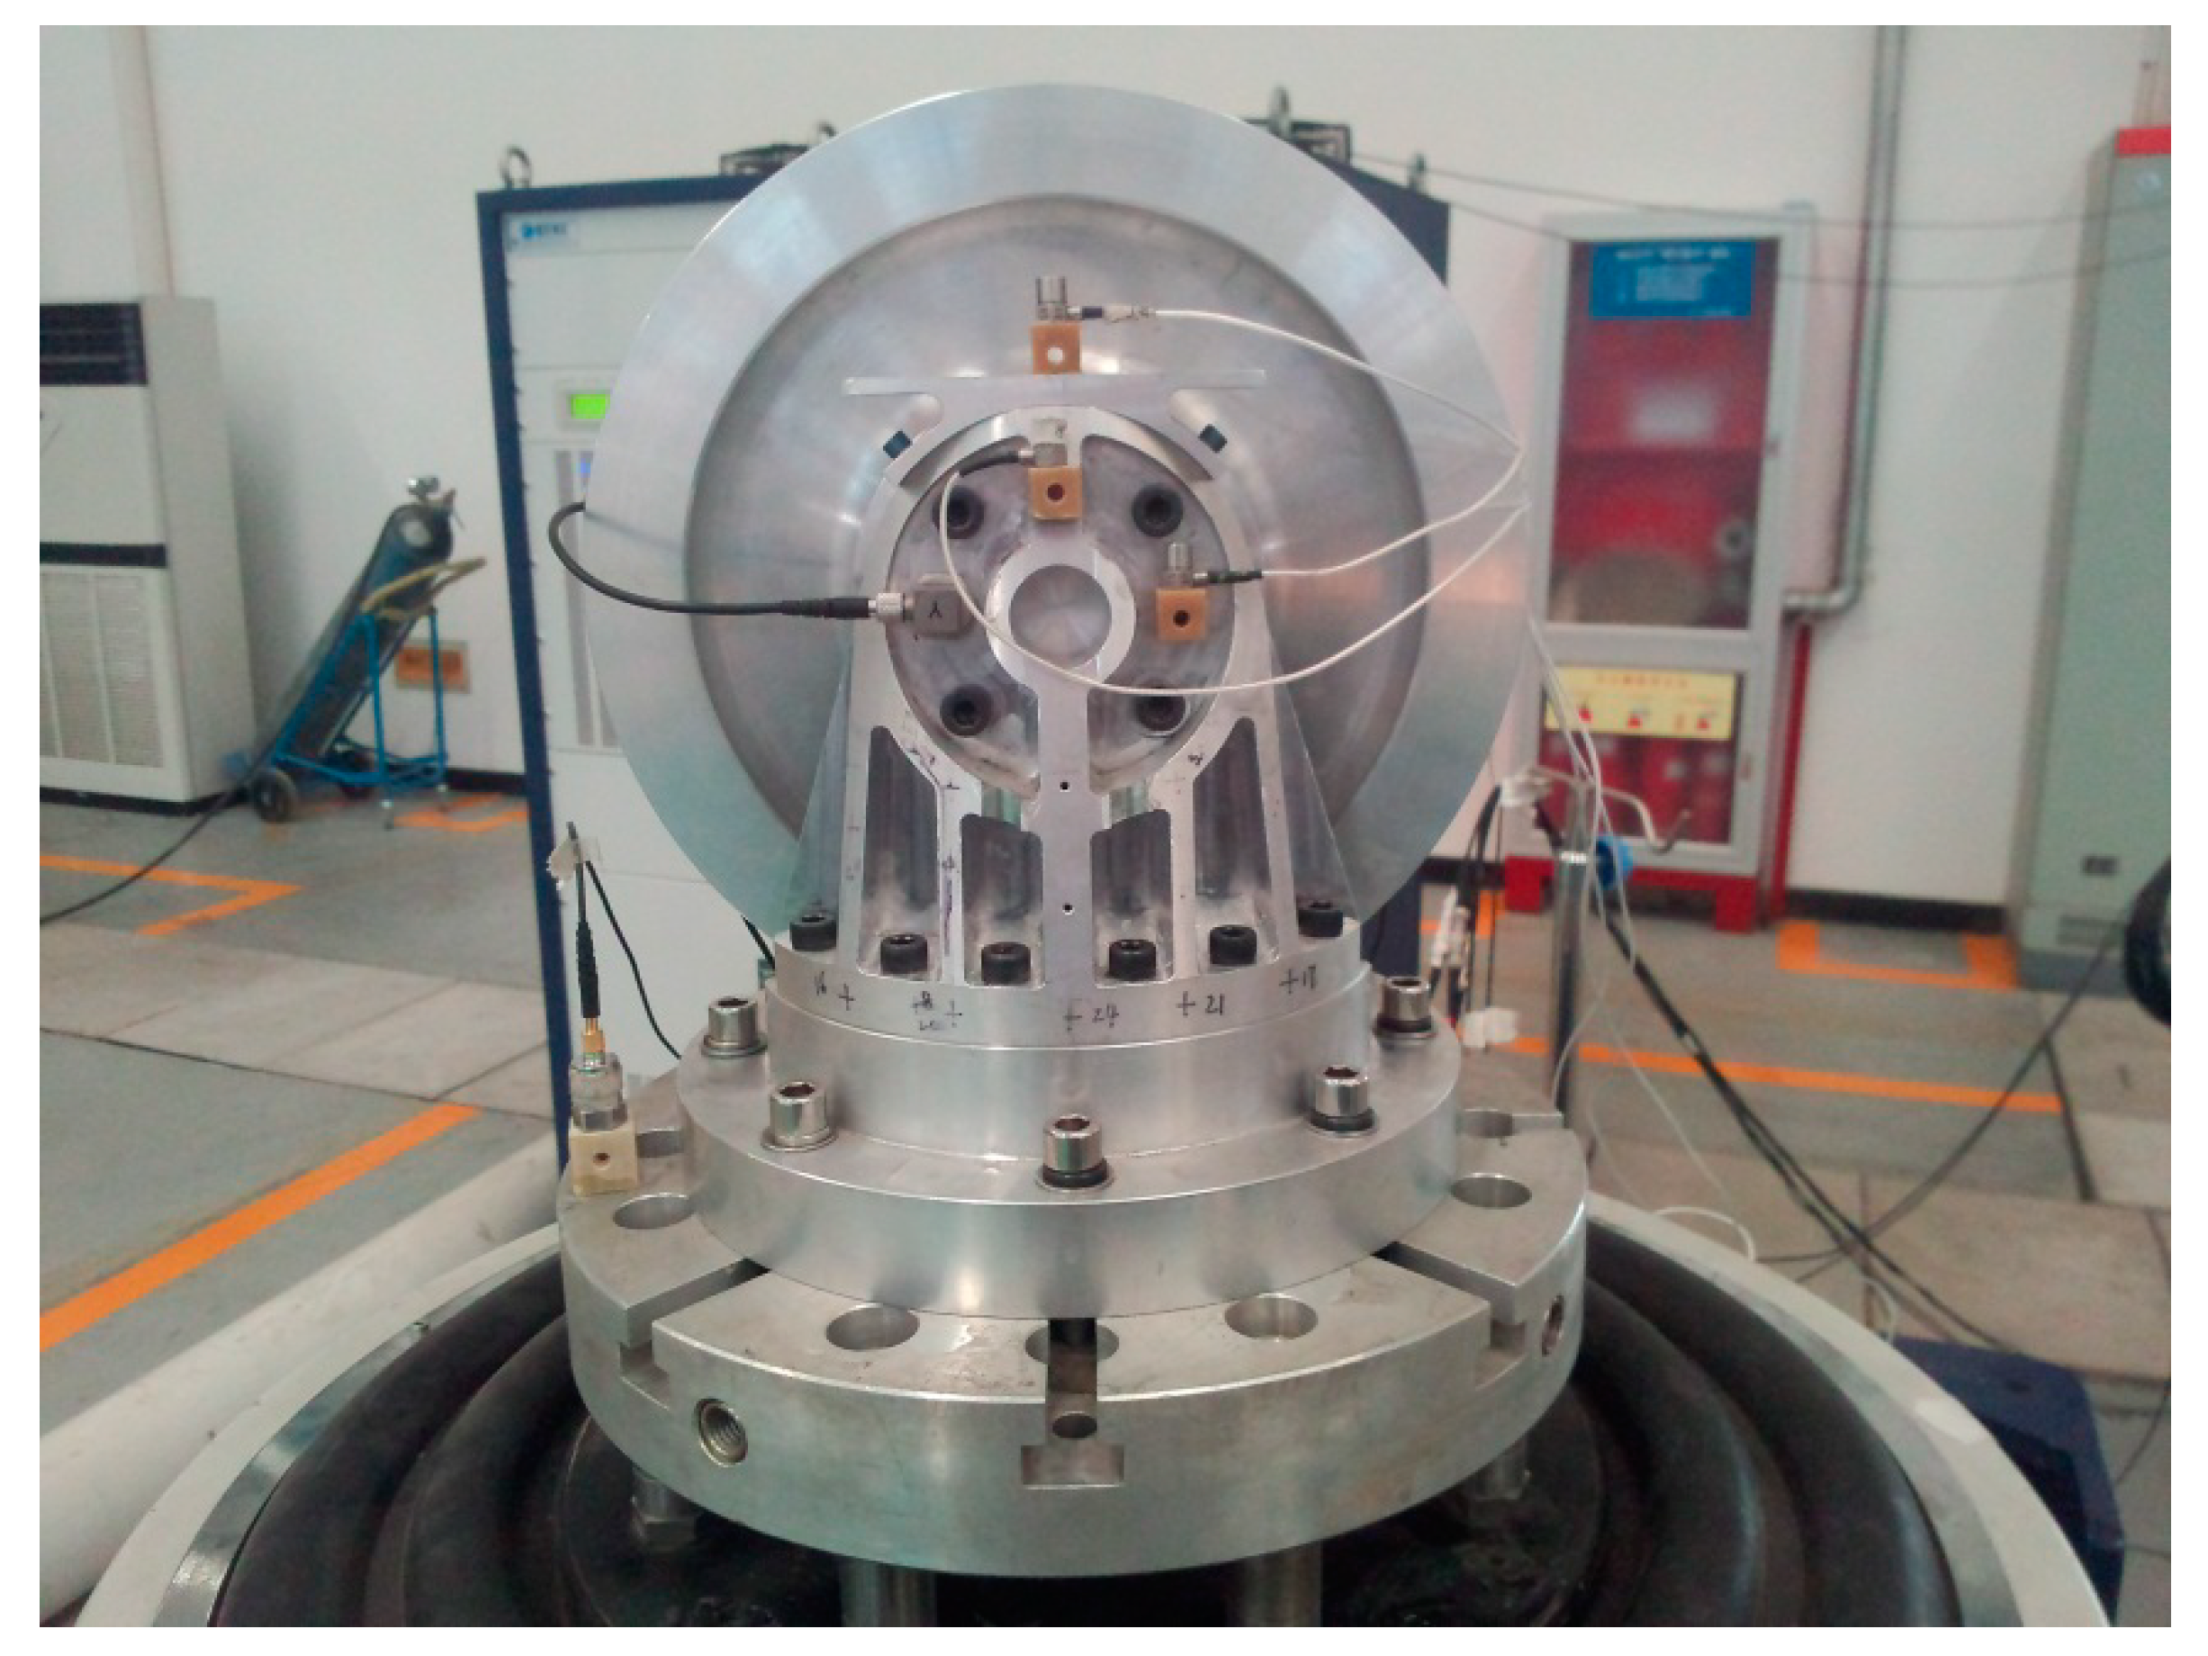
Figure 4.
Schematic of experimental apparatus.
Figure 4.
Schematic of experimental apparatus.
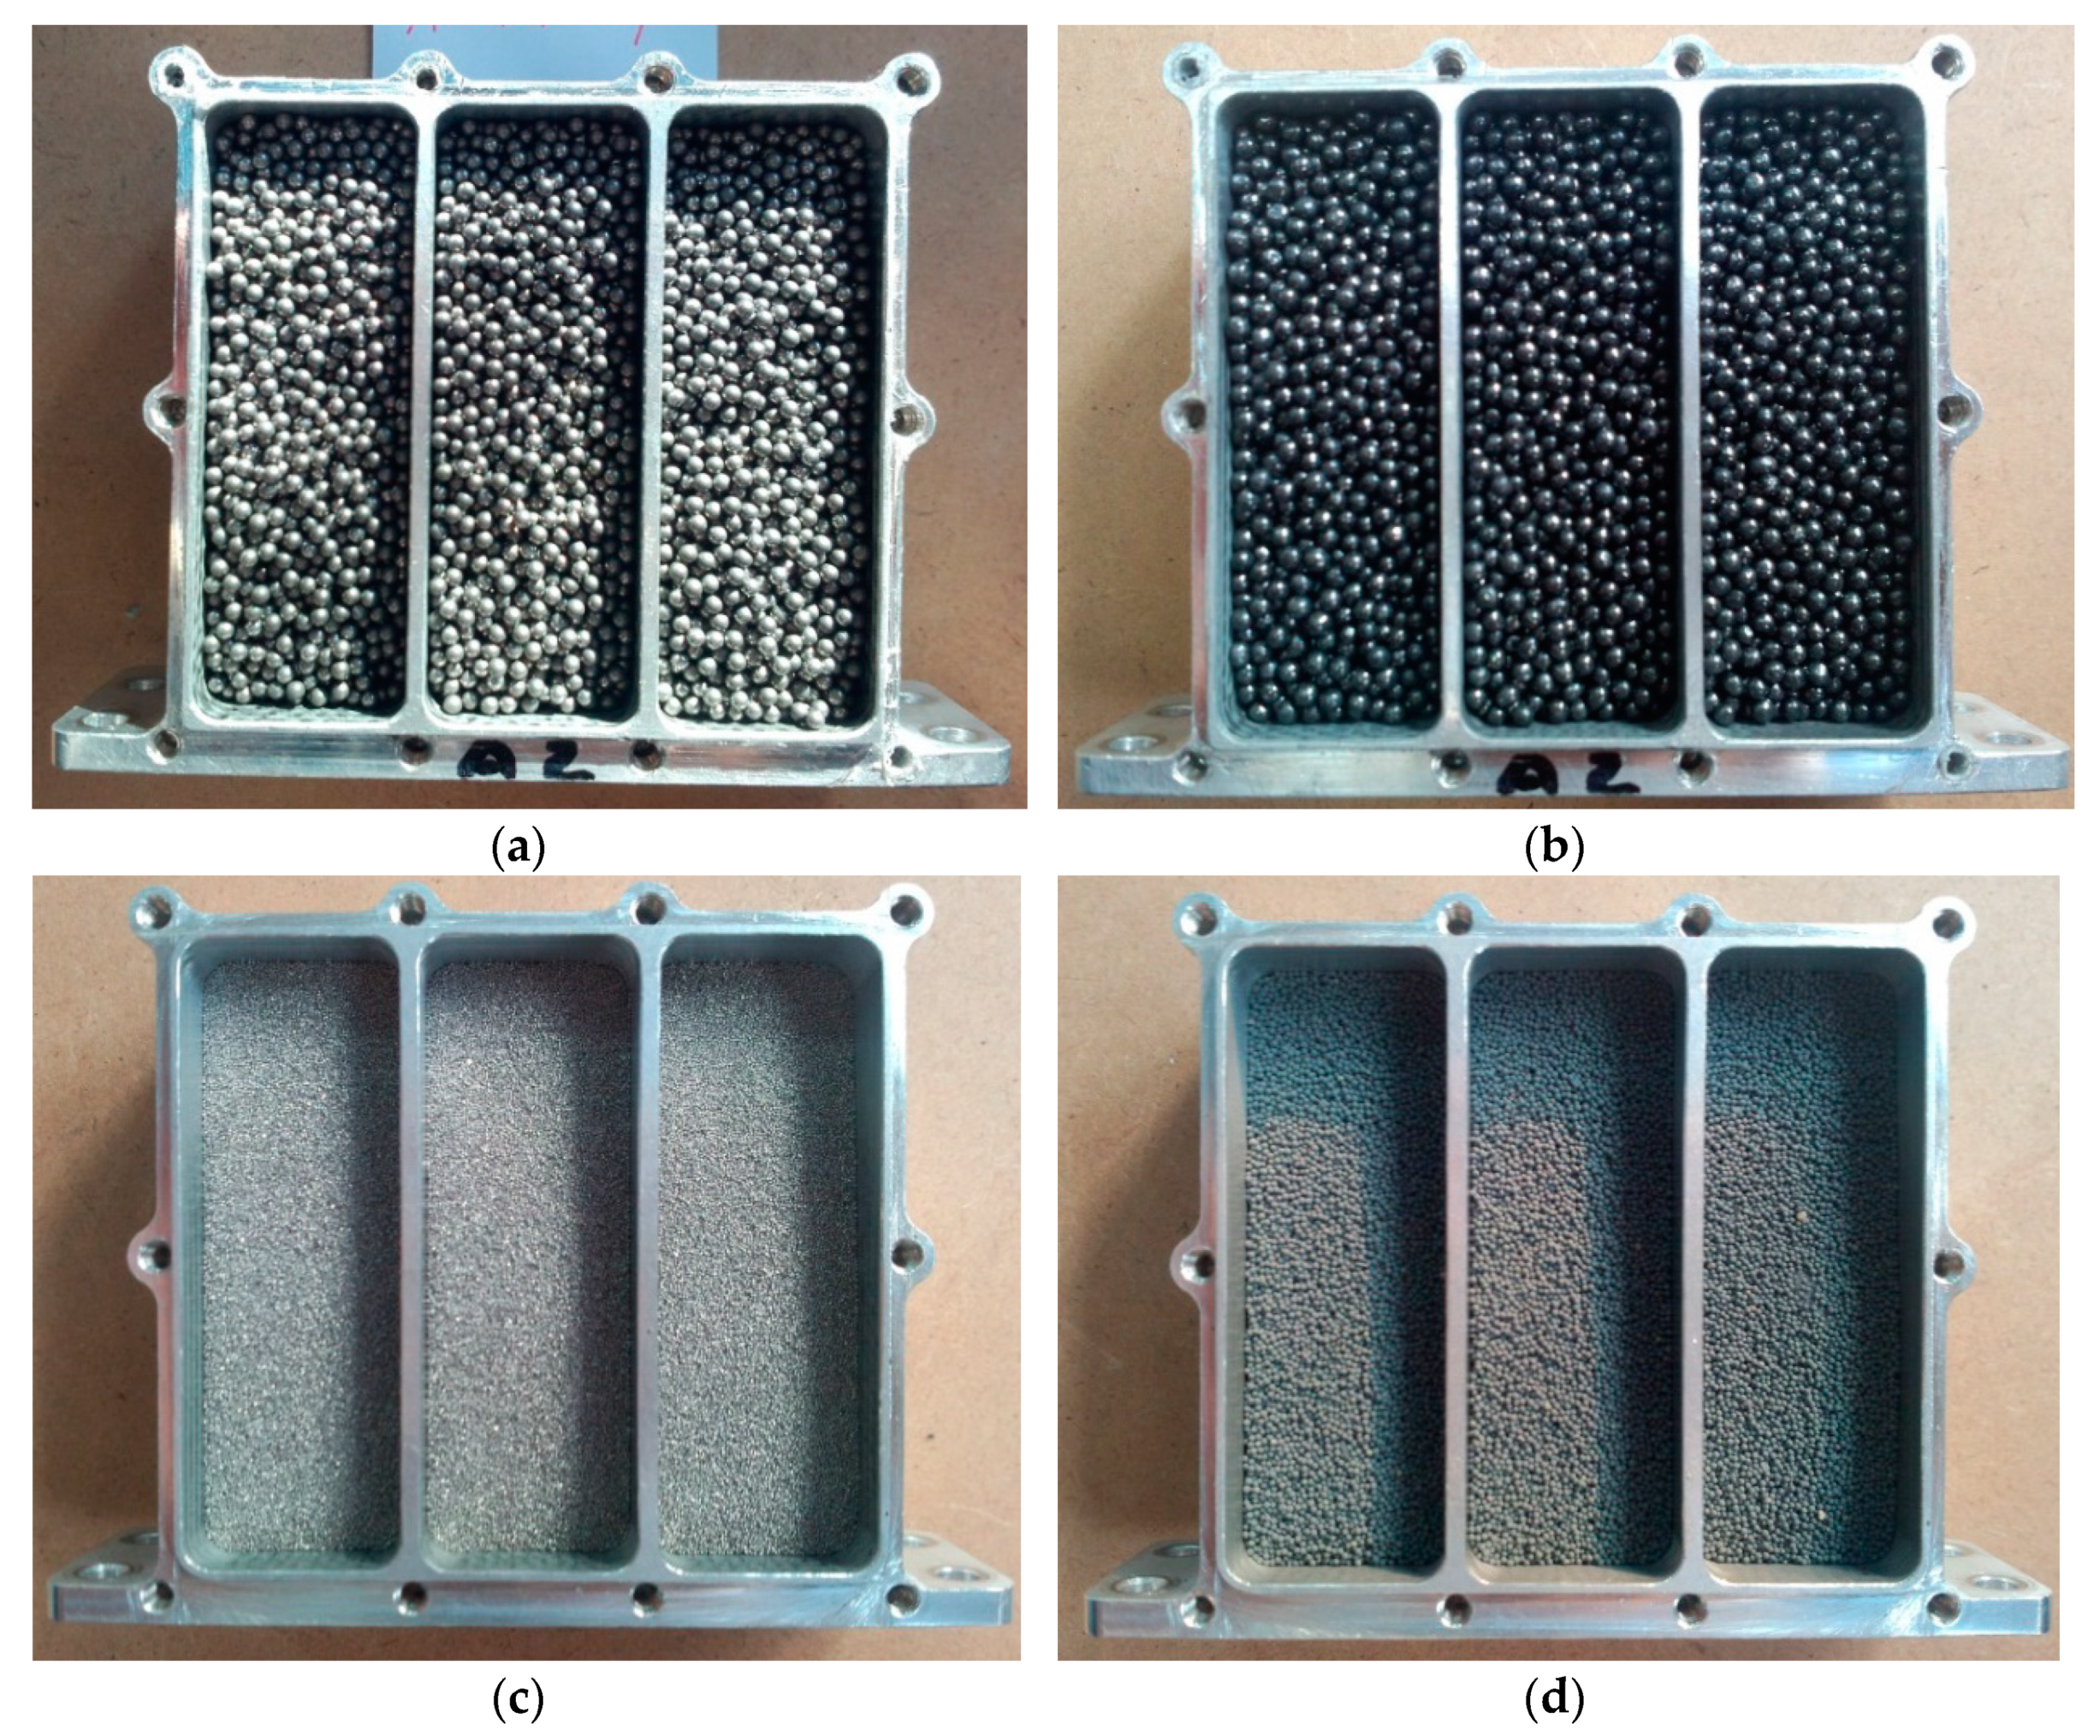
Figure 5.
Particle type (a) 304 Stainless steel particles (2 mm diameter); (b) Lead particles (2 mm diameter); (c) Stainless steel powder (about 0.048 mm diameter); (d) Tungsten carbide powder (about 0.5 mm diameter).
Figure 5.
Particle type (a) 304 Stainless steel particles (2 mm diameter); (b) Lead particles (2 mm diameter); (c) Stainless steel powder (about 0.048 mm diameter); (d) Tungsten carbide powder (about 0.5 mm diameter).
Figure 6.
Configuration of the reference scheme.
Figure 6.
Configuration of the reference scheme.
Figure 7.
The frequency response function of Sup_1: (a) Sinusoidal excitation; (b) Random excitation.
Figure 7.
The frequency response function of Sup_1: (a) Sinusoidal excitation; (b) Random excitation.
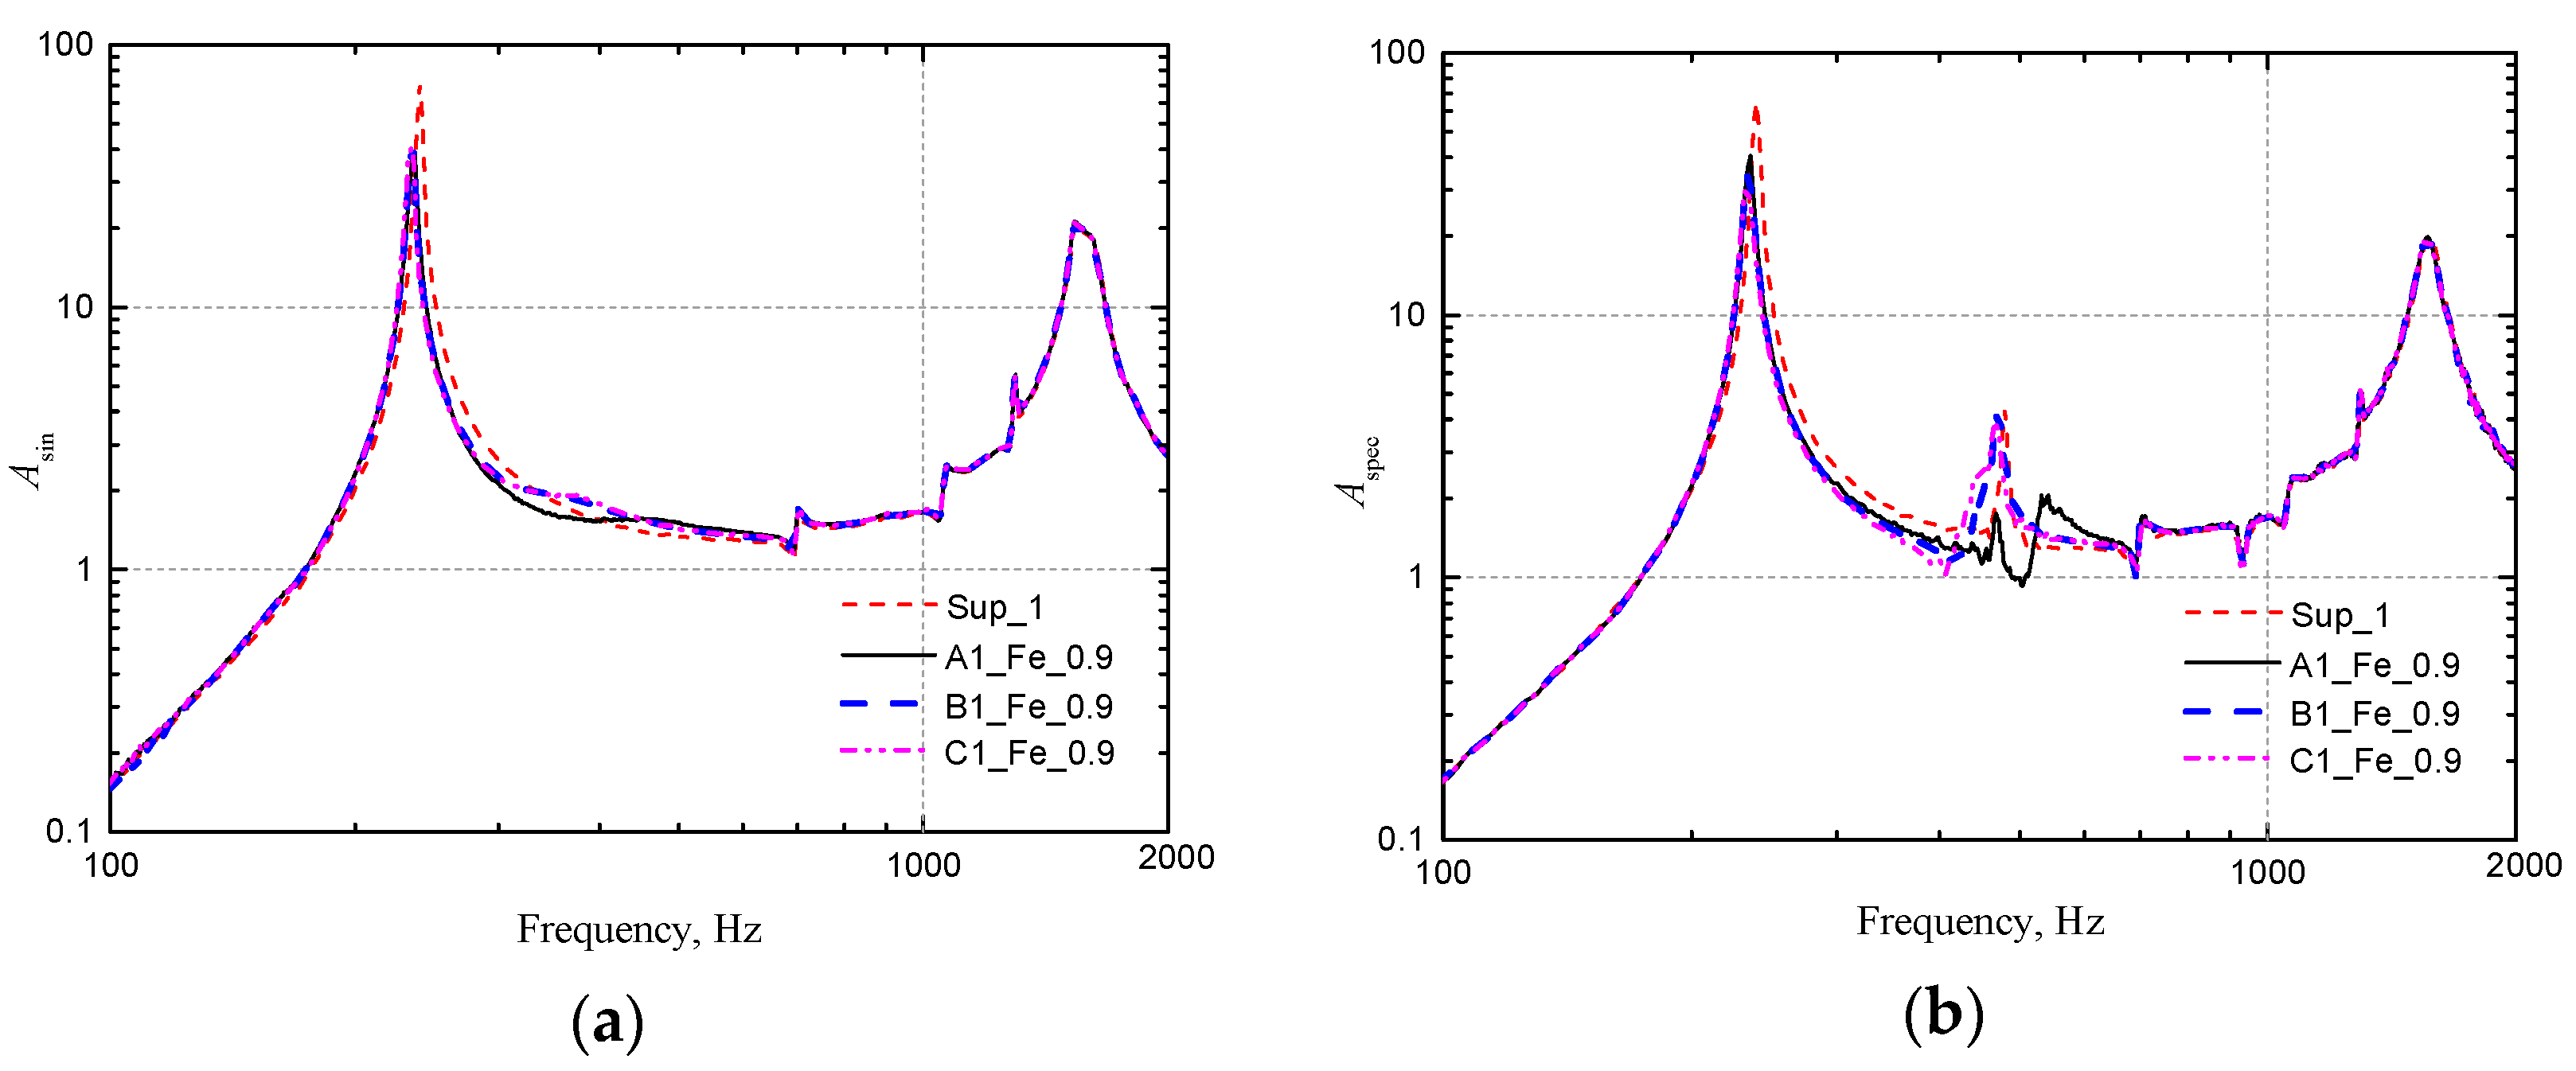
Figure 8.
Experiment results of 2 mm stainless steel particle (layering in Z-direction of the cavity): (a) Sinusoidal excitation; (b) Random excitation.
Figure 8.
Experiment results of 2 mm stainless steel particle (layering in Z-direction of the cavity): (a) Sinusoidal excitation; (b) Random excitation.
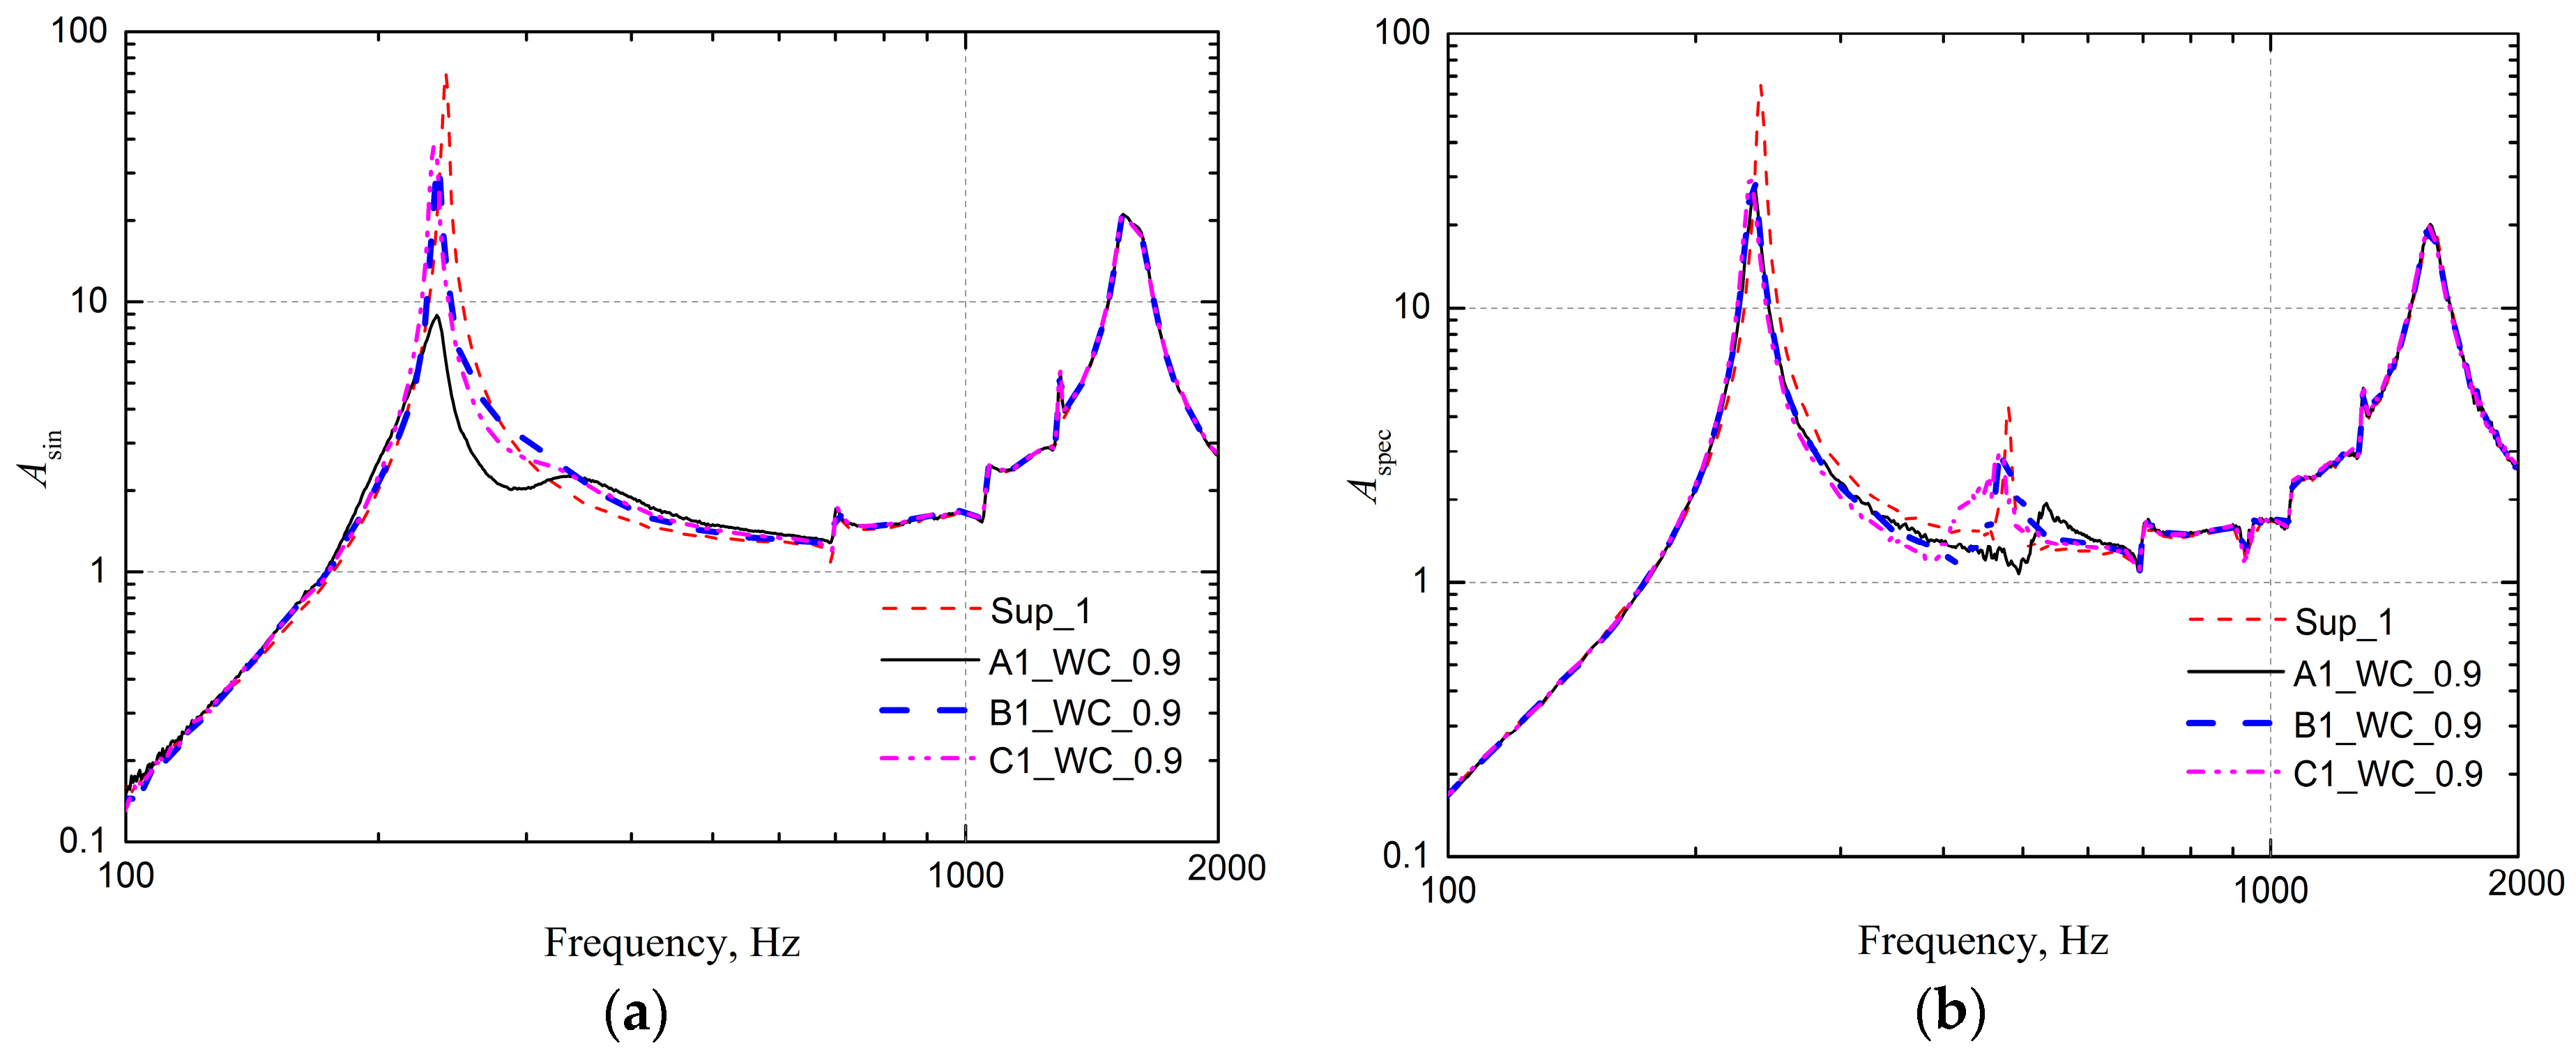
Figure 9.
Experiment results of Tungsten carbide powder (layering in Z-direction of the cavity); (a) Sinusoidal excitation; (b) Random excitation.
Figure 9.
Experiment results of Tungsten carbide powder (layering in Z-direction of the cavity); (a) Sinusoidal excitation; (b) Random excitation.
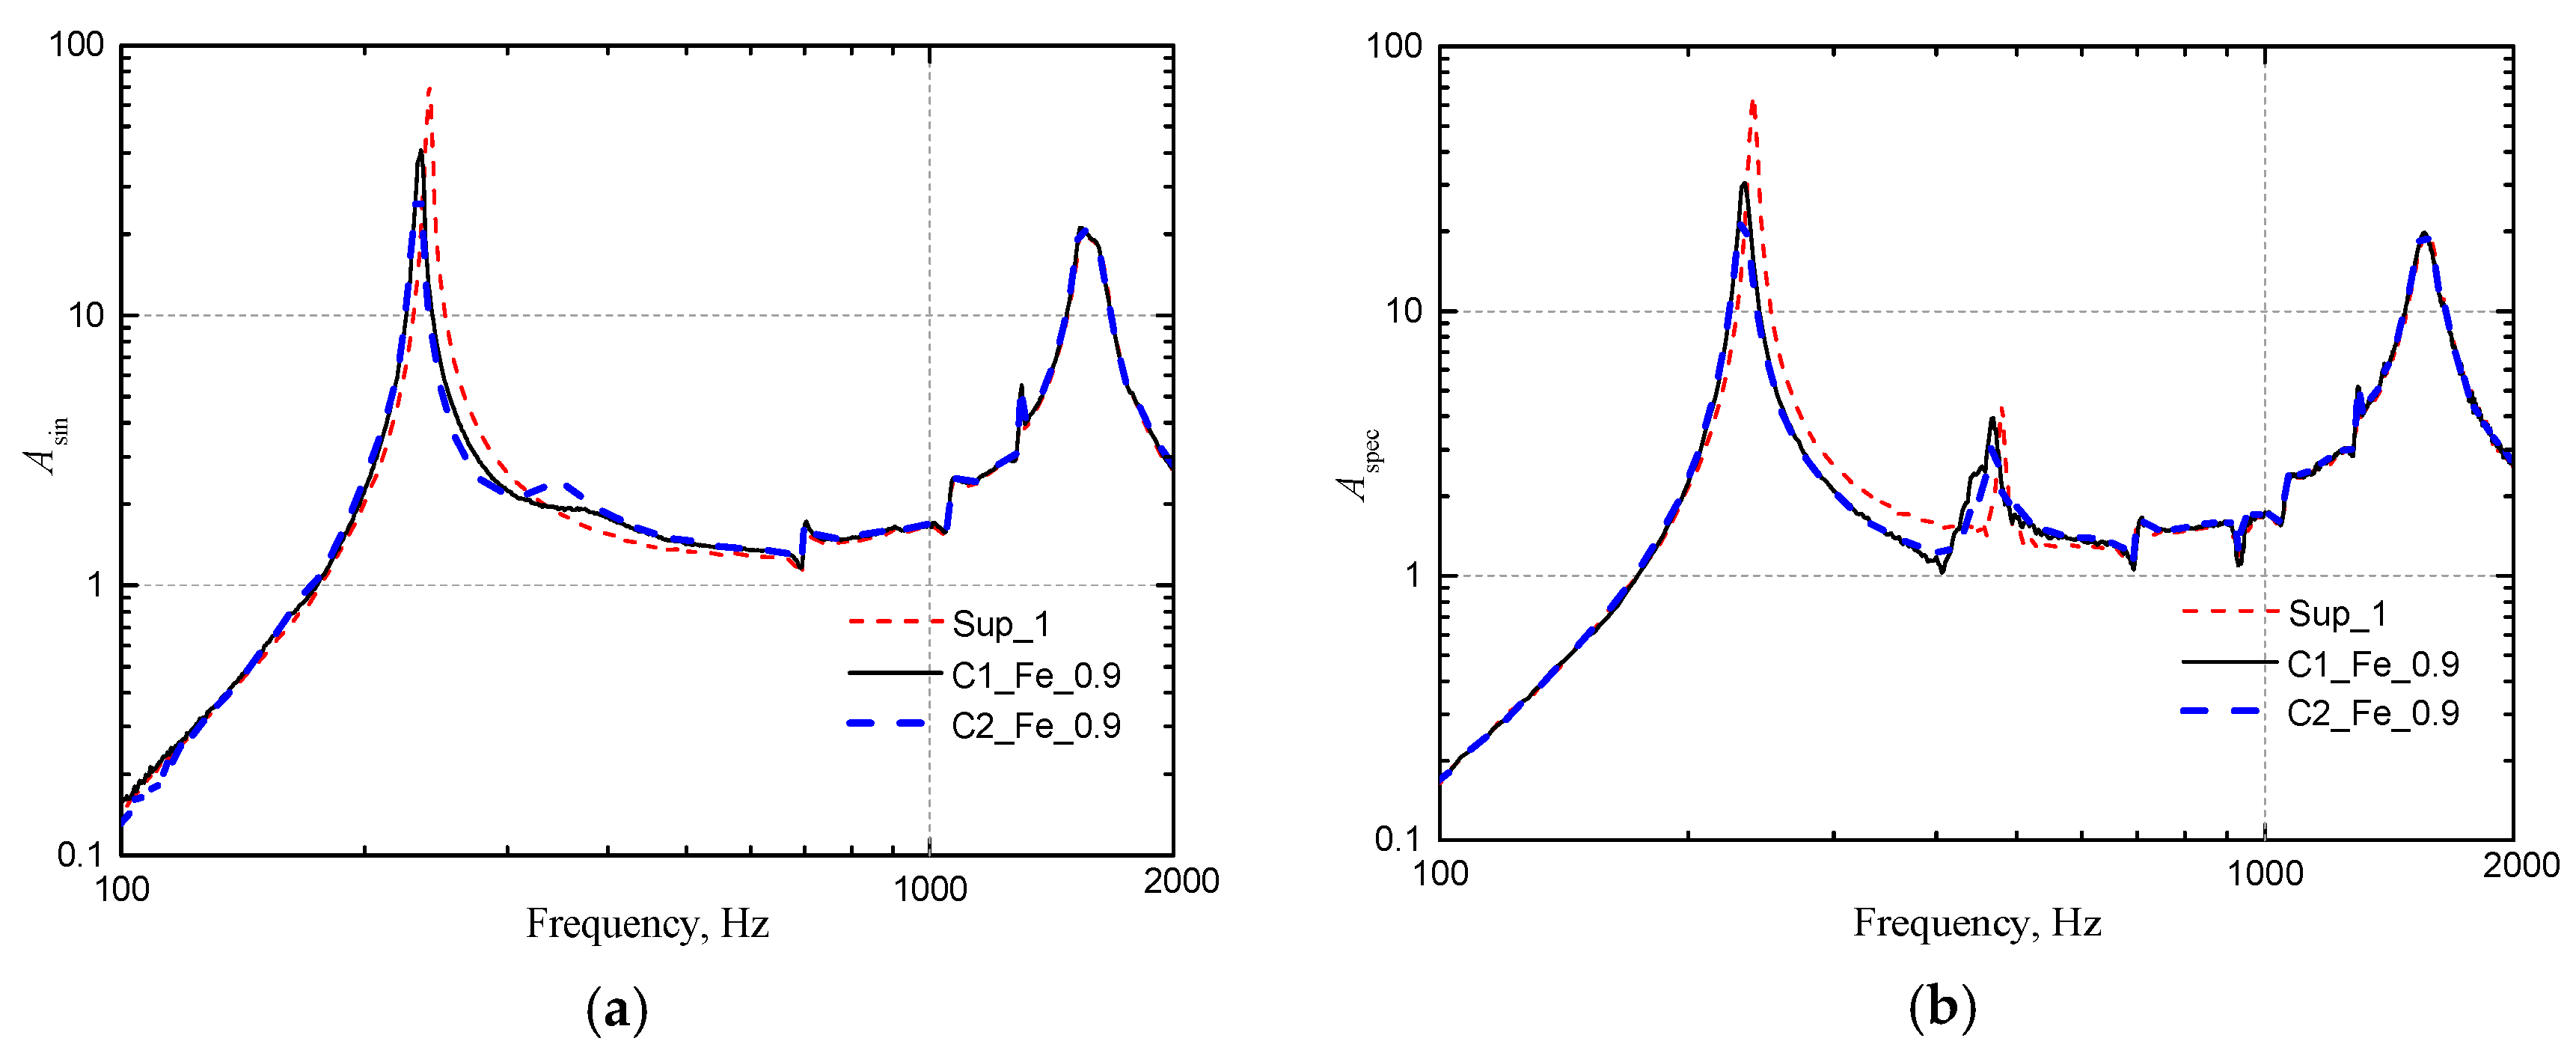
Figure 10.
Experiment results of 2 mm stainless steel particle (layering in Y-direction of the cavity): (a) Sinusoidal excitation; (b) Random excitation.
Figure 10.
Experiment results of 2 mm stainless steel particle (layering in Y-direction of the cavity): (a) Sinusoidal excitation; (b) Random excitation.
Figure 11.
Experiment results of Tungsten carbide powder (layering in Y-direction of the cavity); (a) Sinusoidal excitation; (b) Random excitation.
Figure 11.
Experiment results of Tungsten carbide powder (layering in Y-direction of the cavity); (a) Sinusoidal excitation; (b) Random excitation.
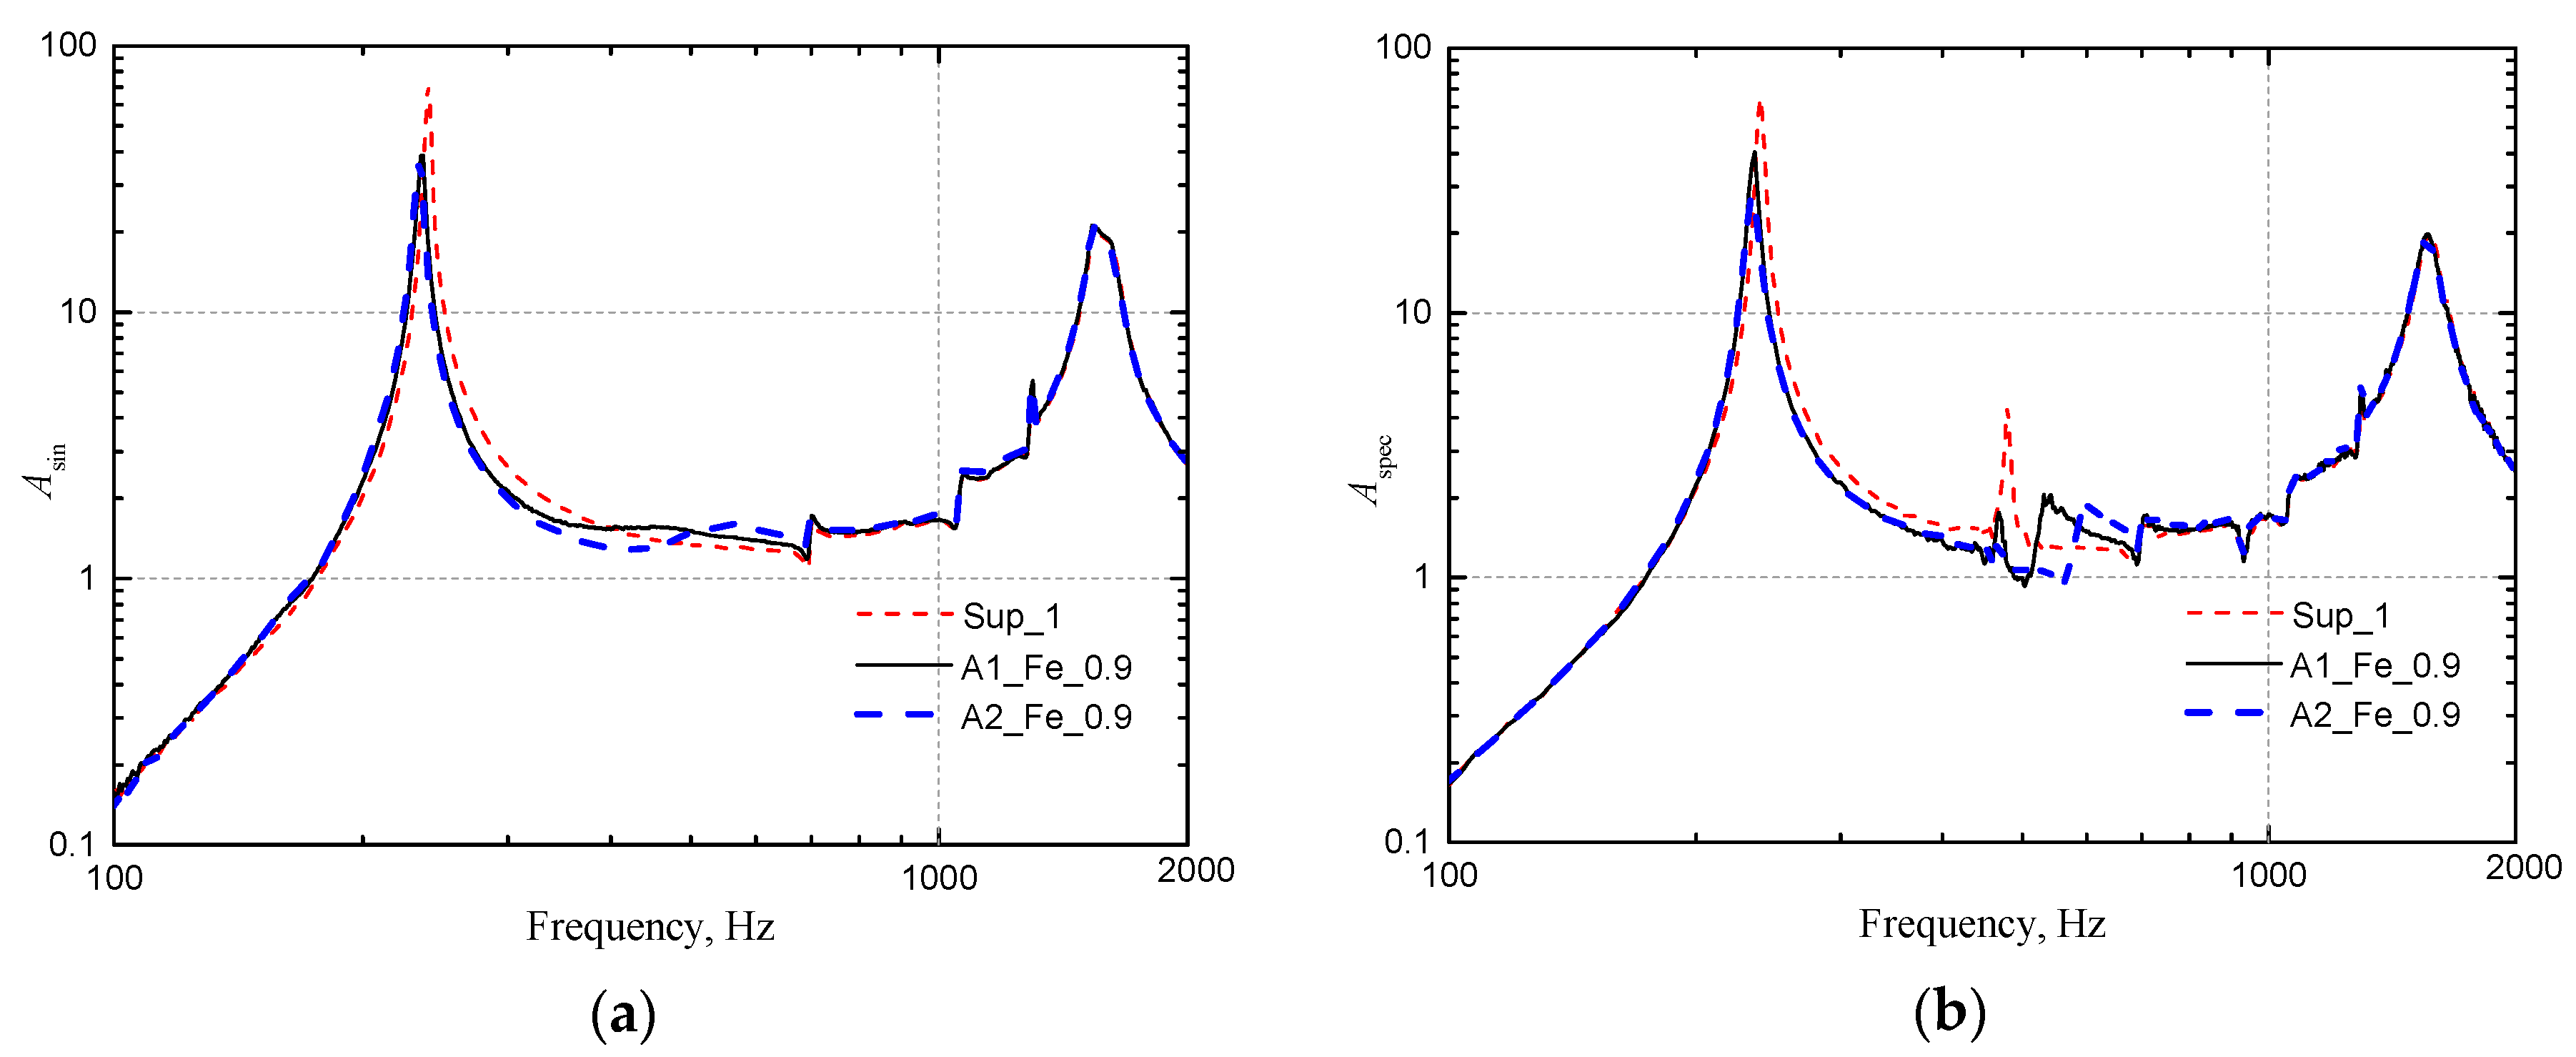
Figure 12.
Experiment results of 2 mm stainless steel particles for A1 and A2 cavity (layering in Y-direction of the cavity): (a) Sinusoidal excitation; (b) Random excitation.
Figure 12.
Experiment results of 2 mm stainless steel particles for A1 and A2 cavity (layering in Y-direction of the cavity): (a) Sinusoidal excitation; (b) Random excitation.
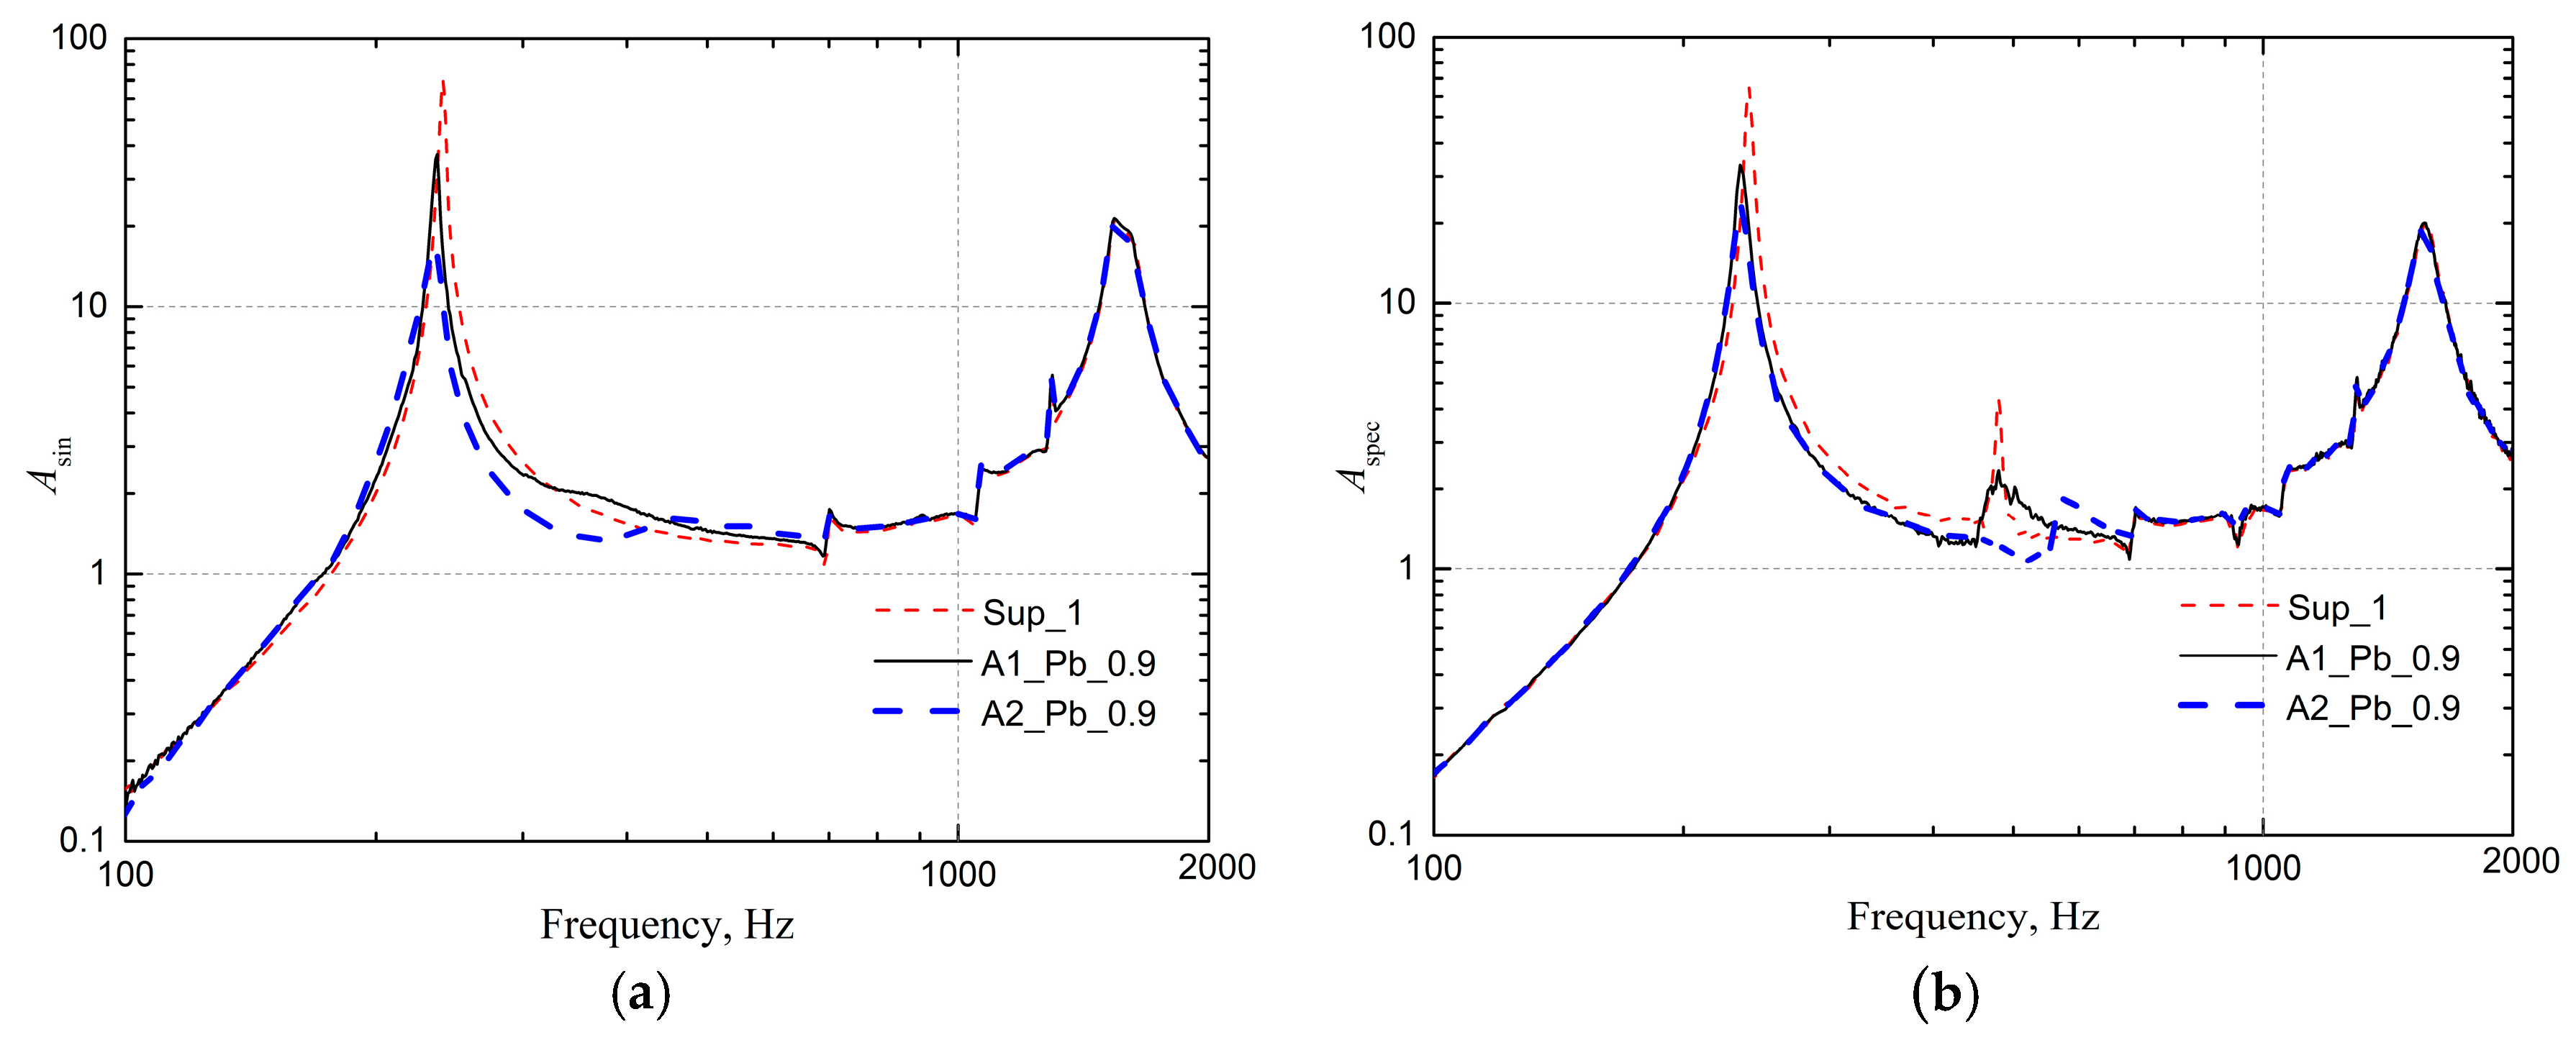
Figure 13.
Experiment results of 2 mm lead particles for A1 and A2 cavity (layering in Y-direction of the cavity): (a) Sinusoidal excitation; (b) Random excitation.
Figure 13.
Experiment results of 2 mm lead particles for A1 and A2 cavity (layering in Y-direction of the cavity): (a) Sinusoidal excitation; (b) Random excitation.
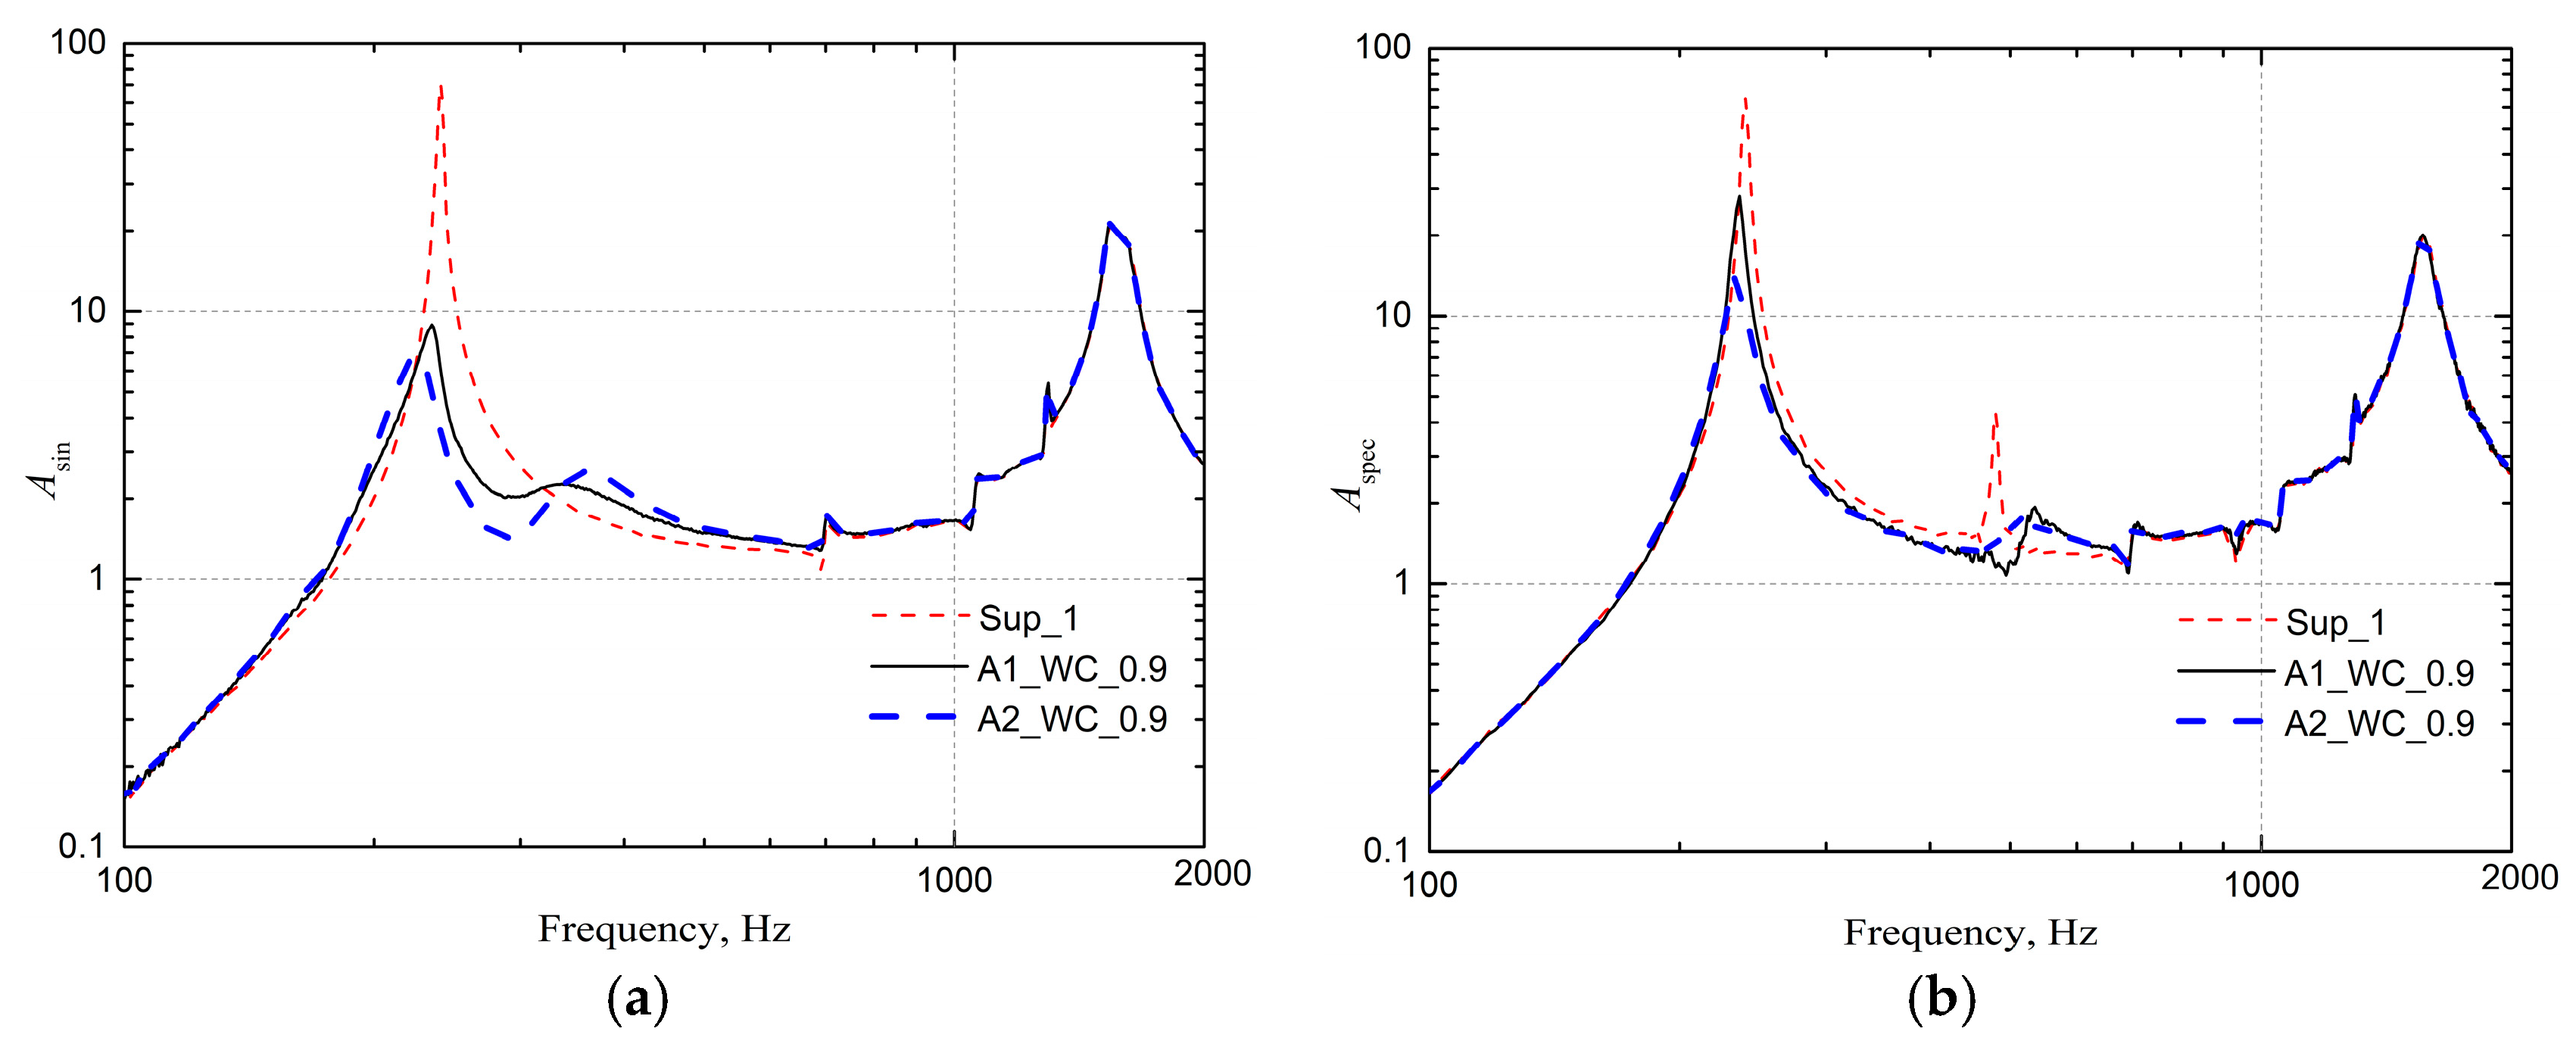
Figure 14.
Experiment results of Tungsten carbide powder for A1 and A2 cavity (layering in Y-direction of the cavity): (a) Sinusoidal excitation; (b) Random excitation.
Figure 14.
Experiment results of Tungsten carbide powder for A1 and A2 cavity (layering in Y-direction of the cavity): (a) Sinusoidal excitation; (b) Random excitation.
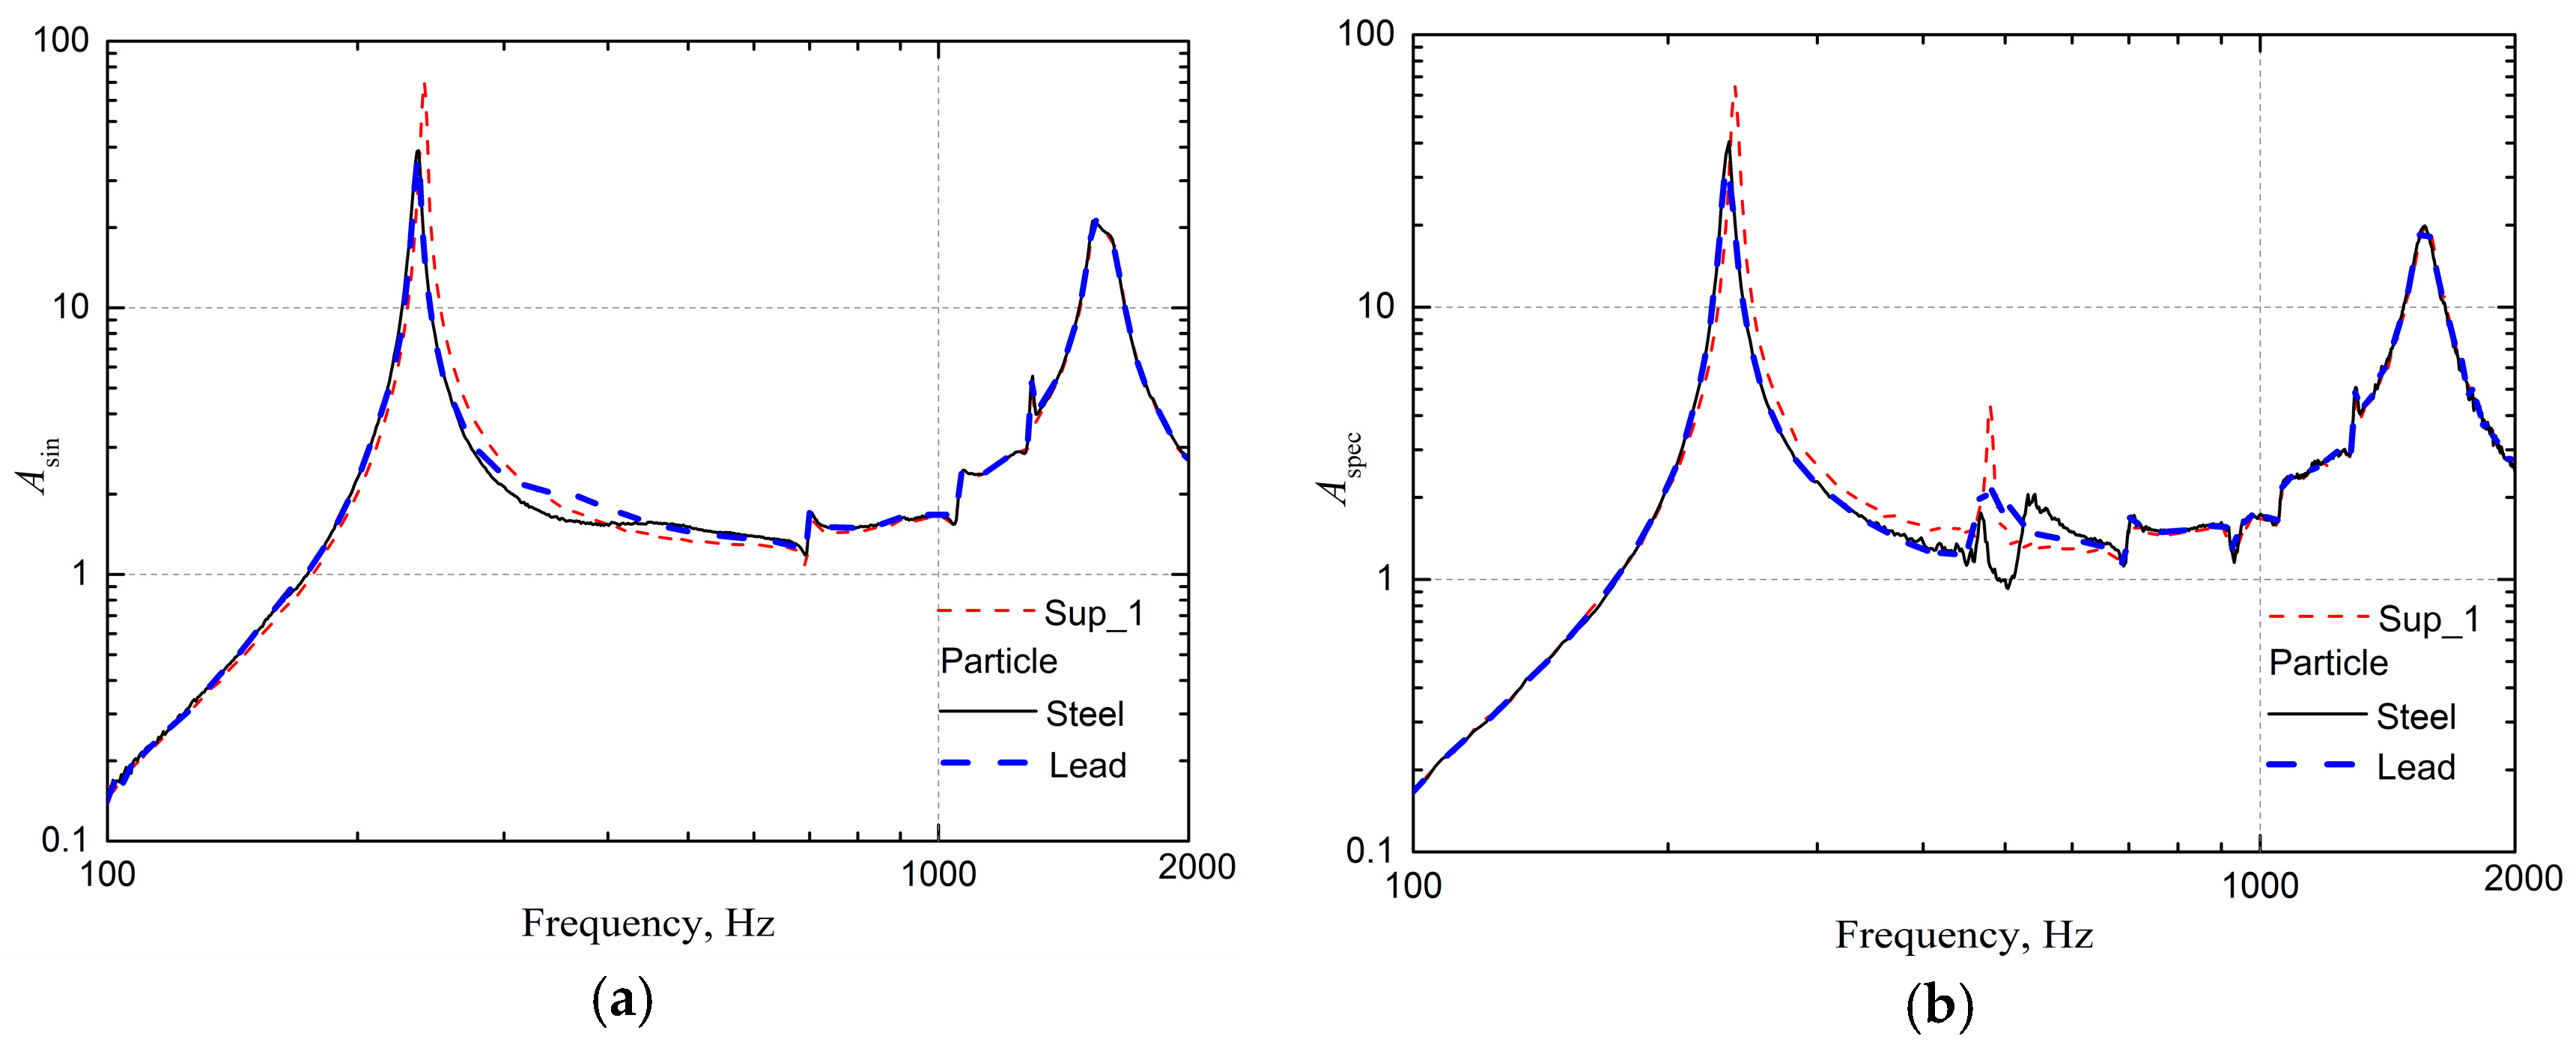
Figure 15.
Experiment results of particle material: (a) Sinusoidal excitation; (b) Random excitation.
Figure 15.
Experiment results of particle material: (a) Sinusoidal excitation; (b) Random excitation.
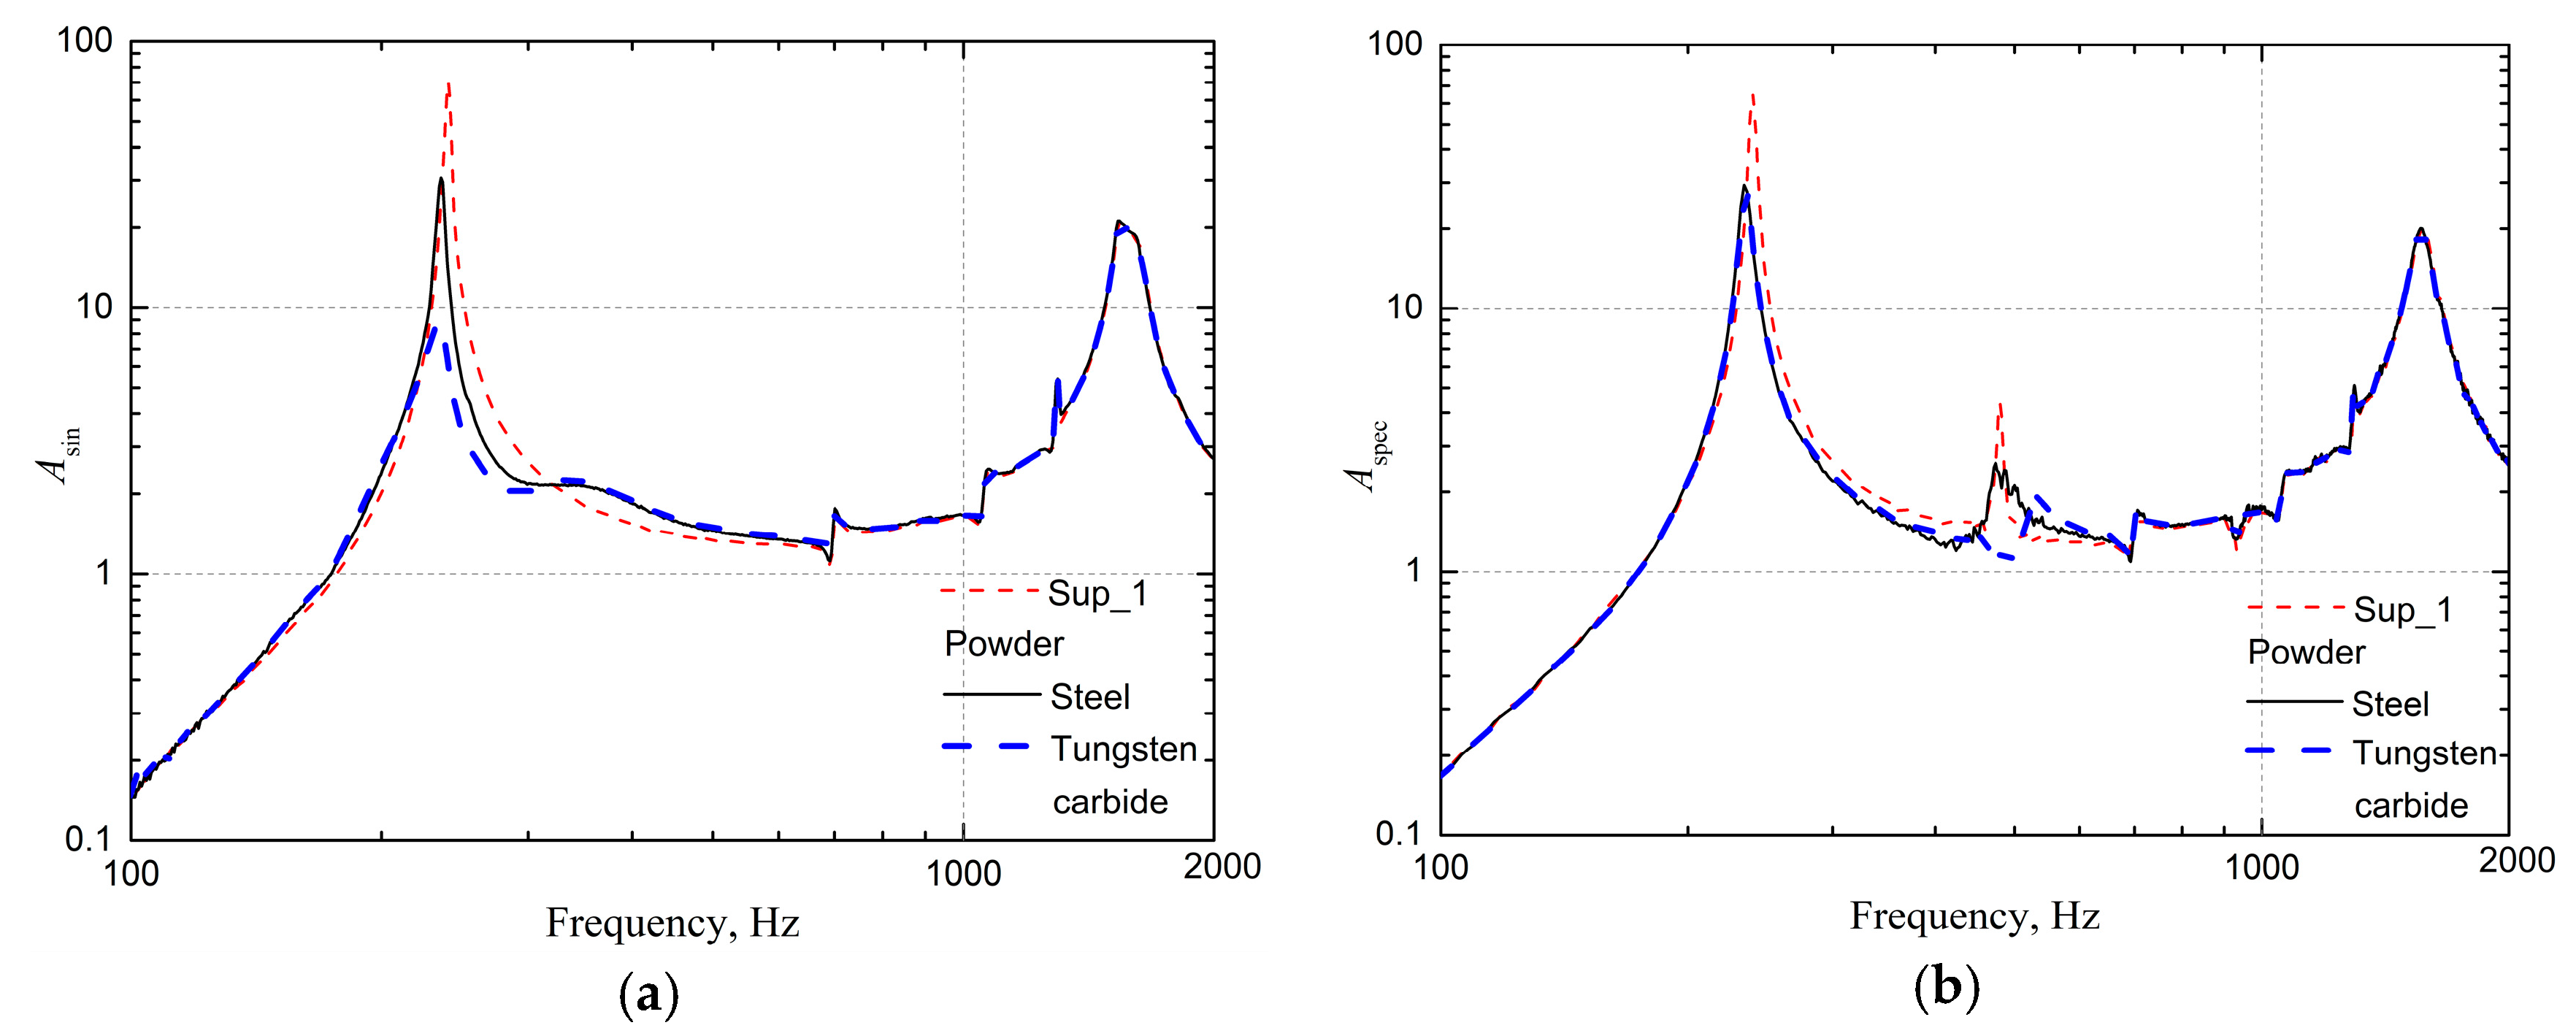
Figure 16.
Experiment results of powder material: (a) Sinusoidal excitation; (b) Random excitation.
Figure 16.
Experiment results of powder material: (a) Sinusoidal excitation; (b) Random excitation.
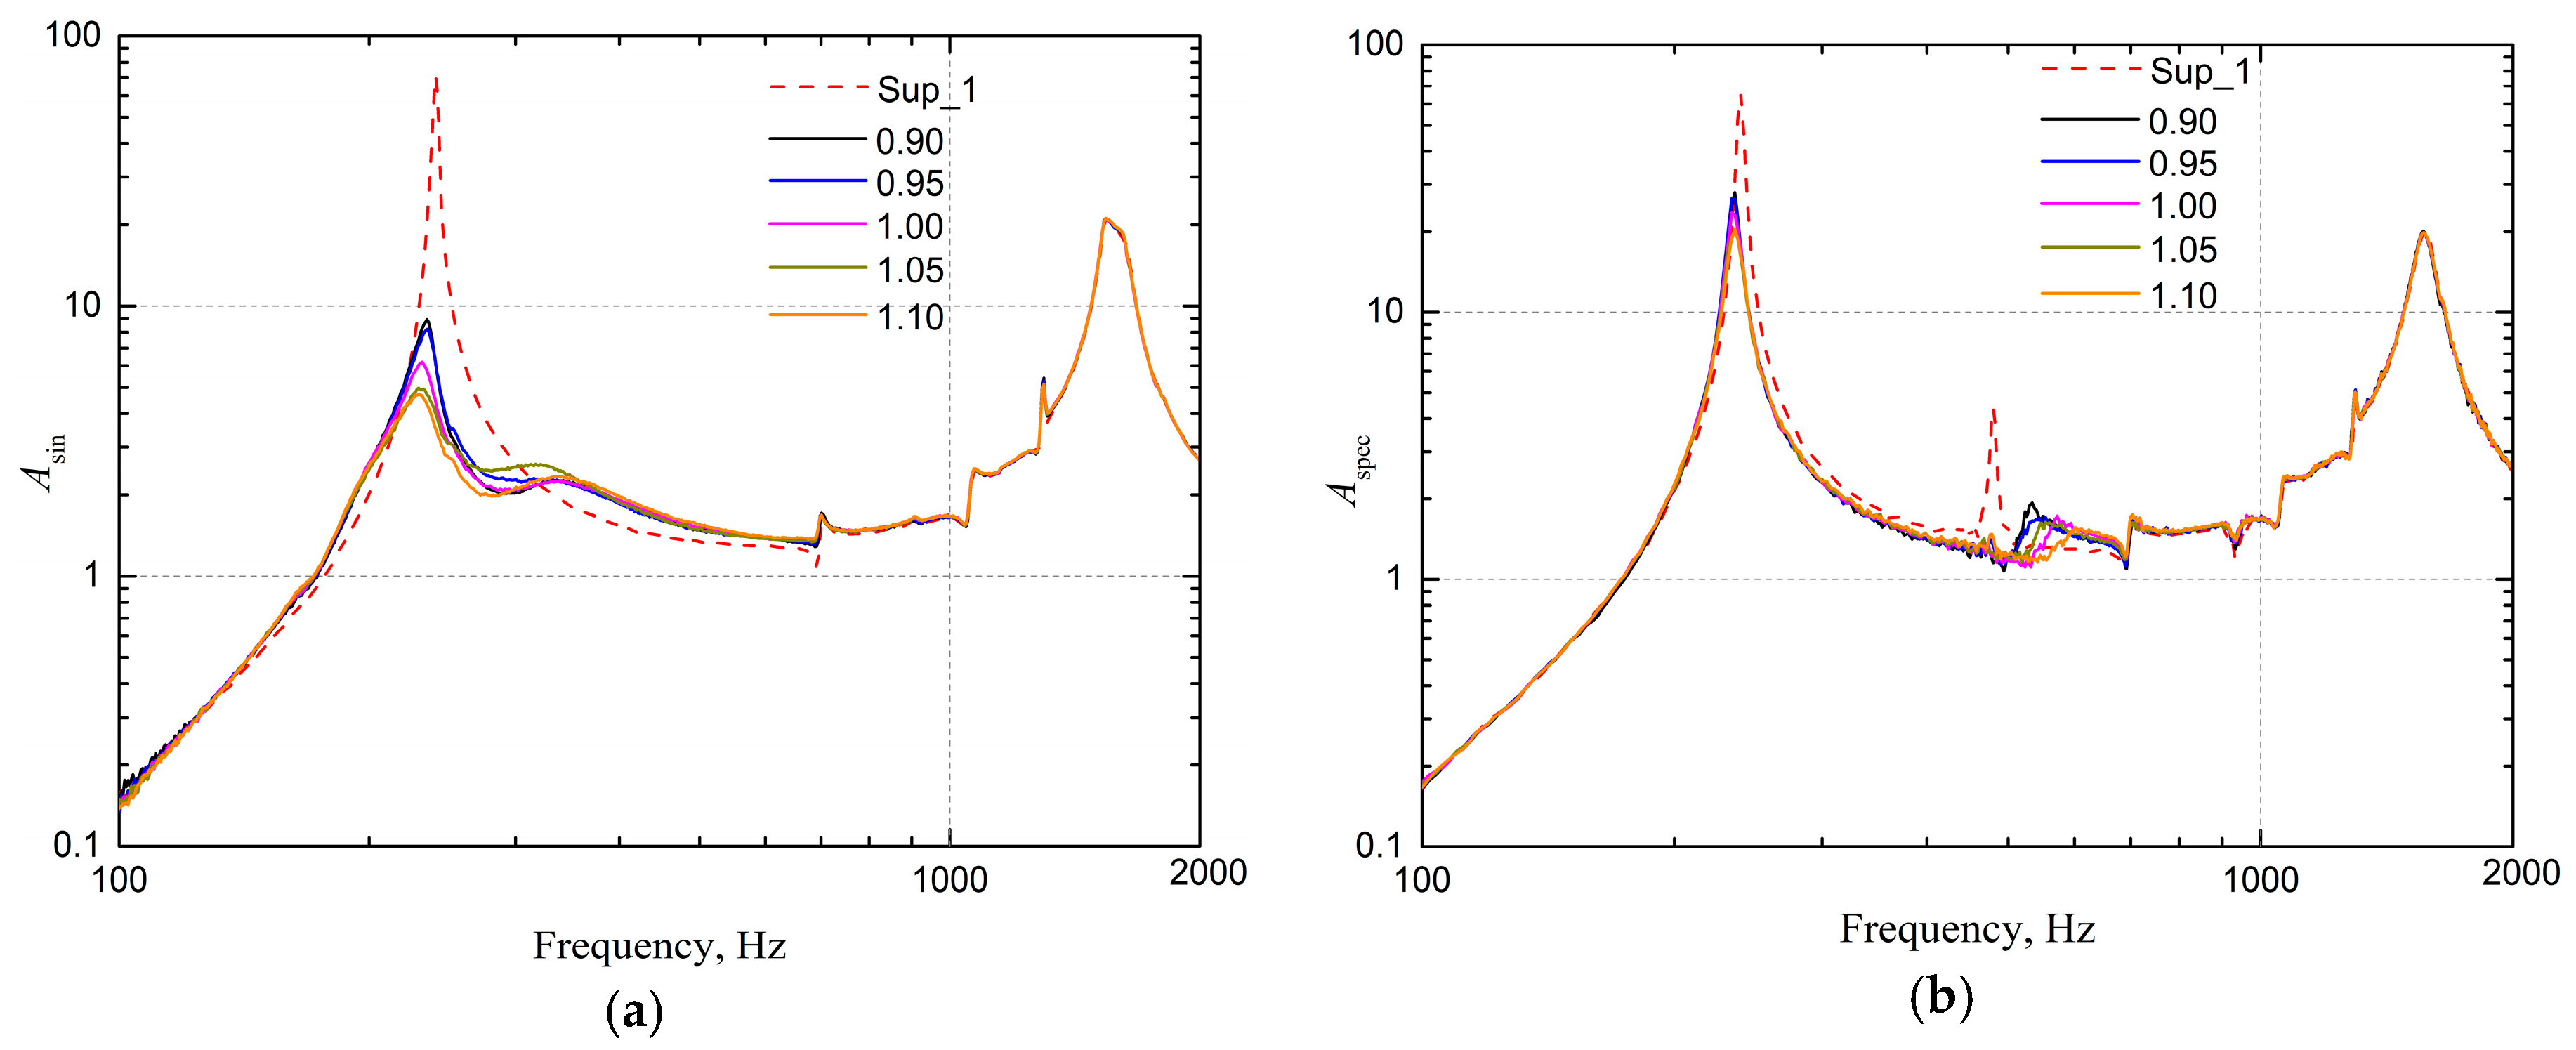
Figure 17.
The effect of the filling coefficient on the experiment results: (a) Sinusoidal excitation; (b) Random excitation.
Figure 17.
The effect of the filling coefficient on the experiment results: (a) Sinusoidal excitation; (b) Random excitation.
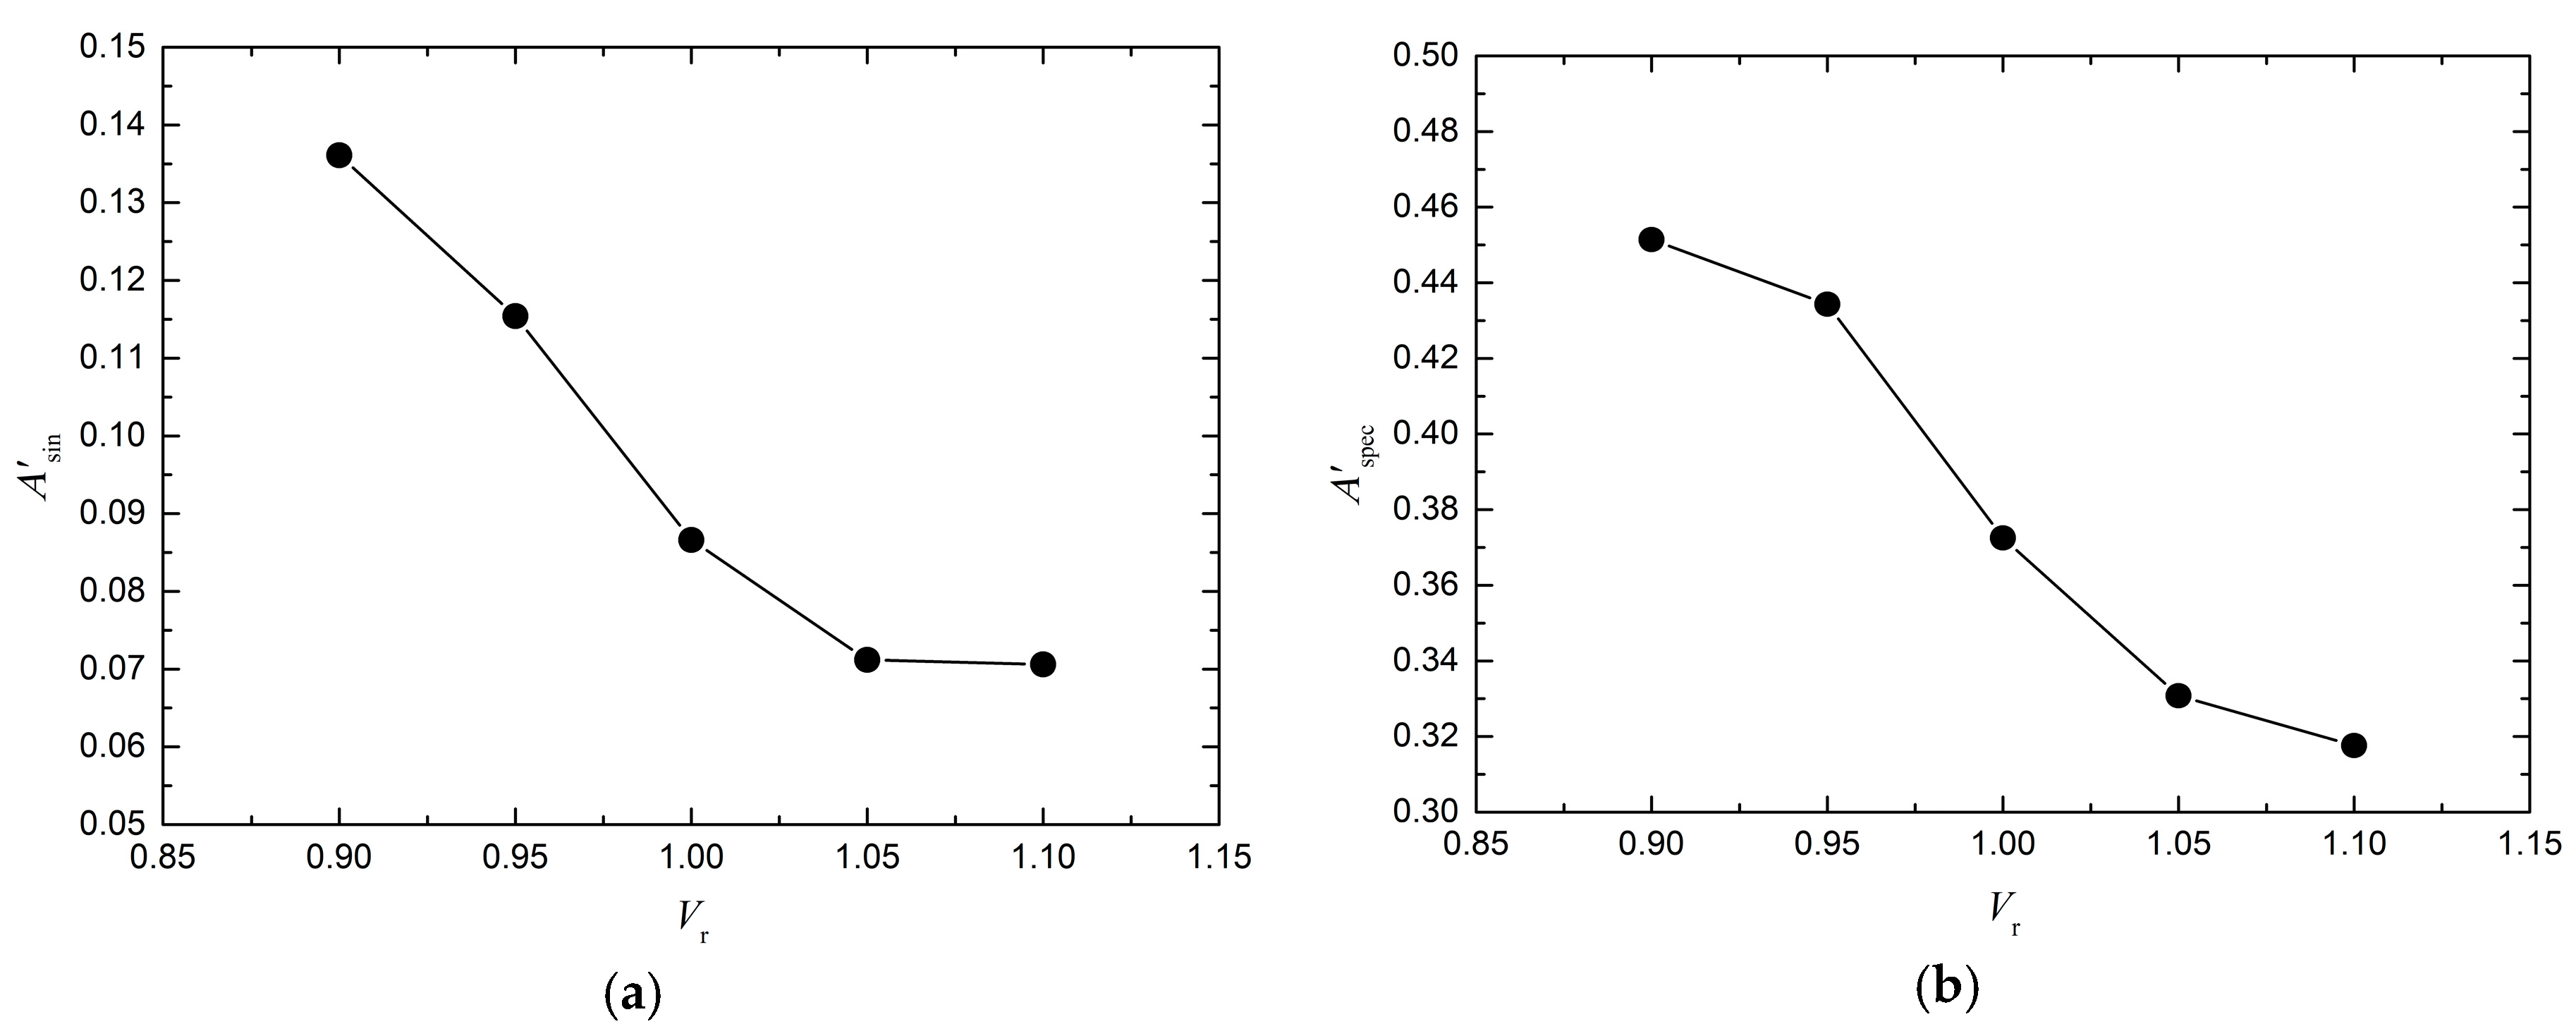
Figure 18.
Influence of filling coefficient on the amplitude of amplification coefficient: (a) Sinusoidal excitation; (b) Random excitation.
Figure 18.
Influence of filling coefficient on the amplitude of amplification coefficient: (a) Sinusoidal excitation; (b) Random excitation.
Table 1.
Random excitation loading conditions.
Table 2.
Random excitation loading conditions.
Table 2.
Random excitation loading conditions.
| Frequency Range | Power Spectral Density (g2/Hz) |
|---|
| 10–100 | 3 dB/oct |
| 100–200 | 0.08 |
| 600–2000 | −9 dB/oct |
| RMS acceleration | 8.1 g |
| Loading time | 1 min |
| Loading direction | Z |
Table 3.
Particle mass (Vr = 1, C2 Cavity).
Table 3.
Particle mass (Vr = 1, C2 Cavity).
| Particle Type | 2 mm Stainless Steel Particles | 2 mm Lead Particles | 300 Mesh Stainless Steel Powder | 32 Mesh Tungsten Carbide Powder |
|---|
| Particle mass (g) | 15.28 | 21.09 | 15.89 | 24.55 |
Table 4.
Mass of each component.
Table 4.
Mass of each component.
| Component Name | Mass (g) |
|---|
| Primary structure | 11070 |
| A1 cavity | 110 |
| A2 cavity | 151 |
| B1 cavity | 123 |
| B2 cavity | 161 |
| C1 cavity | 160 |
| C2 cavity | 198 |
| Cover | 24 |
| Adapter | 70 |
Table 5.
The effect of the cavity and the adapter: (a) Sinusoidal excitation; (b) Random excitation.
(a)
| Scheme Name | Additional Mass (g) | Additional Total Mass (Including Adapter) (g) | fsin | Asin |
|---|
| Sup_1 | 0 | 70 | 240.81 | 71.53 |
| A1 (without cover) | 110 | 180 | 237.80 | 68.30 |
| (−1.25%) | (−4.52%) |
| A1 | 158 | 228 | 236.89 | 68.20 |
| (−1.63%) | (−4.66%) |
| C1 | 208 | 278 | 233.42 | 64.24 |
| (−3.07%) | (−10.19%) |
| C2 (without cover) | 198 | 268 | 235.20 | 66.39 |
| (−2.33%) | (−7.19%) |
| C2 | 246 | 316 | 231.49 | 65.89 |
| (−3.87%) | (−7.88%) |
(b)
| Scheme Name | Additional Mass (g) | Additional Total Mass (Including Adapter) (g) | fspec | Grms | Aspec |
|---|
| Sup_1 | 0 | 72 | 240.00 | 48.48 | 62.73 |
| A1 (without cover) | 110 | 180 | 235.99 | 47.23 | 60.13 |
| (−1.67%) | (−2.58%) | (−4.14%) |
| A1 | 158 | 228 | 234.00 | 46.02 | 59.34 |
| (−2.50%) | (−5.07%) | (−5.40%) |
| C1 | 208 | 278 | 232.01 | 44.26 | 57.17 |
| (−3.33%) | (−8.70%) | (−8.86%) |
| C2 (without cover) | 198 | 268 | 234.00 | 44.27 | 58.81 |
| (−2.50%) | (−8.68%) | (−6.25%) |
| C2 | 246 | 316 | 232.01 | 43.35 | 56.78 |
| (−3.33%) | (−10.58%) | (−9.49%) |
Table 6.
Effect of layering in Z-direction of the cavity.
Table 6.
Effect of layering in Z-direction of the cavity.
| Scheme Name | Sinusoidal Excitation | Random Excitation |
|---|
| fsin | Asin | fspec | Grms | Aspec |
|---|
| Sup_1 | 240.81 | 71.53 | 240.00 | 48.48 | 62.73 |
| A1_Fe_0.9 | 236.81 | 39.91 | 235.01 | 37.02 | 43.67 |
| (−1.66%) | (−44.21%) | (−2.08%) | (−23.64%) | (−30.39%) |
| B1_Fe_0.9 | 235.70 | 43.23 | 234.00 | 44.02 | 50.34 |
| (−2.12%) | (−39.57%) | (−2.50%) | (−26.61%) | (−40.10%) |
| C1_Fe_0.9 | 234.72 | 41.63 | 232.01 | 42.26 | 47.17 |
| (−2.53%) | (−41.80%) | (−2.50%) | (−30.72%) | (−46.50%) |
| A1_WC_0.9 | 235.05 | 9.80 | 234.00 | 44.27 | 52.81 |
| (−2.39%) | (−86.30%) | (−1.67%) | (−36.20%) | (−52.14%) |
| B1_WC_0.9 | 235.70 | 32.89 | 232.01 | 40.35 | 44.78 |
| (−2.12%) | (−54.02%) | (−2.08%) | (−31.42%) | (−46.29%) |
| C1_WC_0.9 | 233.61 | 31.77 | 234.00 | 32.58 | 30.74 |
| (−2.99%) | (−54.19%) | (−2.50%) | (−32.79%) | (−50.99%) |
Table 7.
Effect of layering in Y-direction of the cavity.
Table 7.
Effect of layering in Y-direction of the cavity.
| Scheme Name | Sinusoidal Excitation | Random Excitation |
|---|
| fsin | Asin | fsepc | Grms | Asepc |
|---|
| Sup_1 | 240.81 | 71.53 | 240.00 | 48.48 | 62.73 |
| C1_304_0.9 | 234.72 | 41.63 | 234.00 | 33.59 | 33.56 |
| (−2.53%) | (−41.80%) | (−2.50%) | (−30.72%) | (−46.50%) |
| C2_304_0.9 | 233.61 | 28.06 | 233.33 | 29.70 | 23.37 |
| (−2.99%) | (−60.77%) | (−2.78%) | (−38.73%) | (−62.74%) |
| C1_WC_0.9 | 233.61 | 37.77 | 234.00 | 32.58 | 30.74 |
| (−2.99%) | (−47.19%) | (−2.50%) | (−32.79%) | (−50.99%) |
| C2_WC_0.9 | 232.60 | 31.31 | 234.00 | 29.78 | 23.08 |
| (−3.41%) | (−56.23%) | (−2.50%) | (−38.58%) | (−63.20%) |
Table 8.
Optimal cavity analysis.
Table 8.
Optimal cavity analysis.
| Scheme Name | Sinusoidal Excitation | Random Excitation |
|---|
| fsin | Asin | fspec | Grms | Aspec |
|---|
| Sup_1 | 240.81 | 71.53 | 240.00 | 48.48 | 62.73 |
| A1_Pb_0.9 | 236.07 | 37.61 | 234.00 | 33.84 | 34.43 |
| (−1.97%) | (−47.42%) | (−2.50%) | (−30.19%) | (−45.12%) |
| A2_Pb_0.9 | 234.69 | 17.79 | 234.00 | 29.56 | 24.44 |
| (−2.54%) | (−75.13%) | (−2.50%) | (−39.03%) | (−61.04%) |
| A1_304_0.9 | 236.81 | 39.91 | 235.01 | 37.02 | 43.67 |
| (−1.66%) | (−44.21%) | (−2.08%) | (−23.64%) | (−30.39%) |
| A2_304_0.9 | 234.69 | 37.53 | 234.00 | 32.28 | 28.84 |
| (−2.54%) | (−47.53%) | (−2.50%) | (−33.42%) | (−54.03%) |
| A1_WC_0.9 | 235.03 | 9.74 | 235.99 | 31.10 | 28.32 |
| (−2.40%) | (−86.39%) | (−1.67%) | (−35.84%) | (−54.86%) |
| A2_WC_0.9 | 227.40 | 6.79 | 234.00 | 25.70 | 13.91 |
| (−5.57%) | (−90.51%) | (−2.50%) | (−46.99%) | (−77.82%) |
Table 9.
Effect of particle/powder material.
Table 9.
Effect of particle/powder material.
| Scheme Name | Harmonic Excitation | Random Excitation |
|---|
| fsin | Asin | fspec | Grms | Aspec |
|---|
| Sup_1 | 240.81 | 71.53 | 240.00 | 48.48 | 62.73 |
| A1_Fe_0.9 | 236.81 | 39.91 | 235.01 | 37.02 | 43.67 |
| (−1.66%) | (−44.21%) | (−2.08%) | (−23.64%) | (−30.39%) |
| A1_Pb_0.9 | 236.07 | 37.61 | 234.00 | 33.84 | 34.43 |
| (−1.97%) | (−47.42%) | (−2.50%) | (−30.19%) | (−45.12%) |
A1_Fe
(p)_0.9 | 235.70 | 32.06 | 234.00 | 32.42 | 31.58 |
| (−2.12%) | (−55.18%) | (−2.50%) | (−33.13%) | (−49.65%) |
| A1_WC_0.9 | 235.05 | 9.80 | 235.99 | 30.93 | 30.02 |
| (−2.39%) | (−86.30%) | (−1.67%) | (−36.20%) | (−52.14%) |
Table 10.
Tungsten carbide powder mass.
Table 10.
Tungsten carbide powder mass.
| Scheme Name | Cavity Mass (g) | Powder Mass (g) | Additional Total Mass (Including Adapter) (g) |
|---|
| Sup_1 | 0 | 0 | 72 |
| A1_WC_0.9 | 158 | 662.85 | 890.85 |
| A1_WC_0.95 | 158 | 699.68 | 927.68 |
| A1_WC_1.00 | 158 | 736.50 | 964.50 |
| A1_WC_1.05 | 158 | 773.325 | 1001.325 |
| A1_WC_1.10 | 158 | 810.15 | 1038.15 |
Table 11.
Effect of tungsten carbide powder filling coefficient.
Table 11.
Effect of tungsten carbide powder filling coefficient.
| Scheme Name | Harmonic Excitation | Random Excitation |
|---|
| fsin | Asin | fspec | Grms | Aspec |
|---|
| Sup_1 | 240.81 | 71.53 | 240.00 | 48.48 | 62.73 |
| A1_WC_0.9 | 235.03 | 9.74 | 235.99 | 31.10 | 28.32 |
| (−2.40%) | (−86.39%) | (−1.67%) | (−35.84%) | (−54.86%) |
| A1_WC_0.95 | 234.14 | 8.25 | 234.00 | 30.77 | 27.24 |
| (−2.77%) | (−88.46%) | (−2.50%) | (−36.54%) | (−56.57%) |
| A1_WC_1.00 | 231.01 | 6.19 | 235.01 | 29.69 | 23.37 |
| (−4.07%) | (−91.34%) | (−2.08%) | (−38.75%) | (−62.75%) |
| A1_WC_1.05 | 230.46 | 5.09 | 235.01 | 28.68 | 20.75 |
| (−4.30%) | (−92.88%) | (−2.08%) | (−40.85%) | (−66.92%) |
| A1_WC_1.10 | 229.95 | 5.05 | 235.99 | 28.55 | 19.92 |
| (−4.51%) | (−92.94%) | (−1.67%) | (−41.12%) | (−68.24%) |
Table 12.
Effect of particle filling coefficient.
Table 12.
Effect of particle filling coefficient.
| Scheme Name | Harmonic Excitation | Random Excitation |
|---|
| fsin | Asin | fspec | Grms | Aspec |
|---|
| Sup_1 | 240.81 | 71.53 | 240.00 | 48.48 | 62.73 |
| A1_Pb_0.9 | 236.07 | 37.61 | 234.00 | 33.84 | 34.43 |
| (−1.97%) | (−47.42%) | (−2.50%) | (−30.19%) | (−45.12%) |
| A1_Pb_1.05 | 236.07 | 26.88 | 235.99 | 32.35 | 29.87 |
| (−1.97%) | (−62.42%) | (−1.67%) | (−33.27%) | (−52.38%) |
| A1_Fe_0.9 | 236.81 | 39.91 | 235.01 | 37.02 | 43.67 |
| (−1.66%) | (−44.21%) | (−2.08%) | (−23.64%) | (−30.39%) |
| A1_Fe_1.05 | 235.73 | 26.03 | 235.34 | 34.65 | 36.52 |
| (−2.11%) | (−63.61%) | (−1.94%) | (−28.53%) | (−41.79%) |


