Influence of Polypropylene Fiber on Tensile Property of a Cement-Polymer Based Thin Spray-On Liner

 , , ,
, , ,
Abstract
1. Introduction
1.1. Development of Thin Spray-On Liners
- Rapid curing rate and ability to reach adequate mechanical properties within a few hours after application;
- Low rebound amount and wastage during spraying process;
- Wide displacement range (elongation ratio);
- Ease and rapid rate of application;
- Smaller spraying equipment than that required for other liners;
- Less material handling with respect to other ground support products;
- Decrease in the operating costs;
- Lower thickness of applied material with respect to other surface support systems.
1.2. Support Provided by TSLs
1.3. Fiber-Reinforced Materials and Fiber-Reinforced TSLs
2. Material and Methods
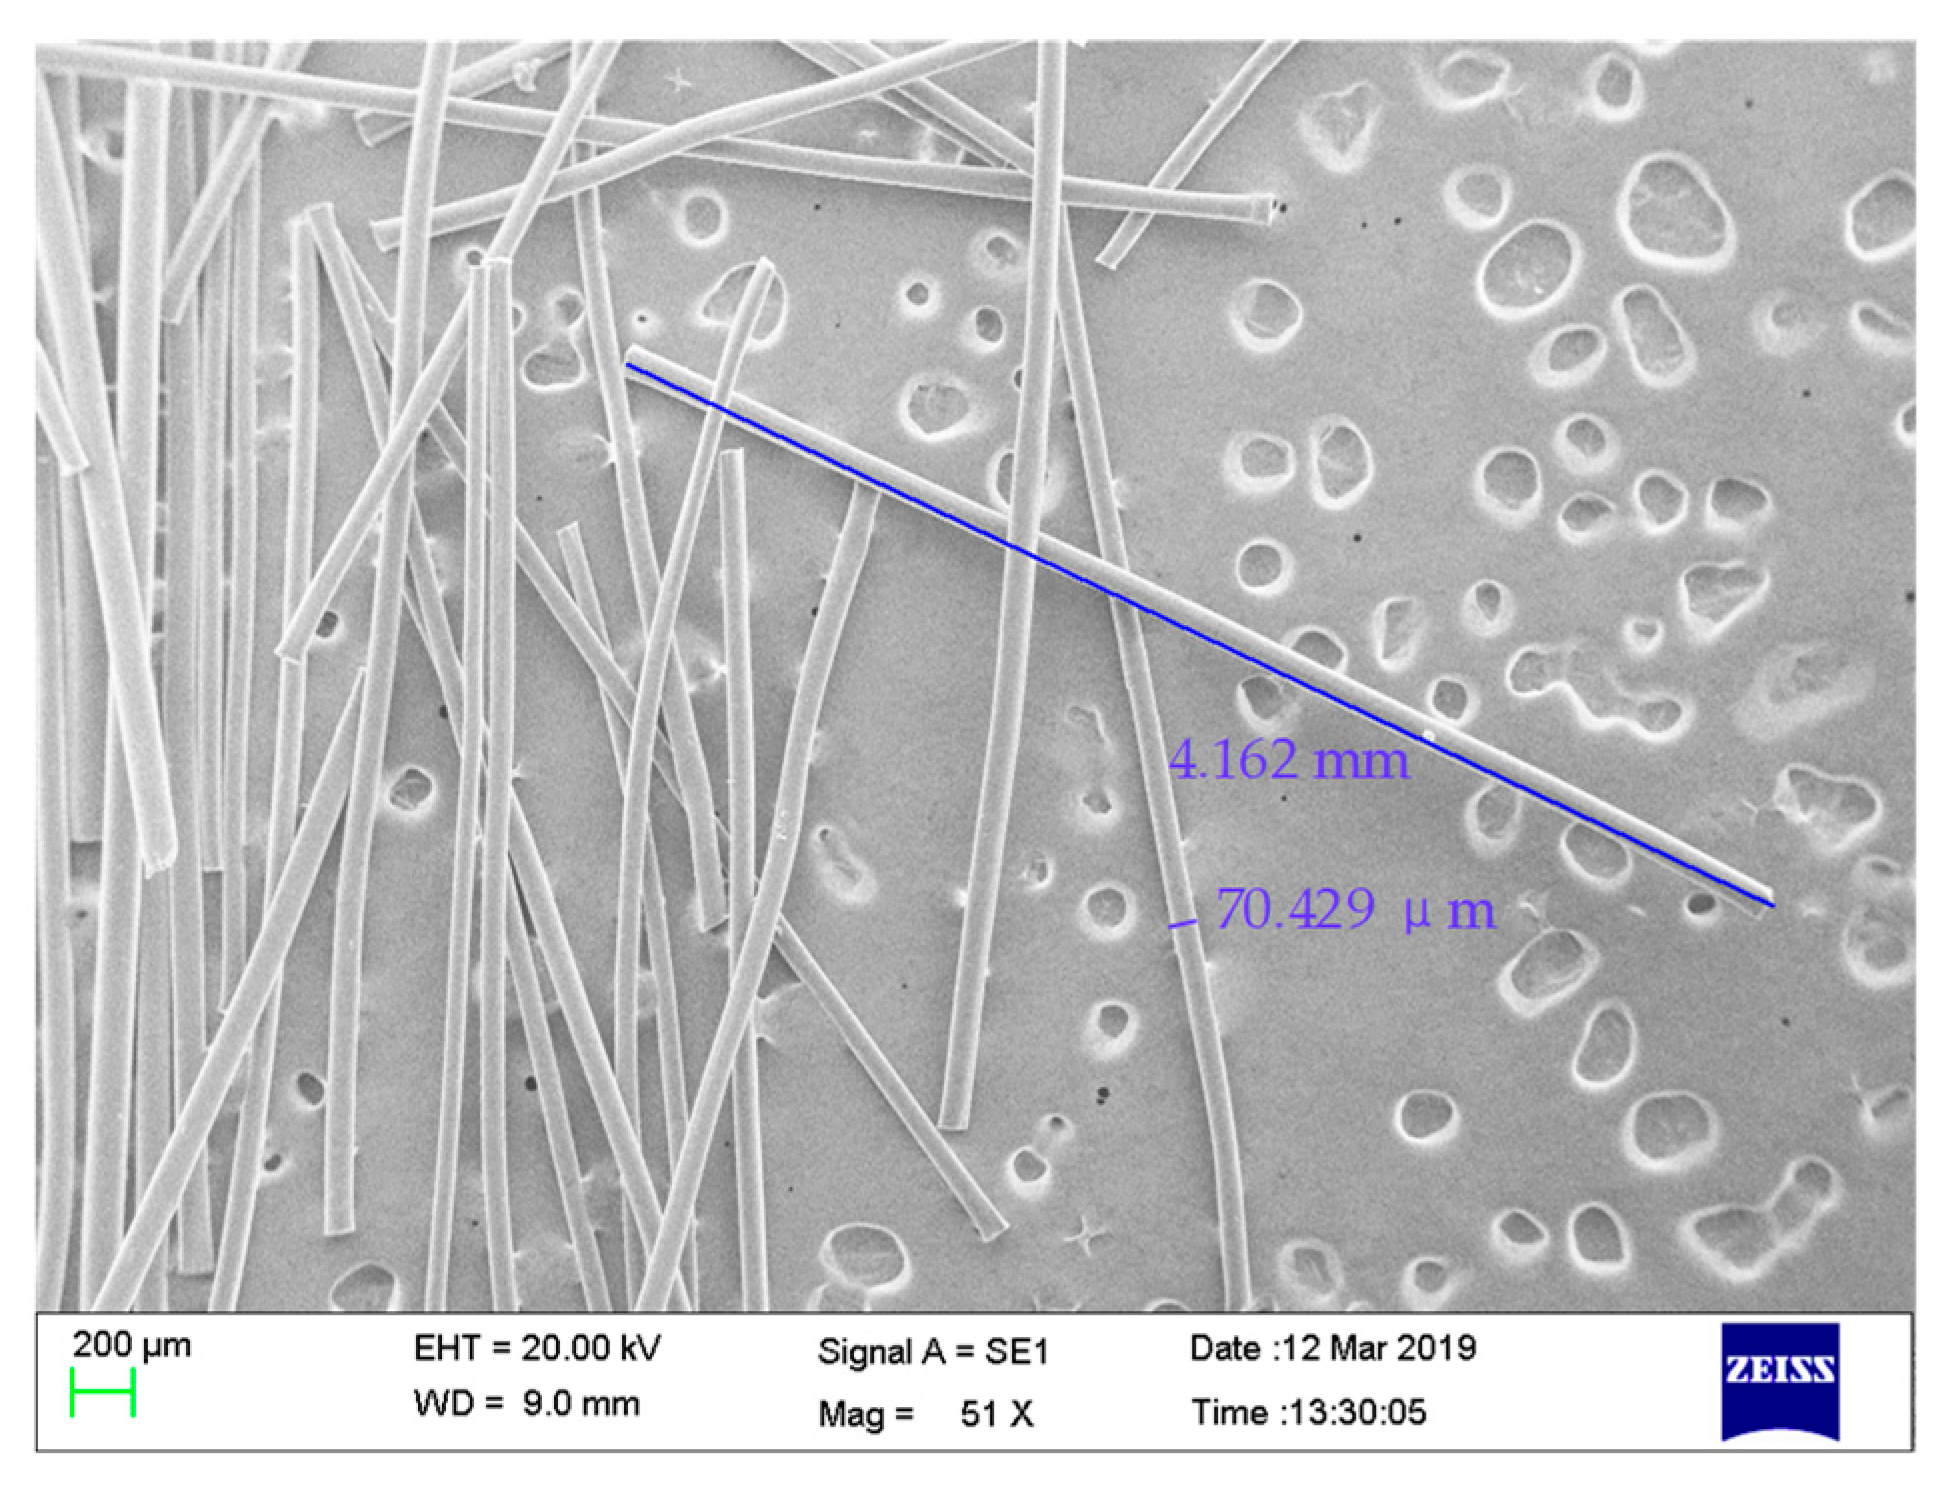
2.1. Cementitious Polymer and Polypropylene Fibers
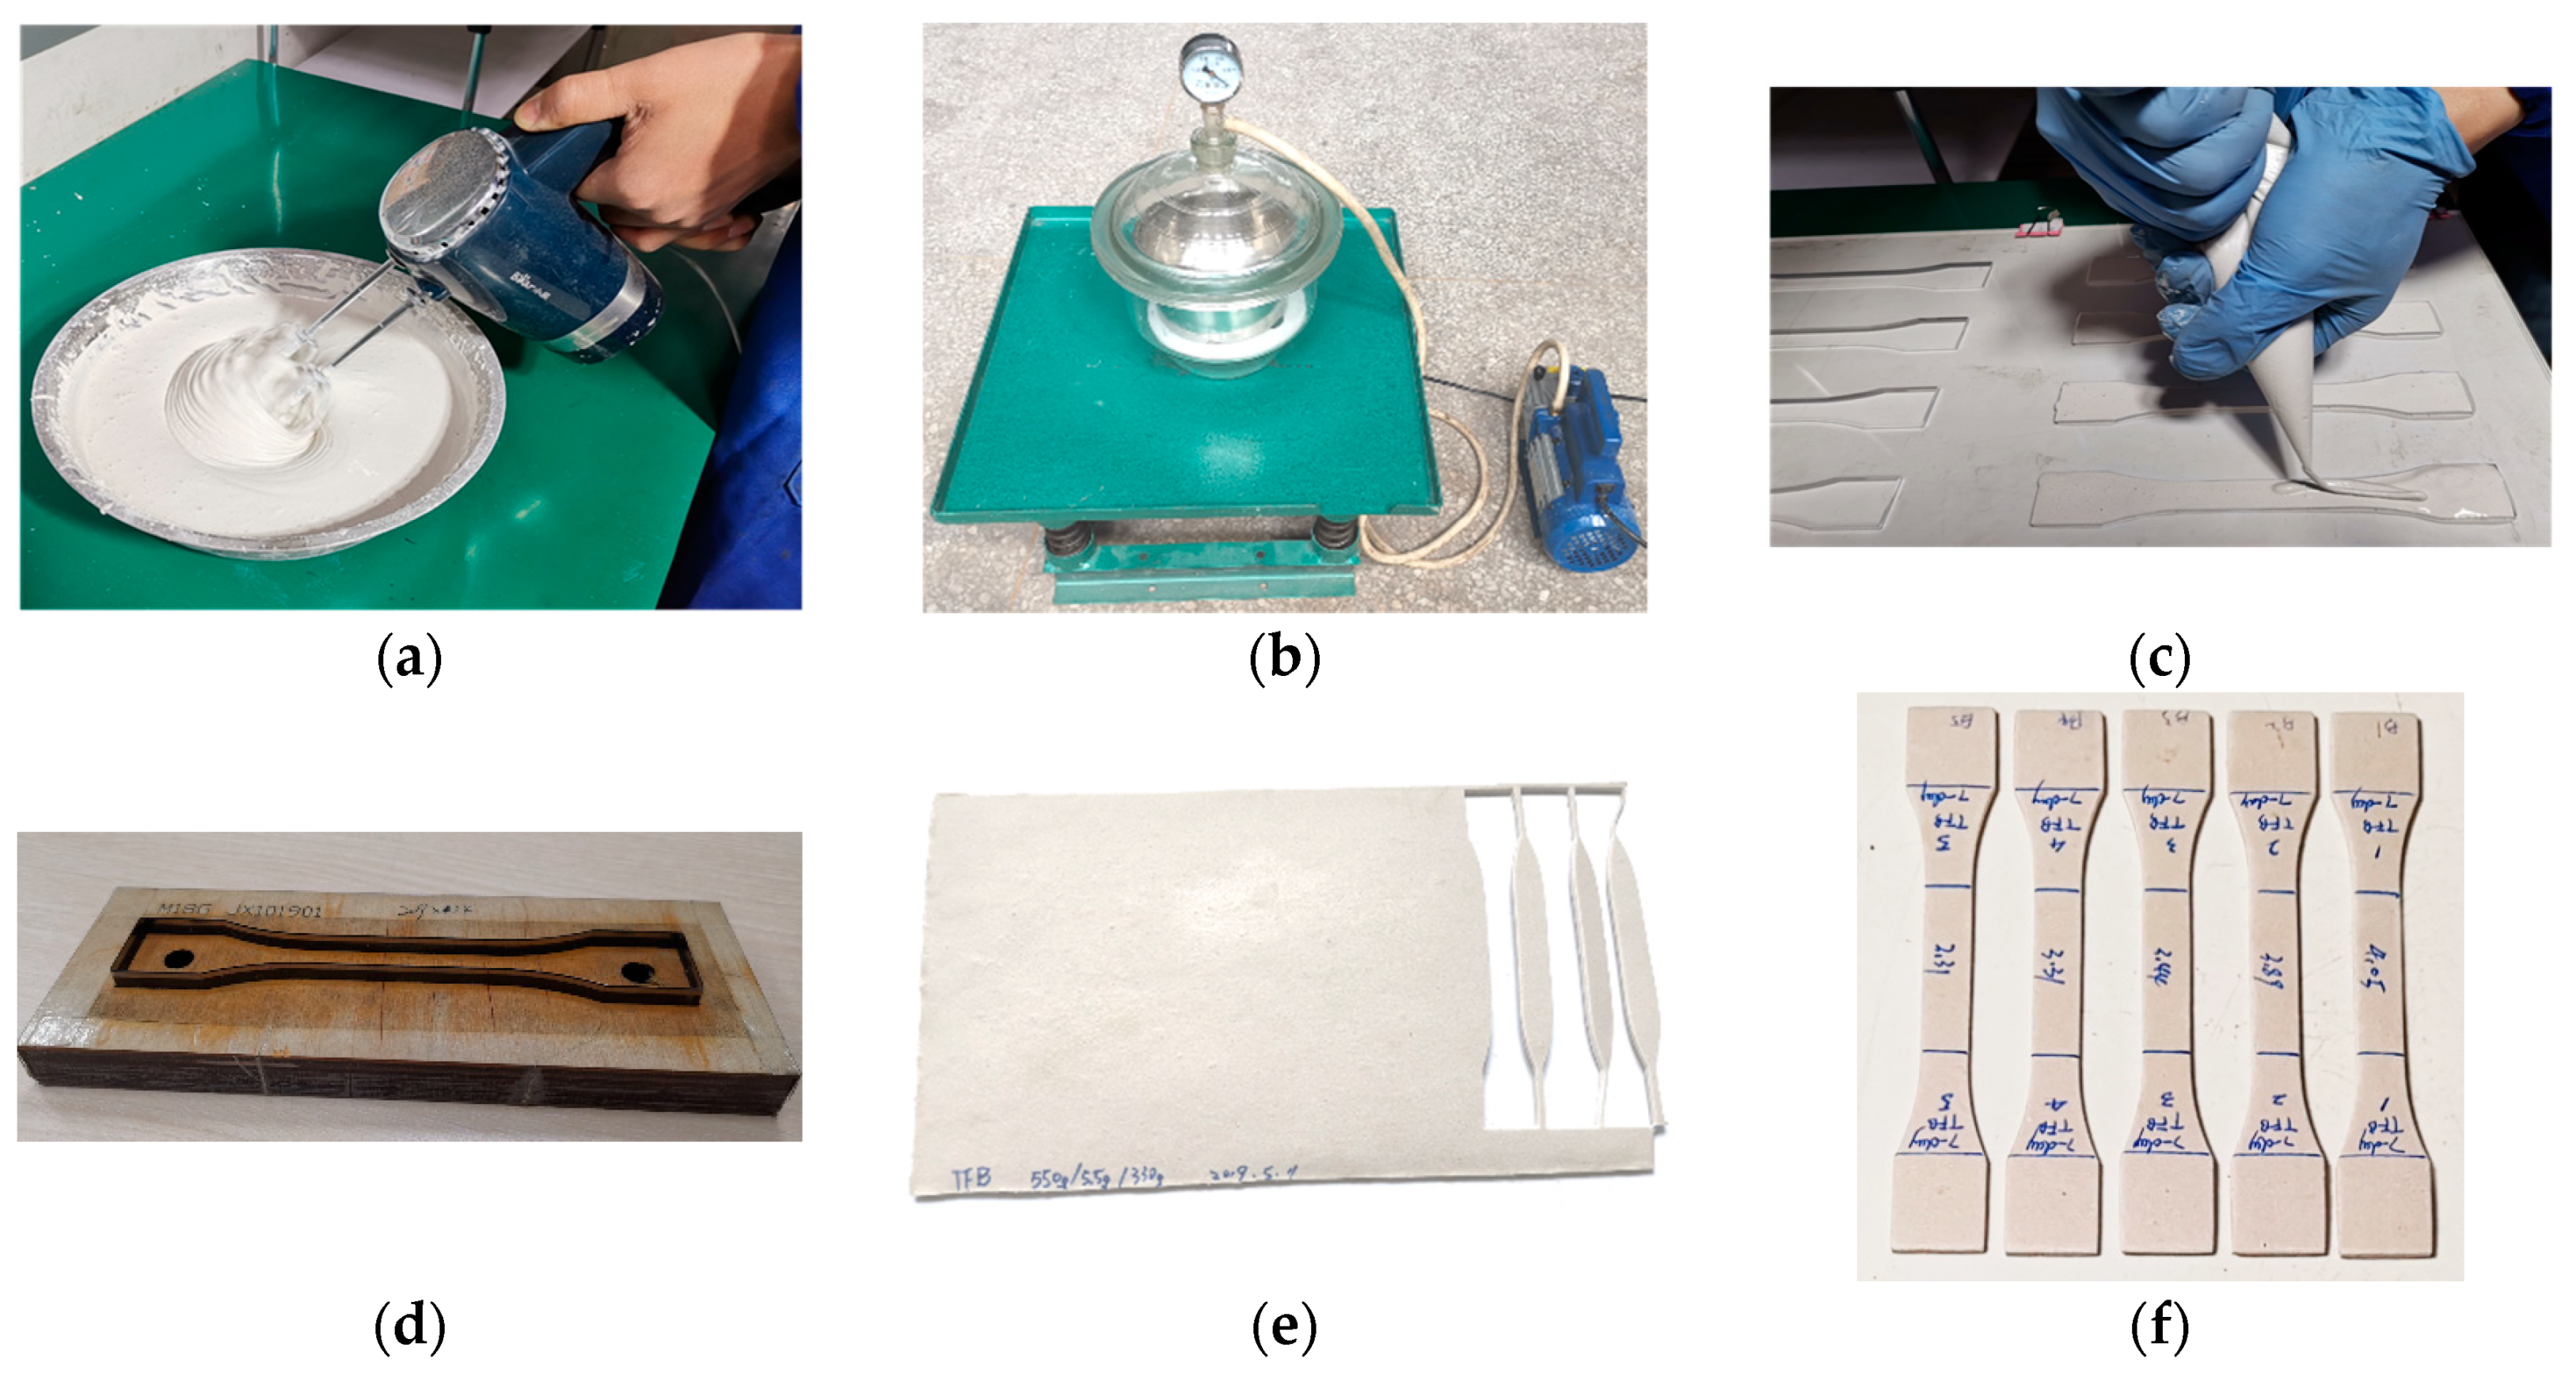
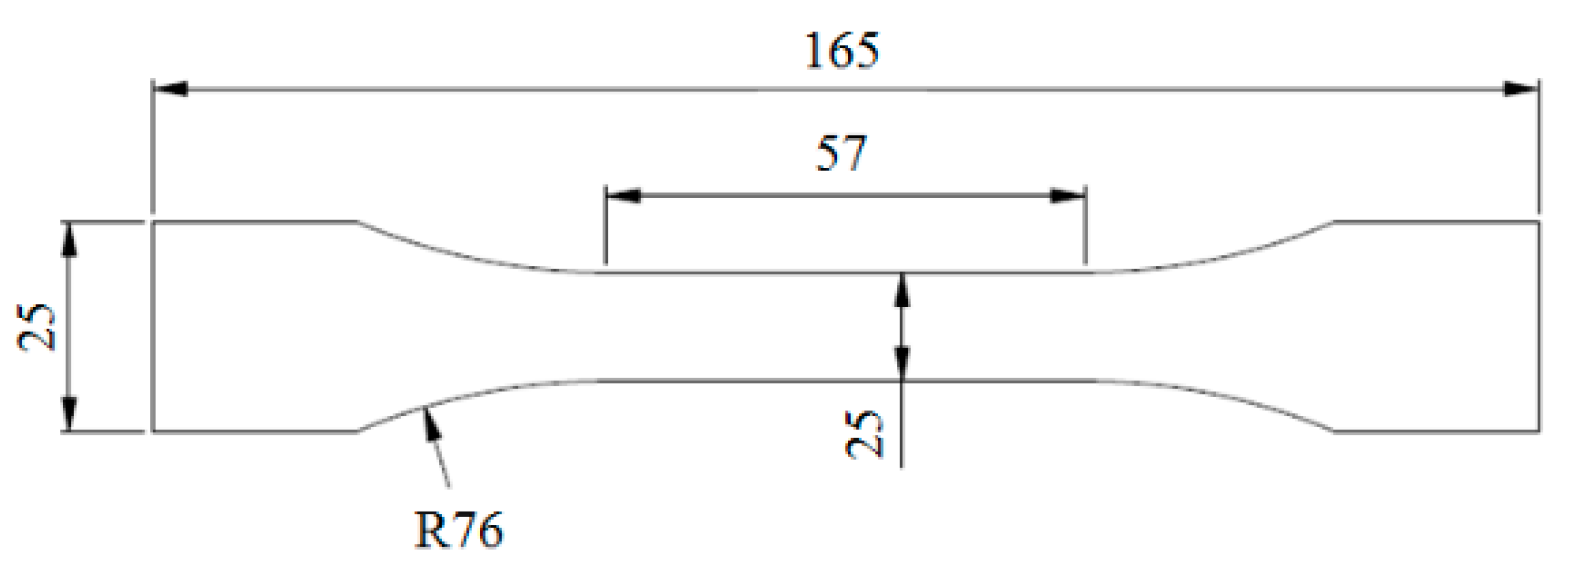
2.2. Sample Preparation
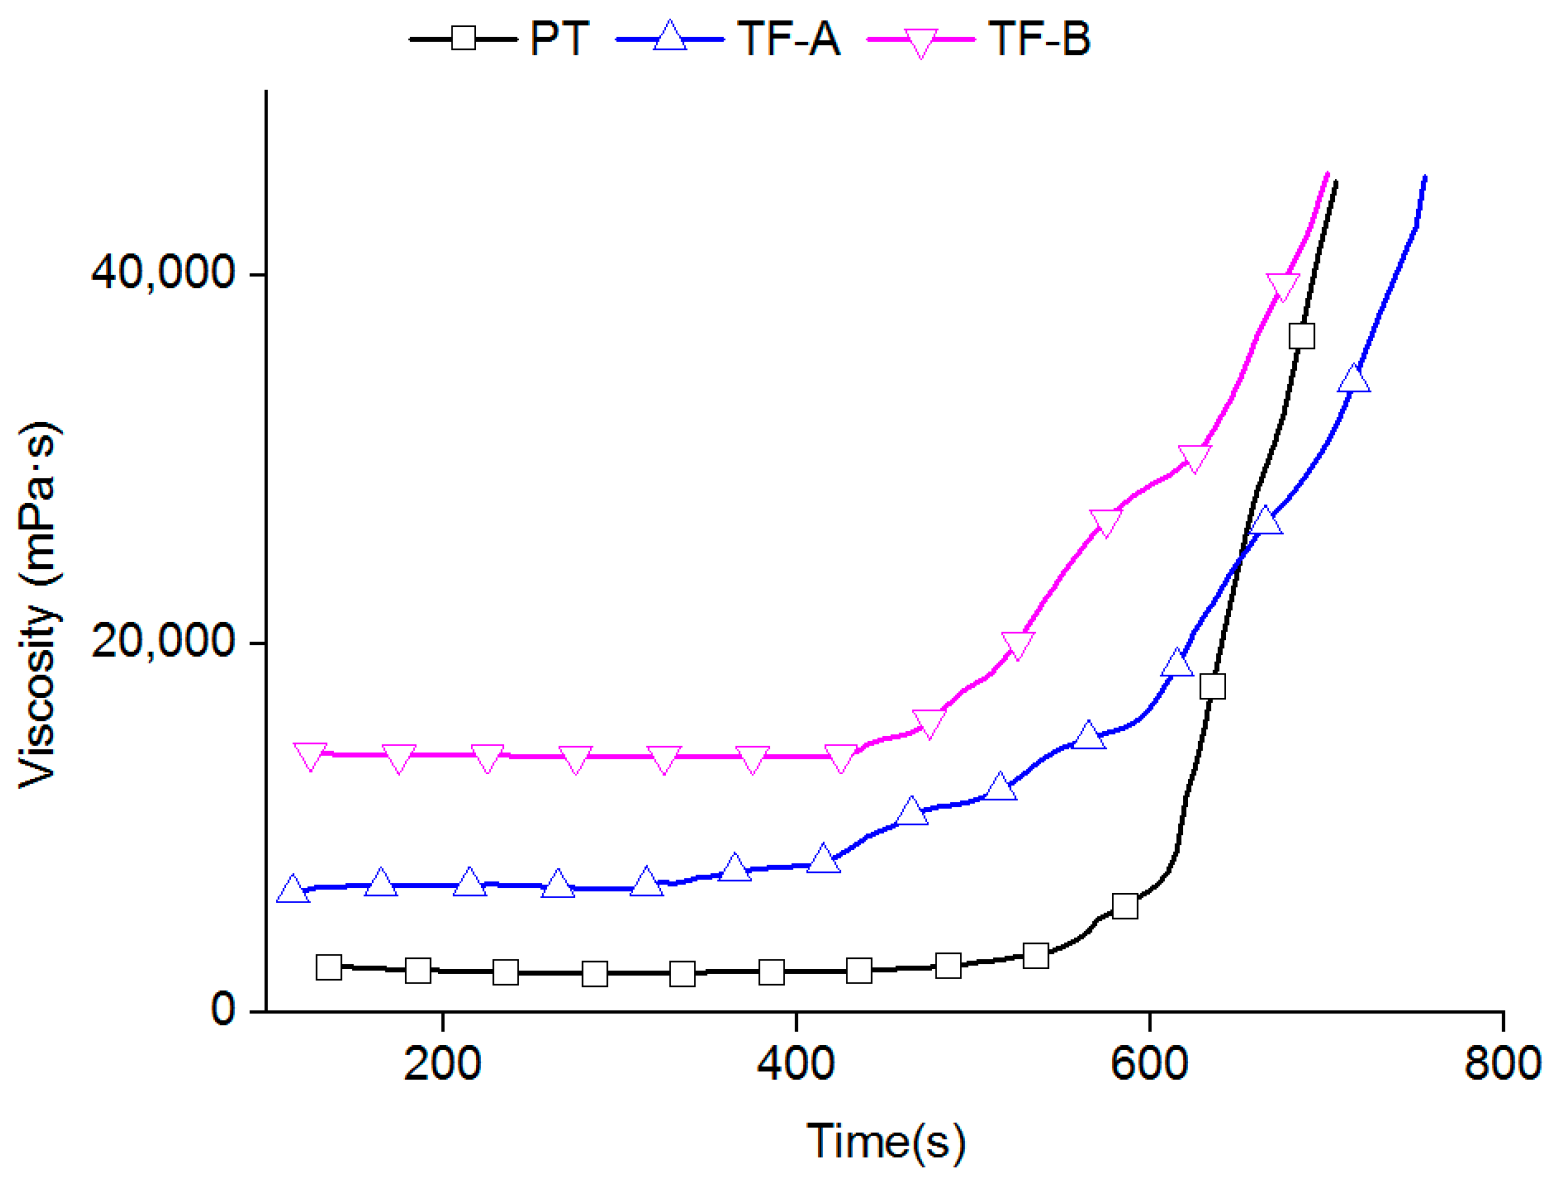
2.3. Viscosity
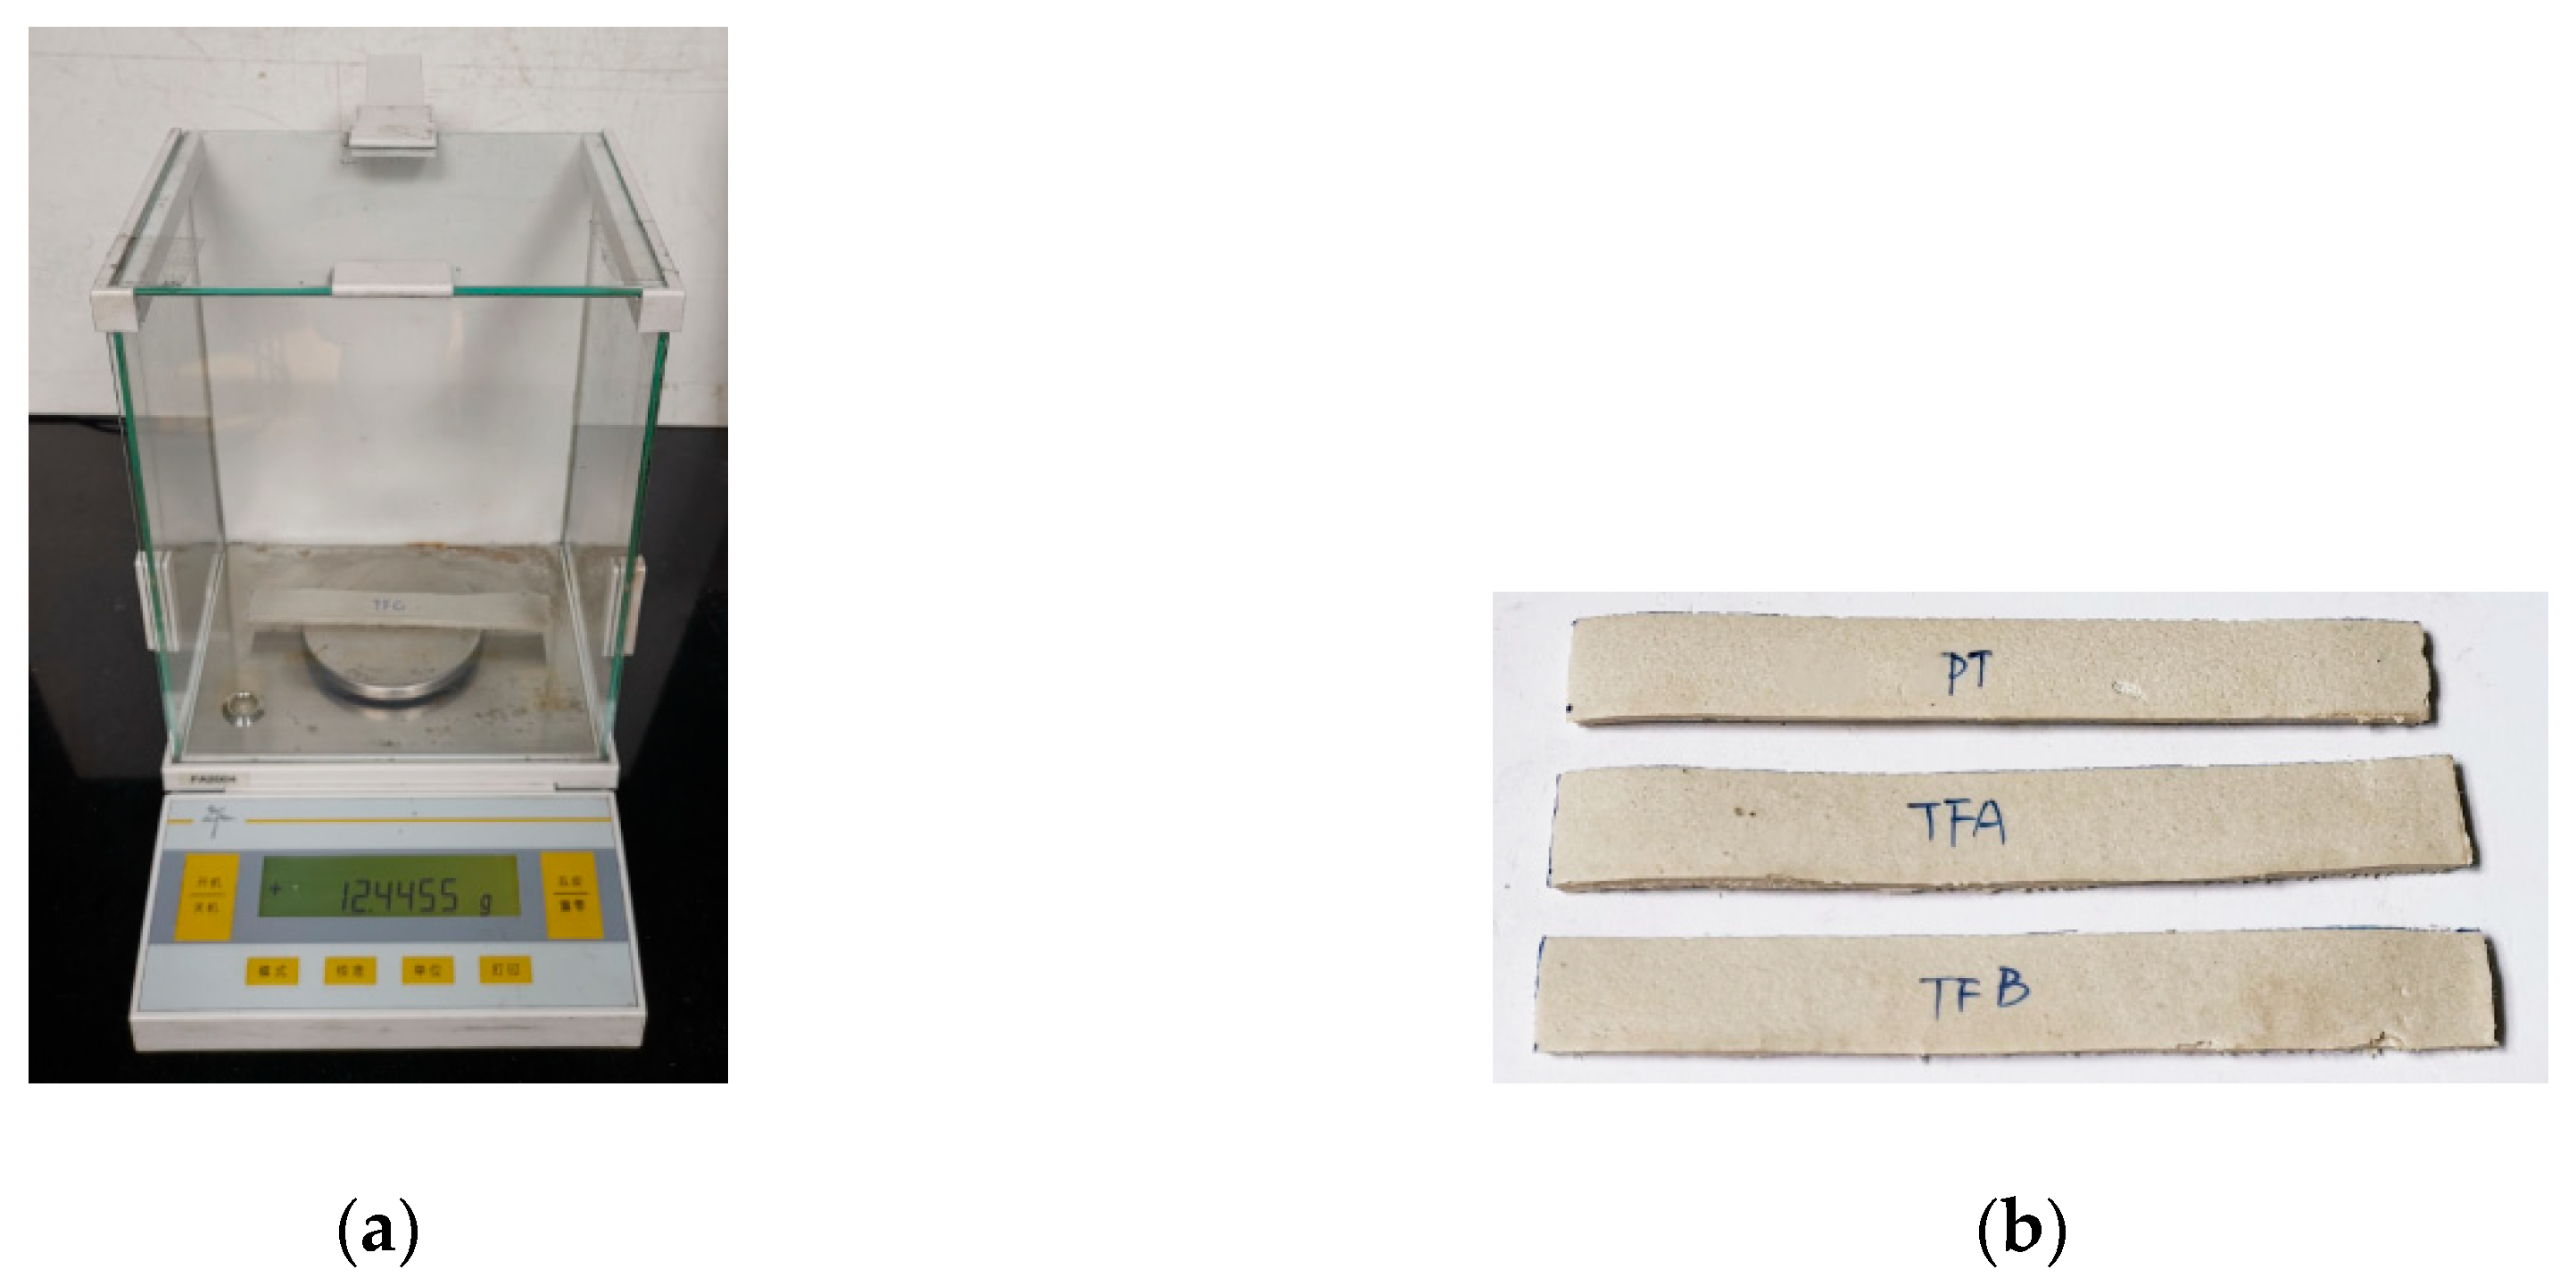
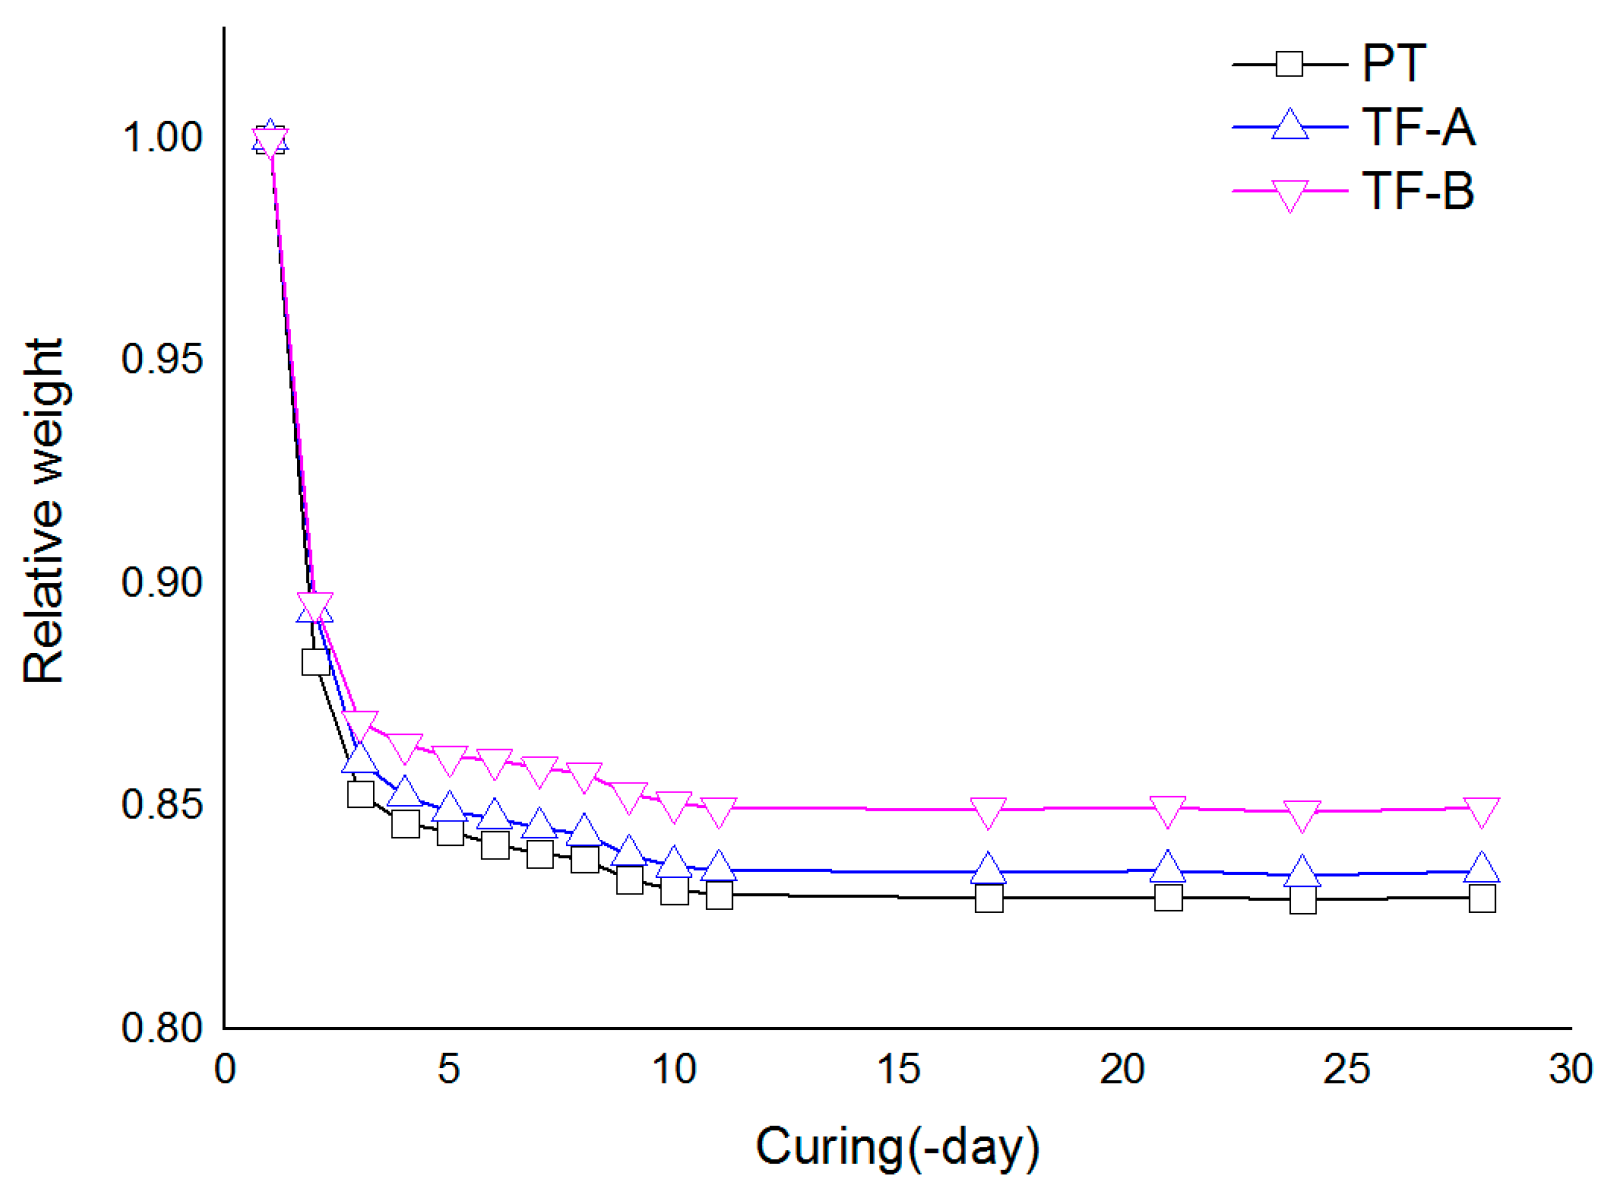
2.4. Water Loss
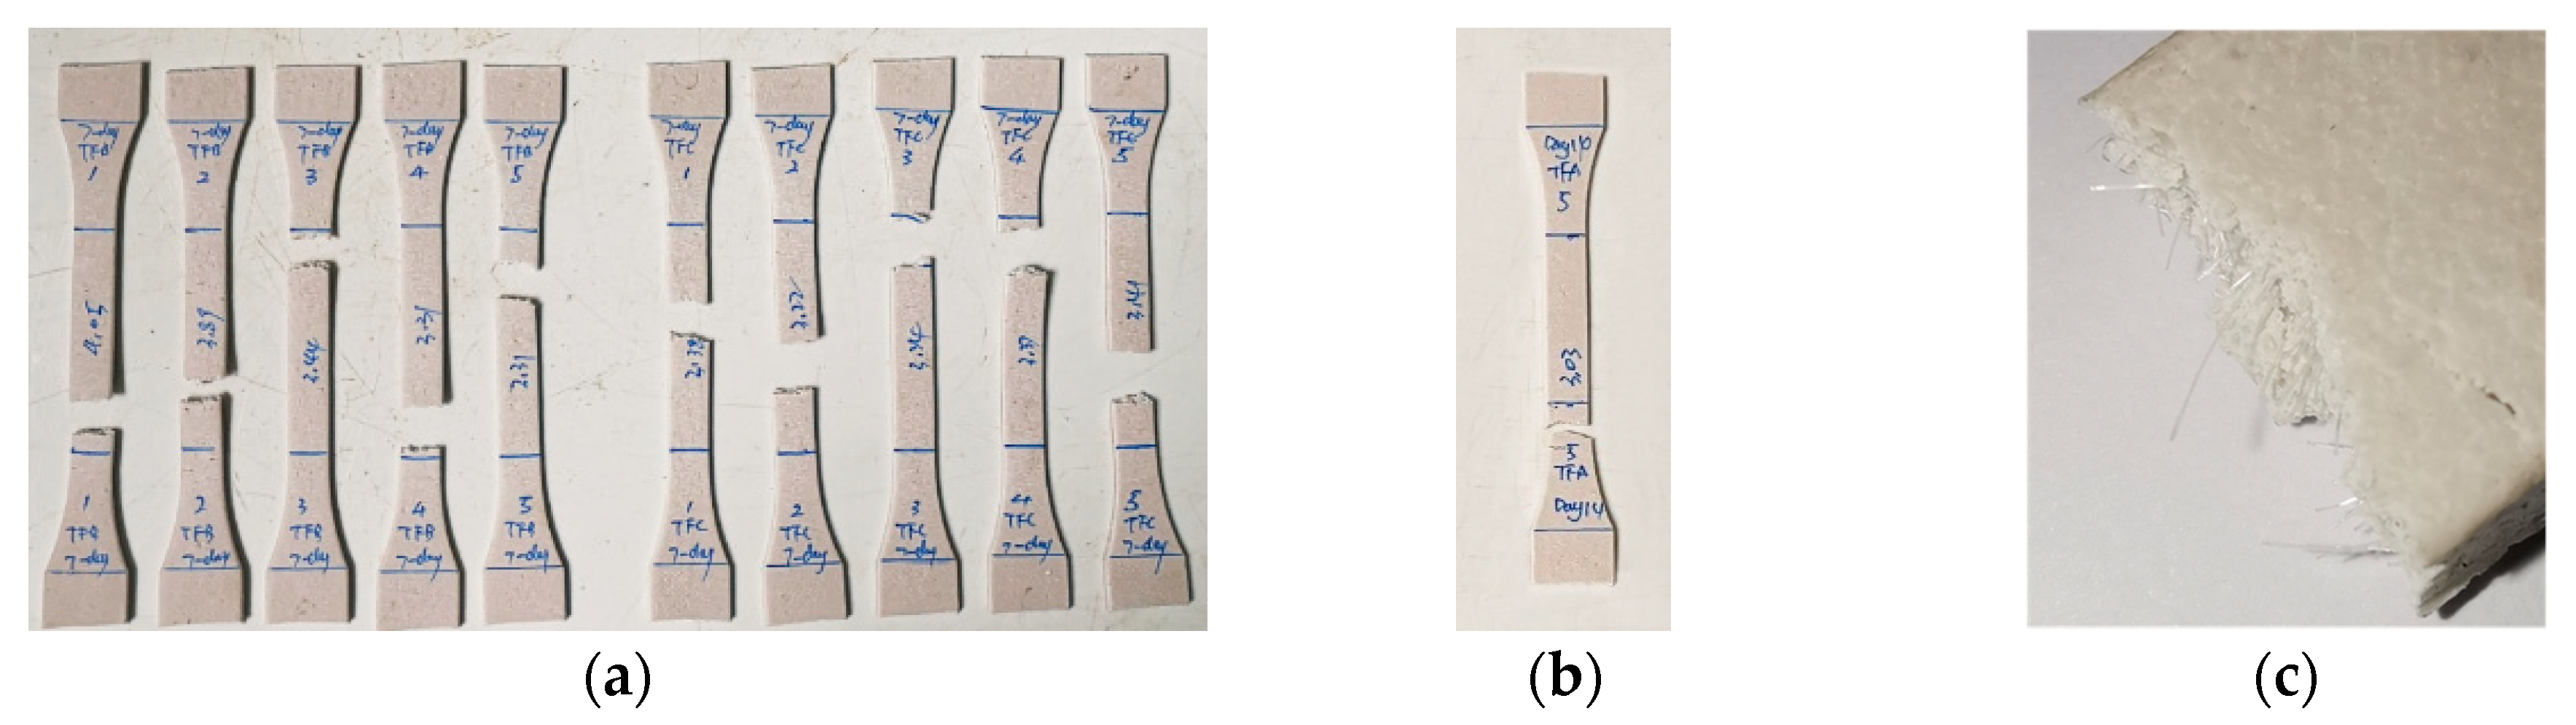
2.5. Tensile Strength, Elongation at Break and Tensile Toughness
2.6. SEM Analysis
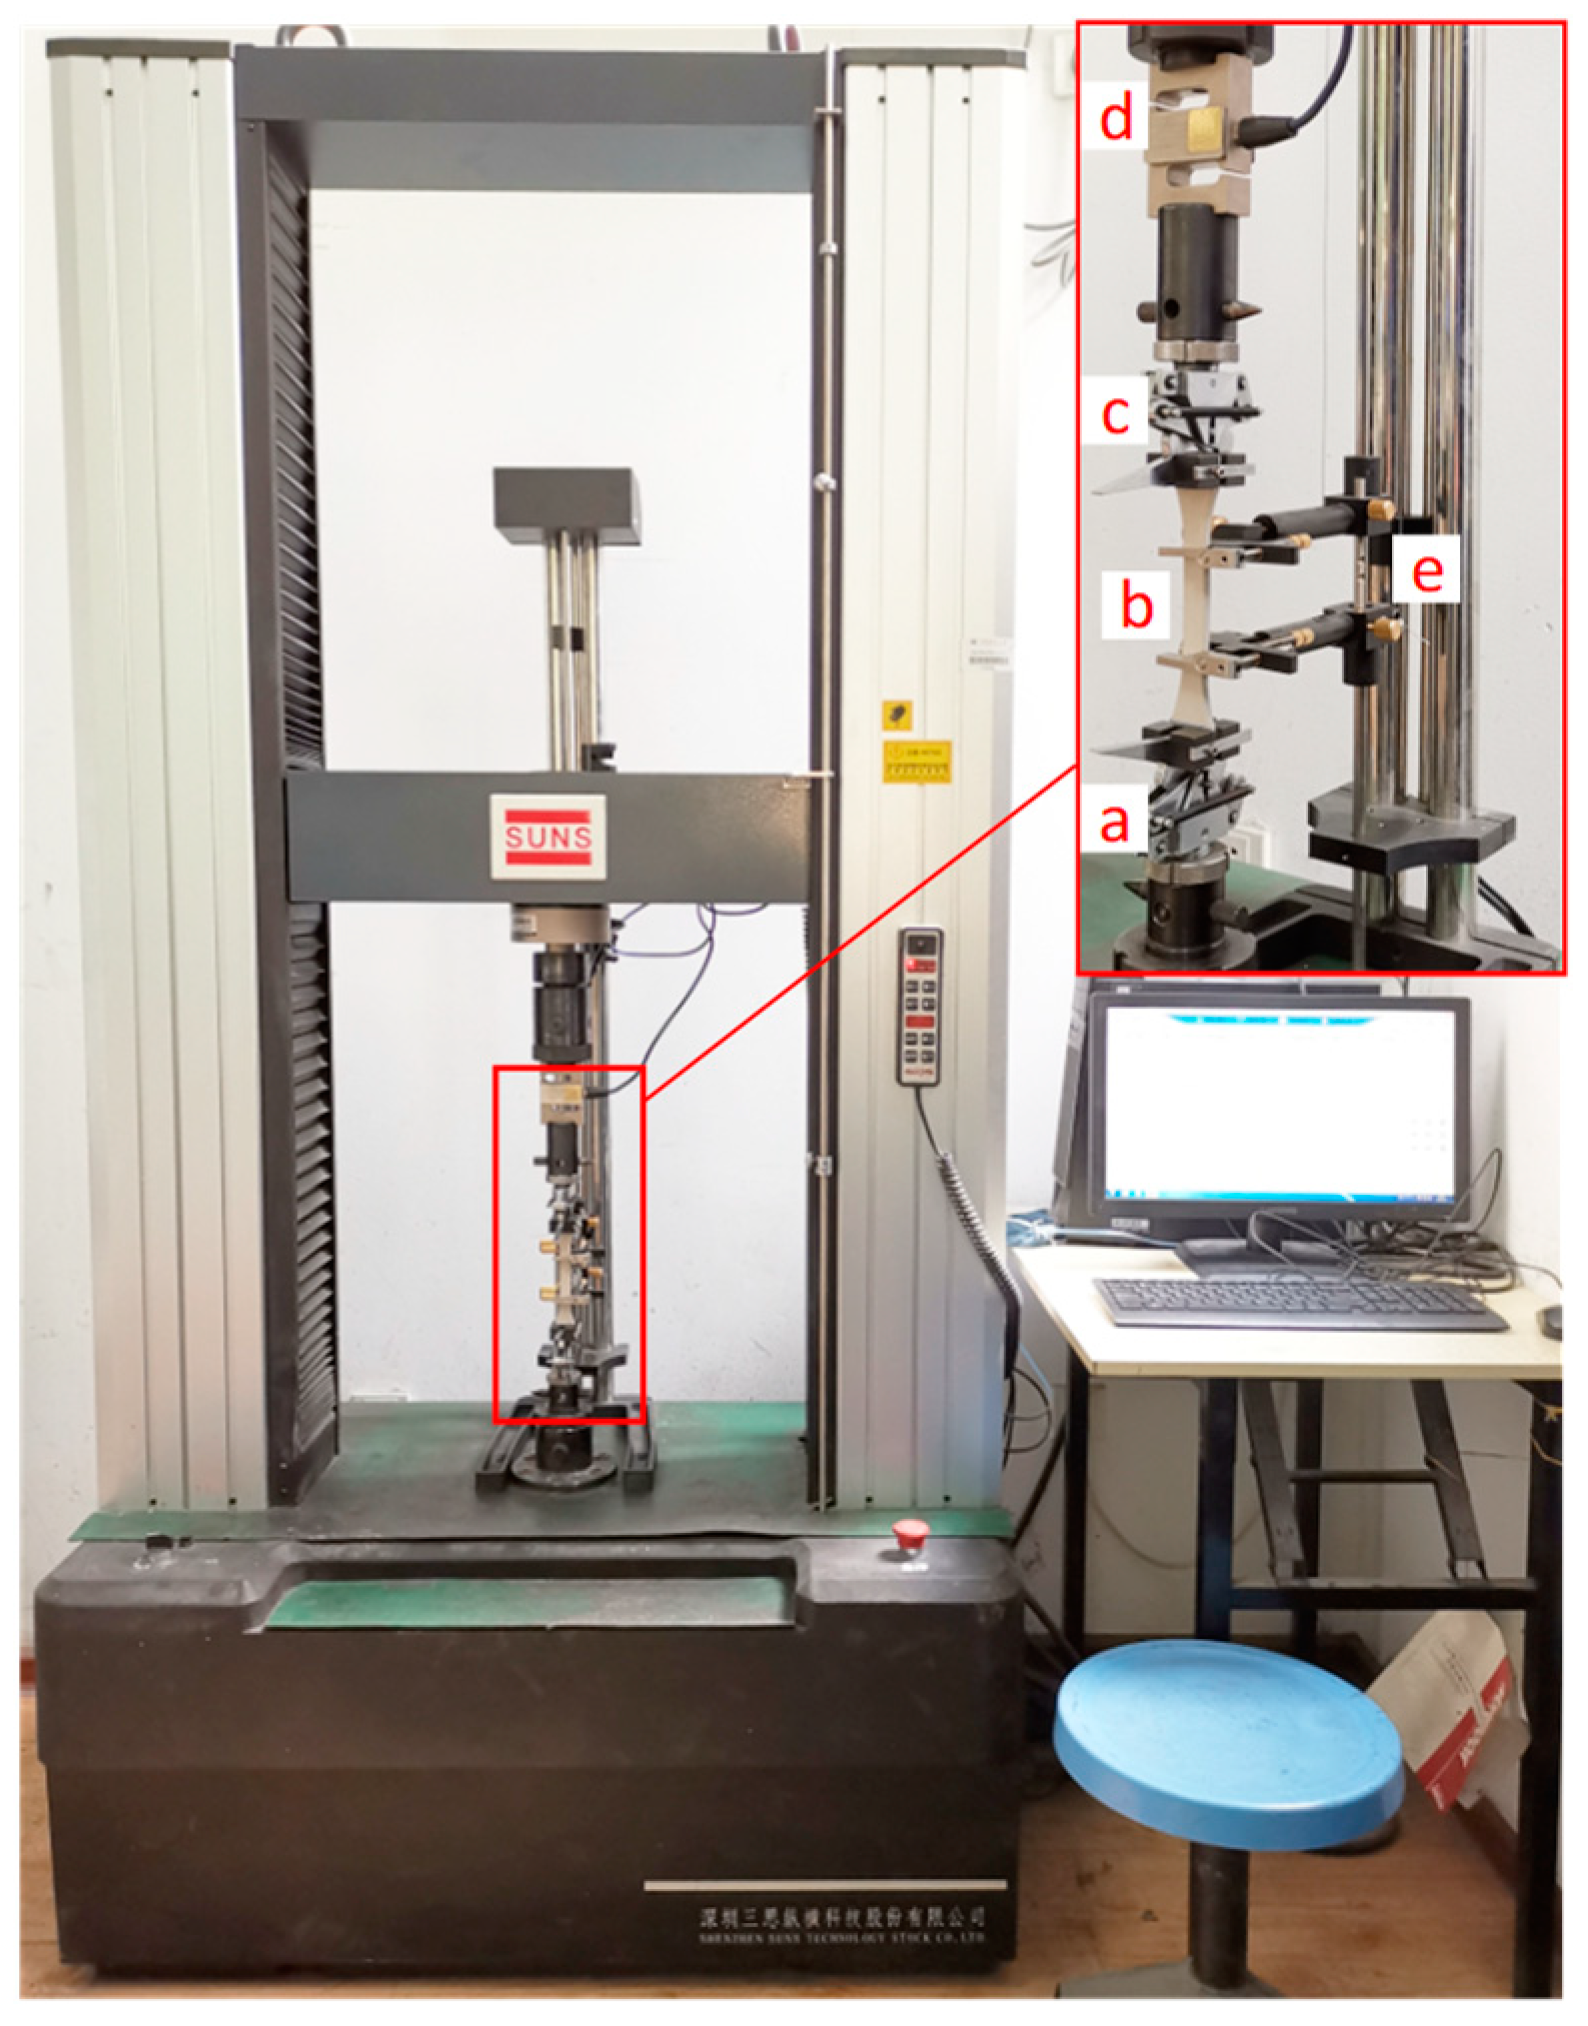
3. Test Setup and Execution
4. Test Results and Discussions
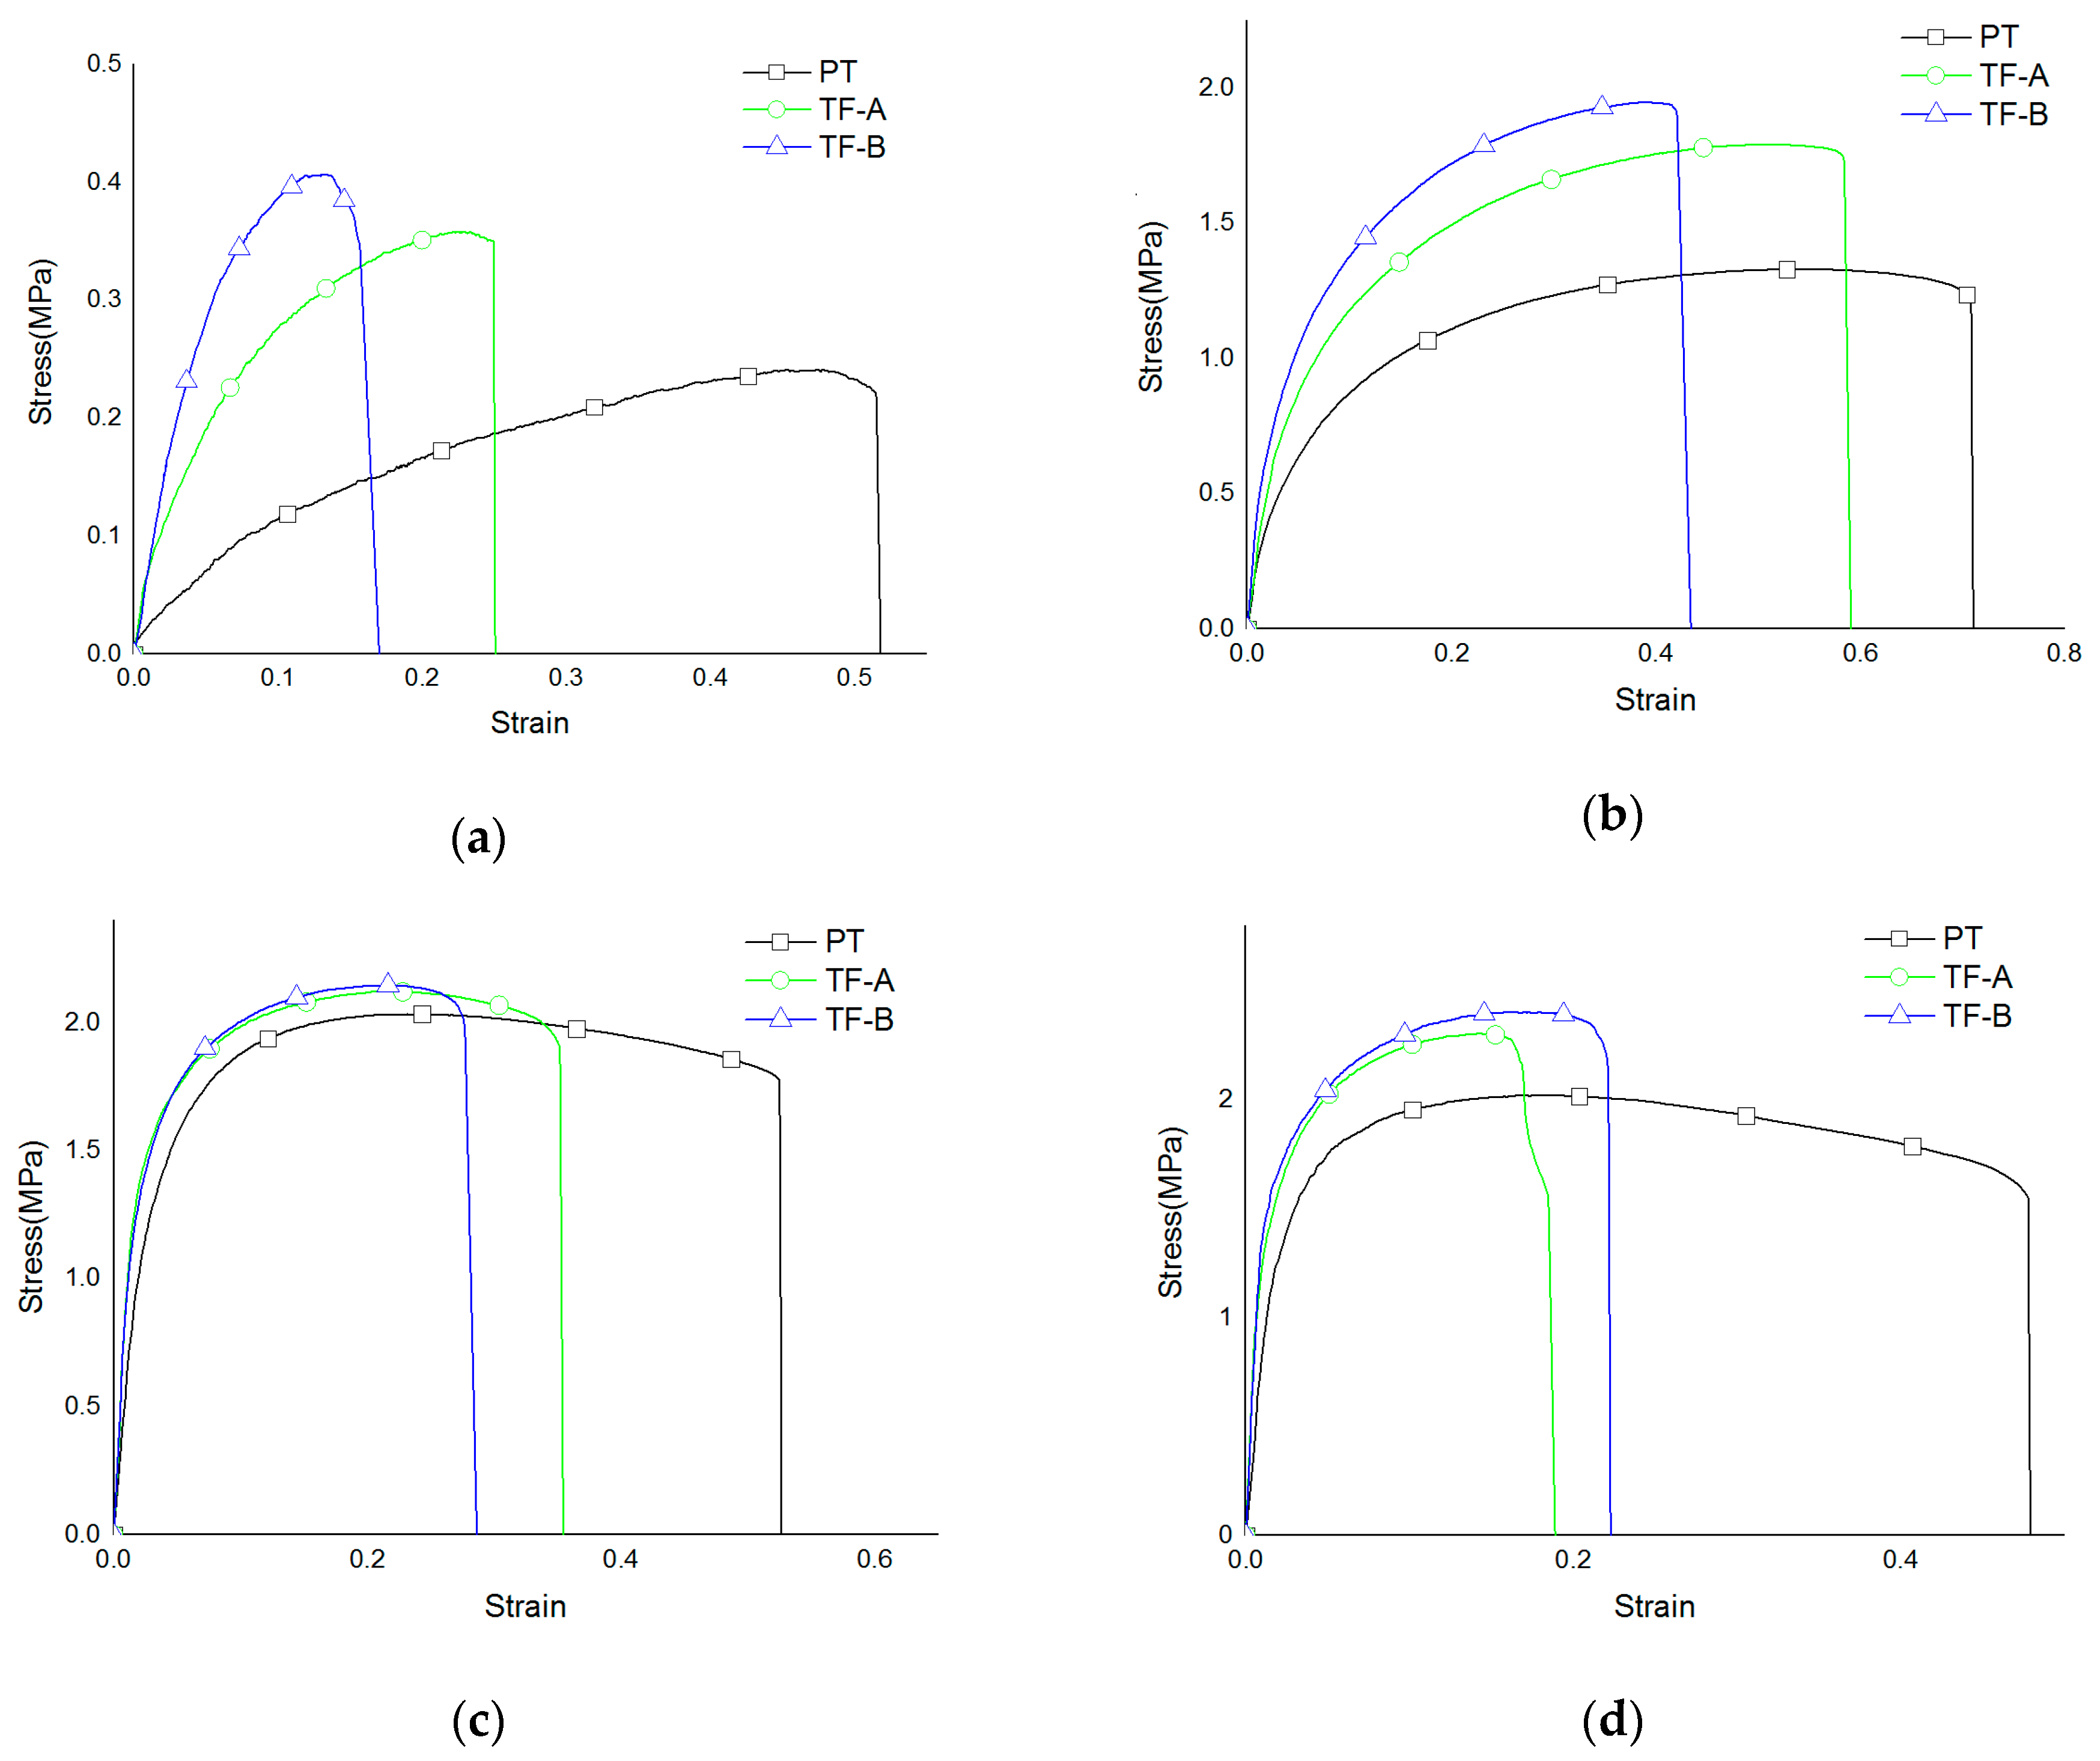
4.1. Stress-Strain Curve
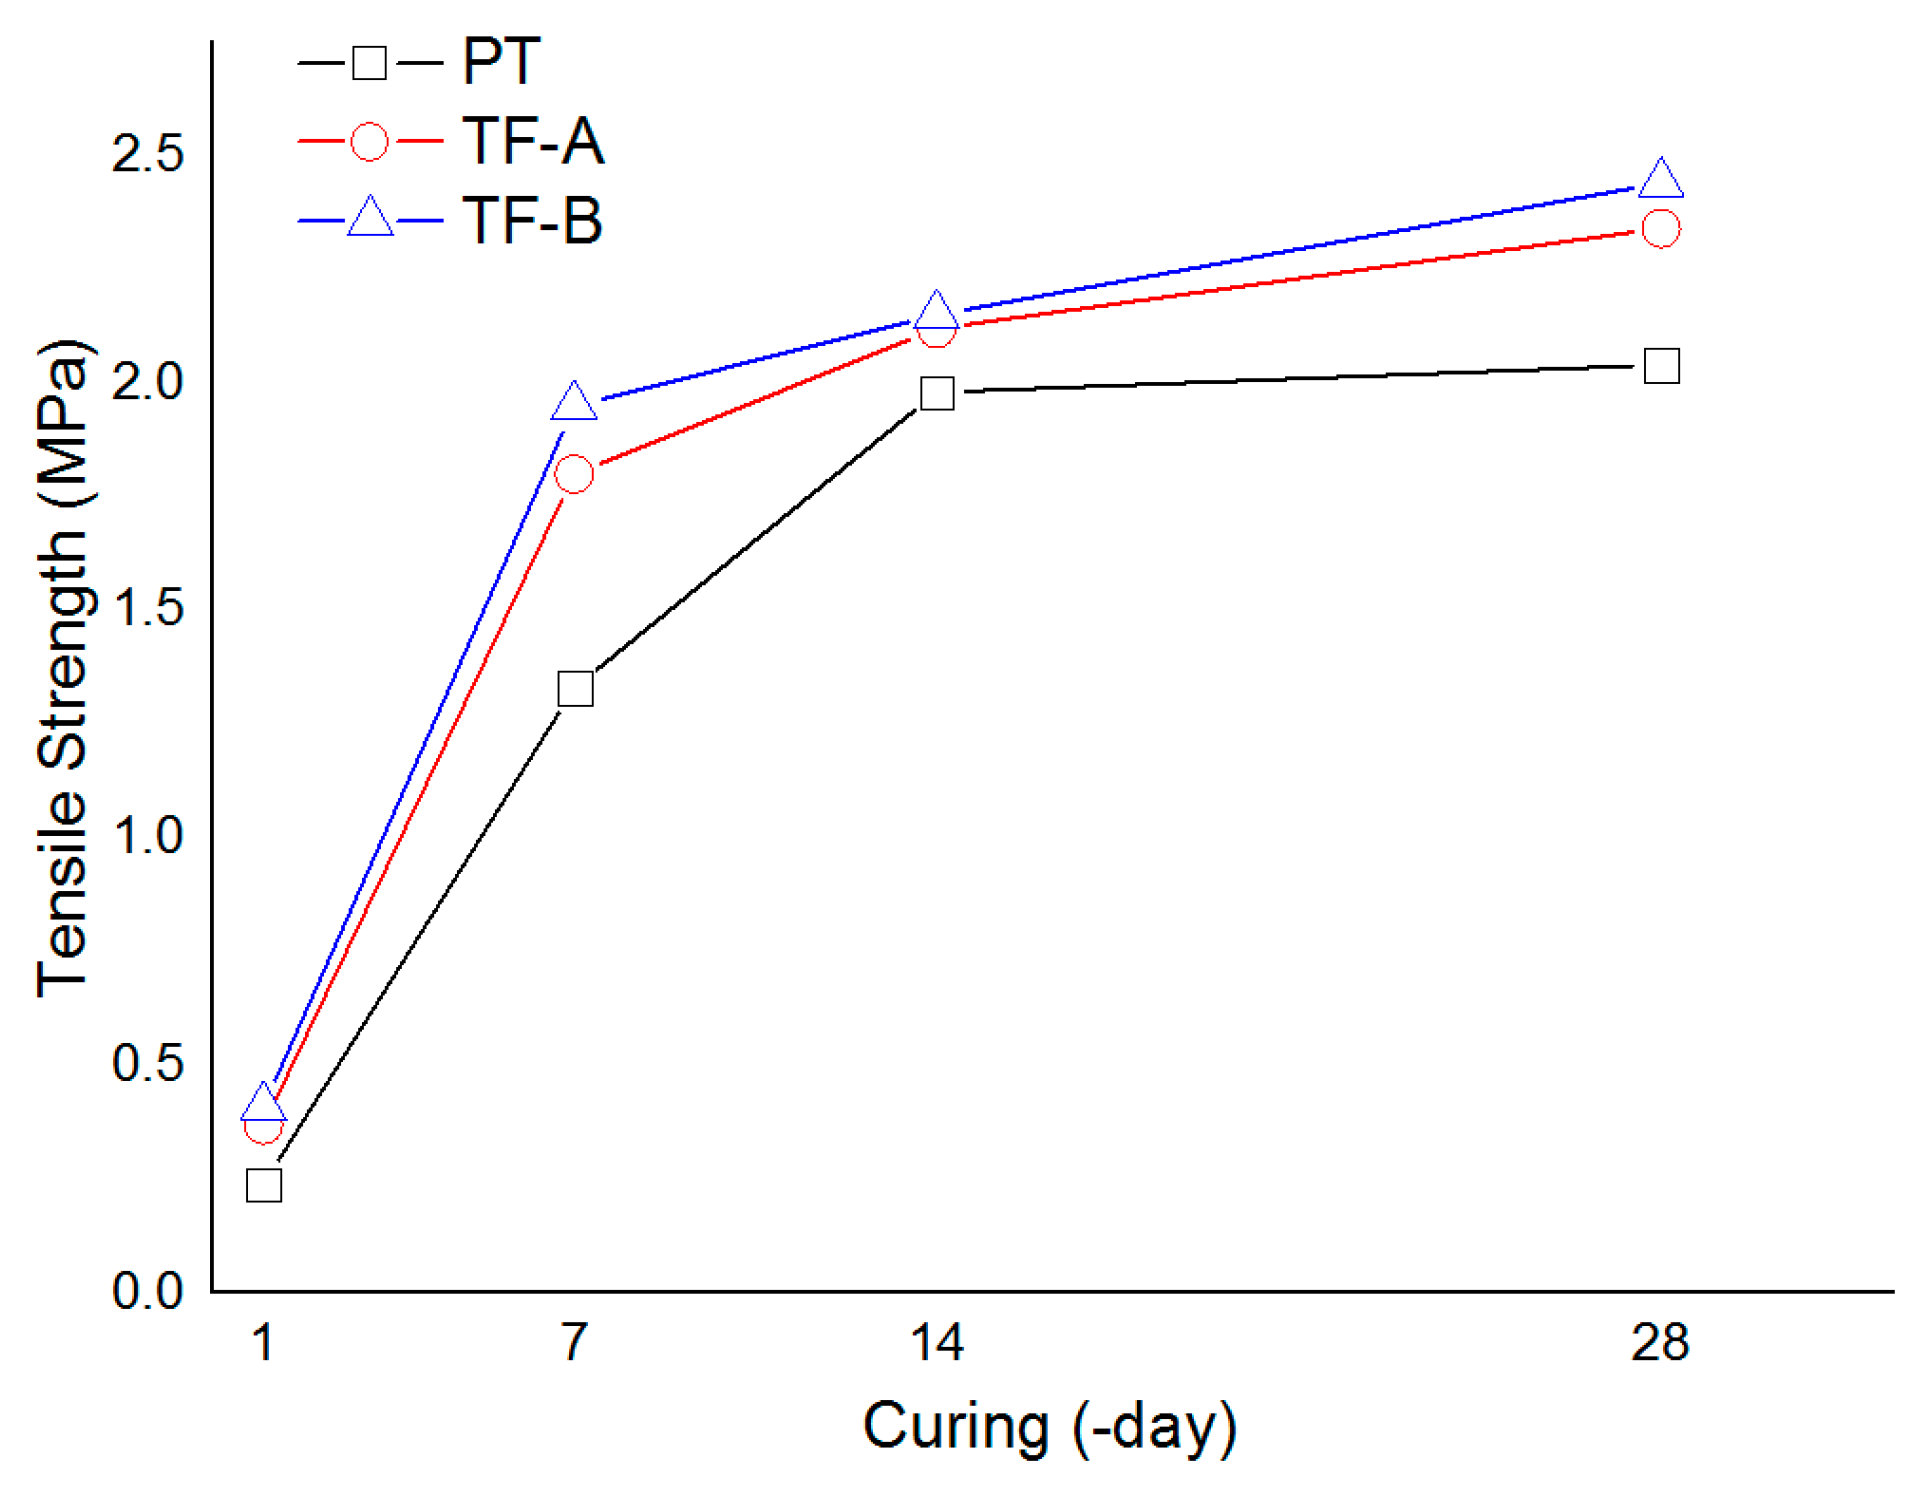
4.2. Tensile Strength
4.3. Elongation
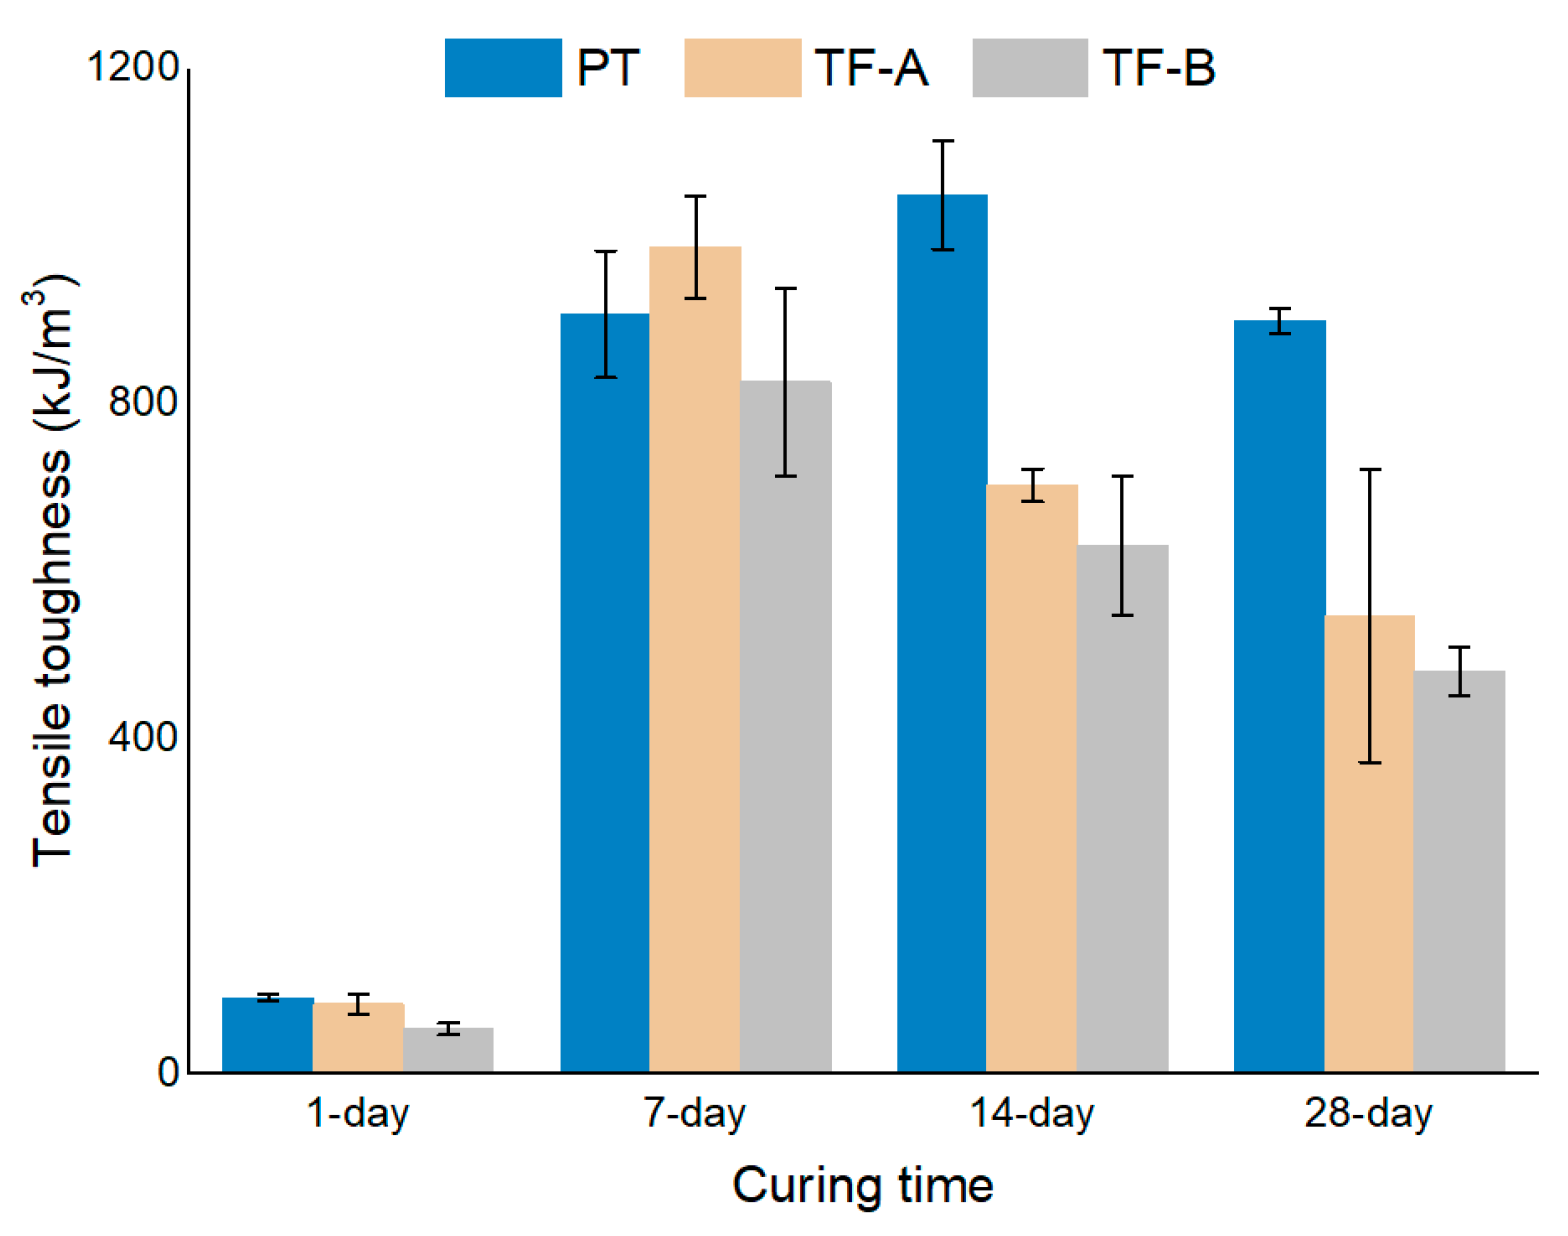
4.4. Tensile Toughness
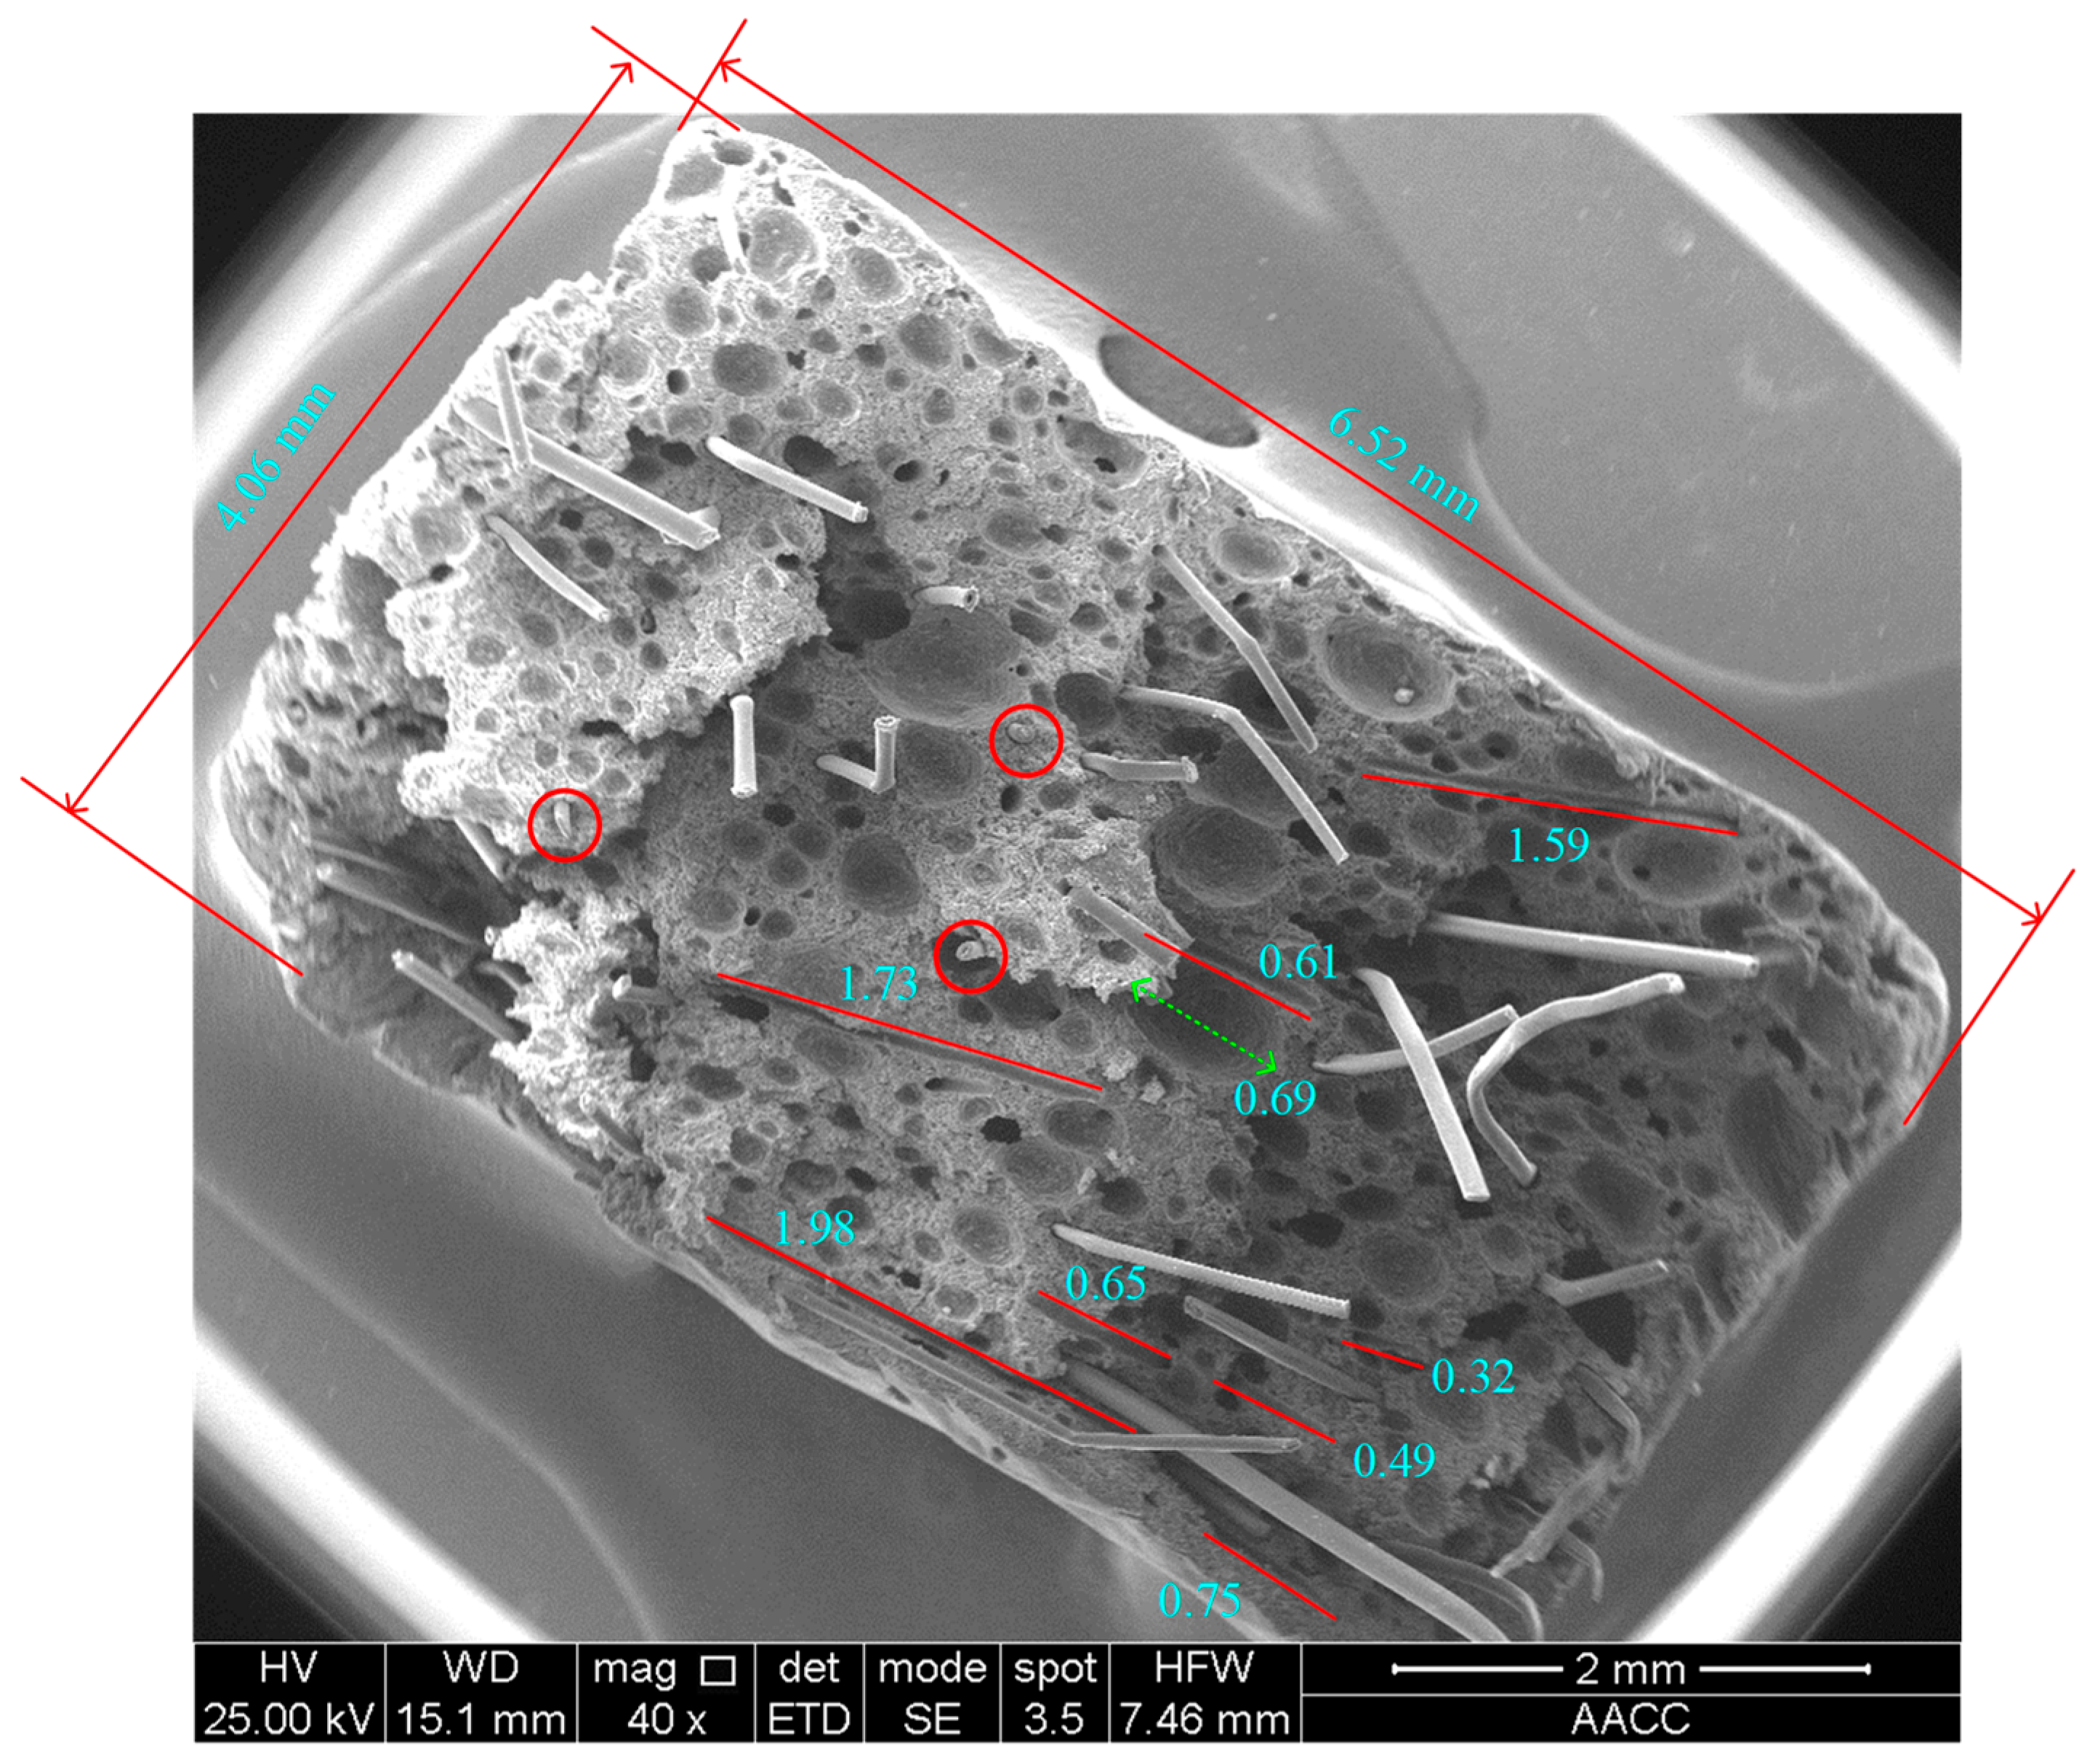
4.5. SEM Analysis and Discussion
5. Conclusions
Author Contributions
Funding
Acknowledgments
Conflicts of Interest
References
- Guner, D.; Ozturk, H. New performance criterion for thin spray-on liners tensile toughness. In Proceedings of the 50th US Rock Mechanics/Geomechanics Symposium, American Rock Mechanics Association, Houston, TX, USA, 26–29 June 2016. [Google Scholar]
- Tannant, D.D. Thin spray-on liners for underground rock support. In Proceedings of the 17th International Mining Congress and Exhibition of Turkey (IMCET 2001), Ankara, Turkey, 19–22 June 2001. [Google Scholar]
- Li, Z.; Hussain, F.; Mitra, R.; Saydam, S. Effectiveness of thin spray-on liners as a gas management tool in underground coal mines. Int. J. Coal. Geol. 2016, 168 Pt 2, 193–201. [Google Scholar] [CrossRef]
- Mpunzi, P.; Masethe, R.; Rizwan, M.; Stacey, T.R. Enhancement of the tensile strengths of rock and shotcrete by thin spray-on liners. Tunn. Undergr. Space Technol. 2015, 49, 369–375. [Google Scholar] [CrossRef]
- Jjuuko, S. A review of application and benefits of thin spray-on liners for underground rock support in South African mines. In Proceedings of the 8th South African Young Geotechnical Engineers Conference, Western Cape, South Africa, 17–19 September 2014. [Google Scholar]
- Yilmaz, H. Tensile strength testing of thin spray-on liner products (TSLs) and shotcrete. J. South. Afr. Inst. Min. Metall. 2010, 110, 559–569. [Google Scholar]
- Guner, D.; Ozturk, H. Creep behaviour investigation of a thin spray-on liner. Int. J. Rock Mech. Min. Sci. 2018, 108, 58–66. [Google Scholar] [CrossRef]
- Potvin, Y.; Stacey, T.R.; Hadjigeorgiou, J.; Yilmaz, H. Surface Support in Mining; Australian Centre for Geomechanics: Perth, Australia, 2004. [Google Scholar]
- Shan, Z.; Porter, I.; Nemcik, J.; Baafi, E. Investigating the behaviour of fibre reinforced polymers and steel mesh when supporting coal mine roof strata subject to buckling. Rock Mech. Rock Eng. 2018, 52, 1–13. [Google Scholar] [CrossRef]
- Shan, Z.; Porter, I.; Nemcik, J.; Baafi, E. Comparing the reinforcement capacity of welded steel mesh and a thin spray-on liner using large scale laboratory tests. Int. J. Min. Sci. Technol. 2014, 24, 373–377. [Google Scholar]
- Archibald, J.F.; Dirige, P.A. Development of thin, spray-on liner and composite superliner area supports for damage mitigation in blast- and rockburst-induced rock failure events. WIT Trans. Built Environ. 2006, 87, 237–246. [Google Scholar]
- Ozturk, H. Fracture mechanics interpretation of thin spray-on liner adhesion tests. Int. J. Adhes. Adhes. 2012, 34, 17–23. [Google Scholar] [CrossRef]
- Ozturk, H. Work of adhesion of thin spray-on liners. Rock Mech. Rock Eng. 2012, 45, 1095–1102. [Google Scholar] [CrossRef]
- Tibbs, M.P.; Tyler, O.K.; Van Duin, S.; Baafi, E. Autonomous thin spray-on liner application in irregular tunnel and mine roadway surfaces. In Proceedings of the 30th International Symposium on Automation and Robotics in Construction and Mining, Montreal, QC, Canada, 11–15 August 2013. [Google Scholar]
- Qiao, Q.; Nemcik, J.; Porter, I.; Baafi, E. Laboratory tests on thin spray-on liner penetrated rock joints in direct shear. Rock Mech. Rock. Eng. 2015, 48, 2173–2177. [Google Scholar] [CrossRef]
- Li, Z.; Saydam, S.; Mitra, R.; Chalmers, D. Investigation on adhesion strength of thin spray-on liners in an underground coal mine. In Proceedings of the 15th Coal Operators’ Conference, University of Wollongong, The Australasian Institute of Mining and Metallurgy, Mine Managers Association of Australia, University of Wollongong, NSW, Australia, 11–13 January 2015. [Google Scholar]
- Ferreira, P.H.; Piroddi, A. The application of GRP and thin spray liner support products in a typical block cave mining method to enhance safety and productivity. In Proceedings of the 6th Southern African Base Metals Conference 2011, Phalaborwa, South Africa, 18–20 July 2011. [Google Scholar]
- Komurlu, E.; Kesimal, A. Usability of thin spray-on liners (TSL) for akarsen underground mine in Murgul. In Proceedings of the 25th International Mining Congress and Exhibition of Turkey, Antalya, Turkey, 11–14 April 2017. [Google Scholar]
- Jeon, J.K.; Kim, W.; Kim, G.Y.; Jeon, C.K. Polyamide fiber reinforced shotcrete for tunnel application. Materials 2016, 9, 163. [Google Scholar] [CrossRef] [PubMed]
- Cheng, W.; Liu, G.; Chen, L. Pet fiber reinforced wet-mix shotcrete with walnut shell as replaced aggregate. Appl. Sci. 2017, 7, 345. [Google Scholar] [CrossRef]
- Yin, S.; Tuladhar, R.; Shi, F.; Combe, M.; Collister, T.; Sivakugan, N. Use of macro plastic fibres in concrete: A review. Constr. Build. Mater. 2015, 93, 180–188. [Google Scholar] [CrossRef]
- Liu, J.; Chen, Z.; Song, Z.; Bai, Y.; Qian, W.; Wei, J.; Kanungo, D.P. Tensile behavior of polyurethane organic polymer and polypropylene fiber-reinforced sand. Polymers 2018, 10, 499. [Google Scholar] [CrossRef] [PubMed]
- Qiao, Q.; Nemcik, J.; Porter, I.; Baafi, E. Compressive strength testing of Toughskin thin spray-on liner. In Proceedings of the 15th Coal Operators’ Conference, University of Wollongong, The Australasian Institute of Mining and Metallurgy, Mine Managers Association of Australia, University of Wollongong, NSW, Australia, 11–13 January 2015; pp. 198–203. [Google Scholar]
- Qiao, Q.; Nemcik, J.; Porter, I. Shear strength testing of glass fibre reinforced thin spray-on liner. Géotech. Lett. 2014, 4, 250–254. [Google Scholar] [CrossRef]
- Guner, D.; Ozturk, H. Experimental and numerical analysis of the effects of curing time on tensile mechanical properties of thin spray-on liners. Rock Mech. Rock Eng. 2016, 49, 3205–3222. [Google Scholar] [CrossRef]
- Guner, D.; Ozturk, H. Tensile-creep test specimen preparation practices of surface support liners. IOP Conf. Ser. Earth Environ. Sci. 2017, 95, 42004. [Google Scholar] [CrossRef]
- EFNARC. Specification and Guidelines on Thin Spray-on Liners for Mining and Tunnelling; ENC 250TSL v7.2 25–07–08; EFNARC, 2008. [Google Scholar]
- Choi, H.; Choi, H.; Lee, B.; Lee, D. Shrinkage and durability evaluation of environmental load-reducing FRPCM by using silicone oil. Materials 2019, 12, 1240. [Google Scholar] [CrossRef] [PubMed]


| Diameter (μm) | Average Length (mm) | Tensile Strength (MPa) |
|---|---|---|
| 18–80 | 3 | >458 |
| Group | 1-Day | 7-Day | 14-Day | 28-Day |
|---|---|---|---|---|
| PT | 0.24 ± 0.008 | 1.33 ± 0.155 | 1.98 ± 0.030 | 2.04 ± 0.026 |
| TF-A | 0.37 ± 0.018 | 1.80 ± 0.110 | 2.12 ± 0.033 | 2.34 ± 0.049 |
| TF-B | 0.41 ± 0.028 | 1.95 ± 0.066 | 2.15 ± 0.091 | 2.44 ± 0.077 |
© 2019 by the authors. Licensee MDPI, Basel, Switzerland. This article is an open access article distributed under the terms and conditions of the Creative Commons Attribution (CC BY) license (http://creativecommons.org/licenses/by/4.0/).
Share and Cite
Wei, Q.; Zhang, N.; Feng, X.; Xie, Z.; Wu, J.; Cao, J. Influence of Polypropylene Fiber on Tensile Property of a Cement-Polymer Based Thin Spray-On Liner. Appl. Sci. 2019, 9, 2876. https://doi.org/10.3390/app9142876
Wei Q, Zhang N, Feng X, Xie Z, Wu J, Cao J. Influence of Polypropylene Fiber on Tensile Property of a Cement-Polymer Based Thin Spray-On Liner. Applied Sciences. 2019; 9(14):2876. https://doi.org/10.3390/app9142876
Chicago/Turabian StyleWei, Qun, Nong Zhang, Xiaowei Feng, Zhengzheng Xie, Jiansheng Wu, and Juncai Cao. 2019. "Influence of Polypropylene Fiber on Tensile Property of a Cement-Polymer Based Thin Spray-On Liner" Applied Sciences 9, no. 14: 2876. https://doi.org/10.3390/app9142876
APA StyleWei, Q., Zhang, N., Feng, X., Xie, Z., Wu, J., & Cao, J. (2019). Influence of Polypropylene Fiber on Tensile Property of a Cement-Polymer Based Thin Spray-On Liner. Applied Sciences, 9(14), 2876. https://doi.org/10.3390/app9142876